Create a New Monitor
This guide will walk you through the steps of creating a monitor in Sumo Logic, from setting up trigger conditions to configuring advanced settings, notifications, and playbooks.
Our alerts use machine learning to analyze historical data, establish baselines, detect significant deviations, and filter out irrelevant alerts to reduce alert fatigue and help teams focus on critical issues. These capabilities apply to both logs and metrics, providing a comprehensive monitoring solution. With seasonality detection and customizable anomaly clustering, false positives are minimized, enabling faster issue resolution.
Integrated playbooks automate incident response by gathering diagnostics, notifying teams, triggering recovery actions, and streamlining workflows to improve response times. You can link playbooks to monitors to automate tasks such as restarting services or scaling infrastructure, ensuring swift and efficient anomaly resolution.
Open the New Monitor window
There are several ways to create a new monitor, depending on where you are in Sumo Logic.
From Monitors
- Classic UI. In the main Sumo Logic menu, select Manage Data > Monitoring > Monitors.
New UI. In the main Sumo Logic menu, select Alerts > Monitors. You can also click the Go To... menu at the top of the screen and select Monitors. - Click Add > New Monitor, and the New Monitor dialog box will appear.
From Metrics Explorer
Creating a monitor based on the threshold values defined in the Metrics page can save time and effort. By using the pre-filled monitor editor, you can quickly create a monitor with the same threshold values as defined in the Metrics page. This will ensure that the monitor is using the same criteria as the Metrics page, providing consistency in monitoring.
To create a monitor from the Metrics Explorer, follow the steps below:
- Open the Metrics Explorer:
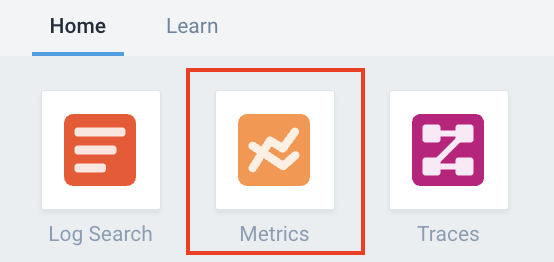
- Classic UI. From Sumo Logic home, click Metrics.
- New UI. Click the Go To... menu at the top of the screen and select Metrics Search.
- Classic UI. From Sumo Logic home, click Metrics.
- On the Metrics Explorer page:
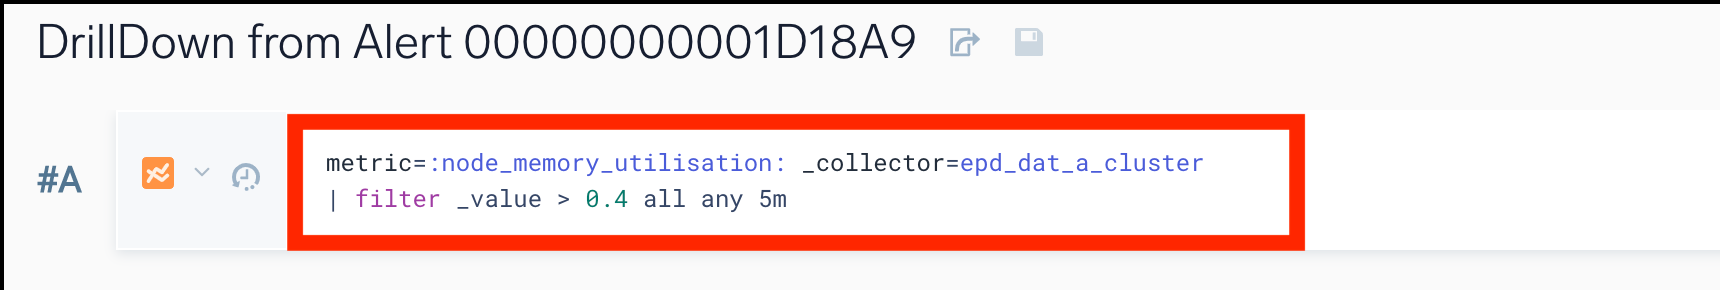
- Enter a metrics query.
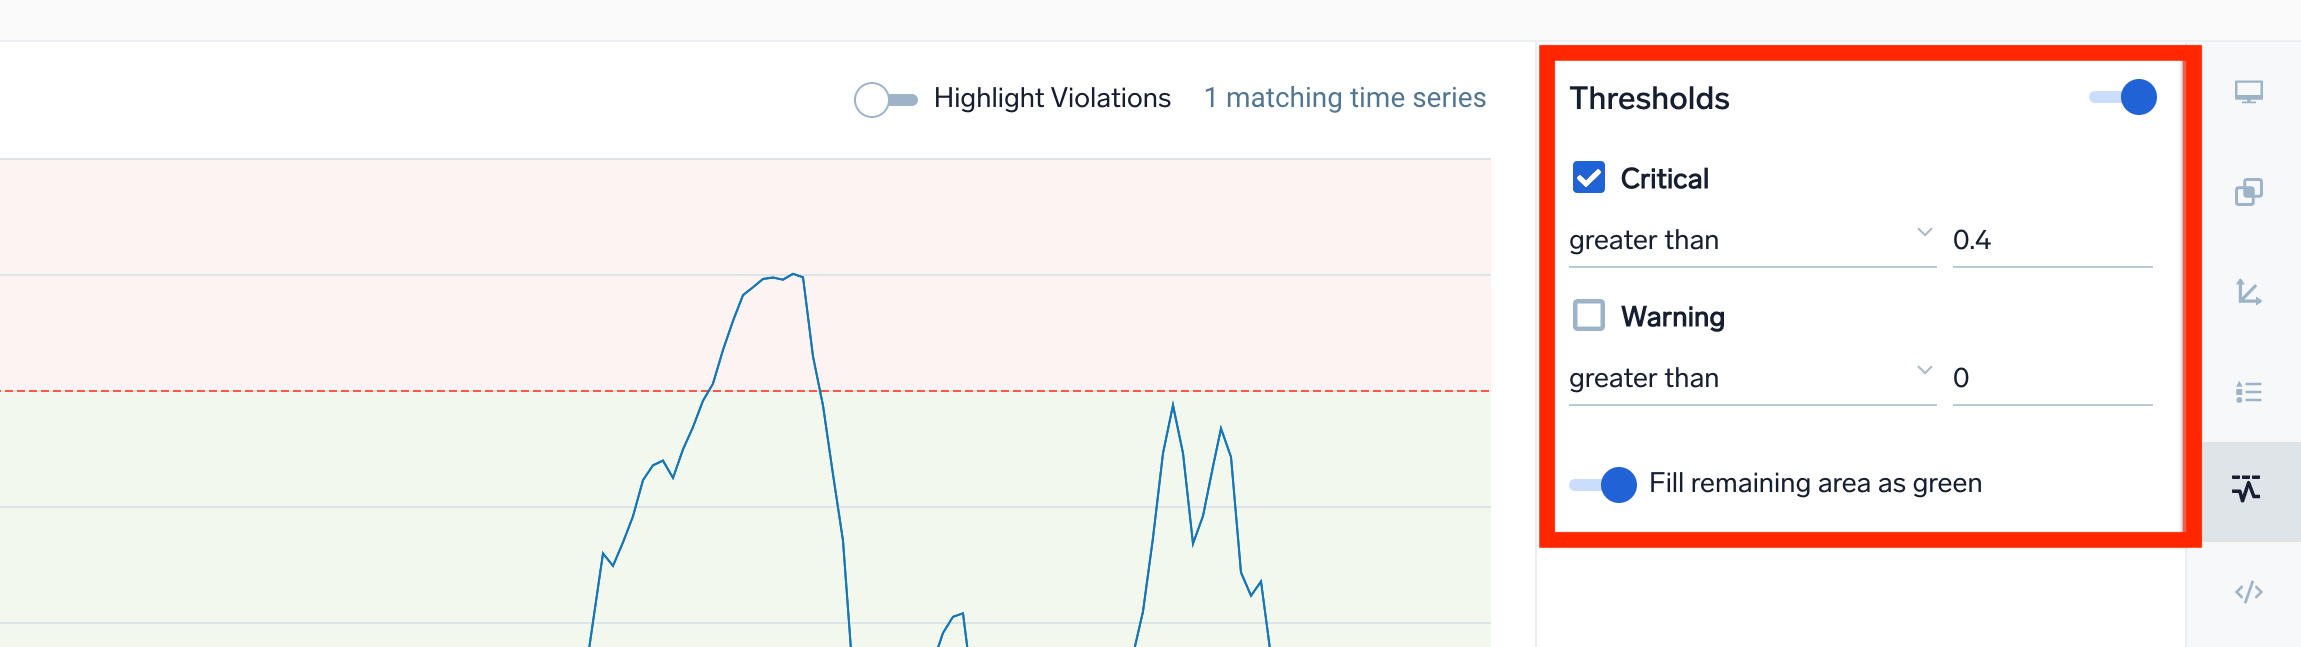
- In the Thresholds section, define the critical and warning thresholds for your metrics query.
- Enter a metrics query.
- Click the three-dot kebab icon button at the end of the query field and select Create a Monitor.
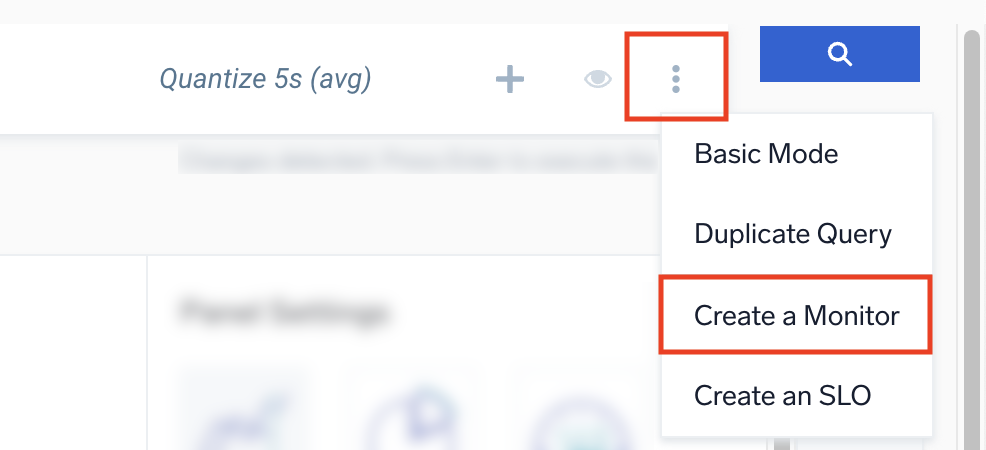
- The New Monitor will open with prefilled data based on the threshold values you set in the previous steps.
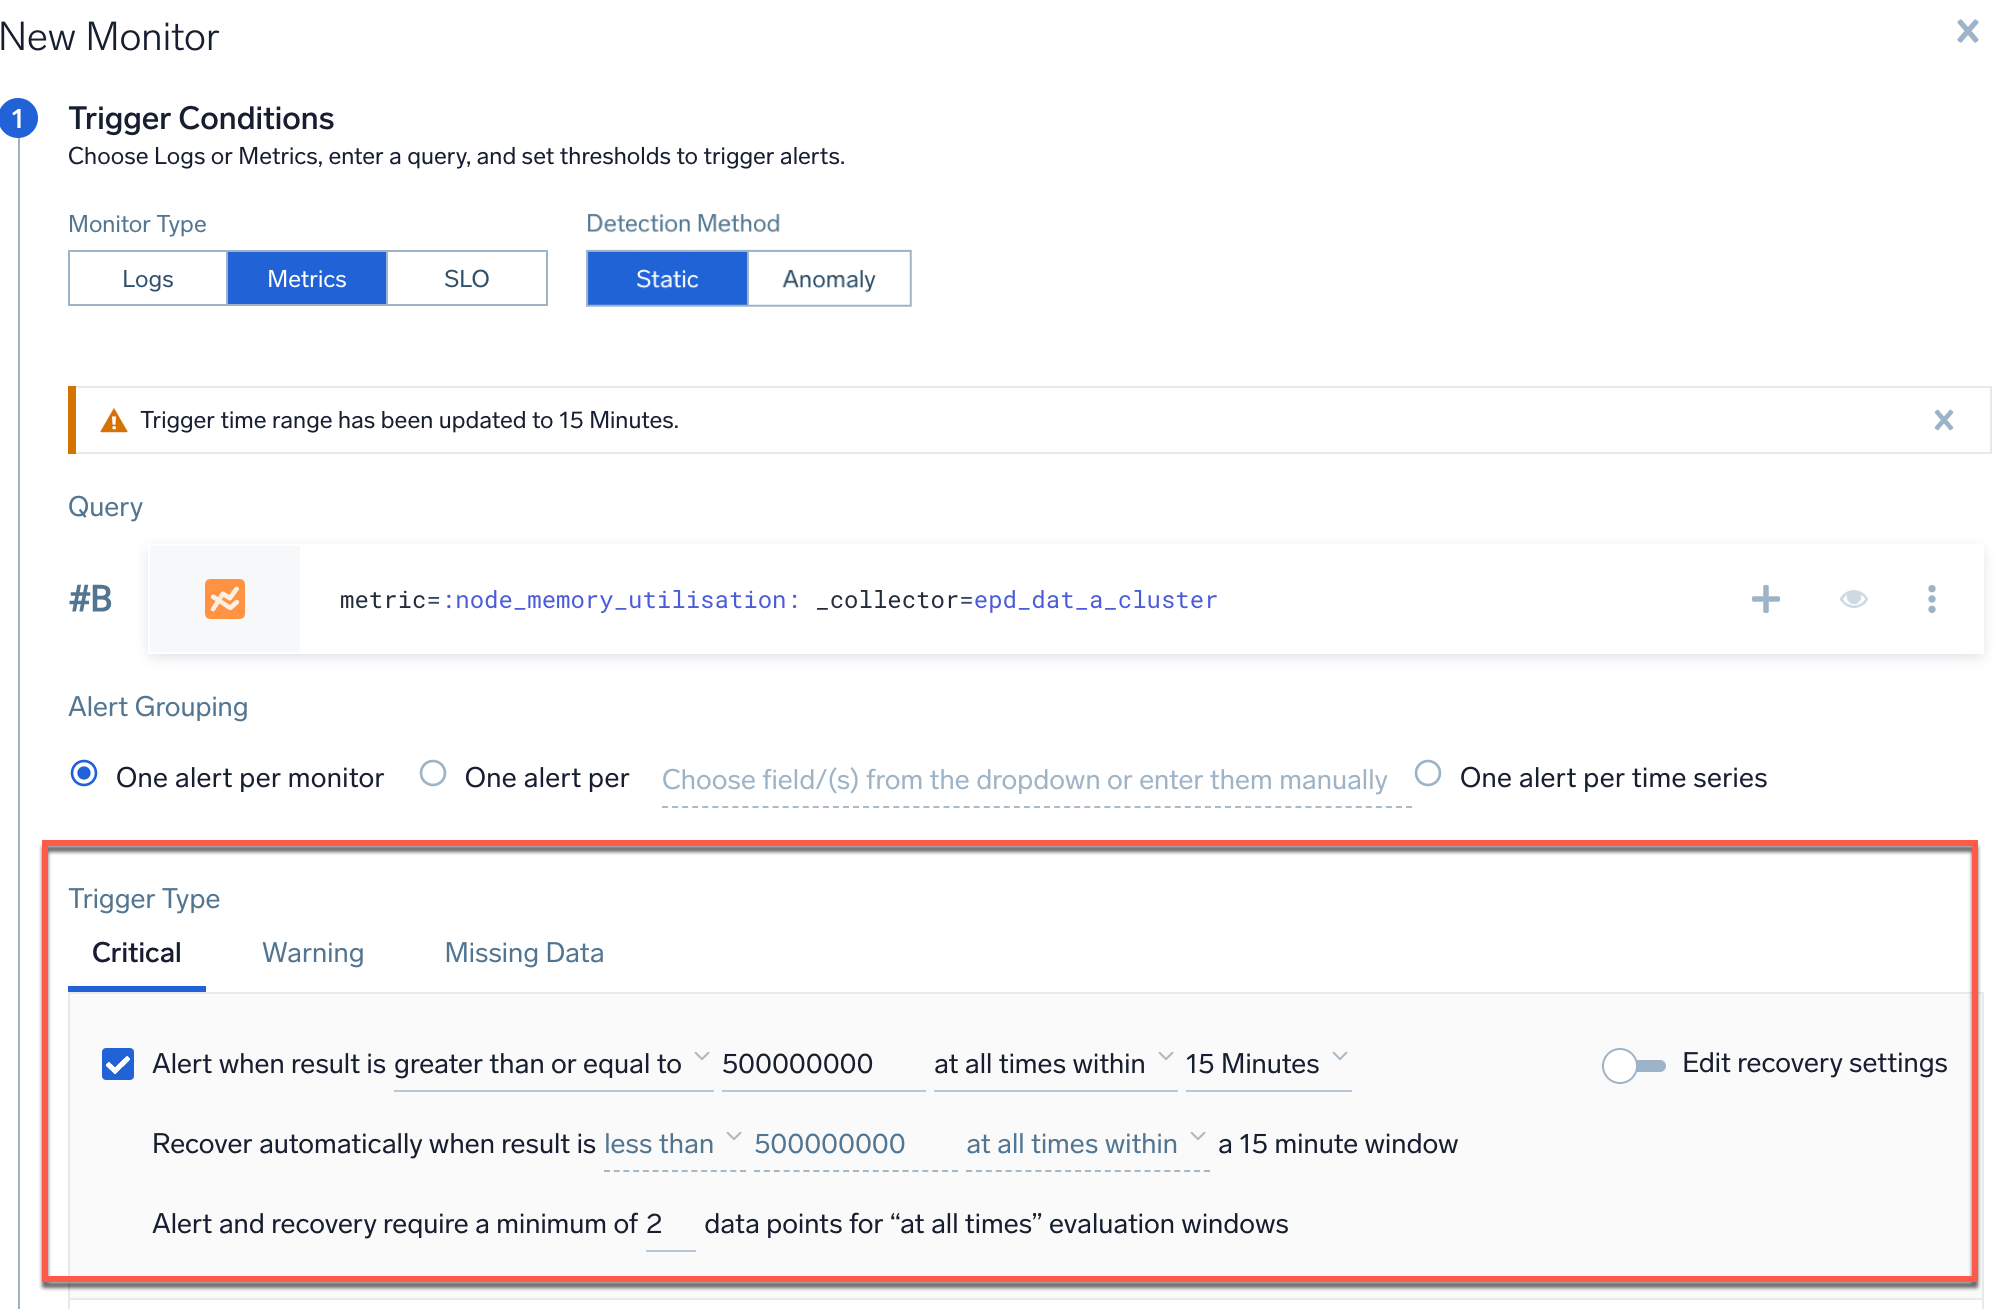
- In the Trigger Type section, enable the checkbox that corresponds to the threshold value that you want to use (Critical and/or Warning).
- The threshold values will be the same as defined in the Metrics page for both Critical and Warning thresholds.
- Set all other parameters to default, including the window (15 minutes) and the at all times box.
- Ensure that the Recover value is set to the default, which is the opposite of the Alert value. The Edit Recovery button should be off.
- Once all values have been set, click Save to create the monitor.
- The same threshold will also be applied to the histogram chart.
The same threshold translating functionality supports opening the Alerts Response Page in the Metrics Explorer and opening a monitor in the Metrics Explorer.
When you create a monitor and open the metrics search query in the Metrics Explorer, the signal gets a new value for the quantize operator based on the time range of the query. The default value for the quantize operator is 1m. Because opening the query in Metrics Explorer may not match because of quantization differences, you may need to adjust the query to return the results you expect, especially when creating a monitor that uses the anomaly detection method.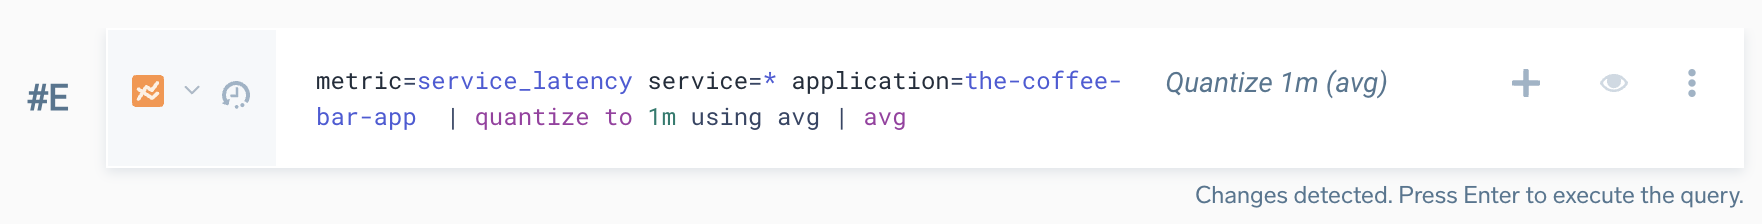
Step 1. Set trigger conditions
The first step when creating a new monitor is setting the Trigger Conditions, a thresholds value that must met to trigger an alert. Applicable values include Critical, Warning, and Missing Data. These values are set when you create a monitor and can be based on a variety of metrics such as CPU usage, network latency, application response time.
Monitor Type
Select a Monitor Type, which will create alerts based on Logs, Metrics, or an SLO.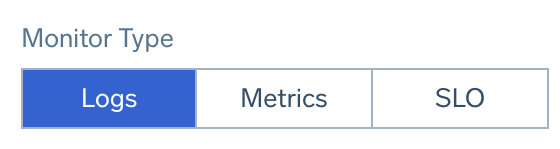
Detection Method
Next, select a Detection Method (not applicable to SLO monitors).
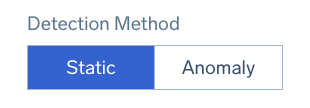
Static
Set specific threshold conditions for well-defined KPIs with constant thresholds (for example, infrastructure metrics like CPU utilization and memory).
Anomaly
Leverage machine learning to identify unusual behavior and suspicious patterns by establishing baselines for normal activity. This alerting system uses historical data to minimize false positives and alerts you to deviations.
- Model-driven detection. Machine learning models create accurate baselines, eliminating guesswork and noise.
- AutoML. The system self-tunes with seasonality detection, minimizing user intervention and adjusting for recurring patterns to reduce false positives.
- User-defined sensitivity. Users set alert sensitivity and thresholds, providing context to filter out noise.
- One-click playbook assignment. Monitors automatically link to Sumo Logic Automation Service playbooks, expediting incident response.
- Auto-diagnosis and recovery. The Automation Service handles diagnosis and resolution, closing the loop from alert to recovery.
- Customizable detection. Use advanced rules like "Cluster anomalies" to detect multiple data points exceeding thresholds within a set timeframe.
Watch this micro lesson to learn about anomaly monitors.
Use Outlier
If you want to trigger alerts on outlier direction rather than anomaly detection, select Anomaly and enable Use Outlier. This detects unusual changes or spikes in a time series of a key indicator. Use this detection method when you are alerting on KPIs that don't have well-defined constant thresholds for what's good and bad. You want the monitor to automatically detect and alert on unusual changes or spikes on the alerting query. For example, application KPIs like page request, throughput, and latency. 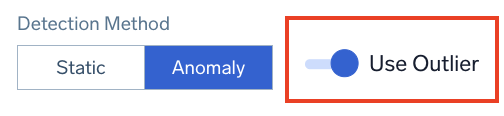
Anomaly or Outlier Direction
If you choose an anomaly or outlier detection method, you'll need to select the Anomaly Direction or Outlier Direction you want to track (not applicable to static detection method).
- Up. Get alerted if there is an abnormal increase in the tracked key indicator.
- Down. Get alerted if there is an abnormal decrease in the tracked key indicator.
- Both. Get alerted if there is any abnormality in the data whether an increase or a decrease.
Query
For guidance on optimizing scan costs when using Flex Pricing, refer to the FAQ on optimizing scan costs for monitors.
In this step, you'll need to provide a logs or metrics query. This is not applicable to SLO monitors.
Logs
Logs monitors can have one query up to 15,000 characters long.
Metrics
Metrics monitors can have up to 6 queries. If you're providing multiple metrics queries, use the letter labels to reference a query row. The monitor will automatically detect the query that triggers your alert, and will mark that row with a notification bell icon. See Join metrics queries for details.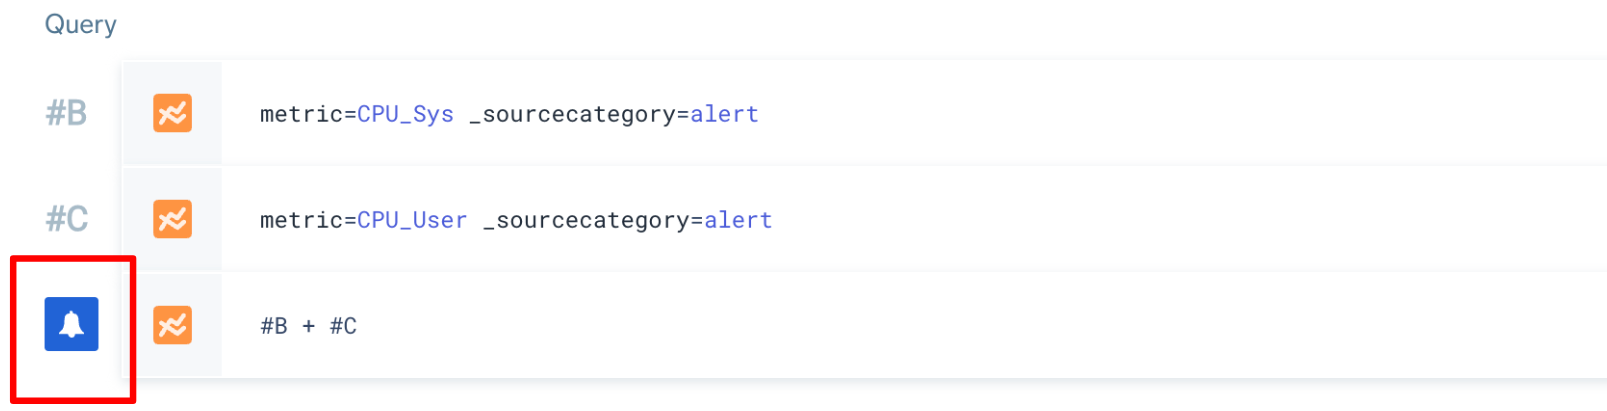
Trigger Type (Logs)
You can set a logs monitor trigger to alert based on the following:
- A returned row count (default), which is the number of rows returned from the log search.
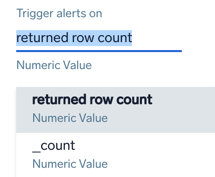
- A numeric field returned from the search. You can pick any numeric field from your query, and alert on the value of that field. The field is
_countin the above screenshot. To convert a string to a number use thenumoperator. For example, if you have a field named duration, you would use thenumoperator as follows to convert it to a number value.| num(duration)
Triggers are evaluated by balancing the requirement of timely alert notifications while ensuring that monitor data is indeed available to evaluate trigger conditions.
- For static logs monitors, you can control trigger monitor evaluation frequency using the options below. If
Alert when result is <greater/less> than <_> within <X>. Evaluate trigger every <Y>.:When detection window (X) is Evaluate trigger every (Y) 5m 1m, 2m 10m 1m, 2m, 5m 15m 1m, 2m, 5m, 10m 30m 2m, 5m, 10m, 20m 1h 2m, 5m, 10m, 20m 3h 10m, 20m, 40m, 1h 6h 10m, 20m, 40m, 1h 12h 20m, 40m, 1h 24h 20m, 40m, 1h - For anomaly logs monitors, triggers are evaluated every
timesliceas specified in the monitor query. For example, the below query is evaluated every 2 minutes._sourceCategory=Labs/Apache/Access
| timeslice 2m
| parse "HTTP/1.1\" * " as status_code
| if (status_code = "200", 1, 0) as successes
| if (status_code = "404", 1, 0) as fails
| sum(successes) as success_cnt, sum(fails) as fail_cnt by _timeslice
| (fail_cnt/(success_cnt+fail_cnt)) * 100 as failure_rate_pct - For outlier logs monitors, triggers are evaluated every 5 minutes.
When configuring monitor trigger conditions, you can set a resolution window to resolve alerts quickly once the underlying issue is fixed. The resolution window specifies how long a monitor will wait before resolving an alert after the issue is corrected.
For example, if your monitor evaluates the last 1 hour, you can set a resolution window of 15 minutes. Once the resolution window is continuously satisfied for 15 minutes, the alert will resolve automatically.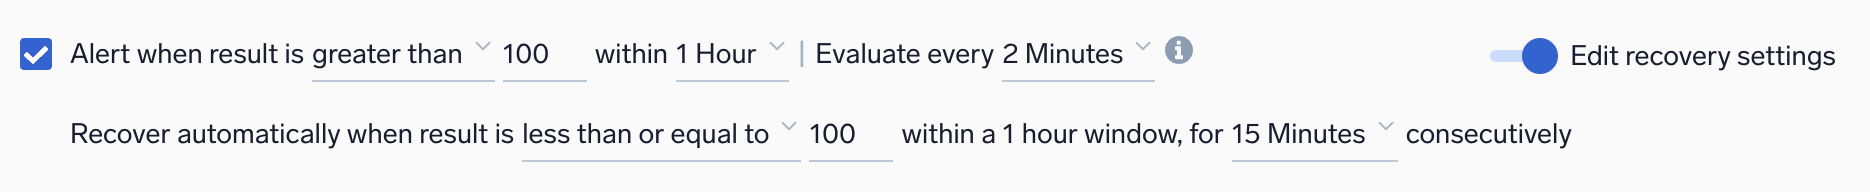
Static detection method
Example: Logs - Static - Critical and Warning
Alert when result is <threshold type> <threshold> within <time range - trigger>. Evaluate every <trigger - frequency>.
| Parameter | Description |
|---|---|
<threshold type> | How you want the value compared. Select greater than, greater than or equal, less than or equal, or less than. |
<threshold> | The value against which the trigger will be evaluated. You can specify any valid numeric value up to 1,000. |
<time range - trigger> | The duration of time to evaluate. Values range from 2 Minutes to 24 Hours (or 7 Days, by request only). |
<trigger - frequency> | The frequency that the trigger is evaluated. |
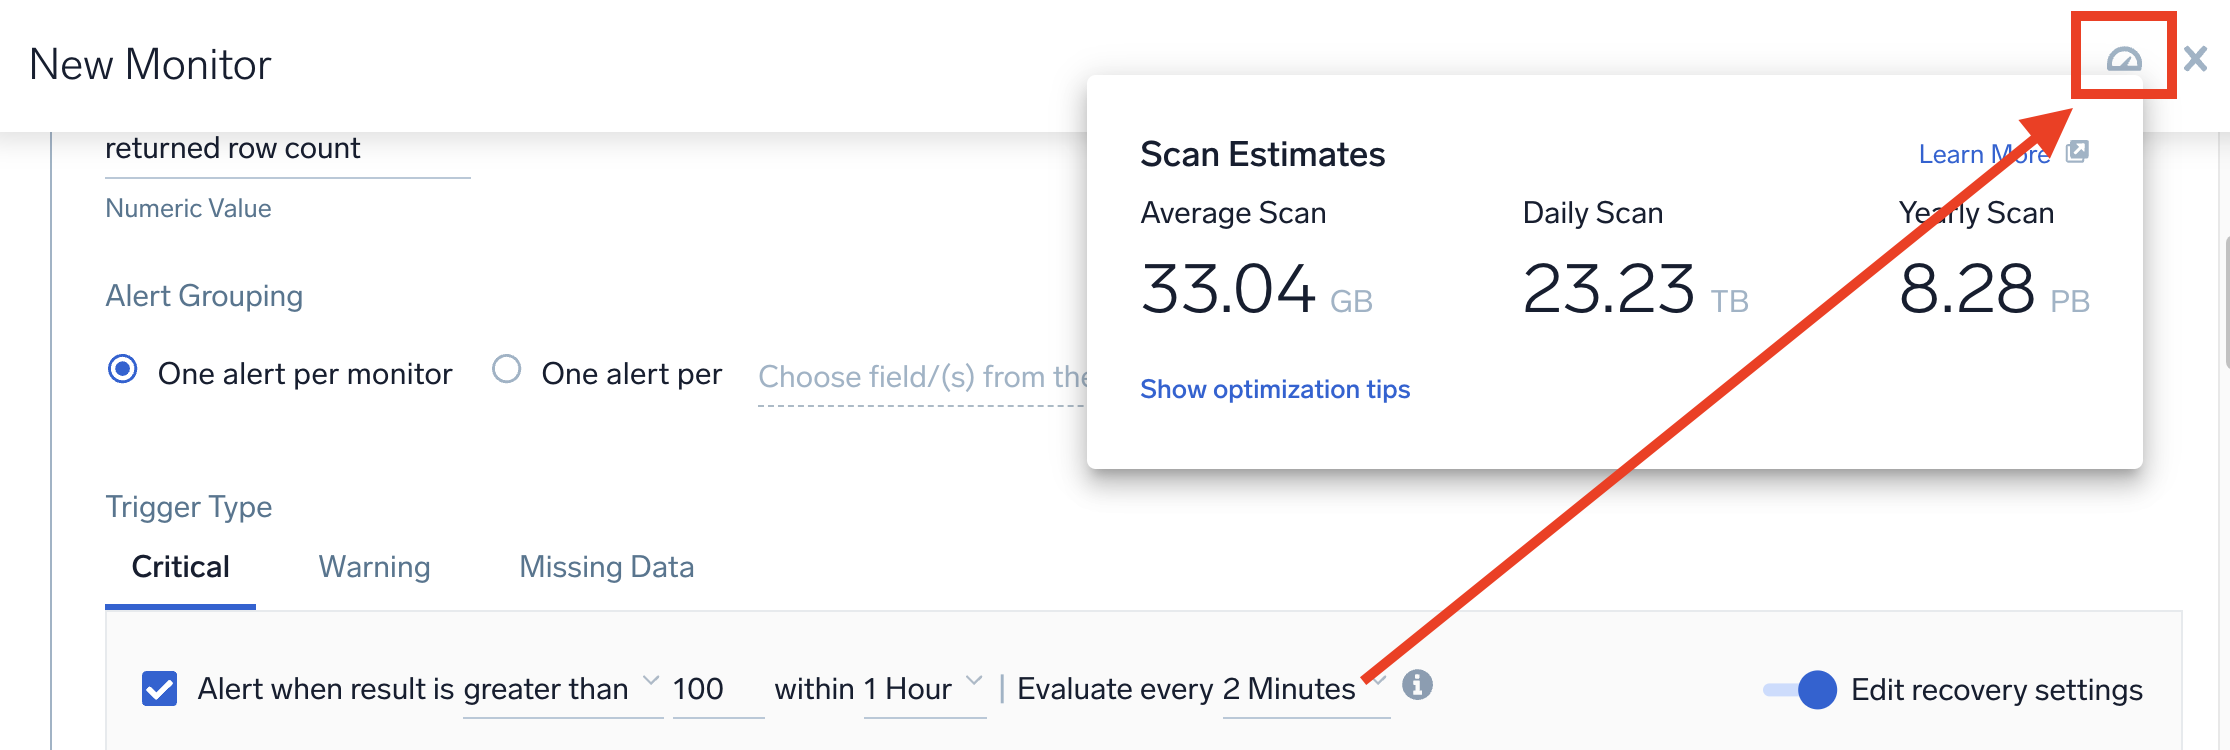
After setting the frequency evaluation, you can preview your estimated scan data by clicking the Show Estimated Scan icon, as seen below.
The recovery condition is set by default to the opposite of the alert condition. If you need to change these settings, switch on the Edit recovery settings toggle and then adjust values for the recovery settings accordingly.
For example, if an alert is set to greater than 10, the recovery would be set to less than or equal to 10 when inferred. Sumo Logic automatically resolves the incident when the resolution condition is satisfied.
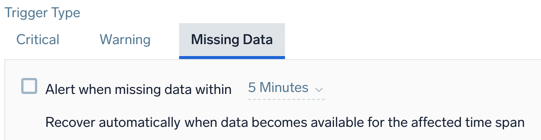
Example: Logs - Static - Missing Data
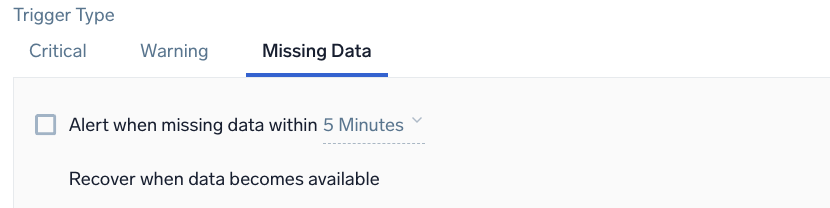
Alert when missing data within <time range - trigger>. Evaluate every <trigger - frequency>.
| Parameter | Description |
|---|---|
<time range - trigger> | The duration of time to evaluate (values range from 5 minutes to 24 hours). |
<trigger - frequency> | The frequency that the trigger is evaluated. |
For recovery, Sumo Logic will automatically resolve the incident when the resolution condition is satisfied.
Anomaly detection method
Example: Logs - Anomaly - Critical
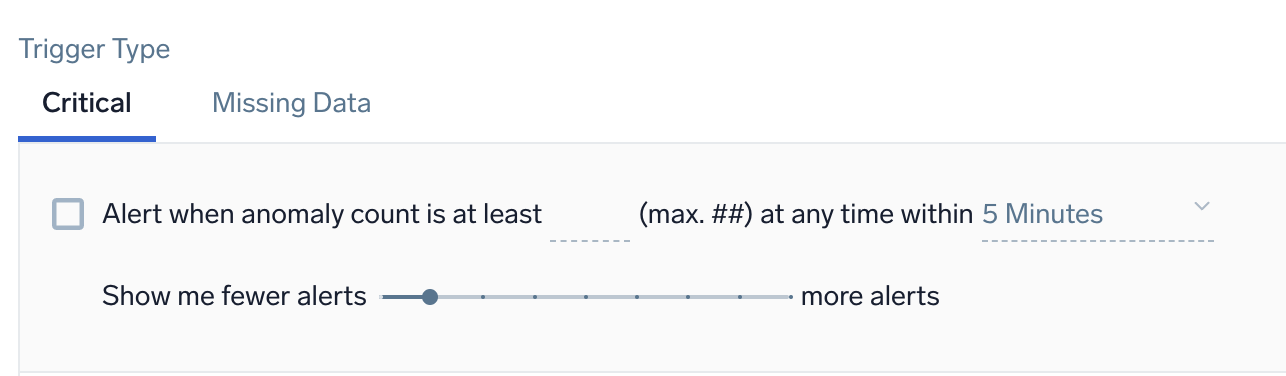
Alert when anomaly count is at least <count> (max. 1) at any time within <time range>
| Parameter | Description |
|---|---|
<count> | Enter the minimum number of anomalies to detect during the detection window before triggering an alert. Ensure that the time period window is 5-10 times longer than the timeslice used in the log query. This setting helps you add context to anomaly detection. For example, if you know a particular signal is noisy, you may want to wait for a number of anomalous data points in the detection window before triggering an alert. If the time period is set to 5 minutes, and the minimum anomaly count is set to 1, then an alert is triggered if 1 anomaly appears within a 5-minute time period. |
<time range> | The duration of time to watch for anomalies (values range from 5 minutes to 24 hours). |
Tune the number of anomalous data points detected per day compared to the predicted baseline for the detection window. Select more alerts if you do not want to miss out on most anomalies.
Outlier detection method
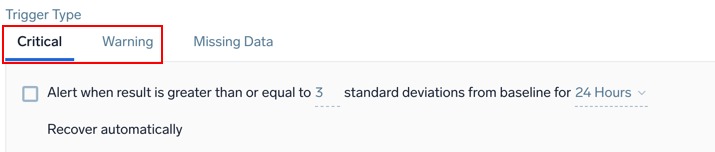
Example: Logs - Outlier - Critical and Warning
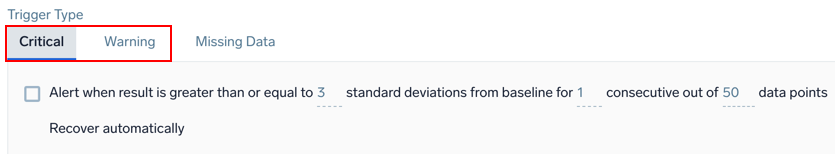
Alert when result is greater than or equal to <threshold> standard deviations from baseline for <consecutive> consecutive out of <window> data points
| Parameter | Description |
|---|---|
<threshold> | The number of standard deviations for calculating violations. The default is 3. |
<consecutive> | The required number of consecutive indicator data points (outliers) to trigger a violation. |
<window> | The number of data points used to calculate the baseline for outlier detection. |
The recovery condition will always be the opposite of the alerting condition. For example, if there is no outlier identified for the duration of the detection window from the time the alert was first fired, then the monitor will be brought back to the normal state. You cannot customize the resolution condition for the monitor.
Example: Logs - Outlier - Missing Data
Alert when missing data within <time range>
| Parameter | Description |
|---|---|
<time range> | The time span of data to evaluate (values range from 5 minutes to 24 hours). |
For recovery, Sumo Logic will automatically resolve the incident when the resolution condition is satisfied.
Trigger Type (Metrics)
For Metrics monitors, you can choose to recover based on a single data point below the threshold, or all data points below the threshold.
When configuring monitor trigger conditions, you can set a resolution window to resolve alerts quickly once the underlying issue is fixed. The resolution window specifies how long a monitor will wait before resolving an alert after the issue is corrected.
For example, if your monitor evaluates the last 1 hour, you can set a resolution window of 15 minutes. Once the resolution window is continuously satisfied for 15 minutes, the alert will resolve automatically.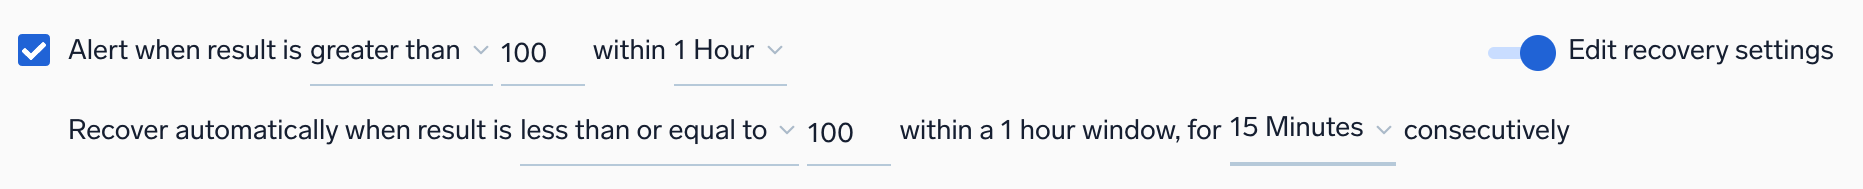
Prerequisites
To fully leverage metrics monitor alerts, you'll need:
- Automation Service. Required for linking playbooks to metrics-based monitors (learn more).
- Metrics data. Our anomaly detection uses up to 30 days of your Sumo Logic metrics data history to establish baseline of the metrics signal and the underlying system behavior.
- Metrics aggregation. Queries should be aggregated (for example, using
sumoravgoperators) before applying anomaly detection.
Examples:
- Cluster anomalies detection. A user configures alerts for anomalies when 5 out of 10 data points in a 10-minute window exceed the baseline, allowing for precision in volatile environments.
- Automating resolution with playbooks. A playbook responds to CPU usage anomalies by gathering logs, notifying teams, and restarting affected servers.
Static detection method
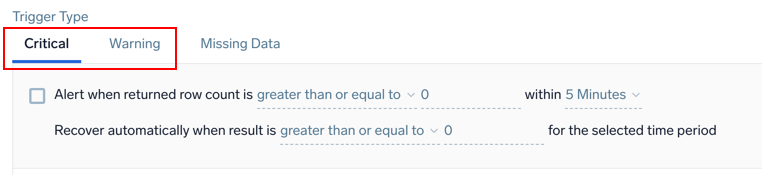
Example: Metrics - Static - Critical and Warning
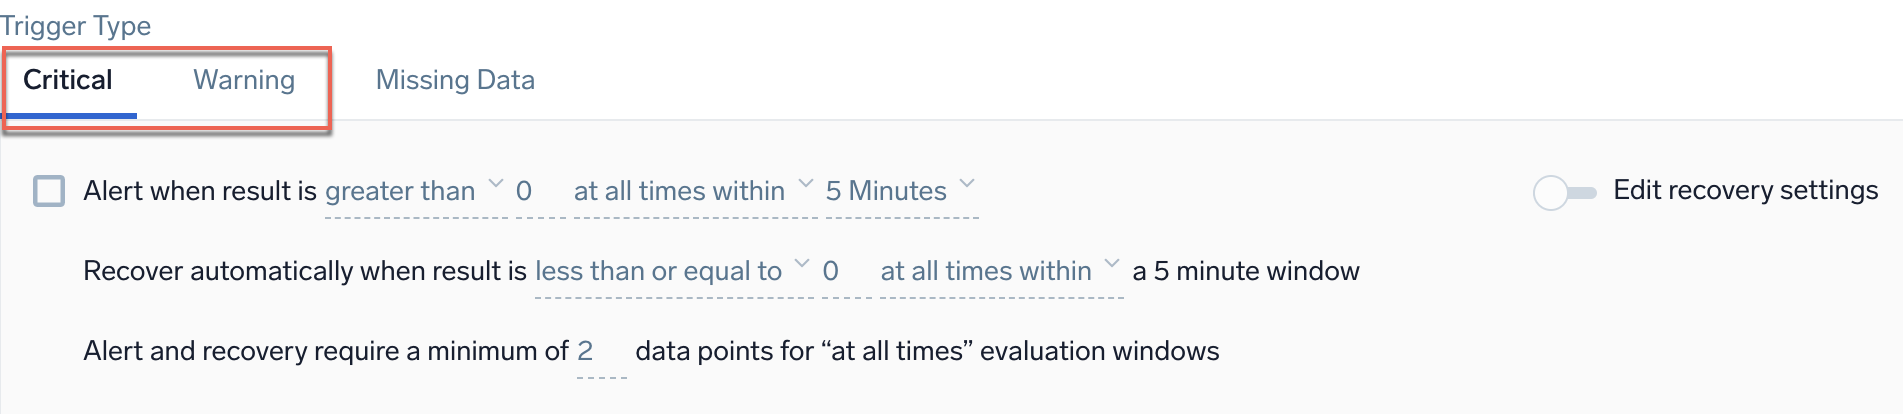
Alert when result is <threshold type> <threshold> <occurrence type> <time range>
| Parameter | Description |
|---|---|
<threshold type> | How you want the value compared. Select greater than, greater than or equal, less than or equal, or less than. |
<threshold> | The value against which the trigger will be evaluated. You can specify any valid numeric value. |
<occurrence type> | The time condition you want for the trigger. Select at any time within or at all times within. Choose at all times within if you want all the data points for the given metric to meet threshold conditions in a given time range, before triggering an alert. Alternatively, choose at any time within if you want to generate an alert when at least one single data point meets the threshold condition for the given time range. |
<time range> | The duration of time to evaluate (values range from 5 minutes to 24 hours). |
Recover automatically when result is <threshold type> <threshold> for the selected time period
The recovery condition is set by default to the opposite of the alert condition. If you need to change these settings, switch on the Edit recovery settings toggle and then adjust values for the recovery settings accordingly. Sumo Logic automatically resolves the incident when the resolution condition is satisfied.
For example, when an alert is set to greater than 10, the recovery would be set to less than or equal to 10 when inferred.
| Parameter | Description |
|---|---|
<threshold type> | How you want the value compared. Select greater than, greater than or equal, less than or equal, or less than. |
<threshold> | The value against which the resolution will be evaluated. You can specify any valid numeric value. |
The Alert and recovery setting affects both the alert generation logic and the alert recovery logic. Alert and recovery require a minimum of <count> data points for "at all times" evaluation windows. This setting only works when you choose at all times within as the type of occurrence for the alert. 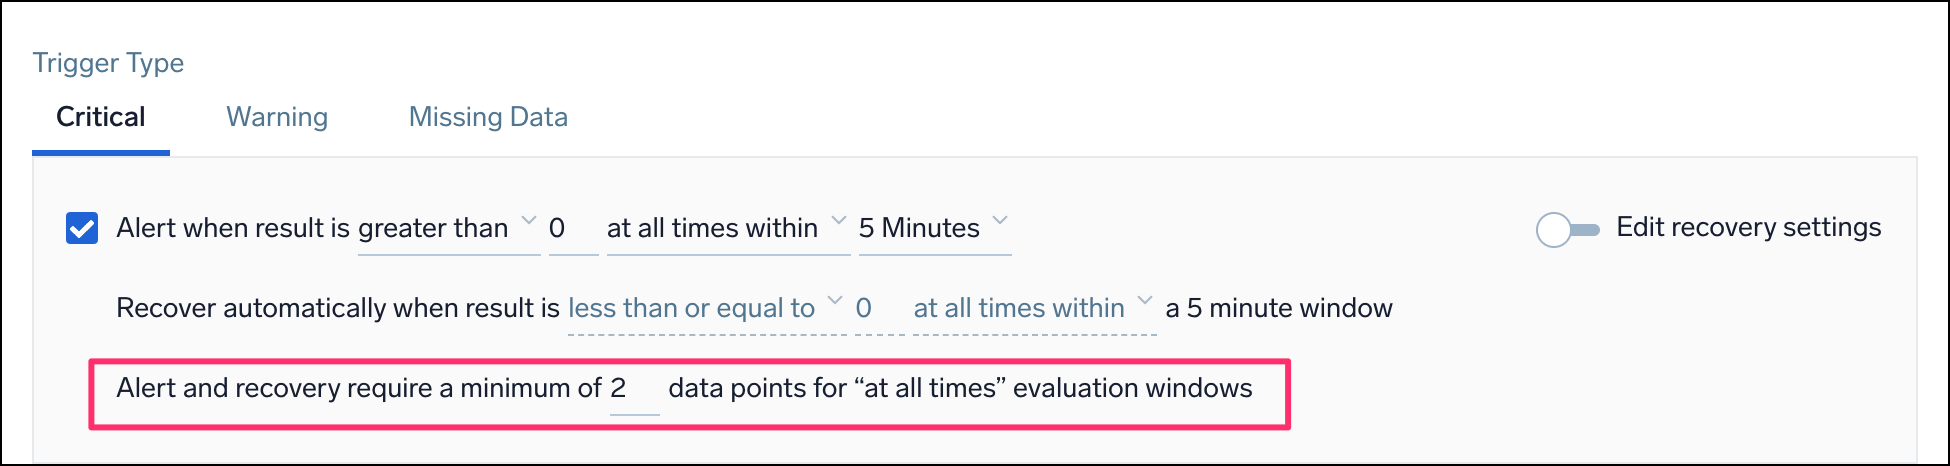
| Parameter | Description |
|---|---|
<count> | The minimum number of data points required within the configured window to trigger an alert or recover from an alert. This means that if Sumo Logic receives fewer data points in a given window, no alert will be triggered (even if all those data points exceed the threshold). |
For example, you want to be alerted when the CPU usage is over 60% at all times within a 5-minute window. If you set the count to 3, this means that you will only get an alert if you have at least 3 data points showing CPU usage above 60% within that 5-minute window. If you only have 2 data points, even if both of them show CPU usage above 60%, you won't get an alert.
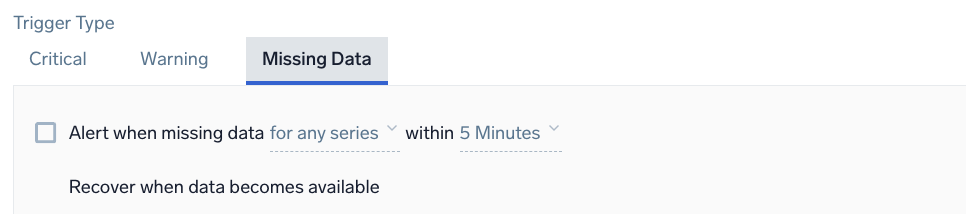
Example: Metrics - Static - Missing Data
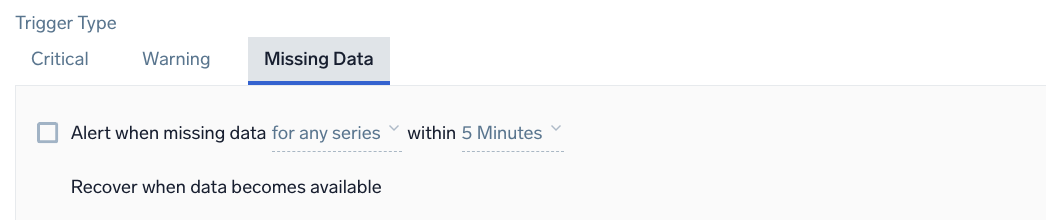
Alert when missing data <occurrence type> within <time range>
| Parameter | Description |
|---|---|
<occurrence type> | The time condition you want for the trigger. Choose for all series to get notified when all of the metrics meeting the query condition are not sending data in the given time range. Alternatively, you can choose for any series if you want to get notified when one of the metrics does not receive any data in the given time range. This option requires at least one initial data point and expires after 24 hours once triggered. |
<time range> | The duration of time to evaluate (values range from 5 minutes to 24 hours). |
Anomaly detection method
Anomaly detection applies to one time series at a time. All metrics anomaly monitor trigger queries must have aggregation applied at the end of the query before detection.
Example: Metrics - Anomaly - Critical
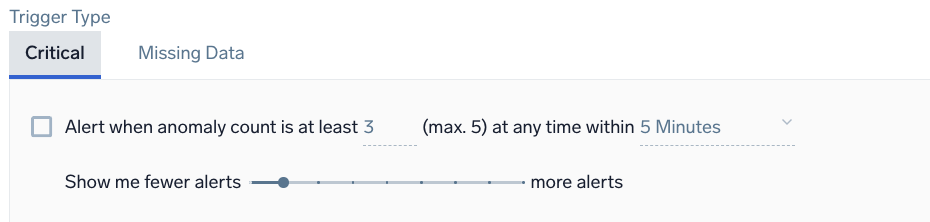
Alert when anomaly count is at least <count> (max. 5) at any time within <time range>
| Parameter | Description |
|---|---|
<count> | Enter the minimum number of anomalies to detect during the detection window before triggering an alert. |
<time range> | The duration of time to watch for anomalies (values range from 5 minutes to 24 hours). |
Tune the number of anomalous data points detected per day compared to the predicted baseline for the detection window. Select more alerts if you do not want to miss out on most anomalies.
Example: Metrics - Anomaly - Missing Data
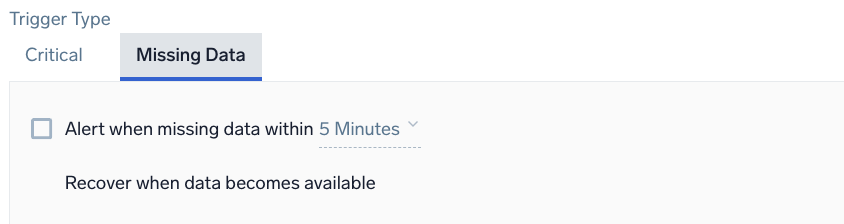
Alert when missing data within <time range>
| Parameter | Description |
|---|---|
<time range> | The duration of time to evaluate (values range from 5 minutes to 24 hours). |
For recovery, Sumo Logic will automatically resolve the incident when the resolution condition is satisfied.
Outlier detection method
Example: Metrics - Outlier - Critical and Warning
Alert when result is greater than or equal to <threshold> standard deviations from baseline for <time range>
| Parameter | Description |
|---|---|
<threshold> | The number of standard deviations for calculating violations. The default is 3. |
<time range> | The duration of time to evaluate (values range from 5 minutes to 24 hours). |
The recovery condition will always be the opposite of the alerting condition. For example, if there is no outlier identified for the duration of the detection window from the time the alert was first fired, then the monitor will be brought back to the normal state. You cannot customize the resolution condition for the monitor.
Example: Metrics - Outlier - Missing Data
Alert when missing data <occurrence type> for <time range>
| Parameter | Description |
|---|---|
<occurrence type> | The time condition you want for the trigger. Choose either for all or for any. If you choose all you will get notified when all of the metrics meeting the query condition are not sending data in the given time range. Alternatively, you can choose any if you want to get notified when one of the metrics does not receive any data in the given time range. This option requires at least one initial data point and expires after 24 hours once triggered. |
<time range> | The duration of time to evaluate (values range from 5 minutes to 24 hours). |
For recovery, Sumo Logic automatically resolves the incident when the resolution condition is satisfied.
Step 2. Advanced settings (optional)
Configure advanced settings like the Alert Name and Evaluation Delay.
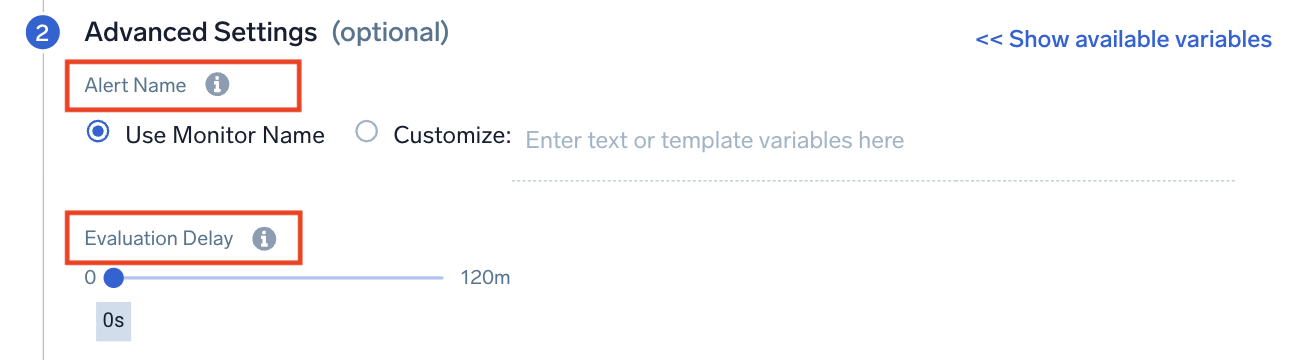
Alert Name
Alert Name allows you to customize the name that appears on the Alert page. By default, the Alert name is the monitor name, but you may want to create a custom name based on your use case. You can include any of the available alert variables, except {{AlertName}}, Playbook, {{AlertResponseURL}}, and {{ResultsJson}}, in the name such as the type of monitor or trigger condition. You can check the alert variables list for details.
Example: {{Resultsjson.Env}} - High CPU. This alert will produce an Alert with the name like PROD - High CPU. Here we are assuming that there is a field name Env in underlying data that has a value of "PROD".
Evaluation Delay
Use this setting to delay monitor processing by the specified interval of time to account for data ingestion delays. It delays the evaluation of a monitor so that it doesn't look at the most current time (where data can be incomplete) and instead looks at an older period of time, where you have more complete data.
Collection delays may occur due to your environment and it takes a couple of minutes for data to be processed into Sumo Logic. Since monitors run on data from the most current time period, it's possible for them to evaluate against incomplete data. As a result, monitors can generate false positives or negatives that can cause confusion.
If your data is coming from the Amazon CloudWatch Source for Metrics, we recommend a setting of 900 seconds.
Step 3. Notifications (optional)
Configure who gets notified when the monitor triggers an alert. When a trigger condition is met, you can send notifications to other people and services.
Notifications will be sent when the monitor is triggered as configured in the Alert Grouping section of the monitor.
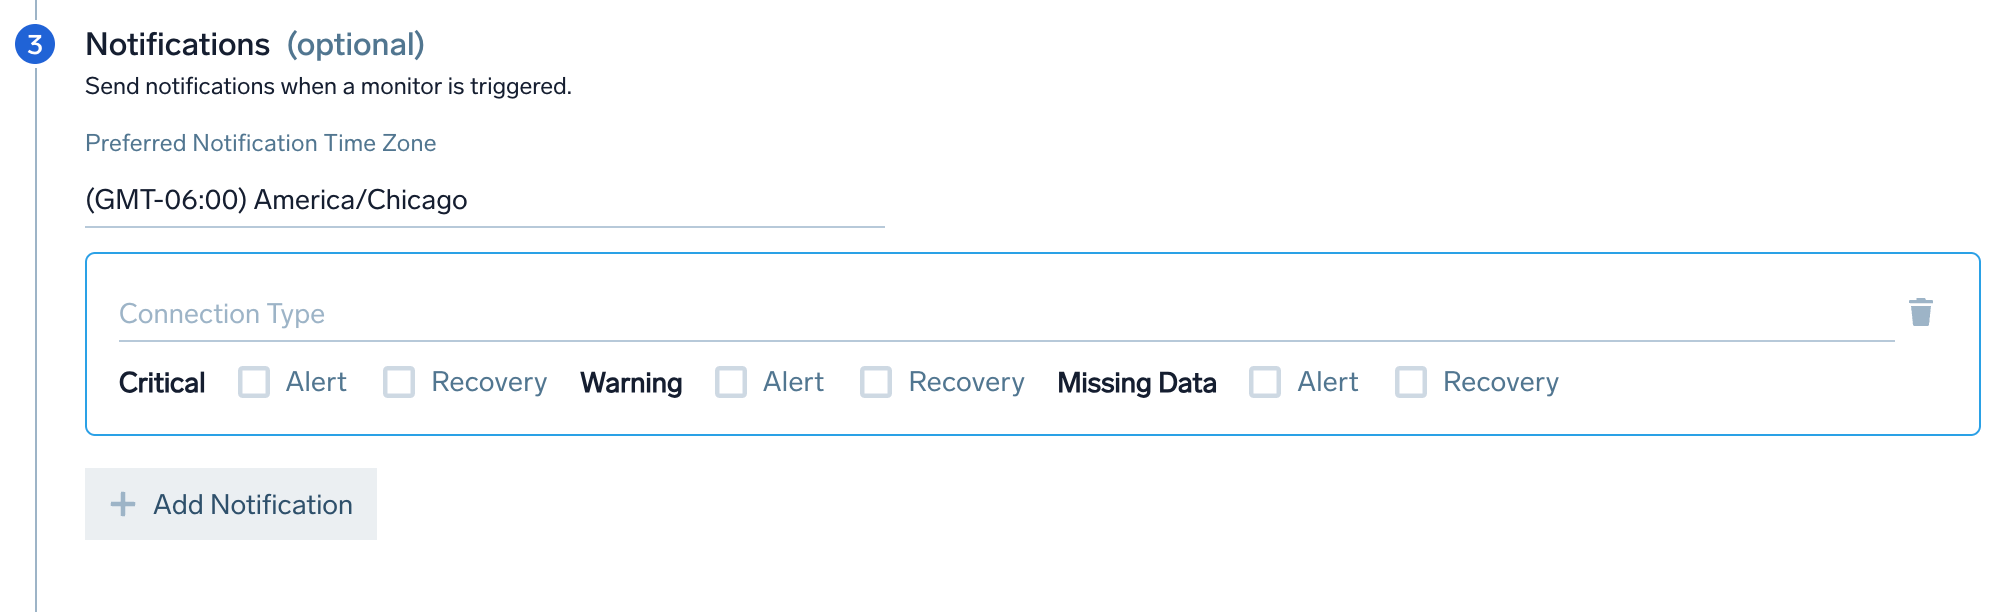
- Preferred Notification Time Zone. Set the time zone for your alert notifications. If you do not select anything, it will default to the time zone specified in your user preferences.
- Connection Type. Choose the connection notification method (e.g., email, Webhook, PagerDuty). Monitor notifications support Alert Variables to reference its configuration settings or your raw data.
- Email. Provide 1-100 recipient email addresses. You can customize the email subject and body.
- Webhook. By default, the payload defined on the Connection is used. You can customize your payload for each notification if needed.
- Trigger Type Notifications. Set different notification channels for each trigger type (Critical, Warning, Missing Data). Select the Alert and Recovery checkboxes for each trigger type based on when you want to send a notification. You can have different Trigger Conditions send a notification to different channels. For example, you can get notified on PagerDuty for critical Incidents and get an email or Slack notification for warning incidents.
- For the connection types listed here, you can use the Recovery checkbox to enable an automatic resolution process that updates the connection when an alert has recovered within Sumo Logic.
- Optionally, you can click Add Notifications to add more notification channels. and configure different notifications for each trigger type (critical, warning, and missing data).
Step 4. Playbook (optional)
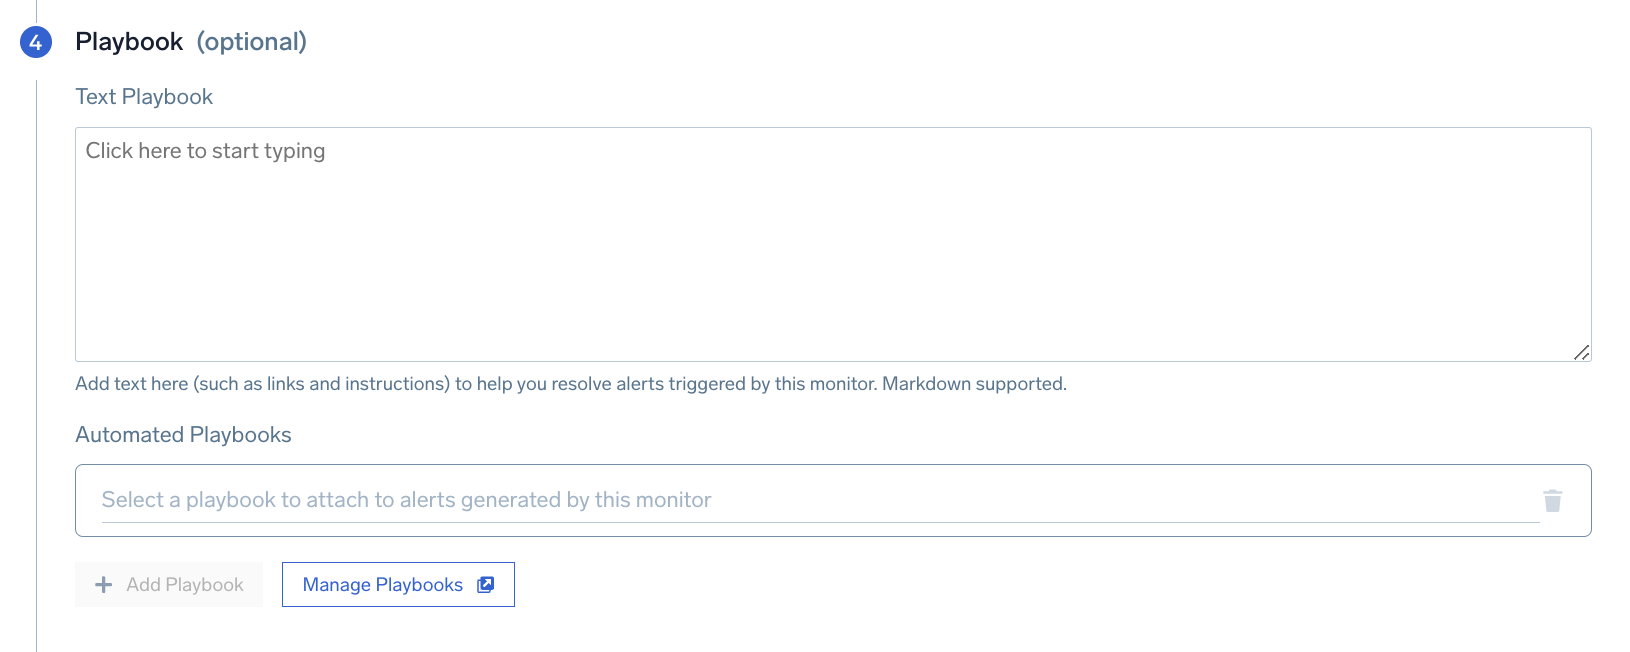
In this step, you can add a playbook to run in response to an alert.
Text Playbook
Provide manual instructions to handle alerts resulting from the monitor. This allows admins to codify tribal knowledge for an on-call so that they know what to do upon receiving an alert. Markdown is supported. For an example, see Alert details.
Automated Playbooks
Choose from over 500 prebuilt automated playbooks in the Automation Service to run when an alert is triggered. For more information, see Automated Playbooks in Monitors.
Optionally, you can click Add Playbook to add more automated playbooks to run sequentially, and Manage Playbooks to oversee and organize your automated playbooks in the Automation Service.
Step 5. Monitor details
Finalize your monitor by configuring its details. Monitor Name gives your monitor a name and Location where the monitor will be saved.
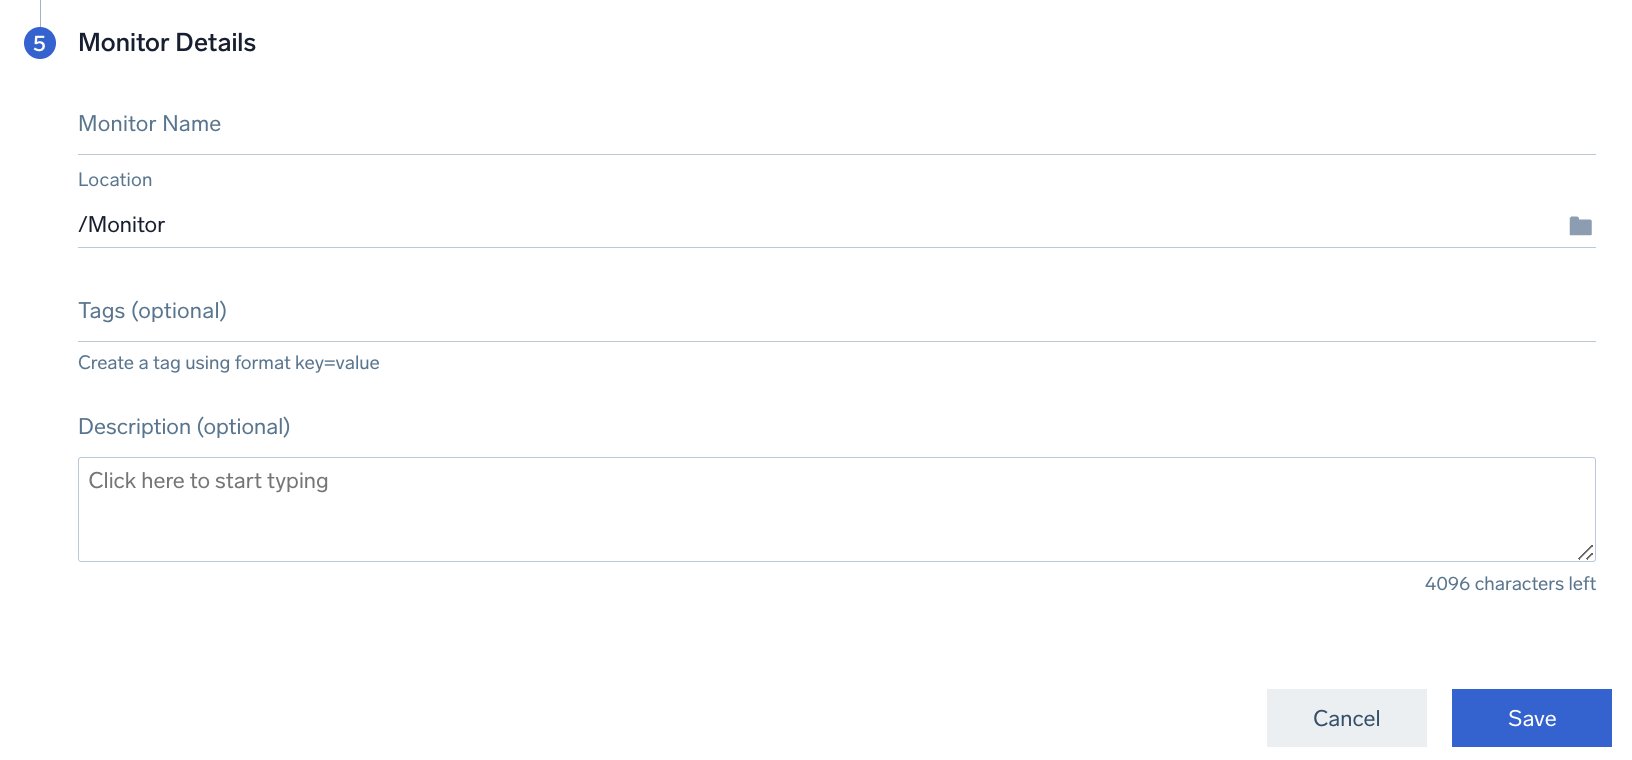
Optionally, you can add Tags to organize your monitors and/or a Description.
Other configurations
Using Terraform
You can configure Sumo Logic monitors using Terraform modules.