Configuring RUM Data Collection
To collect traces and RUM metrics from a browser, you'll first need to create a RUM HTTP Traces Source. The source will have an endpoint URL that you'll put in a script that sends trace data in OTLP/JSON over HTTP protocol. Alternatively, you can also use an intermediary OTel collector, if you require data to flow over your infrastructure rather than directly to Sumo Logic. Note however this will disable automatic geo-location recognition capabilities.
Using the RUM HTTP Traces App for Manual Testing.
Prerequisites
To utilize XHR and navigation/route changes, and errors collection, you must use RUM script version 4 or higher (https://rum.sumologic.com/sumologic-rum-v4.js). Make sure you're using the correct version in your pages. For automatic updates, use the script https://rum.sumologic.com/sumologic-rum.js. You can find more details about versioning control later in this document.
For full end-to-end visibility, we recommended supplementing your RUM browser auto-instrumentation with the appropriate back-end tracing instrumentation.
Step 1: Create a RUM HTTP Traces Source
To configure a RUM HTTP Traces source:
- Classic UI. In the main Sumo Logic menu, select Manage Data > Collection > Collection.
New UI. In the top menu select Configuration, and then under Data Collection select Collection. You can also click the Go To... menu at the top of the screen and select Collection. - If you've not yet created a Hosted Collector, follow these steps to do so.
- On the Collection page, click Add Source next to a Hosted Collector.
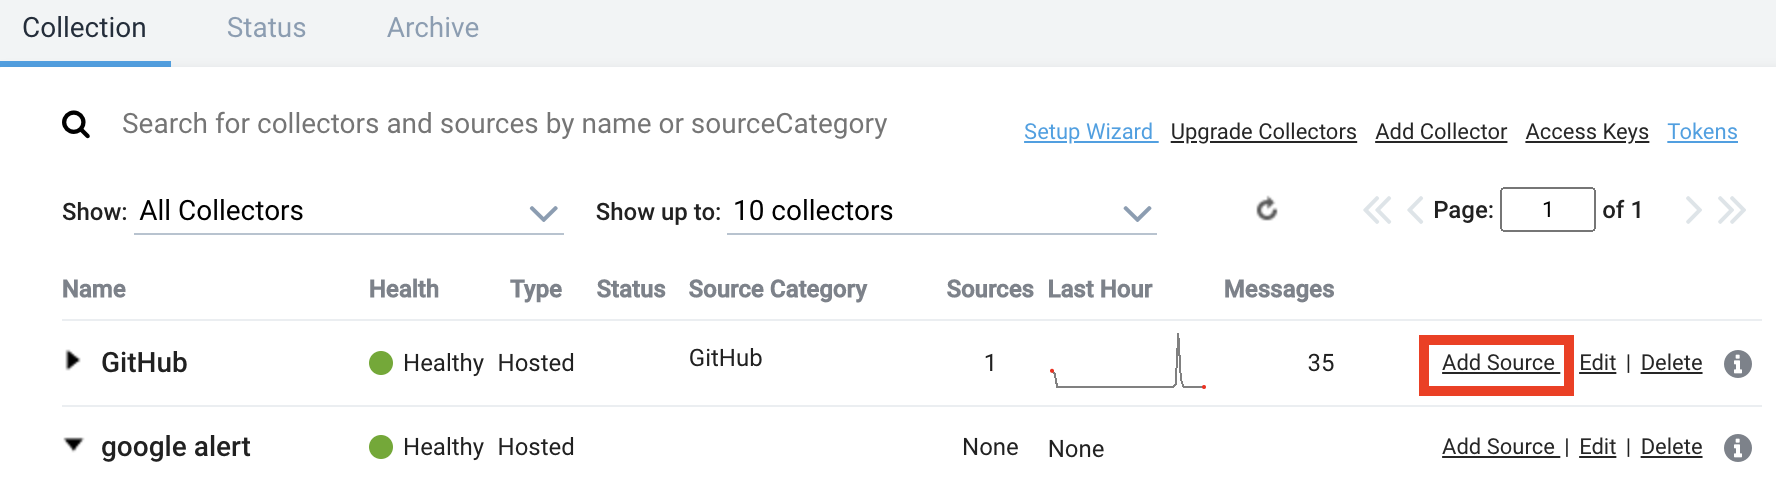
- Select RUM HTTP Traces.
- Under Source Type: RUM HTTP Traces, enter the following information:
- Name for the Source.
- Description. (Optional) description of the Source.
- Source Host and Source Category. (Optional) Enter any string to tag the output collected from the source. These are built-in metadata fields that allow you to organize your data. We recommend you specify a Source Category indicating the data is from a browser.
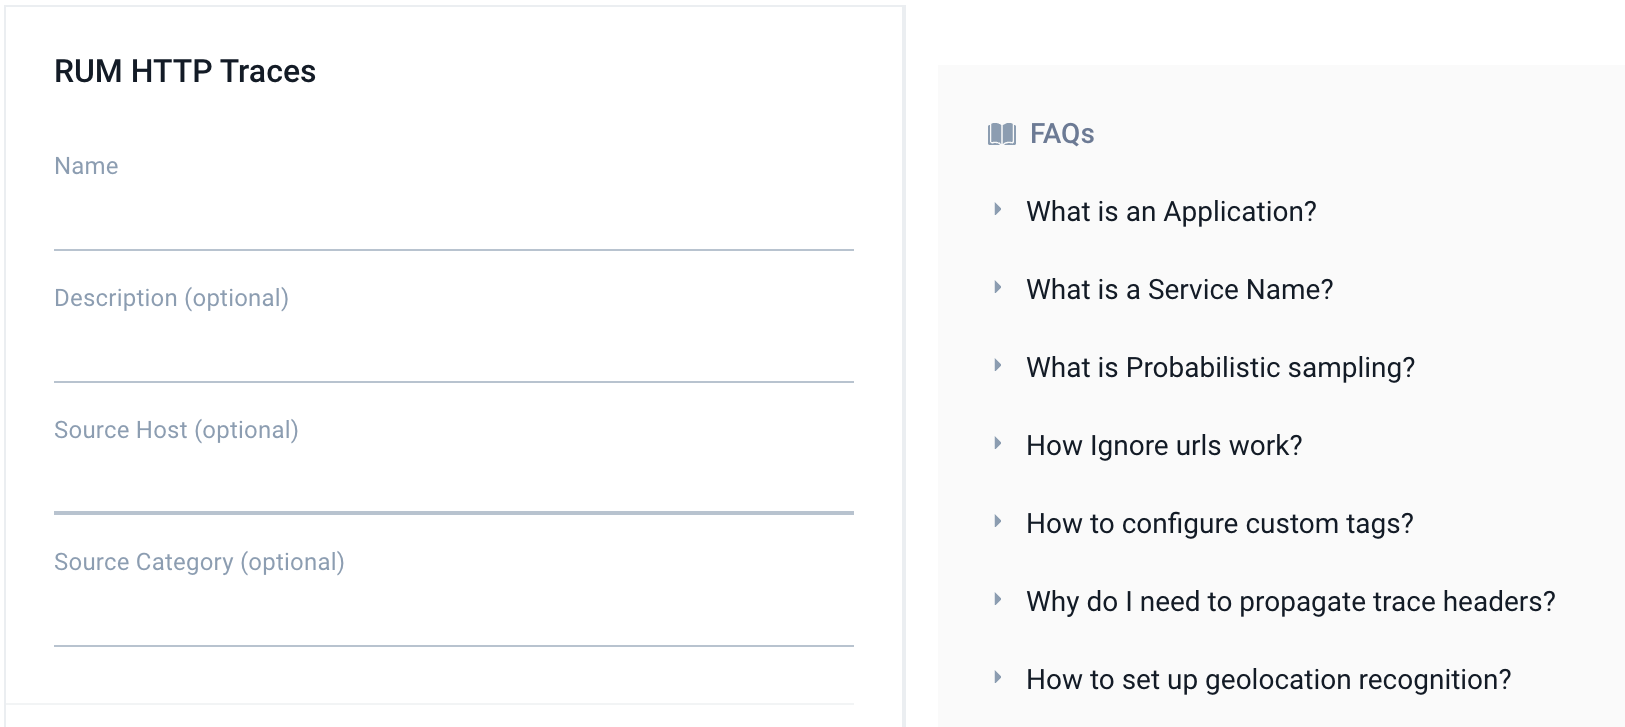
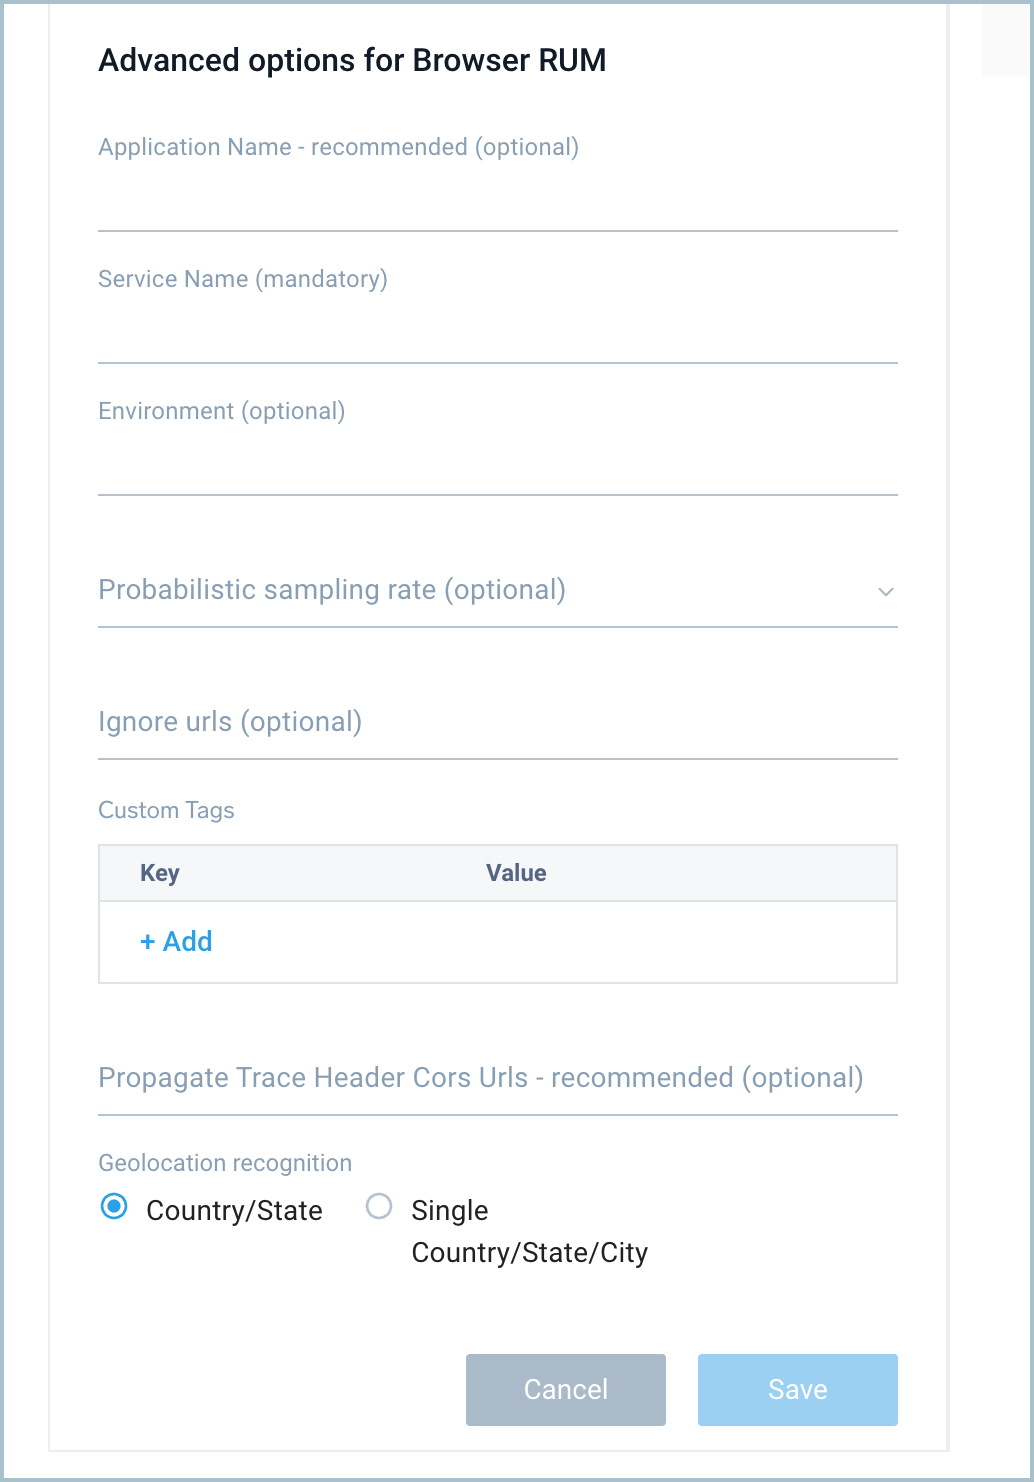
- Enter Advanced options for Browser RUM.
-
Application Name. (Recommended) Add an Application Name tag of a text string to show for the app name in spans (for example,
bookings-app). This groups services in the Application Service View. If left blank, services will belong to a "default" application. See Application Service Dashboards for more information. This setting is saved in the script forname_of_your_web_application. -
Service Name. (Required) Add a Service Name of a text string to show for the service name in spans (for example,
bookings-web-app). This setting is saved in the script forname_of_your_web_service. To set up a service name dynamically (e.g., to have different service names for micro-frontend packages), leverage thegetOverriddenServiceNamefunction inside your page code to overwrite the default service name (requires RUM script v4.2.0 or higher). Service names should be of low cardinality and should describe parts of your website above page level. Here's an example code leveraging that function:window.sumoLogicOpenTelemetryRum.initialize({
collectionSourceUrl:
'https://service.sumologic.com/receiver/v1/rum/token==',
serviceName: 'online-shop-frontend',
applicationName: 'online-shop',
getOverriddenServiceName: (span) => {
const pathname = document.location.pathname;
if (pathname.startsWith('/carts/')) {
return 'online-shop-frontend-carts'
}
return 'online-shop-frontend-main'
}
}); -
deployment.environment (optional): Your production, staging, or development environment name, up to 10 distinct values per org.
-
Probabilistic sampling rate (optional): Add a Probabilistic sampling rate for heavy traffic sites in a decimal value based on percentage, for example, 10% would be entered as
0.1. -
Ignore urls (optional): Add a list of URLs not to collect trace data from. Supports regex. Make sure provided URLs are valid JavaScript flavor regexes. For example:
/^https:\/\/www.tracker.com\/.*/, /^https:\/\/api.mydomain.com\/log\/.*/ -
Custom Tags (optional): Click +Add and enter a key and value for each Custom Tags to show in spans from instrumented browsers. As an example, you could enter a key of
internal.versionwith a value of0.1.21. This information is saved in the script forname_of_your_web_service. -
Propagate Trace Header Cors Urls (recommended): Add a list of URLs or URL patterns that pass tracing context to construct traces end-to-end. This information is saved in the script for
list_of_urls_to_receive_trace_context. Make sure provided URLs are valid JavaScript flavor regexes. Some examples are/^https:\/\/api.mydomain.com\/apiv3\/.*/and/^https:\/\/www.3rdparty.com\/.*/.warningPropagate Trace Header CORS URLs Sumo Logic cannot perform configuration validation of services of other origins. You should always enable context propagation and CORS configuration changes in a test environment before setting it up in production.
Details
This list is empty by default, which means trace context propagation—allowing creation of front-end to back-end traces for cross-origin requests—is not enabled because of browser CORS security restrictions. To connect your front-end and back-end traces, make sure your environment supports W3C Trace Context HTTP headers.
To propagate tracing context to create front-end to back-end traces, set the domain(s) to propagate W3C tracing context to. You must configure your servers/APIs to accept and return the following CORS headers in their response:
Access-Control-Allow-Headers: traceparent, tracestate.Valid cross-origin resources must include the prefix
http://orhttps://and the domain name. The port number is not required unless it differs from the default for HTTP (port 80) or HTTPS (port 443). -
Geolocation recognition: Select a Geolocation recognition option to automatically recognize geographical locations of your end clients from:
- The country down to state (recommended for global websites)
- A single country down to city level (recommended for local, country specific websites)
-
For additional guidance on the above options, refer to the FAQs list on the page. To view all available configuration parameters, see the Sumo Logic OpenTelemetry auto-instrumentation for JavaScript README file.
-
- When you are finished configuring the Source, click Submit.
- An HTTP Source Script is displayed in a pop-up with three different formats: synchronous, asynchronous, and npm. These are examples of scripts you can use with all configurations you entered when creating the source, including advanced options. Select a format and click Copy to Clipboard.
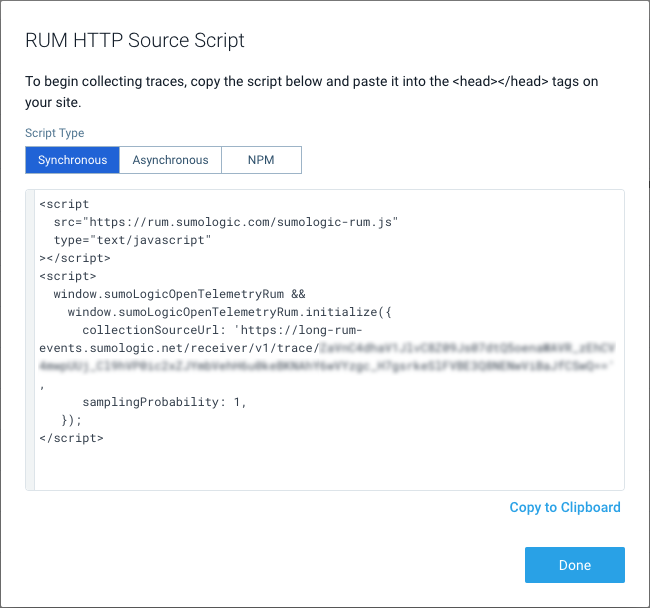
The script includes a RUM HTTP Traces Source URL for collectionSourceUrl in the generated script. This is saved for the script as sumo_logic_http_traces_source_url. Your user's browser should be allowed to POST data to this URL.
This can be also replaced with an internal OpenTelemetry collector if you wish to redirect browser traffic over it. In this case, replace this URL with the OpenTelemetry collector OTLP/HTTP receiver endpoint as described in Getting Started with Transaction Tracing. In this case, the OpenTelemetry collector exporter will send data to the RUM HTTP Traces Source URL.
Step 2: Add RUM Script to Your Page Header
Use the copied script in your page head inside the <head> </head> tags. The script sends trace data in OTLP/JSON over HTTP protocol.
You can view and copy a script anytime by clicking Show script for the source.
![]()
The following are base script examples, populated when you create and configure a source in the above instructions.
- Synchronous
- Asynchronous
- NPM
<script src="https://rum.sumologic.com/sumologic-rum-v3.js" type="text/javascript"></script>
<script>
  window.sumoLogicOpenTelemetryRum &&
    window.sumoLogicOpenTelemetryRum.initialize({
      collectionSourceUrl: 'sumo_logic_traces_collector_source_url',
      serviceName: 'name_of_your_web_service',
      propagateTraceHeaderCorsUrls: [
        'list_of_domains_to_receive_trace_context',
      ],
    });
</script>
You can load the script asynchronously using the script below but some functionalities like user interactions or requests made before script run will be limited.
<script>
  (function (w, s, d, r, e, n) {
    (w[s] = w[s] || {
      readyListeners: [],
      onReady: function (e) {
        w[s].readyListeners.push(e);
      },
    }),
      ((e = d.createElement('script')).async = 1),
      (e.src = r),
      (n = d.getElementsByTagName('script')[0]).parentNode.insertBefore(e, n);
  })(
    window,
    'sumoLogicOpenTelemetryRum',
    document,
    'https://rum.sumologic.com/sumologic-rum-v3.js',
  );
  window.sumoLogicOpenTelemetryRum.onReady(function () {
    window.sumoLogicOpenTelemetryRum.initialize({
      collectionSourceUrl: 'sumo_logic_traces_collector_source_url',
      serviceName: 'name_of_your_web_service',
      propagateTraceHeaderCorsUrls: [
        'list_of_domains_to_receive_trace_context',
      ],
    });
  });
</script>
The other option is to bundle this library inside your project and initialize it. Inside your project directory, execute:
npm install @sumologic/opentelemetry-rum
RUM needs to be initialized, preferably before other functionalities in your code:
import { initialize } from '@sumologic/opentelemetry-rum';

initialize({
  collectionSourceUrl: 'sumo_logic_traces_collector_source_url',
  serviceName: 'name_of_your_web_service',
  propagateTraceHeaderCorsUrls: ['list_of_domains_to_receive_trace_context'],
});
The above script examples omit the version number and automatically uses most up-to-date version of it (which you can find here). If you want to manually control versioning of the script, use:
https://rum.sumologic.com/sumologic-rum-vX.js(e.g., https://rum.sumologic.com/sumologic-rum-v4.js) for major version control (no breaking changes)https://rum.sumologic.com/sumologic-rum-vX.Y.js(e.g., https://rum.sumologic.com/sumologic-rum-v4.0.js) for minor version control (only bug fixes are automatically included)https://rum.sumologic.com/sumologic-rum-vX.Y.Z.js(e.g., https://rum.sumologic.com/sumologic-rum-v4.0.0.js) for patch version control (strict version control)
RUM scripts can be also wrapped in the form of a browser extension/plugin for monitoring SaaS applications in environments where you can control user browser configuration (e.g., internal employees). To obtain a customized browser extension for your environment to monitor Real User Experience with Sumo Logic, contact your Account Team or Sumo Logic support.