AWS Lambda - .NET Function Instrumentation
This document covers how to install and configure OpenTelemetry distributed tracing for AWS Lambda functions based on .NET and send the data to Sumo Logic.
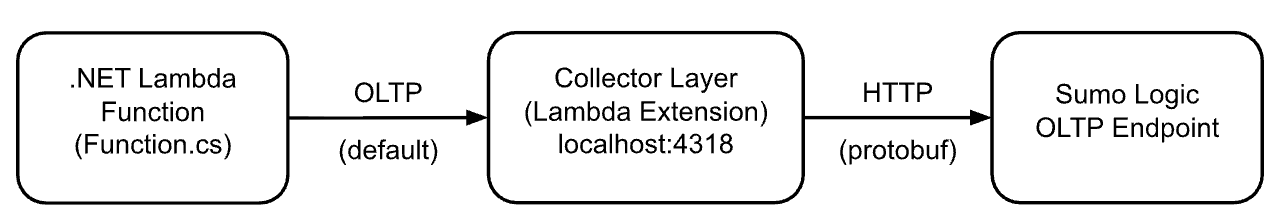
To obtain tracing data from AWS Lambda functions developed in .NET, you can use the following components
Provided SDK
OpenTelemetry Lambda SDK for .NET includes tracing APIs to instrument Lambda handlers and is provided on NuGet.
OpenTelemetry Lambda layer
OpenTelemetry Lambda Layer for Collector includes OpenTelemetry Collector for Lambda components. Apply this layer to your Lambda handler that's already been instrumented with the OpenTelemetry Lambda .NET SDK to enable end-to-end tracing.
.NET Lambda layer supports
- .NET 6 SDK or later
- x86_64 and arm64 architectures
Lambda function requirements
You'll need the following:
- .NET 6 SDK or later
- Lambda layers add permissions
- Sumo Logic OTLP/HTTP Source endpoint URL - To send spans from the instrumented Lambda function to Sumo Logic you need an endpoint URL from an existing or new OTLP/HTTP source.
Quick Start
Overview
Prerequisites
- AWS CLI configured with appropriate permissions
- Configure the AWS credential
- .NET 6 SDK
- Sumo Logic OTLP endpoint URL
Configure the lambda function
Navigate to functions in the AWS Lambda Console and open the function you want to instrument.
-
Navigate to the Layers section and click Add a layer. Use the following upstream collector lambda layer
arn:aws:lambda:<region>:184161586896:layer:opentelemetry-collector-<amd64|arm64>-<version>:1
-
In the Choose a layer menu, select Specify an ARN and paste the above ARN ID for your Lambda function
noteLambda layers are a regionalized resource, meaning that they can only be used in the Region in which they are published. Make sure to use the layer in the same region as your Lambda functions.
By default, OpenTelemetry Collector Lambda layer exports telemetry data to AWS backends. To customize the collector configuration, add a collector.yaml to your function and specify its location via the
OPENTELEMETRY_COLLECTOR_CONFIG_URIenvironment file. -
Configure the collector layer to send data to SumoLogic:
receivers:
  otlp:
    protocols:
      grpc:
        endpoint: localhost:4317
      http:
        endpoint: localhost:4318

exporters:
  otlphttp:
    endpoint: ${SUMO_LOGIC_OTLP_ENDPOINT}
    headers:
      Content-Type: application/x-protobuf
    encoding: proto

service:
  pipelines:
    traces:
      receivers: [otlp]
      exporters: [otlphttp]
Once the file has been deployed with a Lambda, configuring the
OPENTELEMETRY_COLLECTOR_CONFIG_URIwill tell the OpenTelemetry extension where to find the collector configuration:aws lambda update-function-configuration --function-name Function --environment Variables={OPENTELEMETRY_COLLECTOR_CONFIG_URI=/var/task/collector.yaml} -
Configure the following environment variables:
Navigate to the Configuration > Environment variables section and ensure that the following environment variables are setup:
Variable Value Purpose OTEL_EXPORTER_OTLP_ENDPOINTlocalhost:4318Collector endpoint OTEL_EXPORTER_OTLP_PROTOCOLhttp/protobufExport protocol AWS_LAMBDA_EXEC_WRAPPER/opt/otel-instrumentLambda wrapper SUMO_LOGIC_OTLP_ENDPOINThttps://your-endpoint.sumologic.net/receiver/v1/otlp/YOUR_TOKENSumo Logic endpoint OPENTELEMETRY_COLLECTOR_CONFIG_URI/var/task/collector.yamlCollector configuration
Any other environment variables like OTEL_RESOURCE_ATTRIBUTES or OTEL_SERVICE_NAME could also be configured.
Your function should be successfully instrumented. Invoke the function and find your traces in the Sumo Logic Tracing screen