Search Query Language Support for Traces
You can use our Search Query Language in a log search to query raw spans from tracing data for the same period as the default partition.
Tracing data retention in _trace_spans index is the same as default log index retention.
Limitations
- The following operators are not supported when searching trace span data:
- cat
- Logreduce without a field, value, or key suffices
_indexand_vieware not supported other than when specified as_trace_spans.- Adding to Dashboard is supported as long as your total dashboard-originated
_trace_spansread volume does not exceed 200x of your tracing ingest. Contact your Sumo Logic representative for paid subscription service options for volume requirements exceeding 200x of your tracing ingest. - Field extraction rules are not supported as the index has well defined schema
- Data forwarding is not supported
Search span data
Searching span data is the same as running a log search. You just need to specify the _index metadata field with the value _trace_spans in the keyword search expression (also called the scope) of your query.
To search your tracing data do the following:
- New UI. In the main Sumo Logic menu, select Logs > Log Search. You can also click the Go To... menu at the top of the screen and select Log Search.
Classic UI. Go to the Home screen and select Log Search. - On the Search page, enter the following in the text box:
_index=_trace_spans. - Choose a time range up to seven days ago that you'd like to review.
- Click Start to run the search.
Scope
A Keyword Search Expression defines the scope of data for the query. You need to specify _index=_trace_spans in the scope to reference your trace data.
Keyword searching is supported for tracing indexes across all fields, unlike other indexes where only the _raw field is searched.
_any option
In scenarios where users are not familiar with the schema and would like to search across all the fields, _any modifier provides a means to search for a specified value from all of the Ingest Time Fields in your data. For example, to search for data with any field that has a value of success you would put _any=success in the scope of your query.
Syntax: _any=<value>
The _any option is not supported outside of the scope of a query. This is supported for the Security and Tracing tiers.
Parse Your Spans
You can parse your spans in the same way you parse log data. This includes any value from the tags field by using the field option with the JSON operator, for example, | json field=tags. See how to Parse JSON Formatted Logs for details.
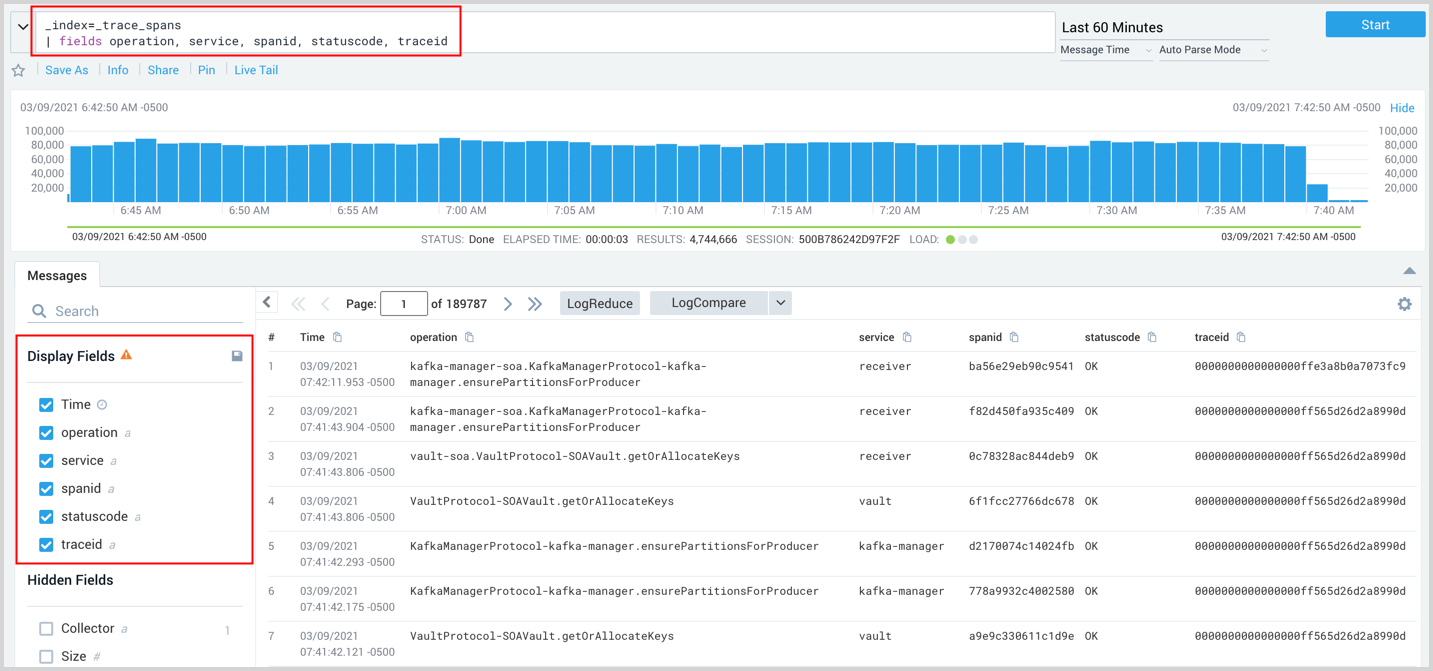
View Your Search Results
When viewing your search results you can add any parsed fields to display by selecting them from the Field Browser on the left, or by using the fields operator in your query. The following image shows a query using the fields operator to display operation, service, spanid, statuscode, and traceid. The Field Browser can also set the fields to display.
Monitors and Scheduled Searches
You can also set Monitors and Scheduled Searches for Traces.
Span structure
Each span is written in JSON format. Span attributes are parsed to individual fields where the full content of tags and values are parsed into the tags field. The Message field for tracing data remains empty.
The following two lists contain the fields returned in your search results after running a query:
Displayed by default:
- Time
- Message (empty and reserved for future use)
Sumo Logic built-in fields:
- Collector (reserved for future use, the value is set to InternalCollector)
- Size (reserved for future use, the value is set to 0)
- Source (reserved for future use, the value is set to InternalSource)
- Source Category
- Source Host
- Source Name (reserved for future use, the value is set to “Http Input”)
The following is a table of automatically-parsed span attributes:
| Span field | Description |
|---|---|
| endtimestamp | The end timestamp of the span |
| kind | Either internal, server, or client as set by client instrumentation |
| operation | The operation name such as url, SOA call, or db statement as set by client instrumentation |
| parentspanid | The identifier of the parent span as set by client instrumentation |
| remoteservice | The remote service name pointer as detected from span tags |
| service | The service name as set by client instrumentation |
| spanid | The identifier of the span as set by client instrumentation |
| starttimestamp | The start timestamp of the span |
| statuscode | The span status as detected based on span response values from tags |
| statusmessage | The specific error message from span fields |
| tags | A JSON formatted list of any other span tags |
| Traceid | The identifier of the trace as set by client instrumentation |
Examples
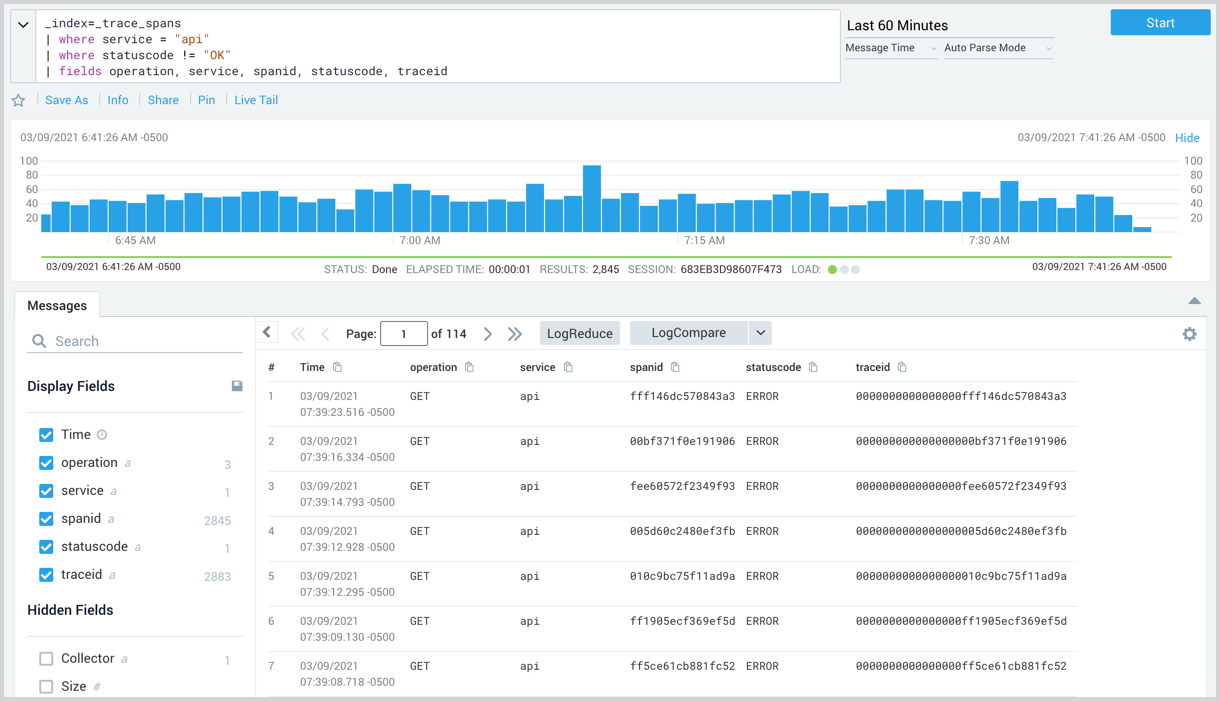
Retrieve all erroneous spans from API service
You can search for spans from the api service that resulted in a status code that is not OK. For example,
_index=_trace_spans
| where service = "api"
| where statuscode != "OK"
| fields operation, service, spanid, statuscode, traceid
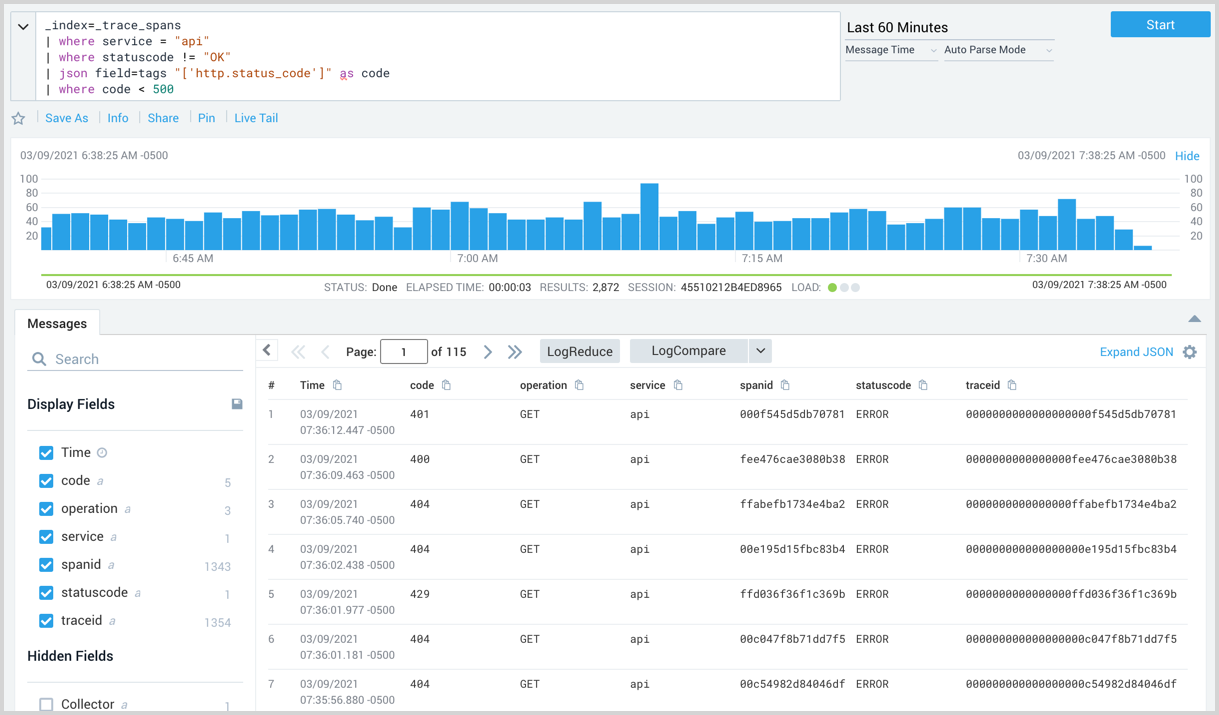
Break them down by HTTP code status
To find out more details about the errors found in the example above you
can look in the tags field and view the http.status_code field.
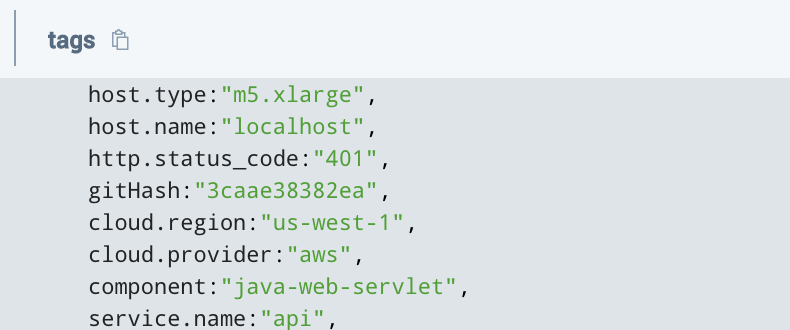
To extract this tag as a new field and filter it to show only codes below 500 (4xx essentially) you could run the following query:
_index=_trace_spans
| where service = "api"
| where statuscode != "OK"
| json field=tags "['http.status_code']" as code
| where code < 500
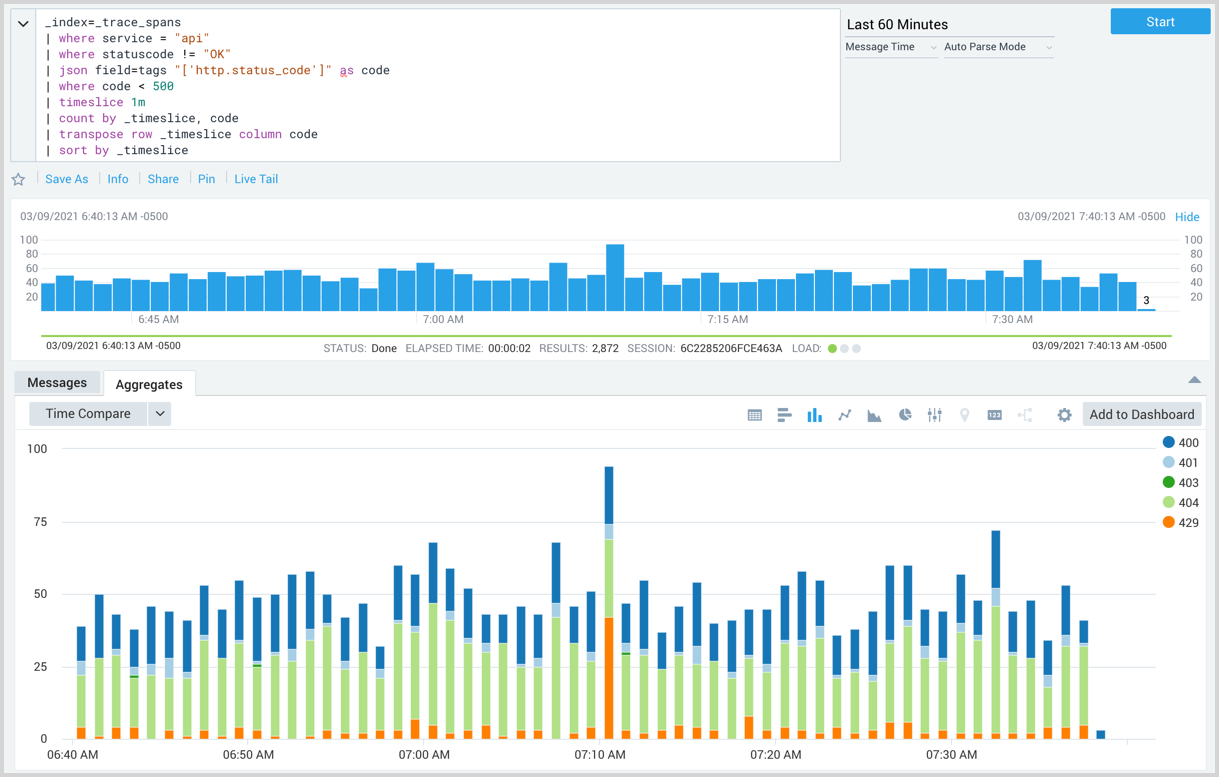
View errors by status over time
To chart the number of errors over one-minute intervals by status code you could run the following query:
_index=_trace_spans
| where service = "api"
| where statuscode != "OK"
| json field=tags "['http.status_code']" as code
| where code < 500
| timeslice 1m
| count by _timeslice, code
| transpose row _timeslice column code
| sort by _timeslice
The column chart displayed in the following screenshot has normal stacking selected.