Cloud SOAR Incident Management and Triage
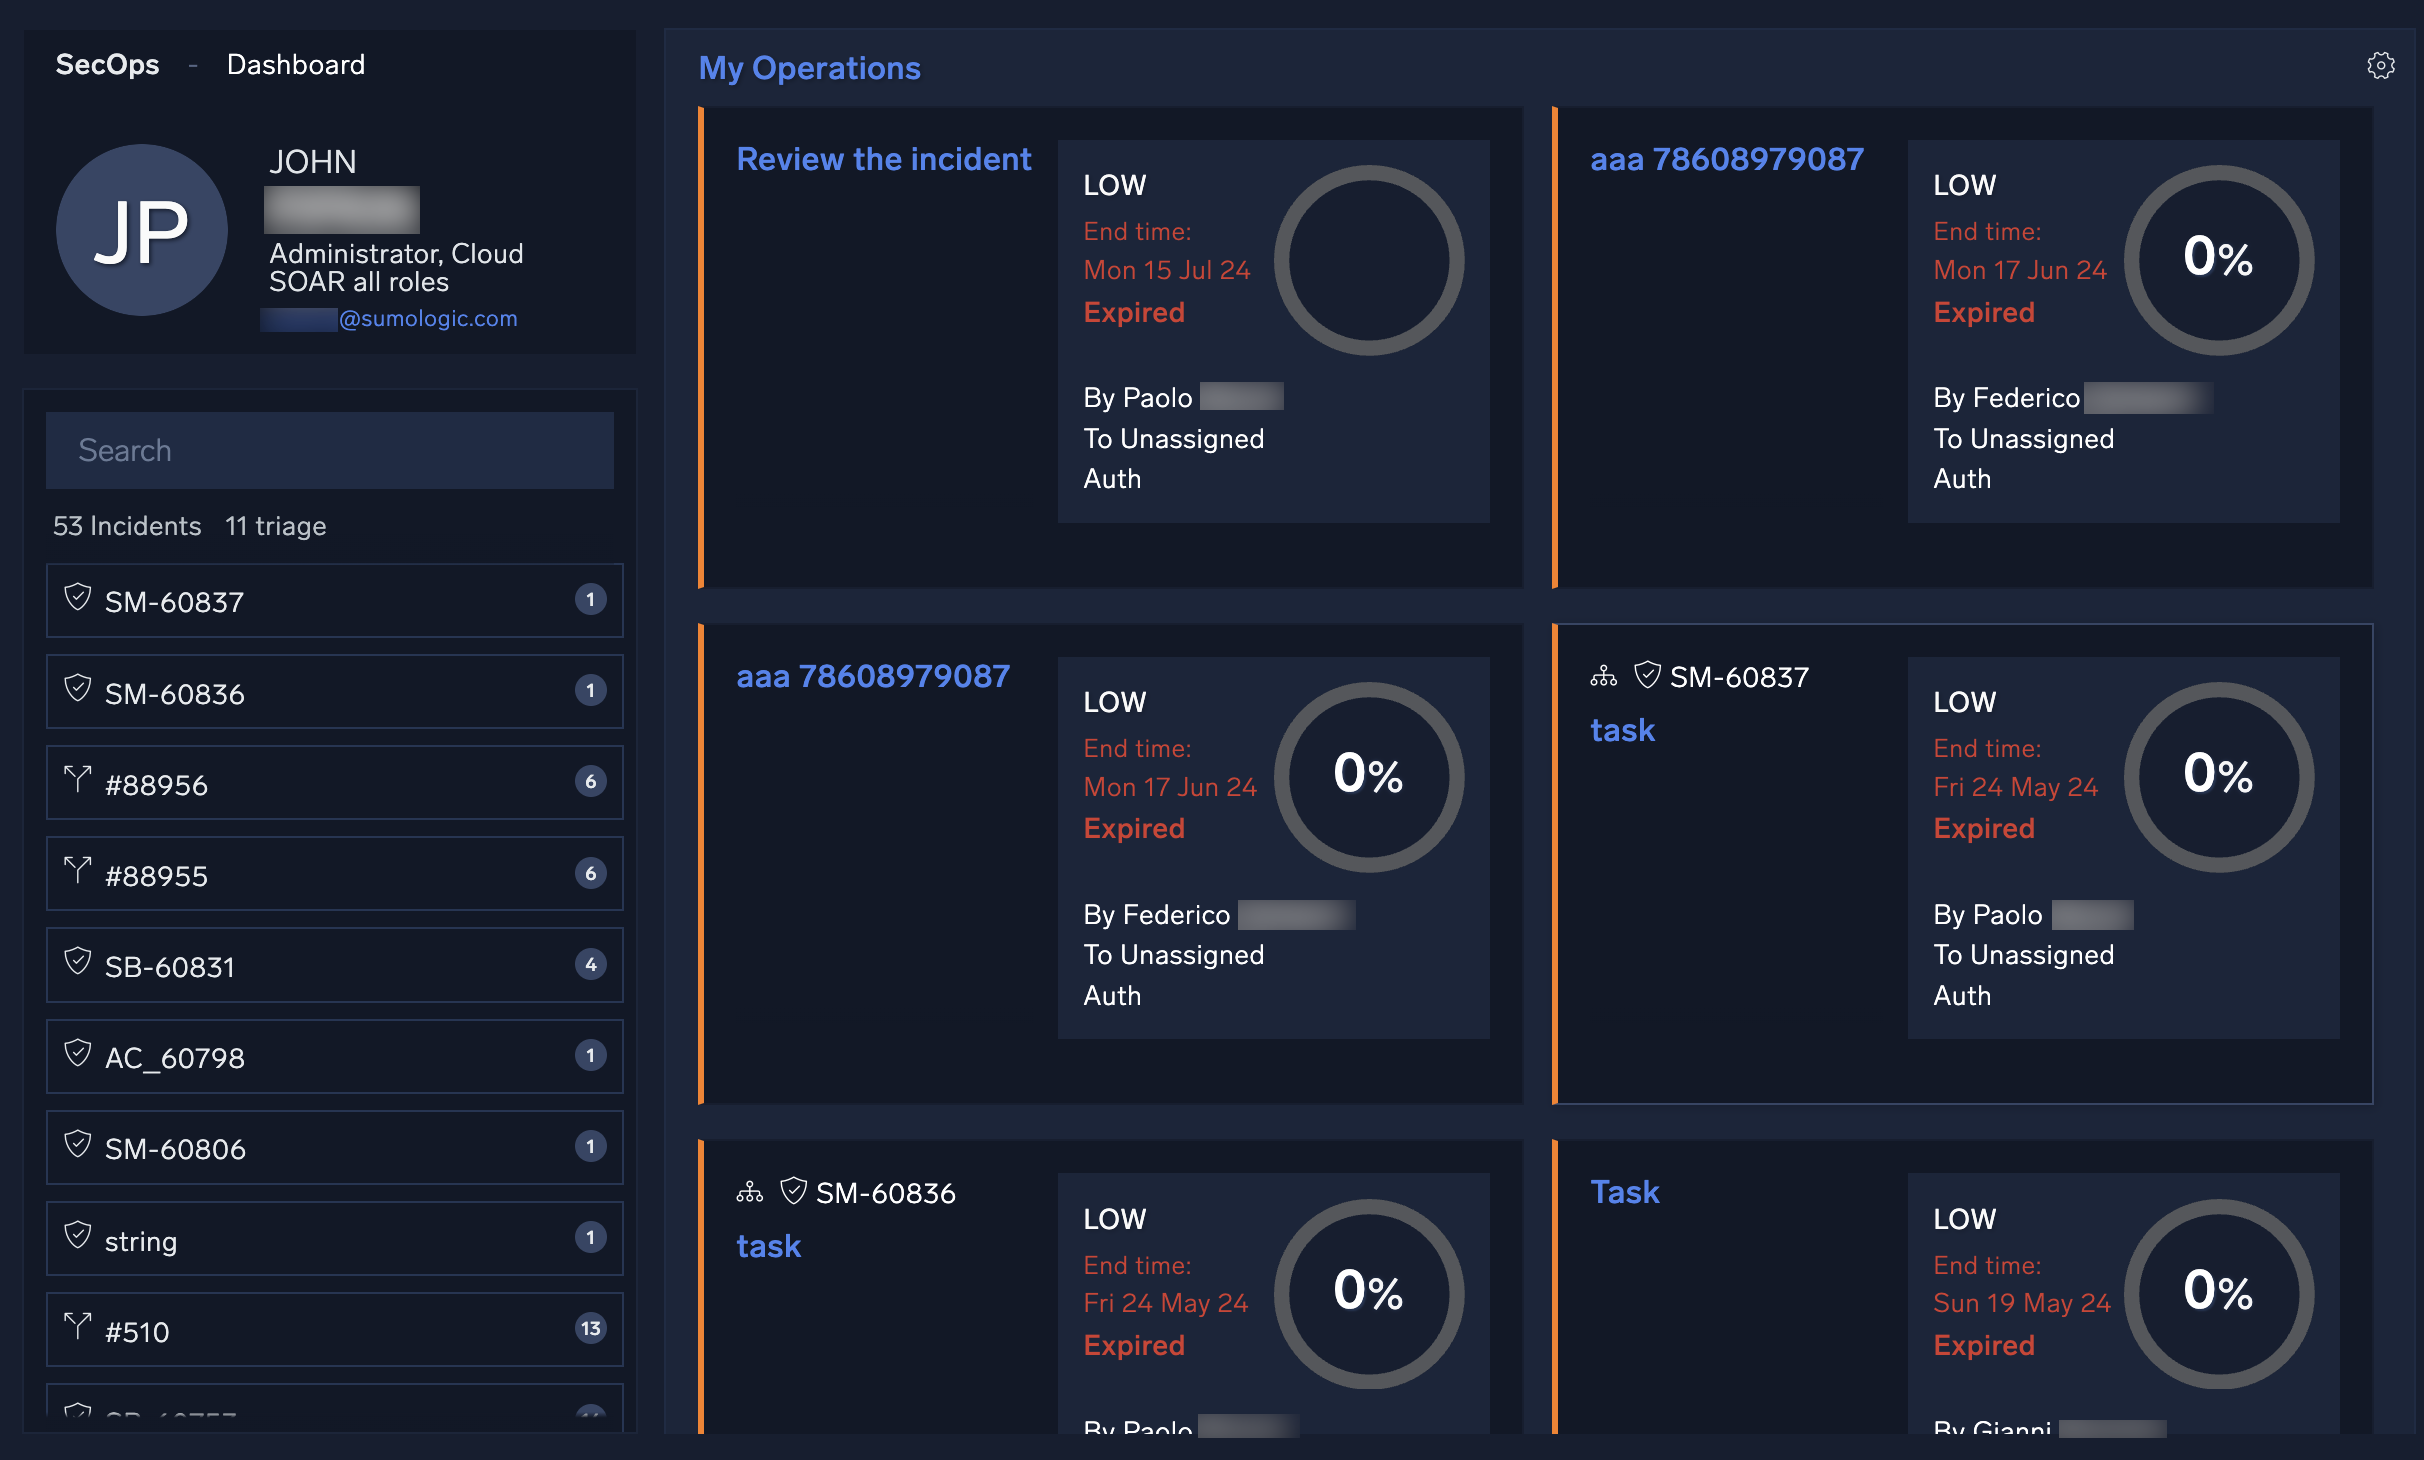
SecOps and Dashboard
New UI. To access the SecOps and Dashboard screens, in the main Sumo Logic menu select Cloud SOAR > SecOps & Dashboard. You can also click the Go To... menu at the top of the screen and select SecOps & Dashboard.
Classic UI. To access the SecOps and Dashboard screens, in the main Sumo Logic menu select Cloud SOAR.
The SecOps screen is where all your current tasks reside. Here you can approve, decline, and close tasks as well as customize this section to display all tasks assigned to a specific user or group.
Select Dashboard in the upper left corner to see dashboards showing your tasks. For more information, see Dashboards.
Incidents
Incidents are events that require investigation and remediation. Incidents are at the heart of Cloud SOAR.
New UI. To access incidents, in the main Sumo Logic menu select Cloud SOAR > Incidents. You can also click the Go To... menu at the top of the screen and select Incidents.
Classic UI. To access incidents, in the main Sumo Logic menu select Cloud SOAR, and then select Incidents at the top of the SecOps screen.
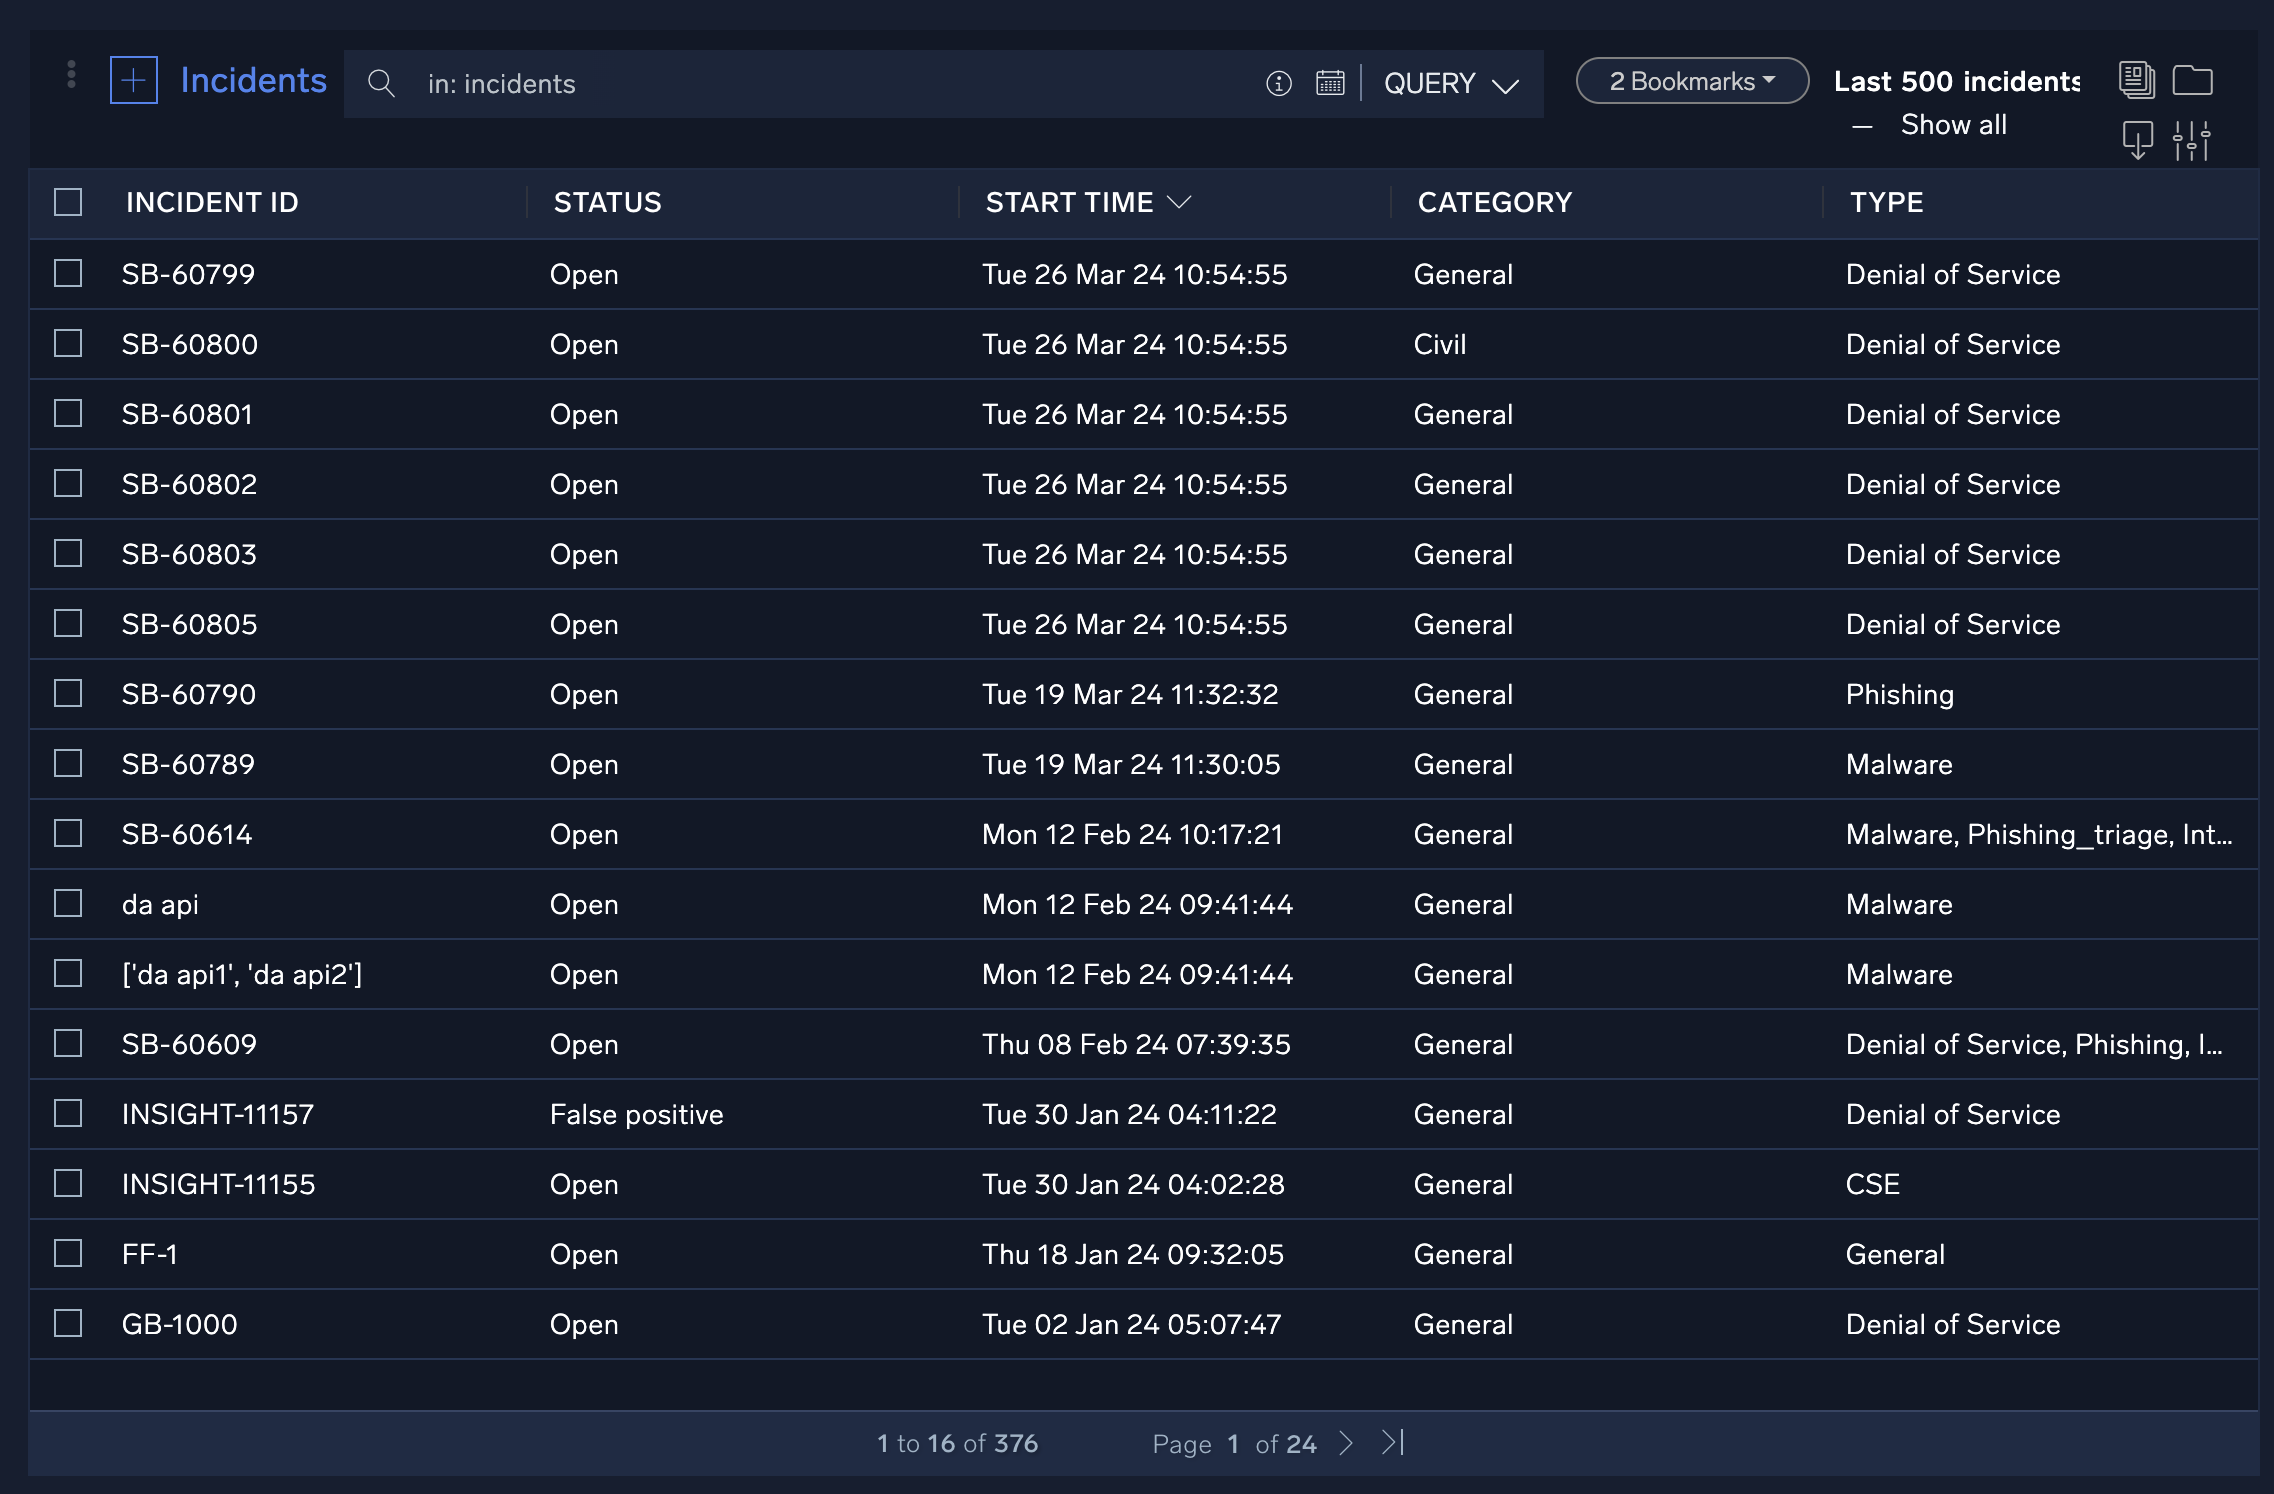
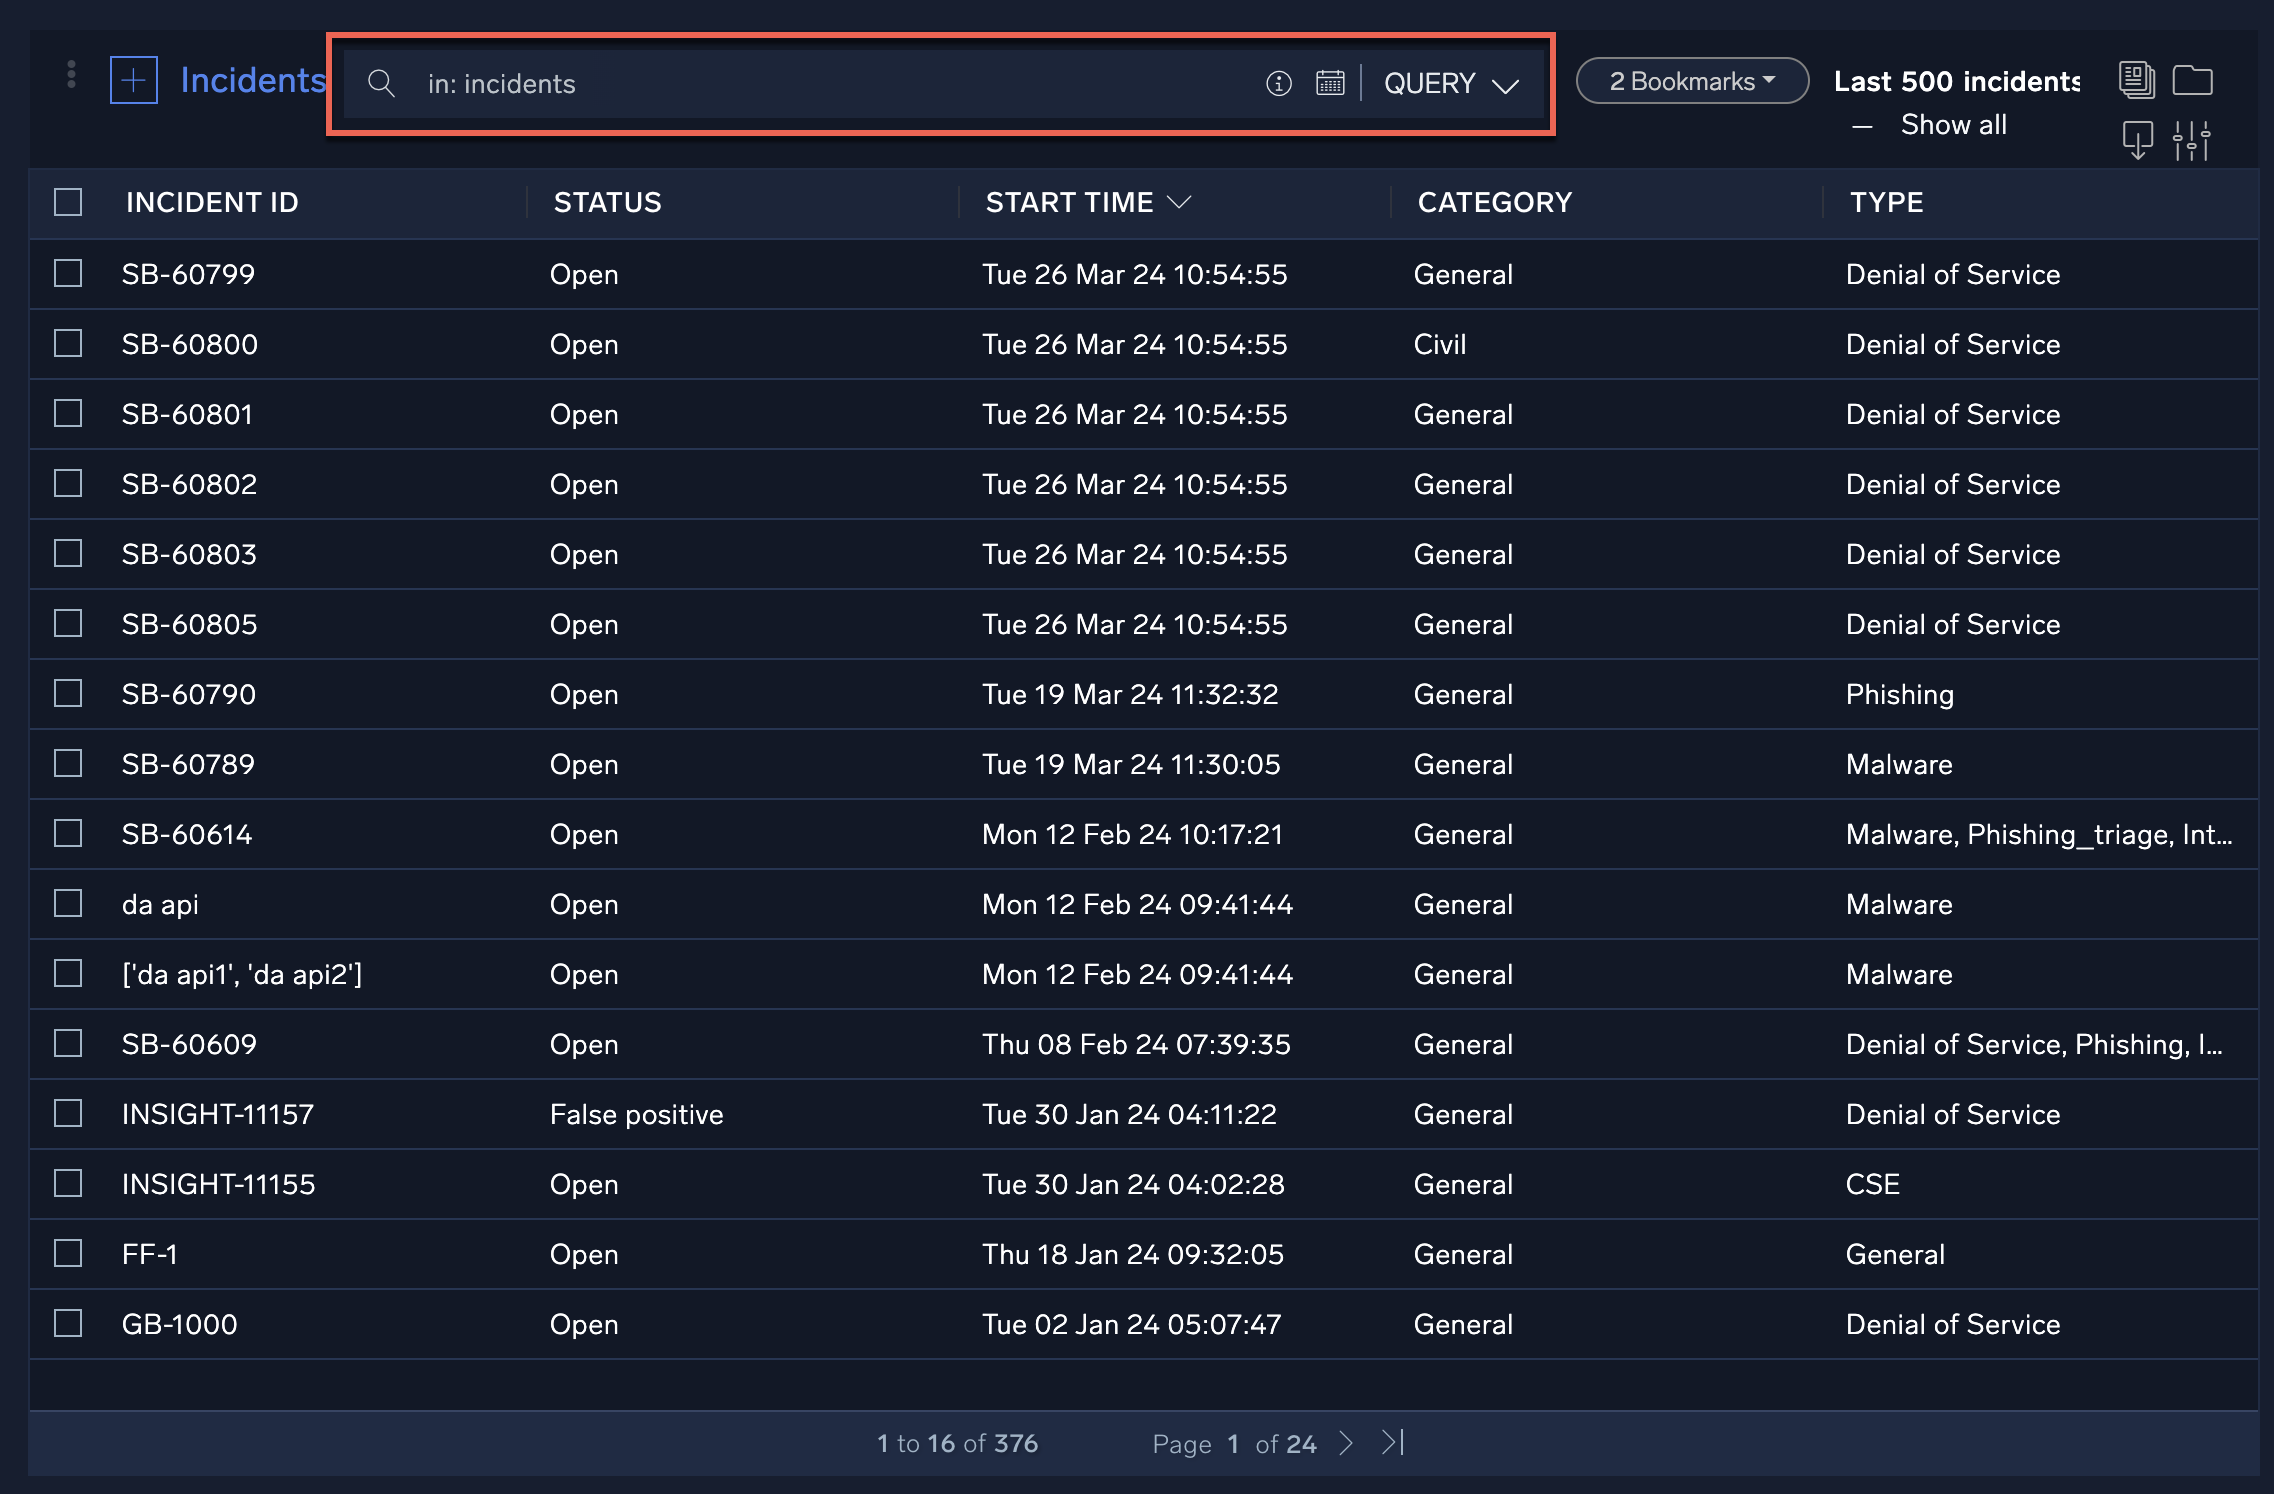
The Incidents screen lists all Cloud SOAR incidents. Clicking on any of the incident IDs will open the incident. You can configure what incidents are displayed by creating queries against available incident data and saving them as incident filters.
The following criteria apply to the incidents list:
- The last 500 incidents are displayed by default.
- When no filters are applied, incidents that are marked as a favorite or not deleted will be displayed.
- When a filter is applied, incidents marked as a favorite or that meet the filter criteria will be shown. Deleted incidents that satisfy either of these conditions will also be displayed.
- If an incident is marked as a favorite, it will be displayed regardless of whether it has been deleted.
- In Show All, all incidents meeting the above criteria will be displayed without the 500-item limit.
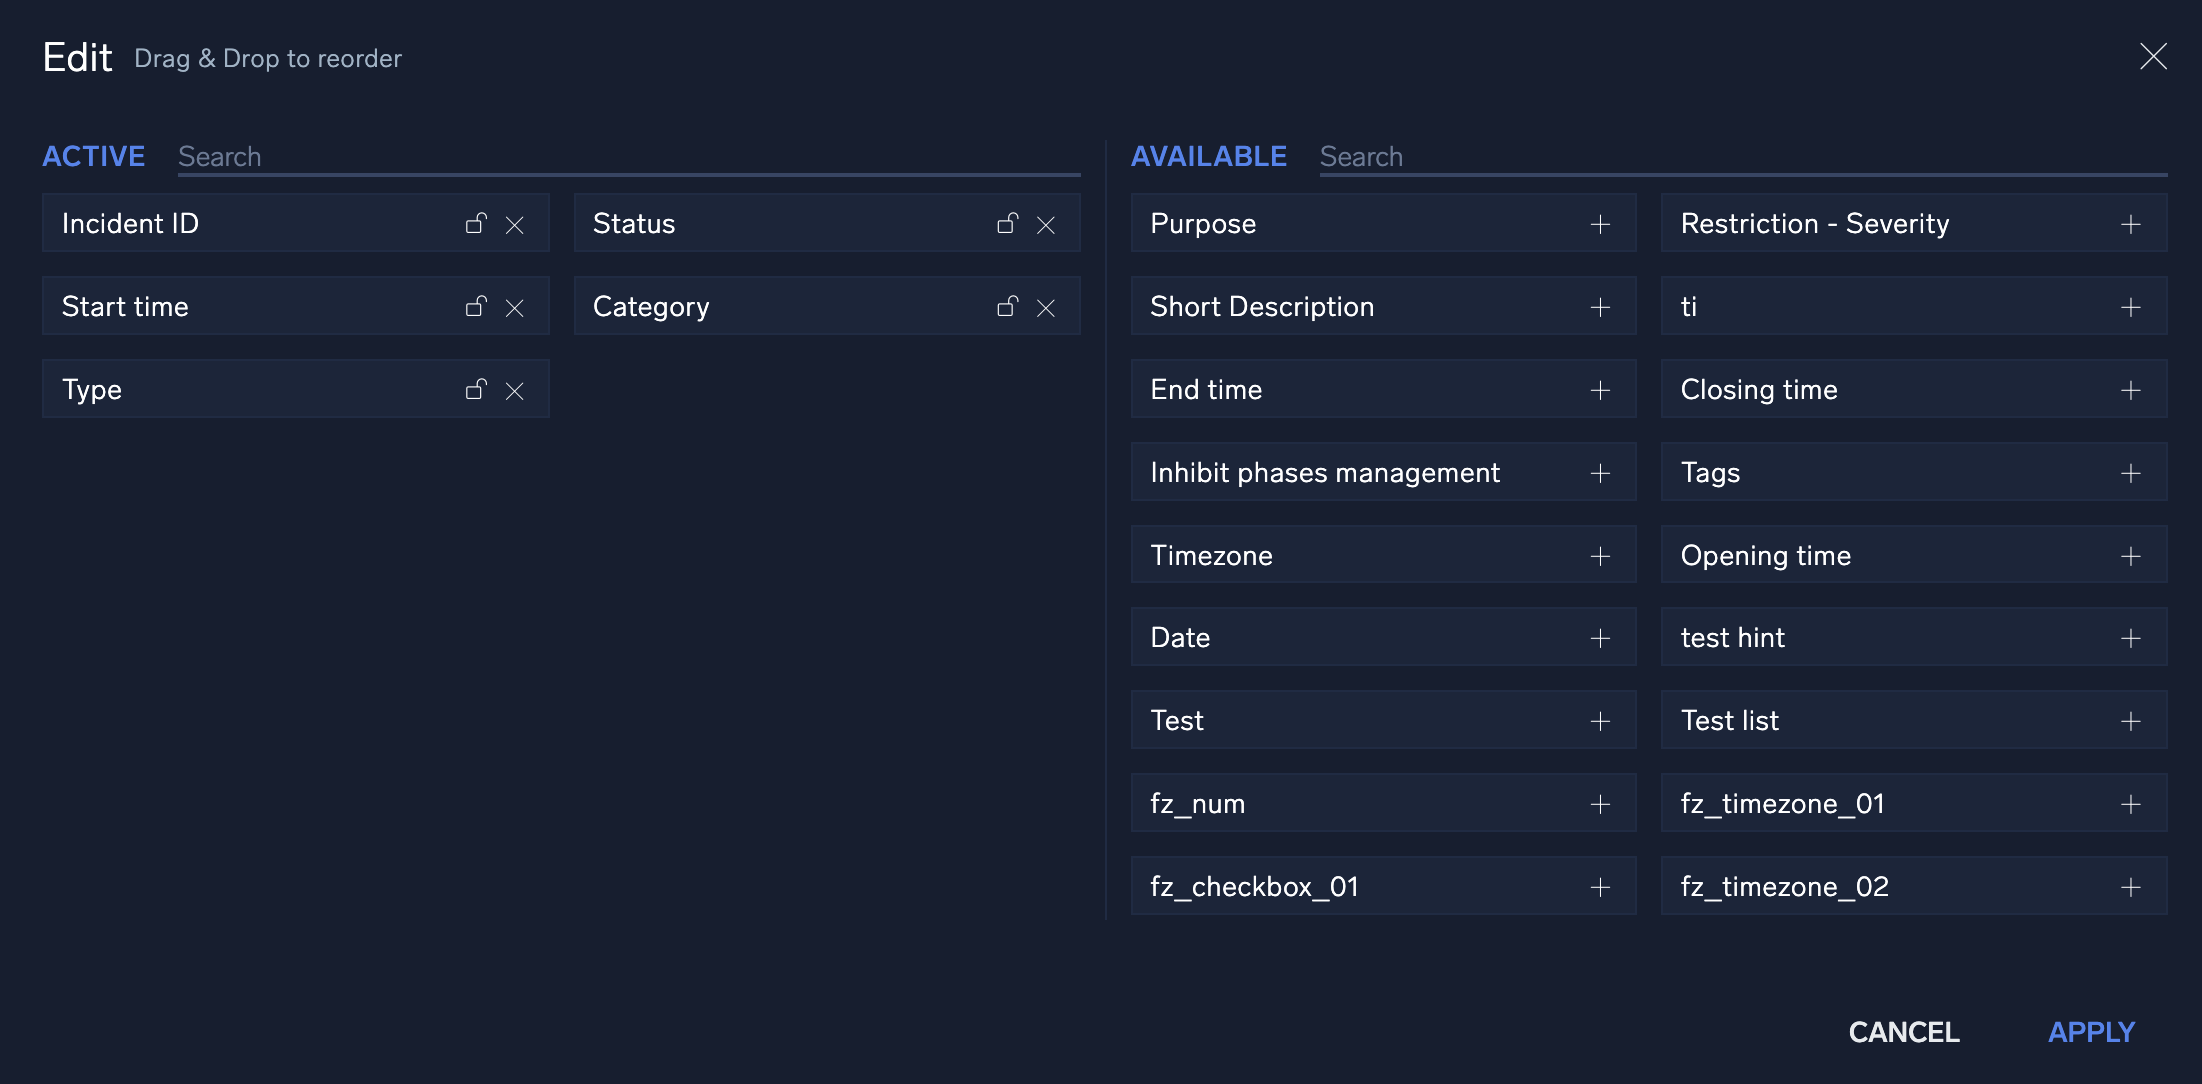
You can configure what data is to be displayed on the Incidents screen by adjusting which columns are viewable. To adjust these columns, click the filter icon ![]() in the top right corner of the screen. This displays a configuration screen that allows you to choose which data is displayed. To change where on the screen it should be displayed, click the + next to the selection and drag and drop it in the order to be viewed. Once you have added and organized the columns, click Apply.
in the top right corner of the screen. This displays a configuration screen that allows you to choose which data is displayed. To change where on the screen it should be displayed, click the + next to the selection and drag and drop it in the order to be viewed. Once you have added and organized the columns, click Apply.
Watch this micro lesson to learn more about incidents in Cloud SOAR.
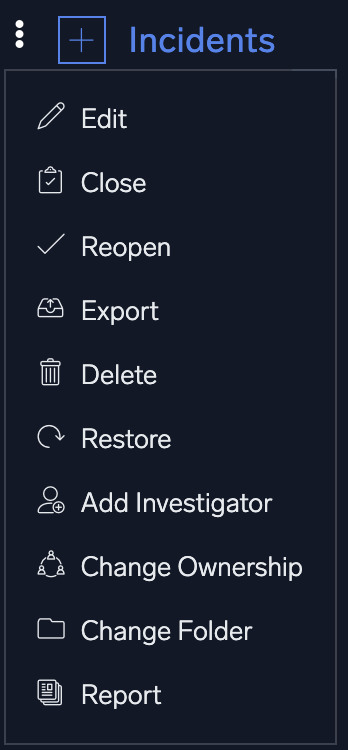
Bulk actions
Bulk actions may be performed on any incidents in the incidents list. To perform bulk actions on incidents, check the incidents you wish to perform the bulk actions on, then click the three-dot kebab menu in the upper left-hand corner of the screen and select the appropriate bulk action from the dropdown menu.
Query incidents
From the Incidents screen you can build queries against existing incidents by typing in the search bar at the top of the screen.
Once a query is committed, it can be saved for future use by clicking the star icon to the right of the search bar. These saved searches will be stored as bookmarks to the right of the search bar.

Cloud SOAR also provides you with a command cheat sheet to help build incident filtering queries. To access the cheat sheet, click on the information icon in the search bar to display the query options.
Following is the content of the cheat sheet.
Operators
+OR operator,AND operator>Greater than<Less than>=Greater or equal to<=Less or equal to!=Not equal to=Equal to
Cross-matching
incident
To perform a simple cross-match search, simply write the keyword you want to search for into the query box. Matches will be found among all the items in the current database.
Exact-matching
"incident" or 'incident'
By wrapping a single or multiple keywords in double or single quotation marks, the given keywords will be searched as an exact matching. Longer or partial hits won't be included in the search results.
Column specification
incident id: keyword
In order to specify a column where the search will be performed, write the name of the column (its name can be found in the headers of the table) followed by the colon symbol : and the keywords you wish to search for.
Time intervals
Time intervals in Sumo Logic Cloud SOAR are preceded by the pound/hashtag sign '#'. Time intervals are meant to be used to express precise time durations, such as '1 day and 15 hours' Time intervals can be expressed in two different forms: shorthanded and explicit.
Shorthanded time intervals
#12 #1 #7 #0
The shorthanded form can only be used to express a time interval in hours. Following the pound/hashtag sign, include the amount of hours you wish to consider in your search. The time intervals written above mean the following: #12 indicates the last twelve hours, #1 the last hour, #7 the last seven hours. #0 is a special case as it stands for "now" or "in this moment".
Explicit time intervals
#[1H 3D] #[4D 3W] #[1H 1Y] #[0D]
#[1H 3D] indicates a time period of three days and one hour, #[4D 3W] indicates three weeks and four days, #[1H 1Y] indicates one year and one hour. The last case #[0D] is identical to the shorthand form #0, indicating the present time when you are writing our search query. Note that #[0D], #[0H], #0 or #[0Y] all express the same thing.
#|1H| #|3D 2M| #|1H 2D| ...
Time intervals can also be wrapped between pipes | instead of square brackets in order to indicate their absolute value.
Date and time
incident id: Test Incident OR incident id: Real Incident
incident id: Test Incident + incident id: Real Incident
Date and time, expressed in human-friendly formats can be input by using the date and time modal next to the filter bar. Their format will be automatically inherited from the general settings of Sumo Logic Cloud SOAR, so any kind of date-time format will be accepted.
As for date-time formats featuring letters such as the one in this example: Thursday 30 April 2020 they will generally be converted into UTC date: 2020-04-30
UTC dates are expressed in the format YYYY-MM-DD. As for time, it's expressed into the following formula, when in UTC: HH-MM. Hours will be expressed in a 24h format. Note that when manually writing dates and time in queries, remember to follow the format that has been set in the general options, as it will be parsed accordingly to it.
Logical disjunction
incident id: Test Incident OR incident id: Real Incident
incident id: Test Incident + incident id: Real Incident
The logical disjunction operator OR can also be typed as a plus sign +. Sumo Logic Cloud SOAR will automatically convert it into OR and highlight it in light blue in order to differentiate it from the rest of the search query. The OR operator is used to express whether a given collection of items we are looking for satisfies one condition or the other. In the example, above, our collection of items have to satisfy the condition of having "Test Incident" OR 'Real Incident' as their incident ID.
Logical conjunction
incident id: Test Incident AND status: Open
incident id: Test Incident , status: Open
The logical disjunction operator AND can also be typed as a comma sign ,. Sumo Logic Cloud SOAR will automatically convert it into AND and highlight it in light blue in order to differentiate it from the rest of the search query. The AND operator is used to express whether a given collection of items we are looking for satisfies both the described conditions. In the example above, our collection of items have to satisfy the condition of having "Test Incident" AND being open, as shown by the query status: Open.
Comparison operators
> greater than, < less than, and != different than
These operators are used most typically with dates and time intervals, but their usage with alphabetic characters is also allowed. They are inequality symbols that express some kind of difference between two values. Some examples of their use can be:
Incident id > m
numeric_value > 30
The inequality operator != can also be expressed with the alternative form: '<>'
= Equality operator
The equality operator is used to express equality between two values, and can be chained to other comparison operators to create more complex operators, namely: >= greater or equal and <= less than or equal`.
In addition to that, it can also be used to express exact matching with the following value, becoming an alternate version for the quotes, as follows: Incident Id = test is equal to Incident Id: "test" and Incident Id: 'test'.
Add investigators
Investigators are users who are involved in incidents and have access to perform operations on the incidents and view the incident data. To be able to add investigators to incidents, you must be assigned the Manage Investigators Cloud SOAR role capability.
To add investigators to incidents:
- New UI. In the main Sumo Logic menu, select Cloud SOAR > Incidents. You can also click the Go To... menu at the top of the screen and select Incidents.
Classic UI. At the top of the screen, click Incidents. - Check the incidents you want to add investigators to.
- Click the three-dot kebab menu in the upper left-hand corner of the screen.
- Select Add Investigator.
The Add Investigator screen is displayed.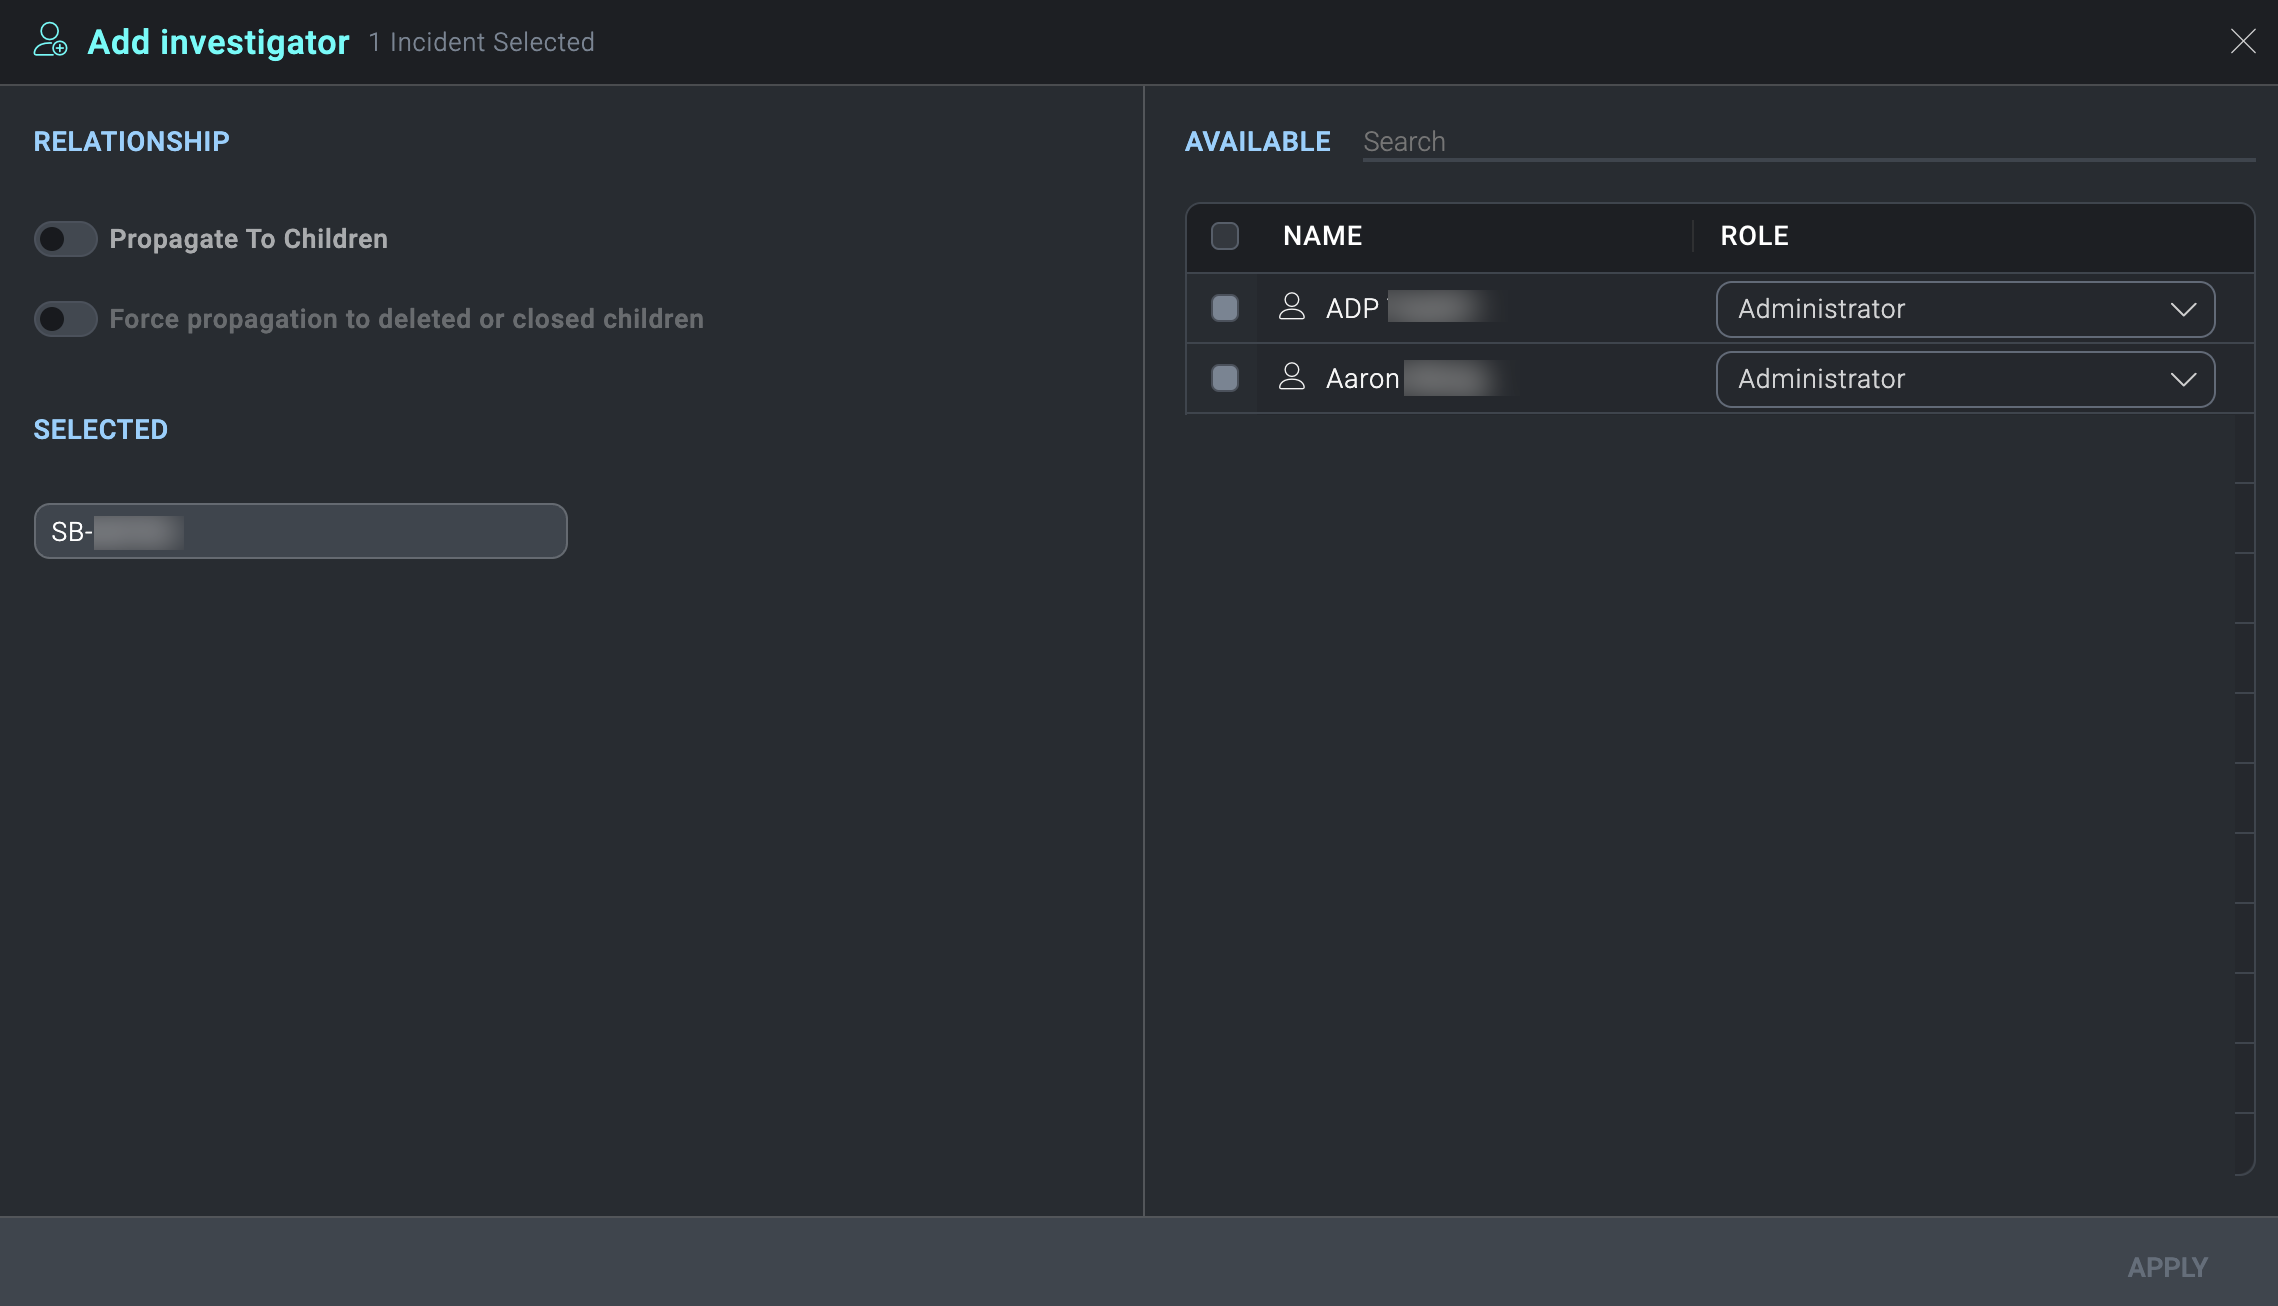
- Select the investigators to add to the selected incidents.
info
You can also select groups in addition to selecting individuals. For more information, see Groups.
- In the Role column, select the role assigned to the users that you want them to have as investigators. For example, select Analyst, Administrator, or some other role. The roles must have the appropriate Cloud SOAR role capabilities that you want them to have as investigators of the incidents. (If you are selecting a group as an investigator, you cannot change the group's assigned role here. You can only change the group's role on the group itself.)
- Click Apply.
View investigators assigned to an incident
- New UI. In the main Sumo Logic menu, select Cloud SOAR > Incidents. You can also click the Go To... menu at the top of the screen and select Incidents.
Classic UI. At the top of the screen, click Incidents. - Select an incident. The investigators appear in the Investigators widget.
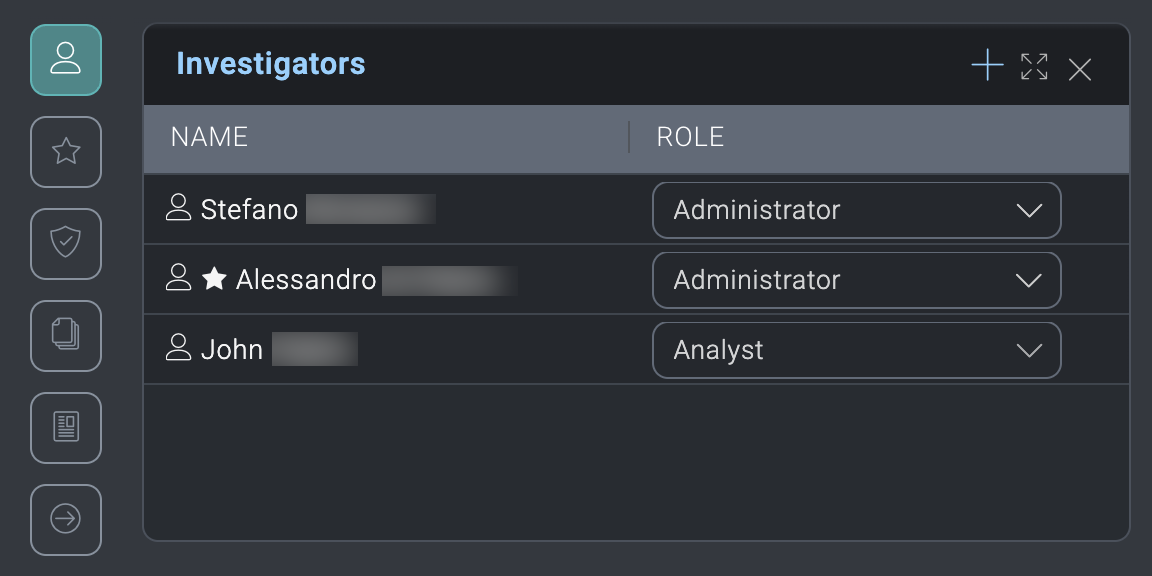
- To add another investigator to the incident, click the + icon in the upper-right of the dialog.
- To remove an investigator from the incident, hover your mouse over the investigator name and click the trash can icon that appears to the right.
- To change the role an investigator has for the incident, in the Role column select the role assigned to the user that you want them to have as an investigator.
Investigator roles
When you add an investigator to an incident, you select the role assigned to the users that you want them to have as an investigator. The selected role must have the appropriate Cloud SOAR role capabilities that you want the investigator to have to be able to effectively investigate the incident.
For example, an incident contains sensitive data in the notes section. If you want the investigators on the incident to be able to access the notes data, the investigators you assign to the incident must have the Note > Access Cloud SOAR role capability assigned to their role.
To allow users to access incidents without being added as investigators, assign them the Incident > Access all role Cloud SOAR role capability. This privilege is useful for users who need to monitor all incidents.
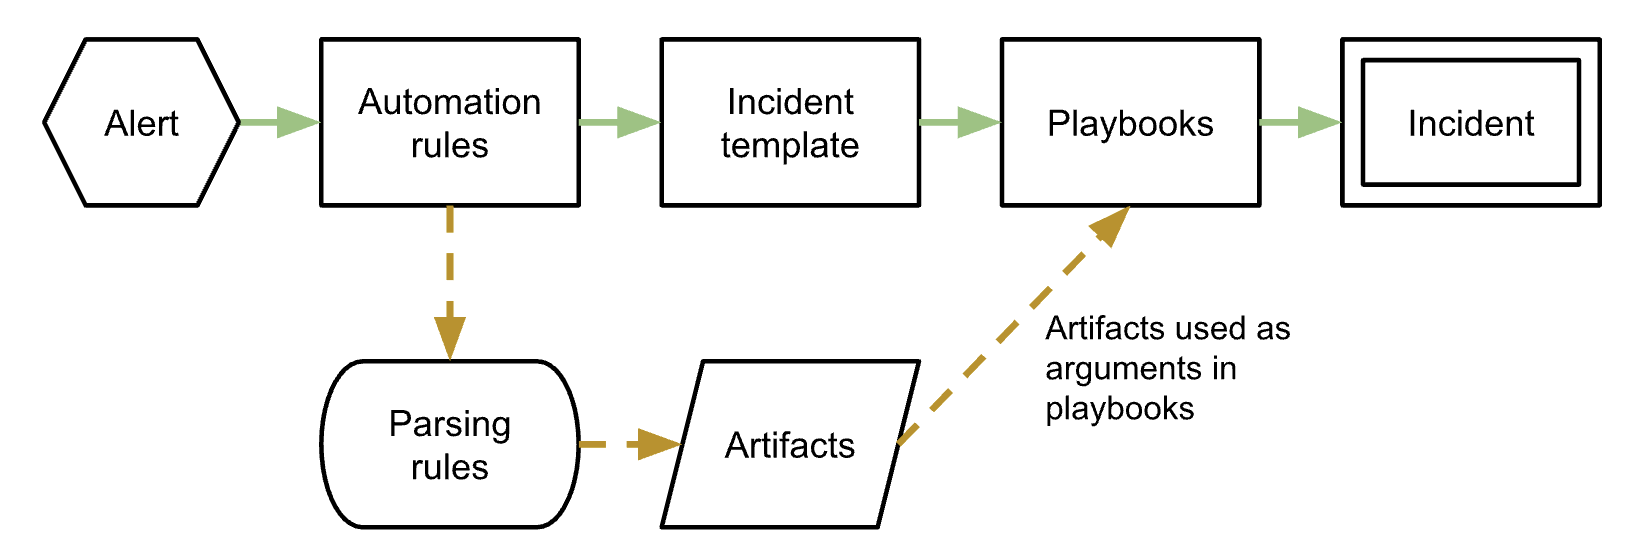
Incident generation
Automatically generate incidents
Cloud SOAR generates incidents with an automated process:
- An alert is received by Cloud SOAR via an integration.
- Automation rules process the alert. Behind the scenes, parsing rules break out the data into artifacts to be used as arguments in playbooks, such as IP addresses, usernames, host names, and so on.
- The data is fed into an incident template.
- Playbooks run against the data.
- Cloud SOAR generates an incident.
Create a new incident manually
- To create an incident manually, click the + button at the top of the Incidents screen.
- A new configuration box will be displayed that contains fields an investigator can utilize to develop their incident. Not all these fields are mandatory. The ones that are required will have an asterisk (
*) marked next to them which indicates the field has a dependency within the Cloud SOAR platform. These required fields can have their dependencies and requirements adjusted with custom fields.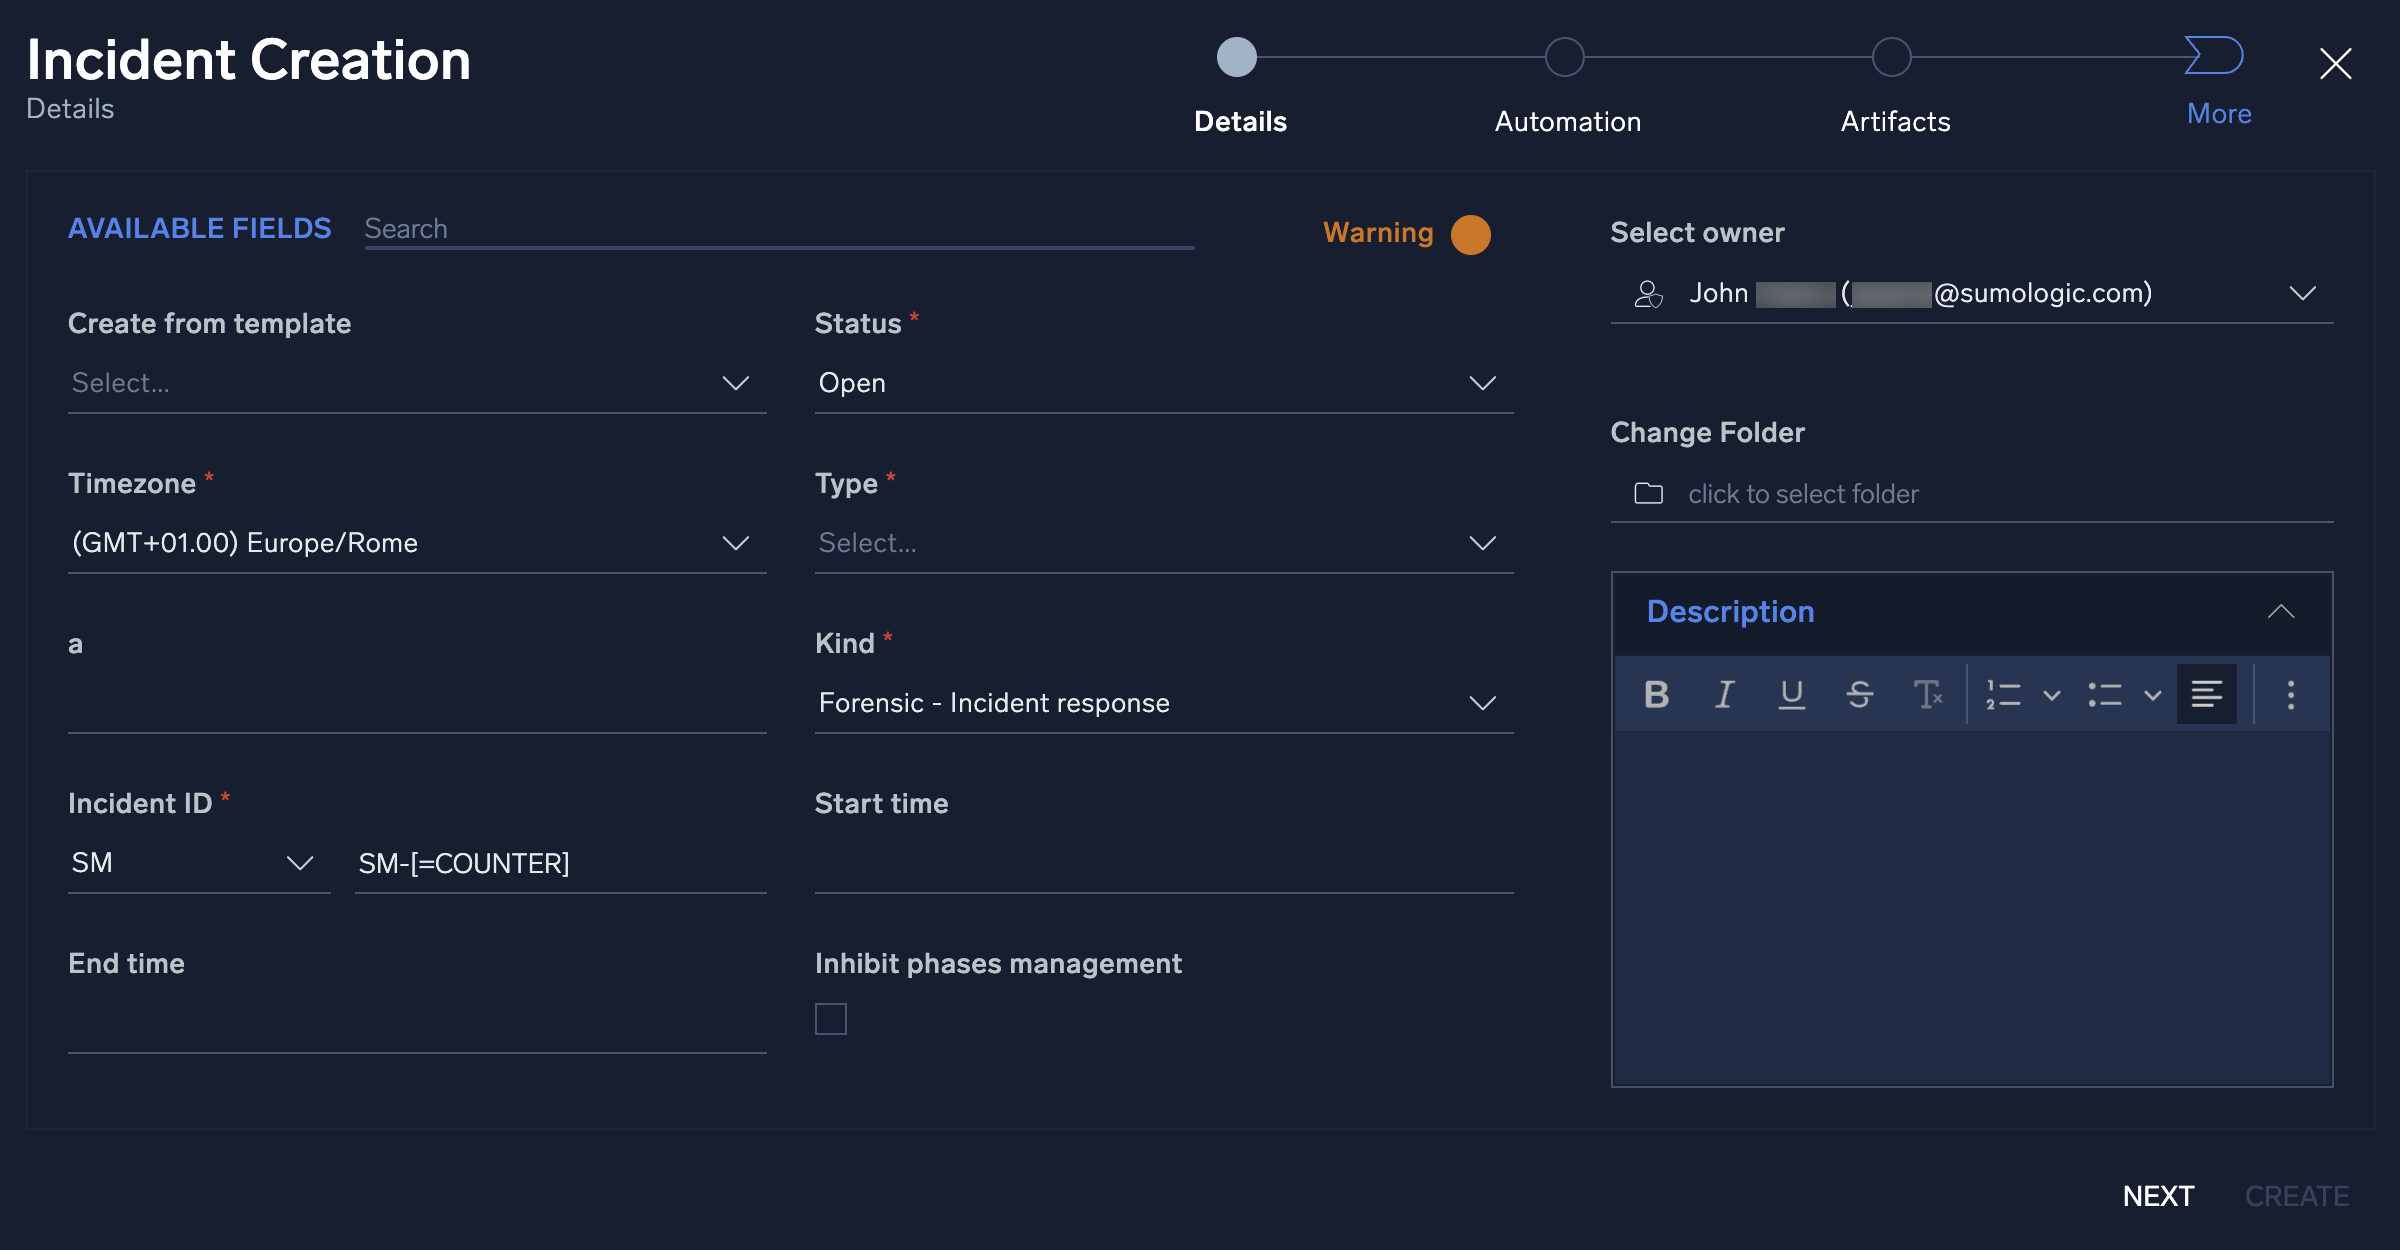
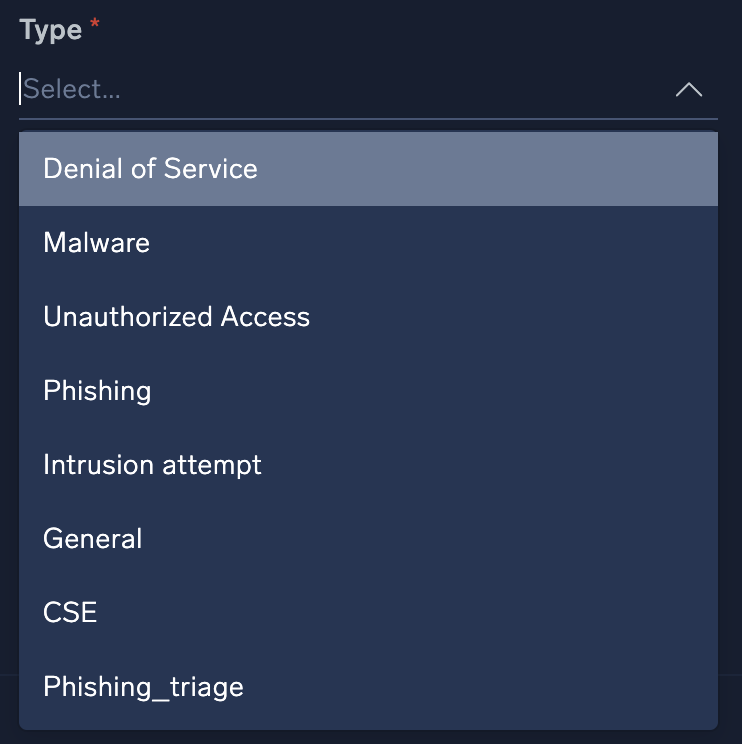
- One of the most important fields is the Type field. This field will dictate which playbooks will be recommended later on in the configuration process. See custom fields to modify the variables displayed in the Type field.
- Click Next.
- Once you complete the Details page, you will want to assign appropriate playbooks to be associated with the incident. In addition to adding playbooks to the incident, you can also decide whether you want the playbook to automatically execute upon incident creation by sliding the Autorun button to On.
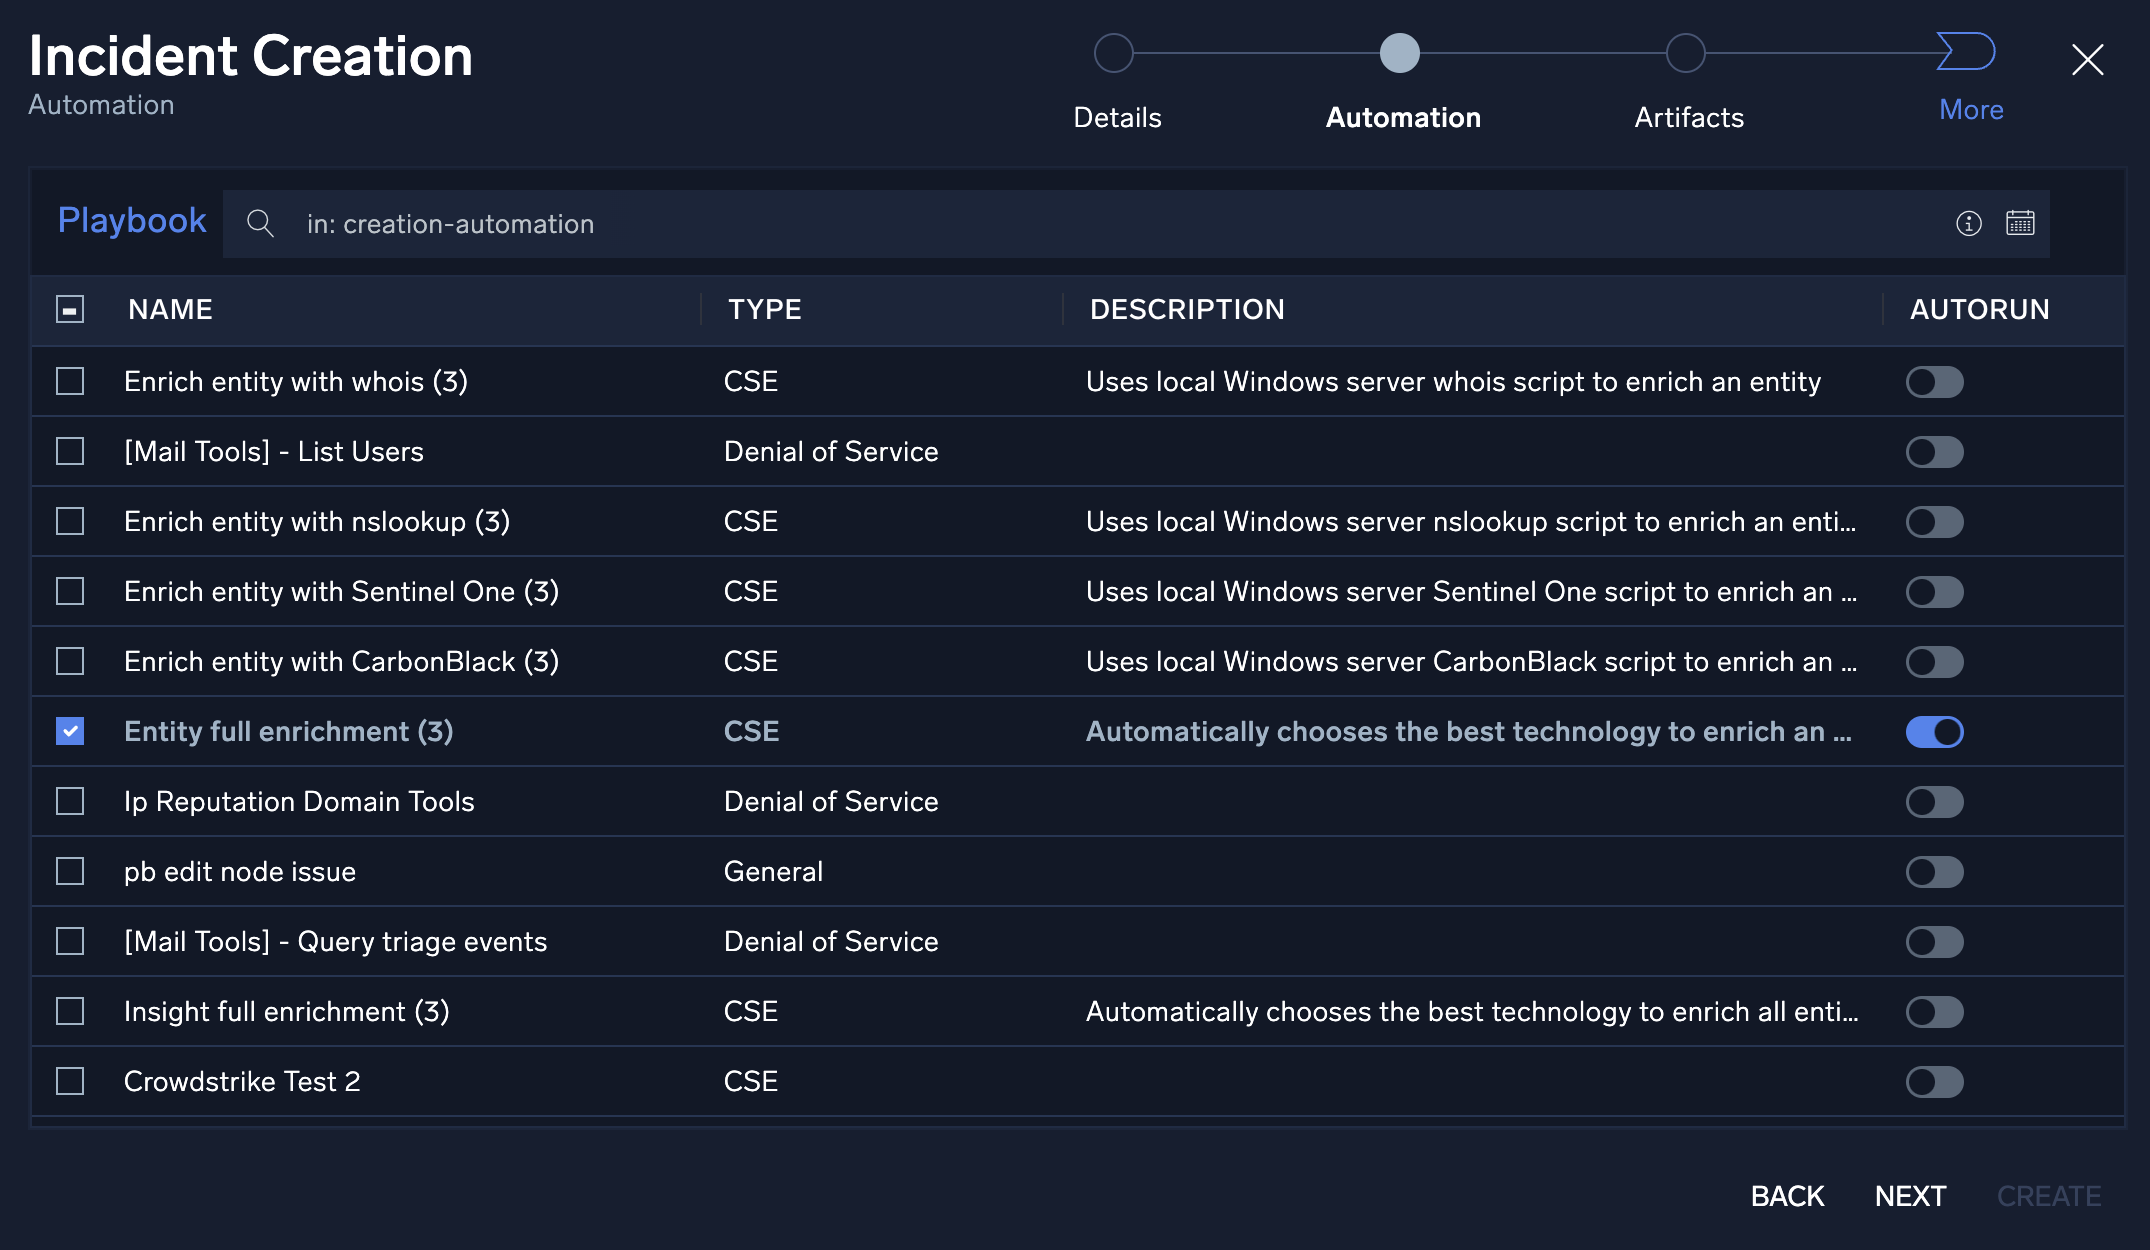
- Click Next.
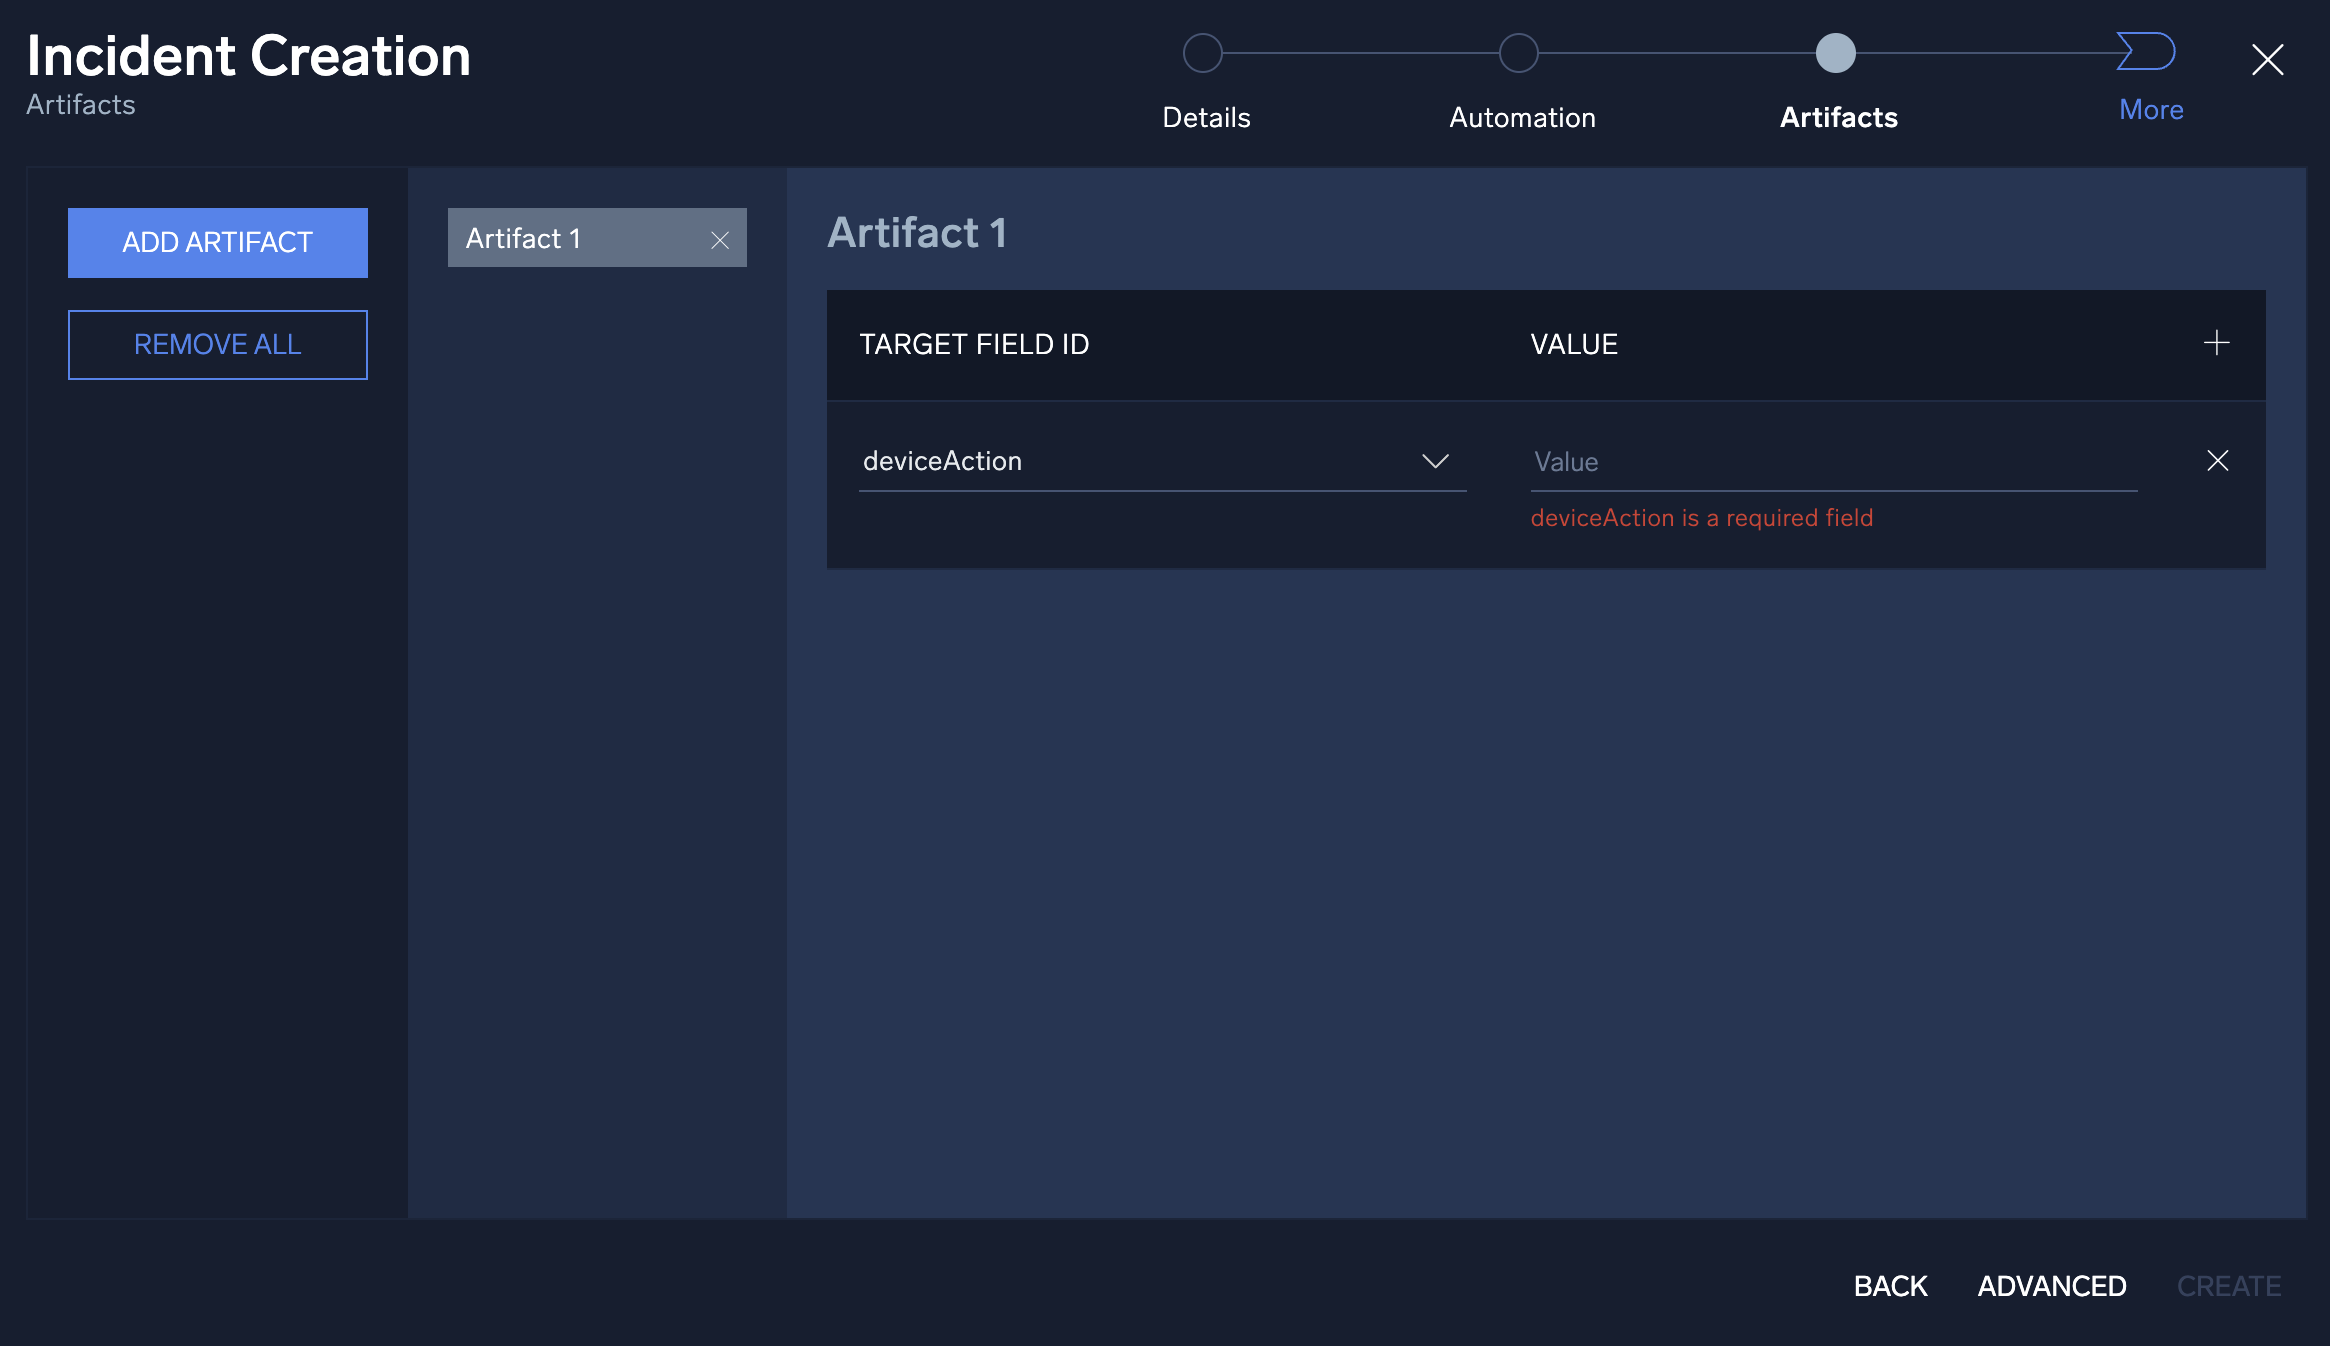
- The investigator may already have artifacts that they would like to add to the incident. The Artifacts section allows for the manual entry of new artifacts. To add a new artifact, click Add Artifact and choose what target field to append the data and add its value. Once completed, click Next.
- Click Next.
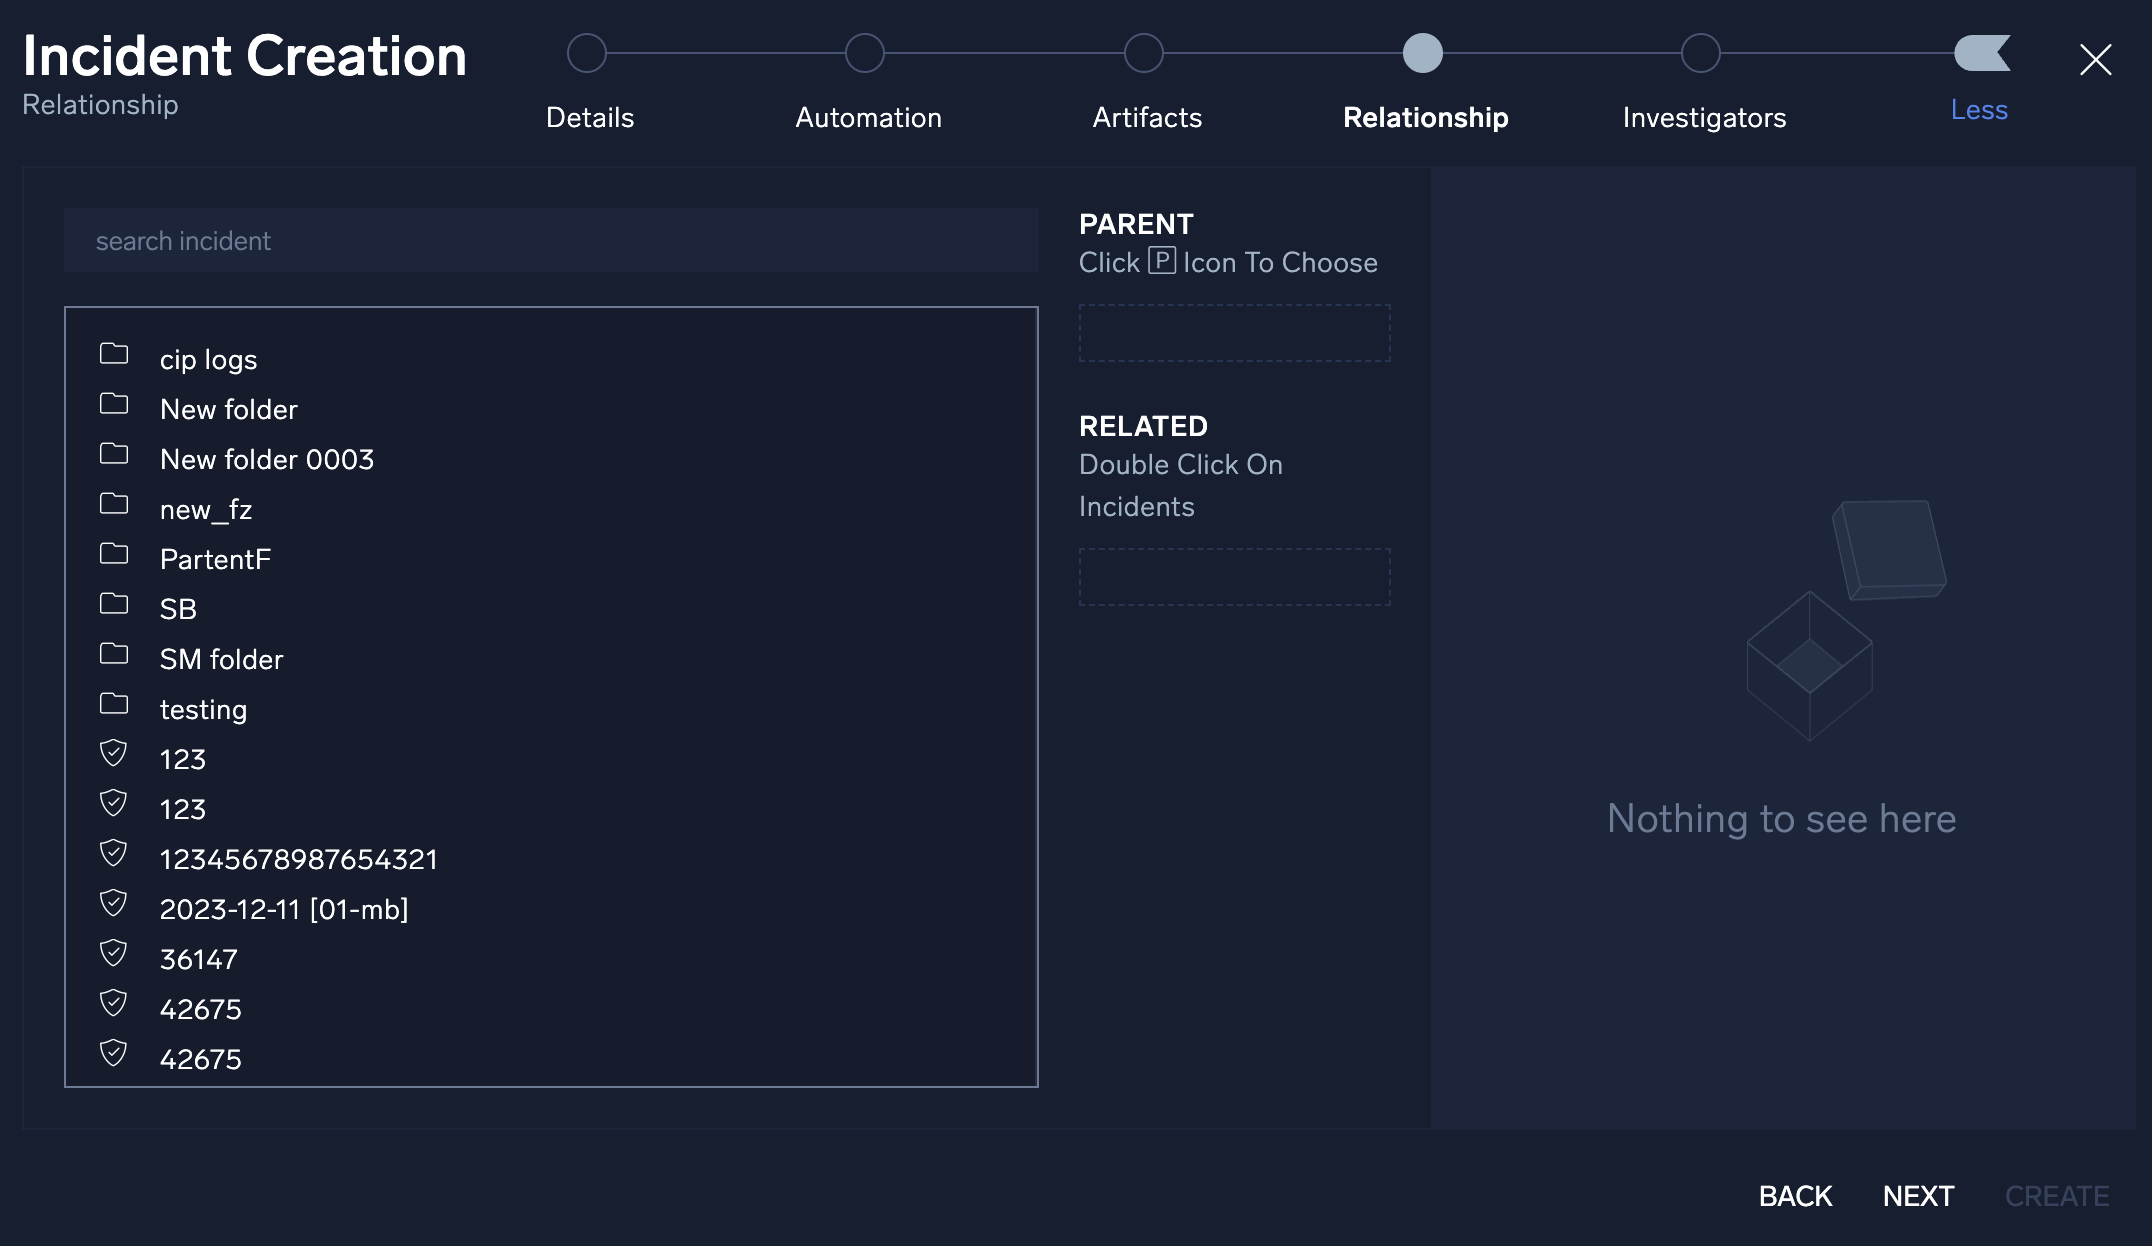
- You have the option to create manual parent/child relationships between the new incident and any previous incident created in Cloud SOAR. Click the Advanced button at the bottom of the screen to select an existing incident to group together.
- Click Next.
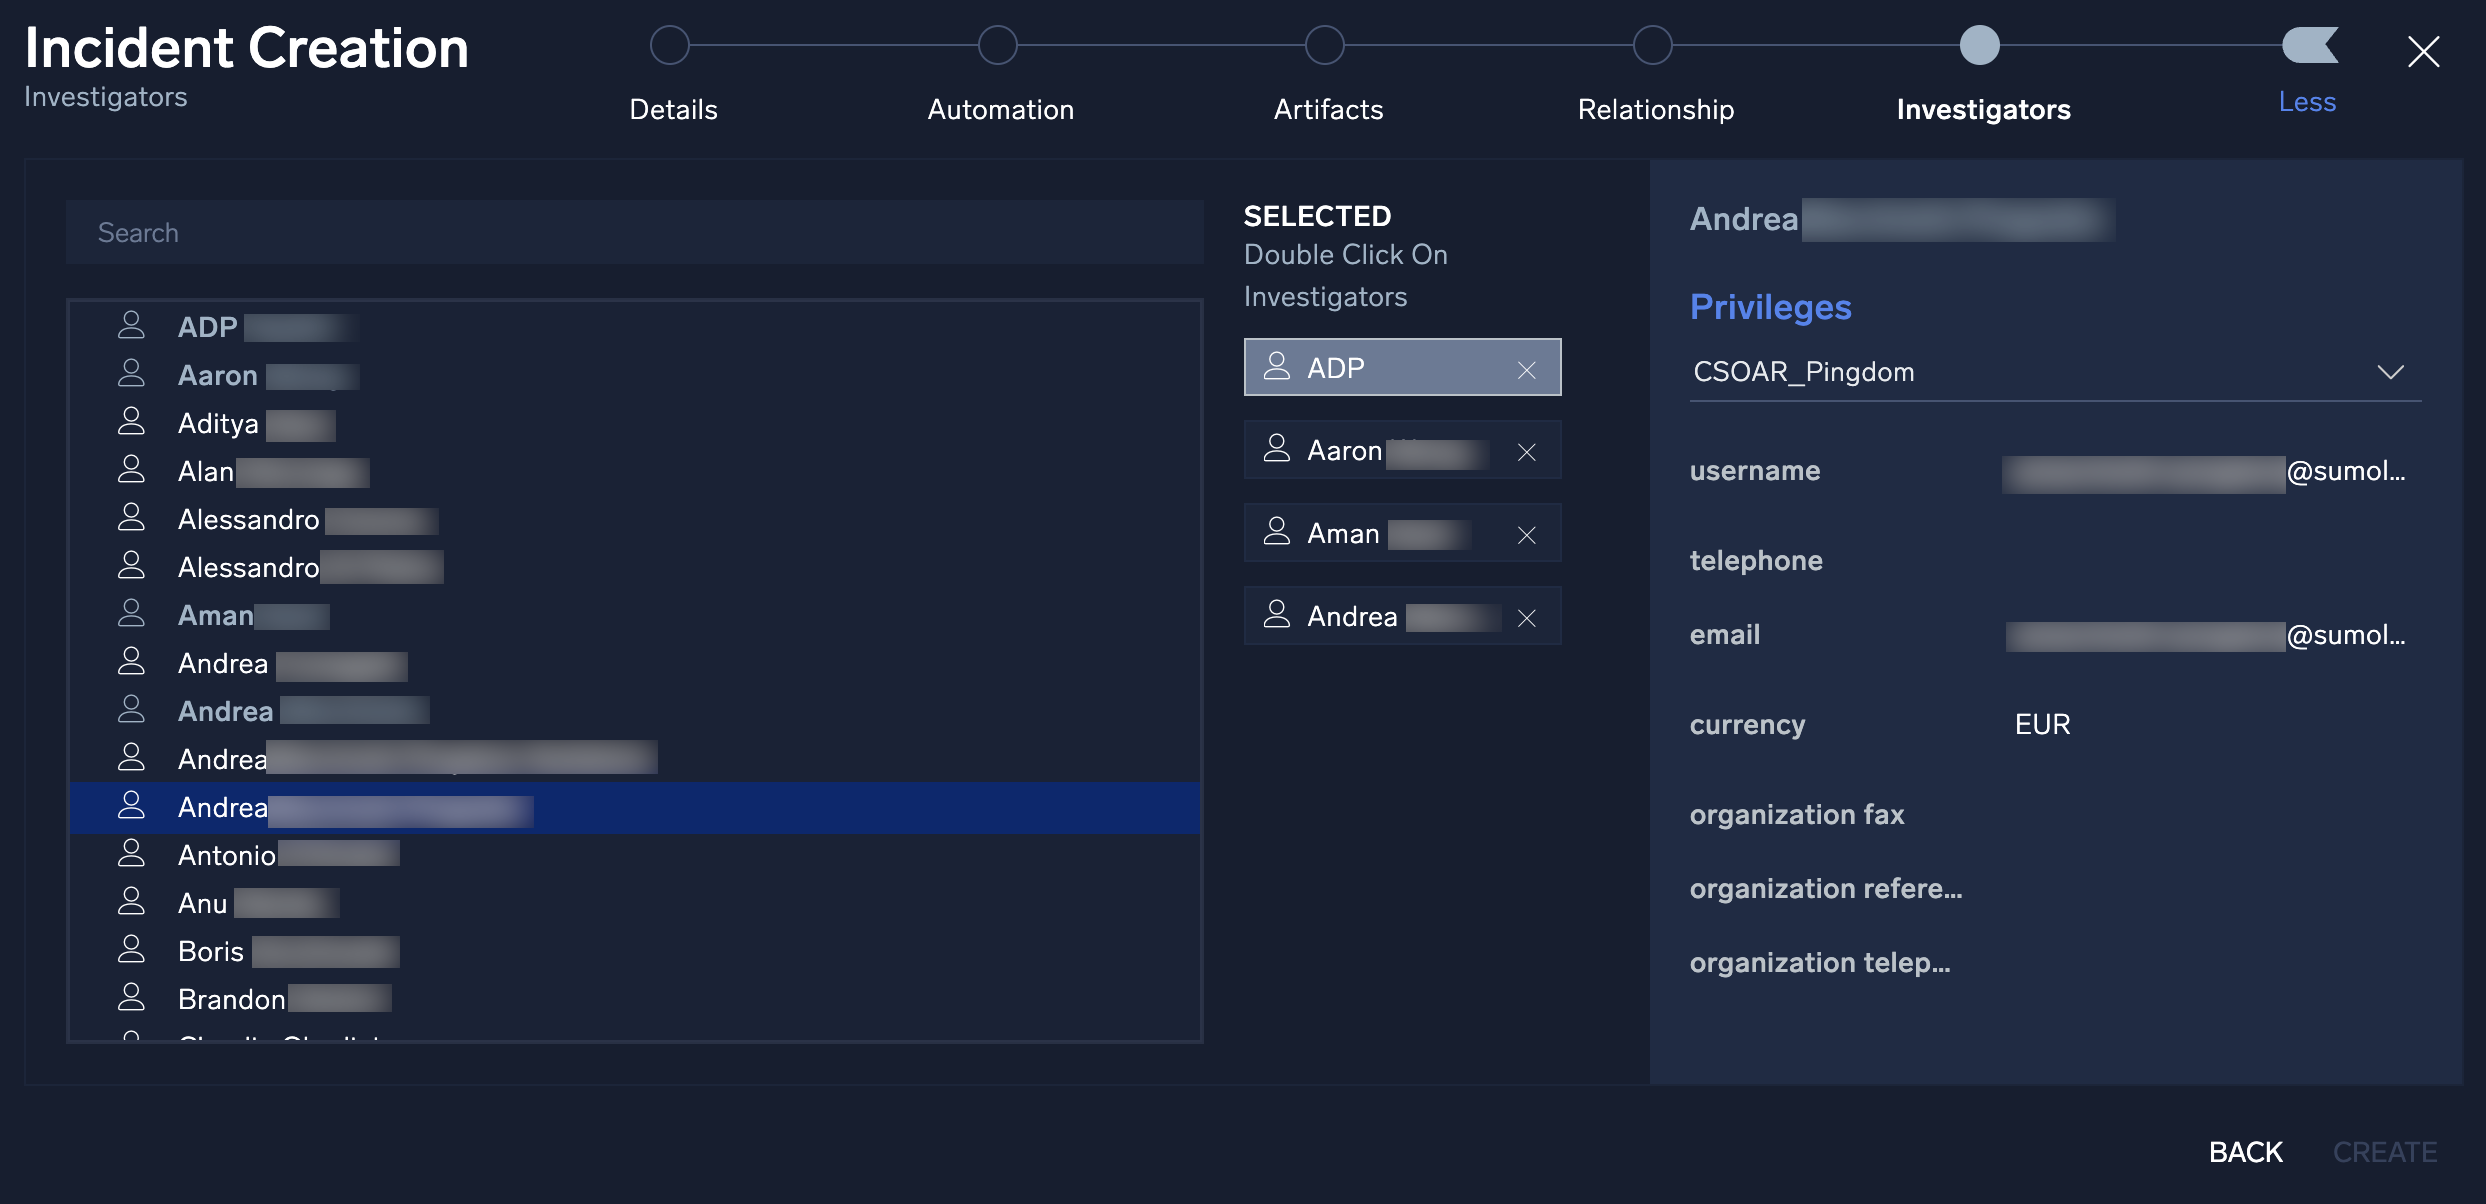
- The final step in manual incident creation is to add an investigator or a group of investigators to the incident. Select an investigator or group from the left side of the screen by double-clicking on their name and the investigator will be added to the investigators pane.
- Once finished, click Create.
Incident details
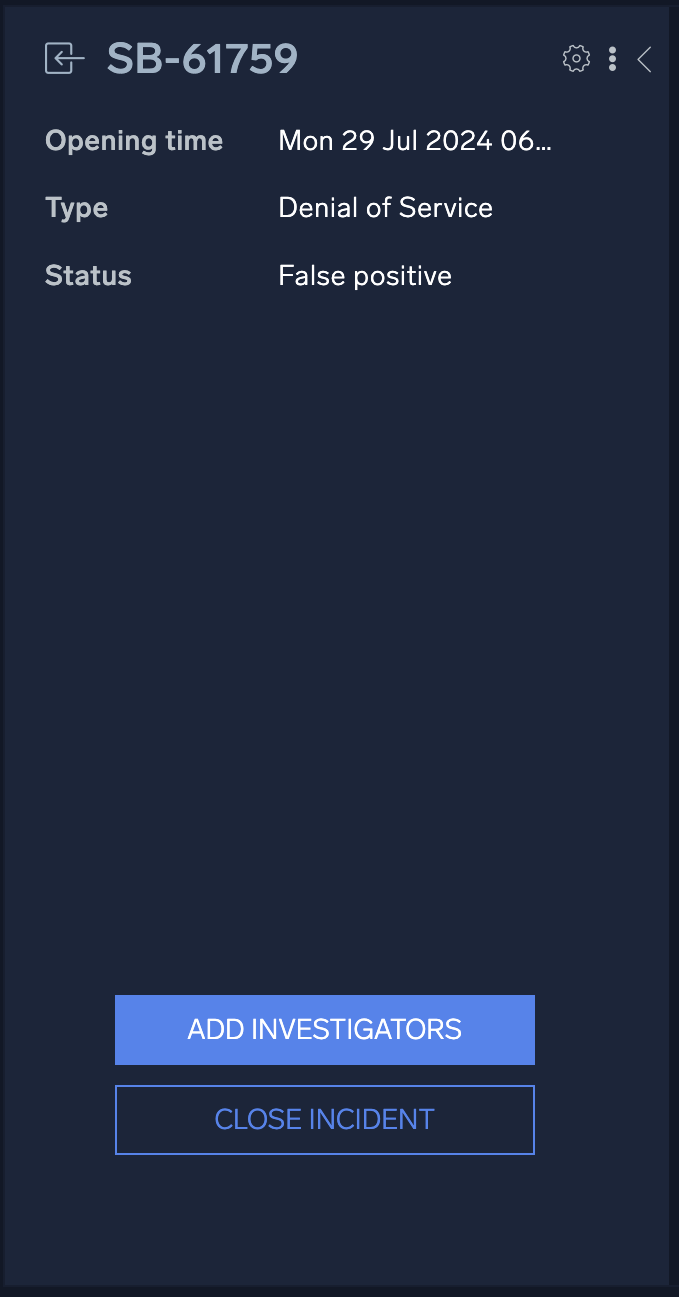
Opening an incident from any section of Cloud SOAR will display the incident details page. The page is composed of three sections: The incident VIP section on the left, the properties section in the center, and the widgets section to the right.
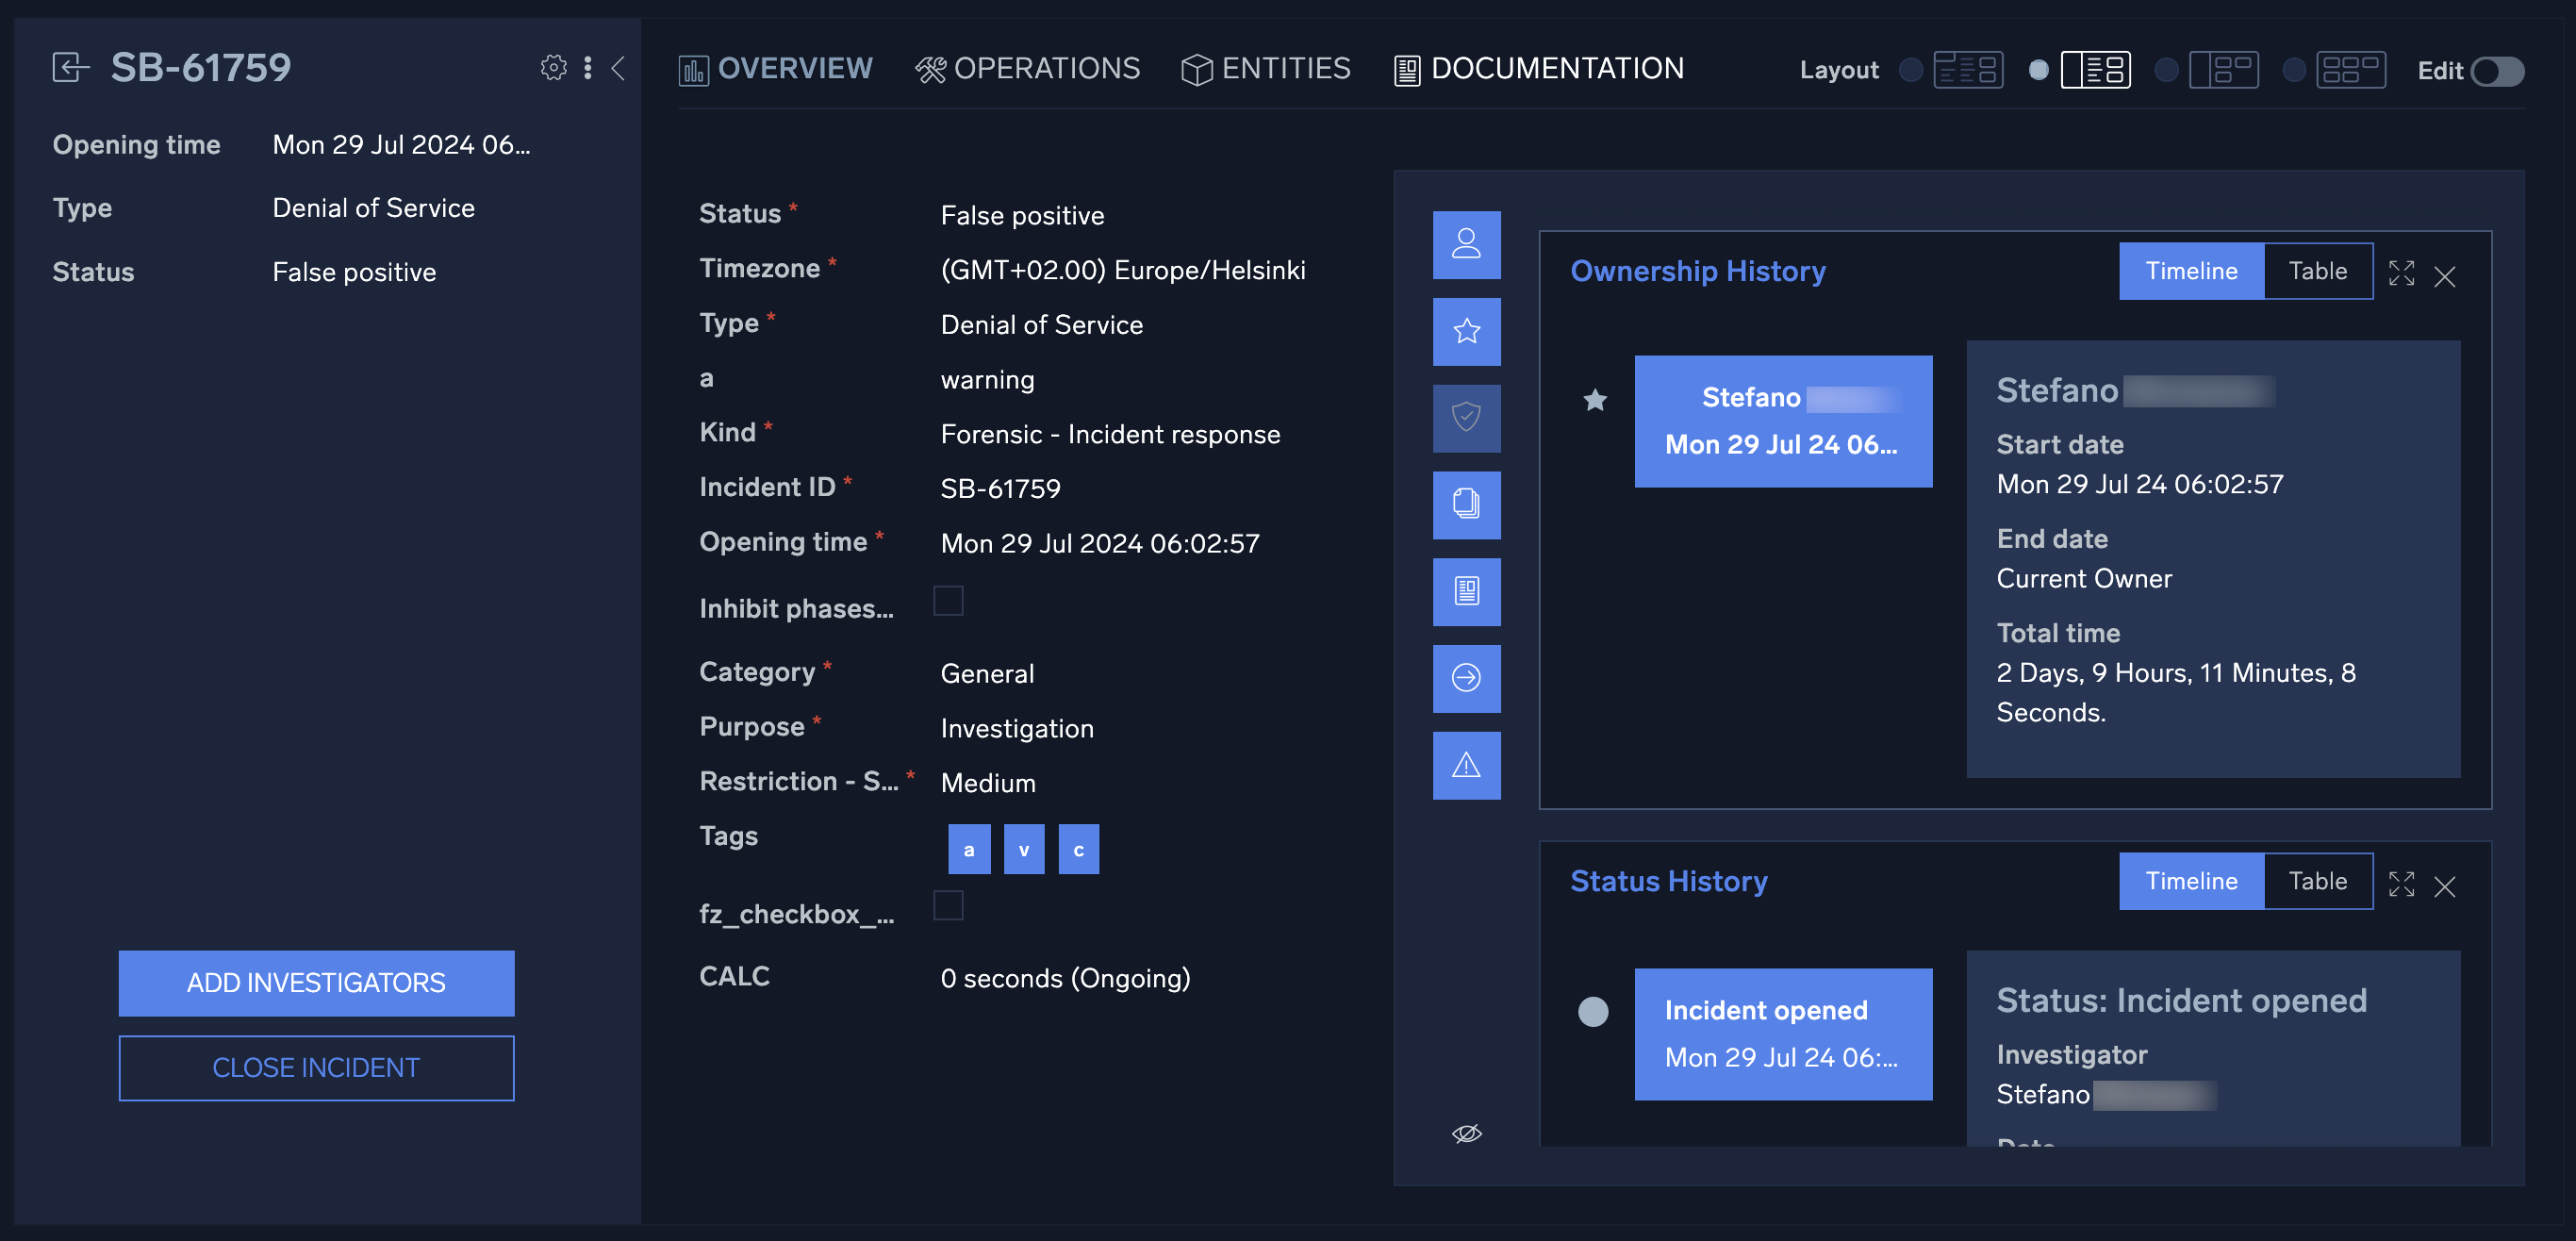
The incident VIP section displays high-level details about a specific incident. You can also take actions such as add additional investigators or close the incident from this section. To view all available actions, click the vertical ellipsis to the left of the cogwheel. You can change the owner of the incident, change the folder where the incident is housed, export the incident details via PDF, DOC, or custom report], and clone or permanently delete the incident. To customize the details displayed in the incident VIP section, click the cogwheel ![]() at the top right of the section. A new screen will be presented which will allow for adding and deleting of incident detail fields. To add a new field, you will click on the + sign next to the field to be added. Once all the desired fields are added, they can easily be rearranged in the desired order by dragging and dropping into place. To remove a field, simply click the x next to the field to be removed. Once all the details have been added and are in place, click Apply.
at the top right of the section. A new screen will be presented which will allow for adding and deleting of incident detail fields. To add a new field, you will click on the + sign next to the field to be added. Once all the desired fields are added, they can easily be rearranged in the desired order by dragging and dropping into place. To remove a field, simply click the x next to the field to be removed. Once all the details have been added and are in place, click Apply.
The incident properties section in the center contains all the important information that makes up the incident, such as executed playbooks and incident tasks. This information is divided into four different sections: Overview, Operations, Entities, and Documentation.
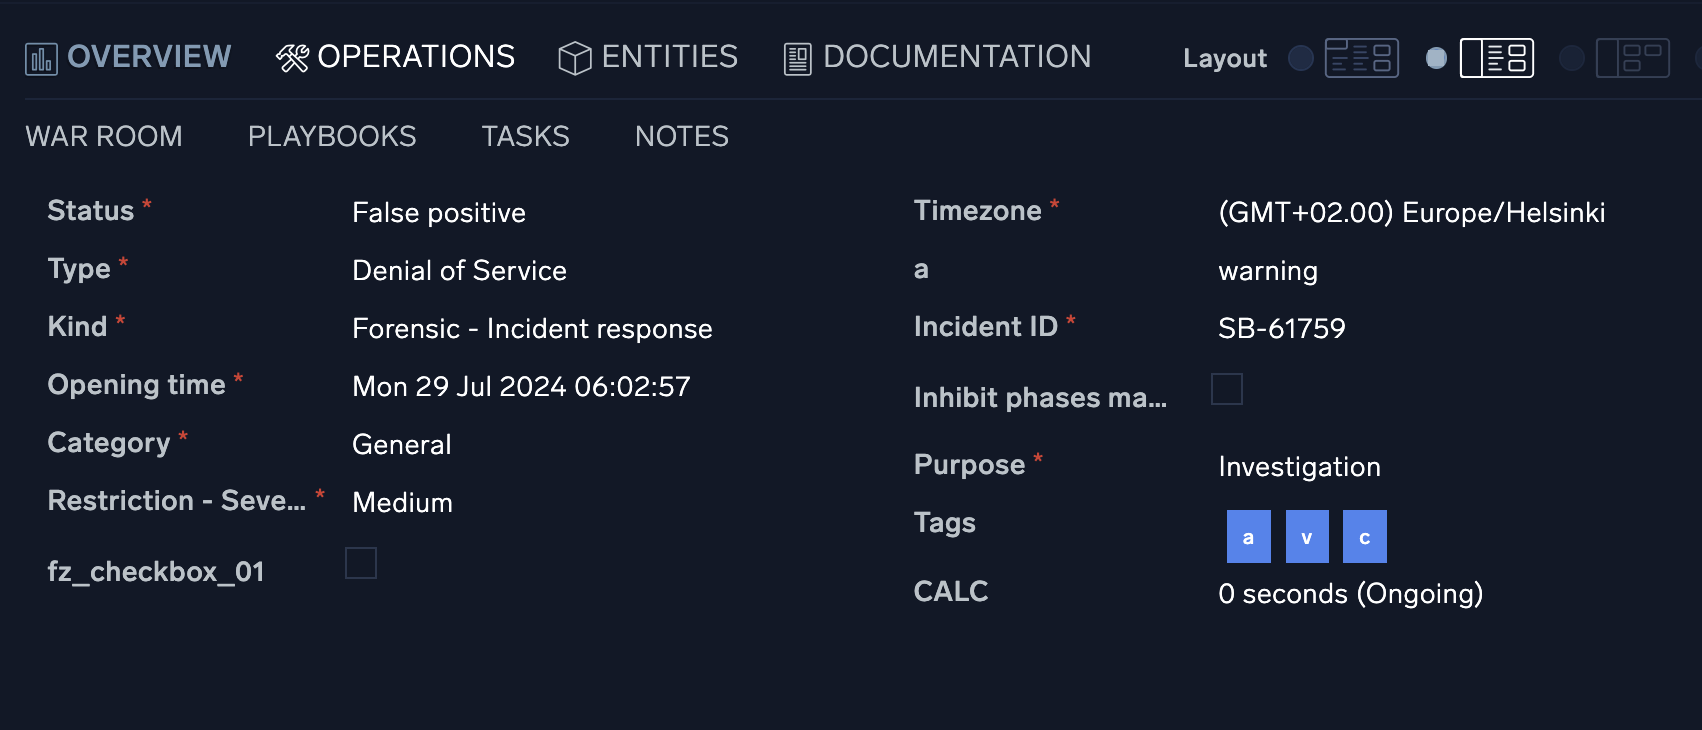
Overview tab
The incident Overview tab contains all the pertinent information for a specific incident such as the severity, SLA counter, and category of alert. This information can be configured in custom fields.
Operations tab
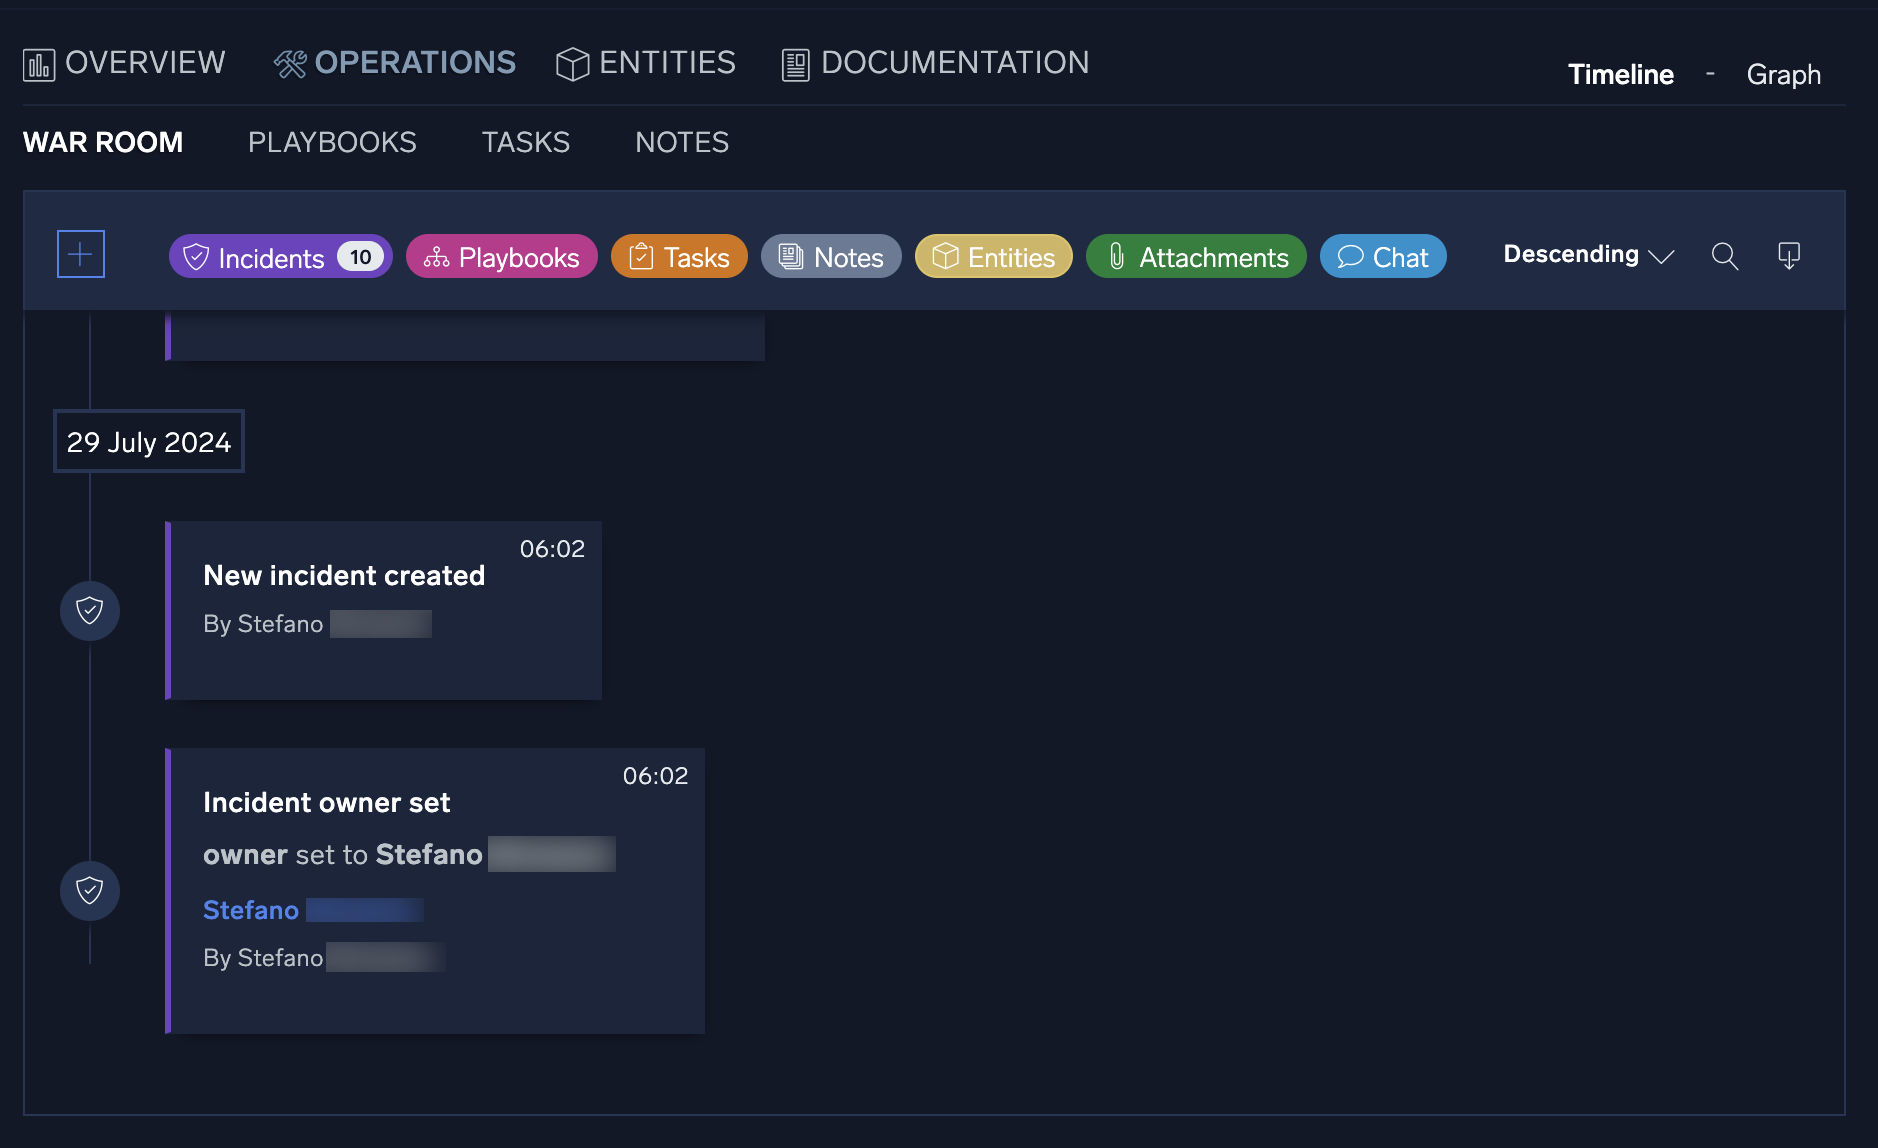
The Operations tab contains all the investigative information for a specific incident and is broken out into the following sections: War Room, Playbook, Tasks, and Notes.
War Room
All the information related to the ongoing incident is visible in one place in the War Room section. You can quickly view and check all the steps of the analysis, done either manually or by the automation, any entities related to the incident, results of actions performed, and notes added during the incident's investigation. Information can be filtered out for the different categories, and you can add new notes by clicking the + button.
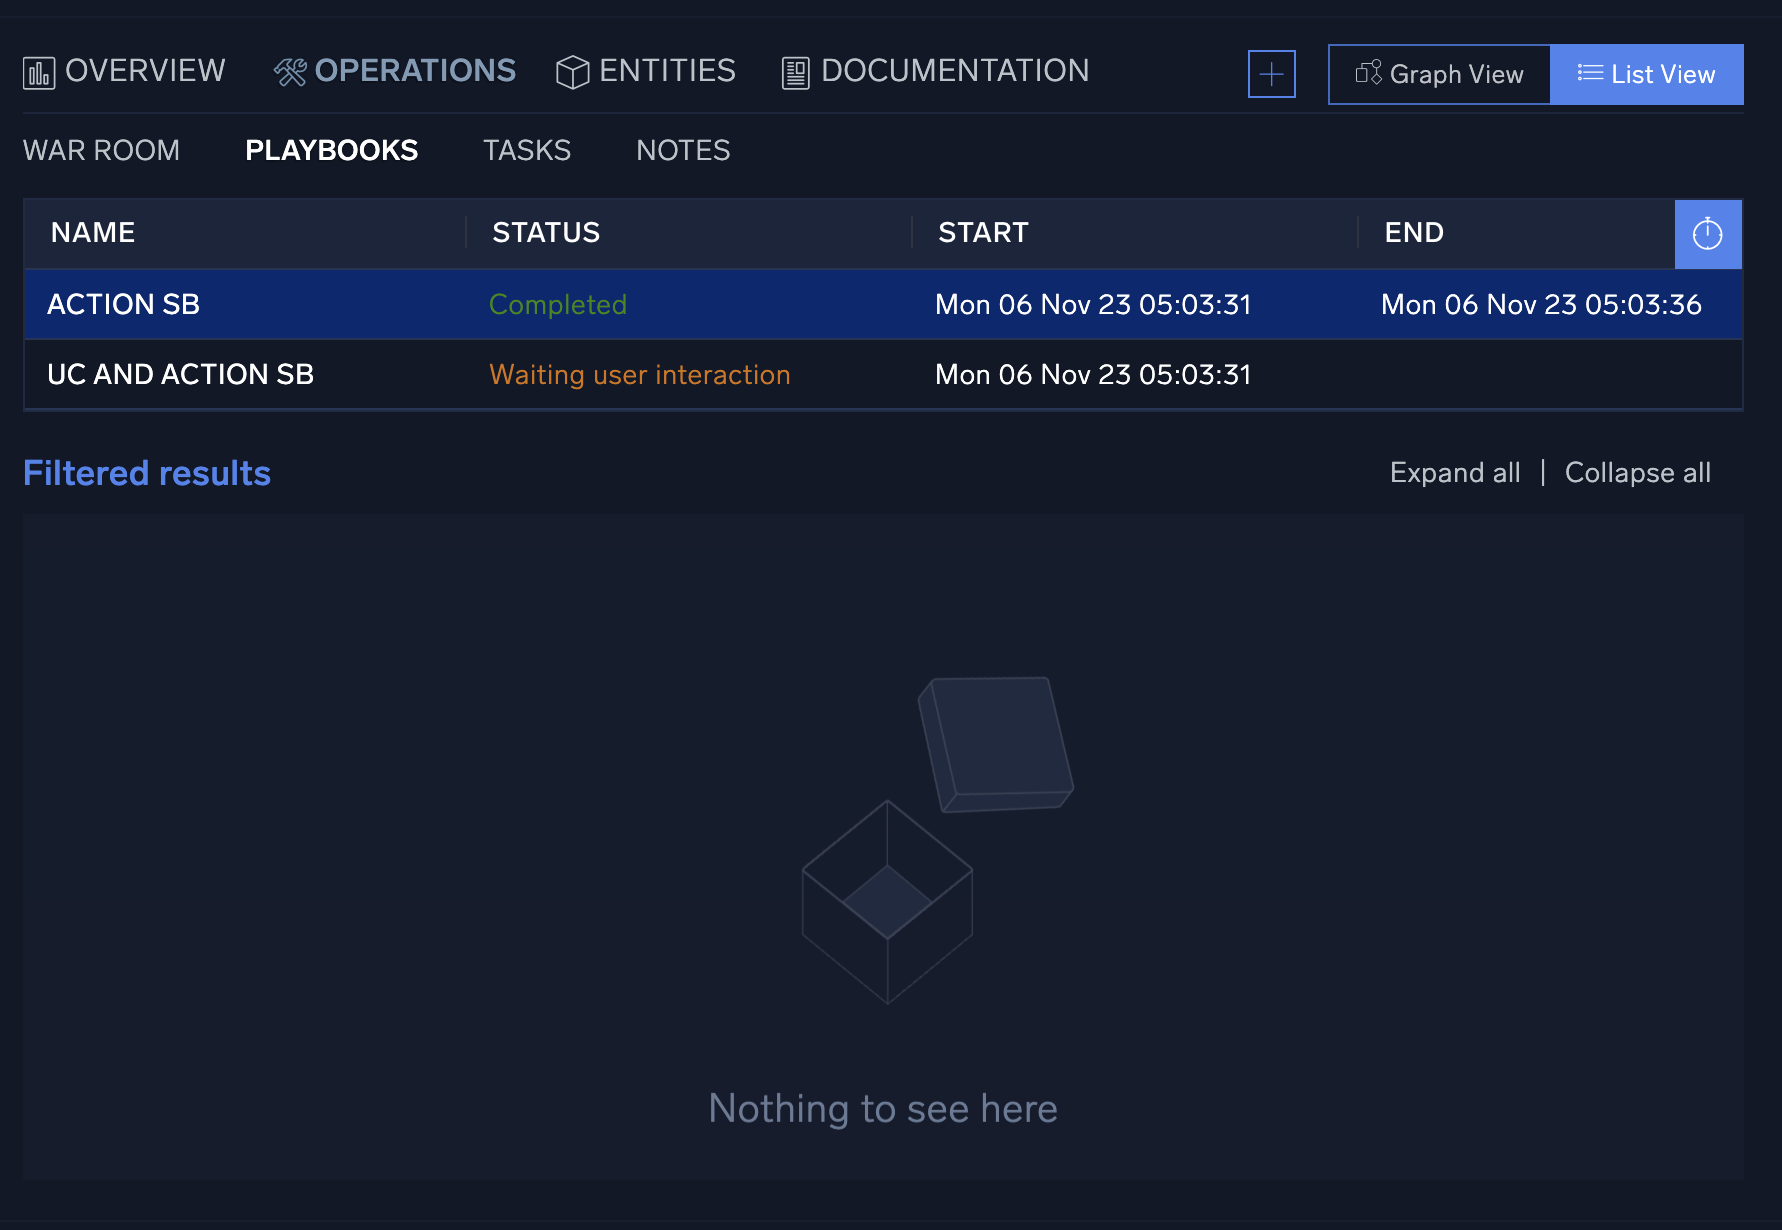
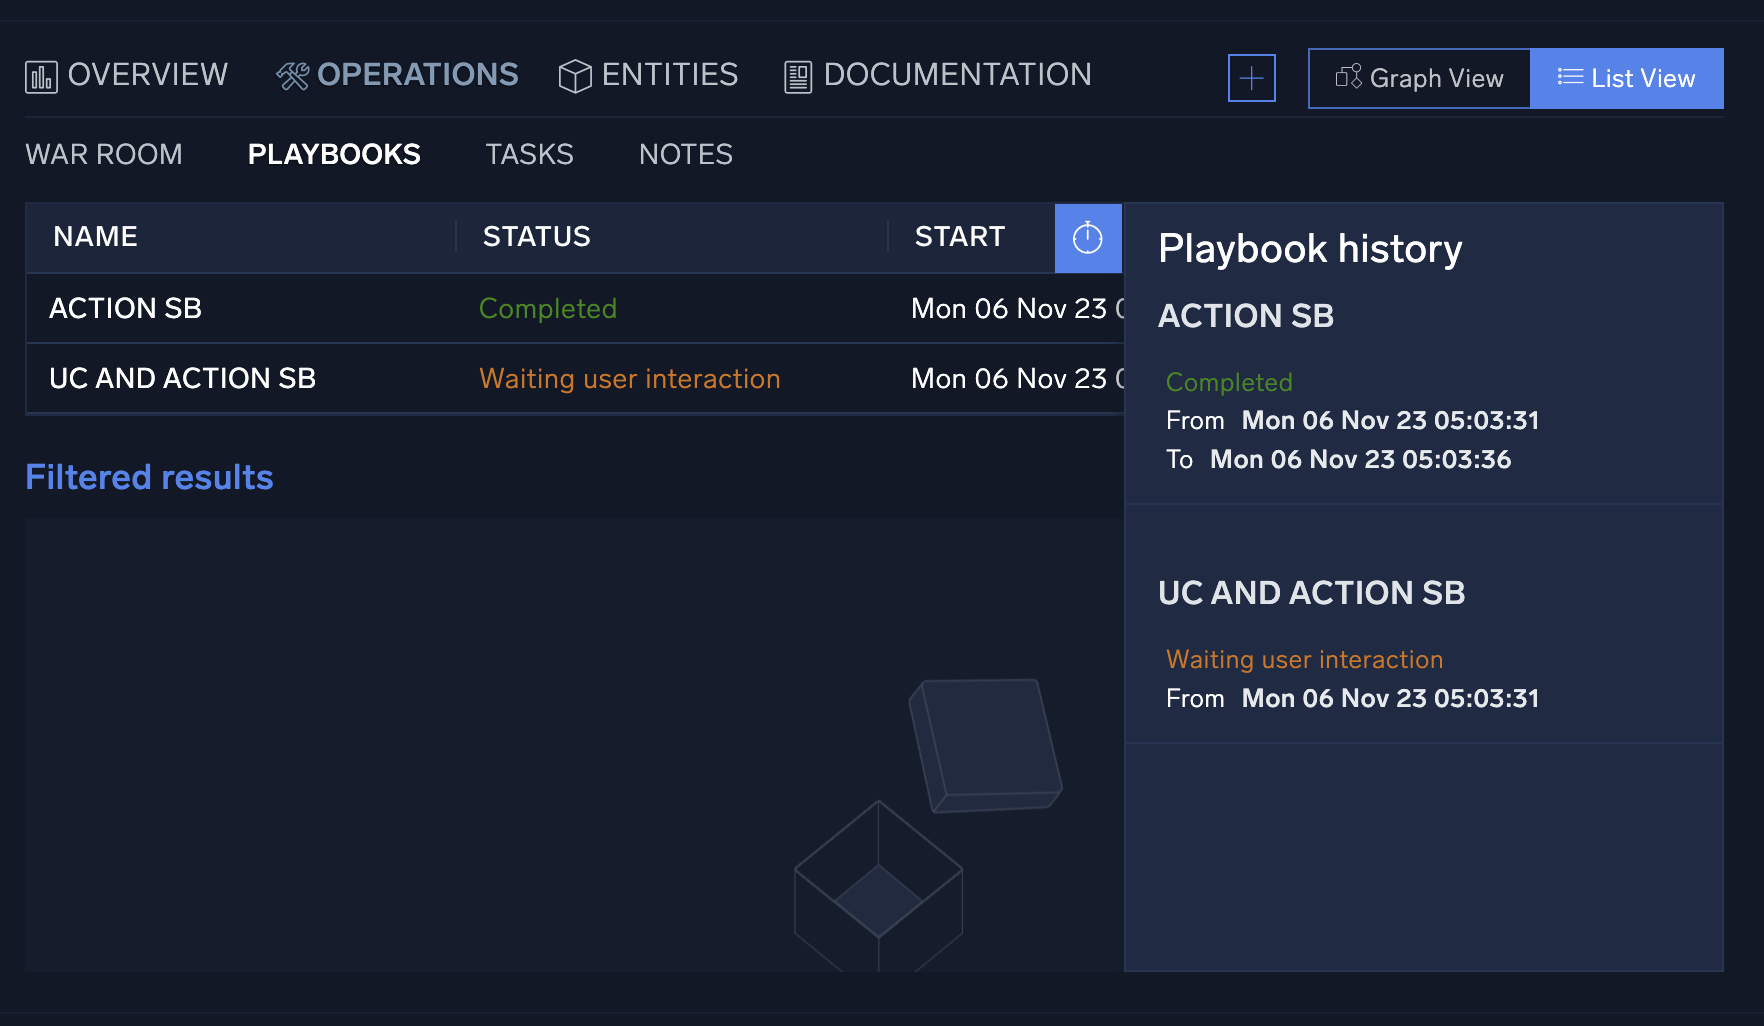
Playbooks
Any playbook that has been applied to an incident can be found under the Playbooks section. You can quickly view and make any necessary adjustments to the incident's playbooks, as well as add any additional playbooks that may be required during an incident's investigation.
If during an incident's investigation it is determined that the type of incident has changed (for example, a phishing incident turns into a ransomware incident) another type of playbook may be needed to correctly remediate an incident. You can add additional playbooks to the incident by clicking + at the top of the screen to the left of the Graph View and List View buttons. This will open a new screen that lists all available playbooks. Either type in the playbook name to use, or manually search through all available options and click Add when finished.
To explore the playbooks:
- Click the clock icon to see playbook history.
- To view individual playbooks for the incident, click Graph View at the top of the panel. In the graph view, the playbook options menu can be found at the bottom of the playbook screen to re-run a playbook, download playbook results, edit the playbook, or expand the playbook.
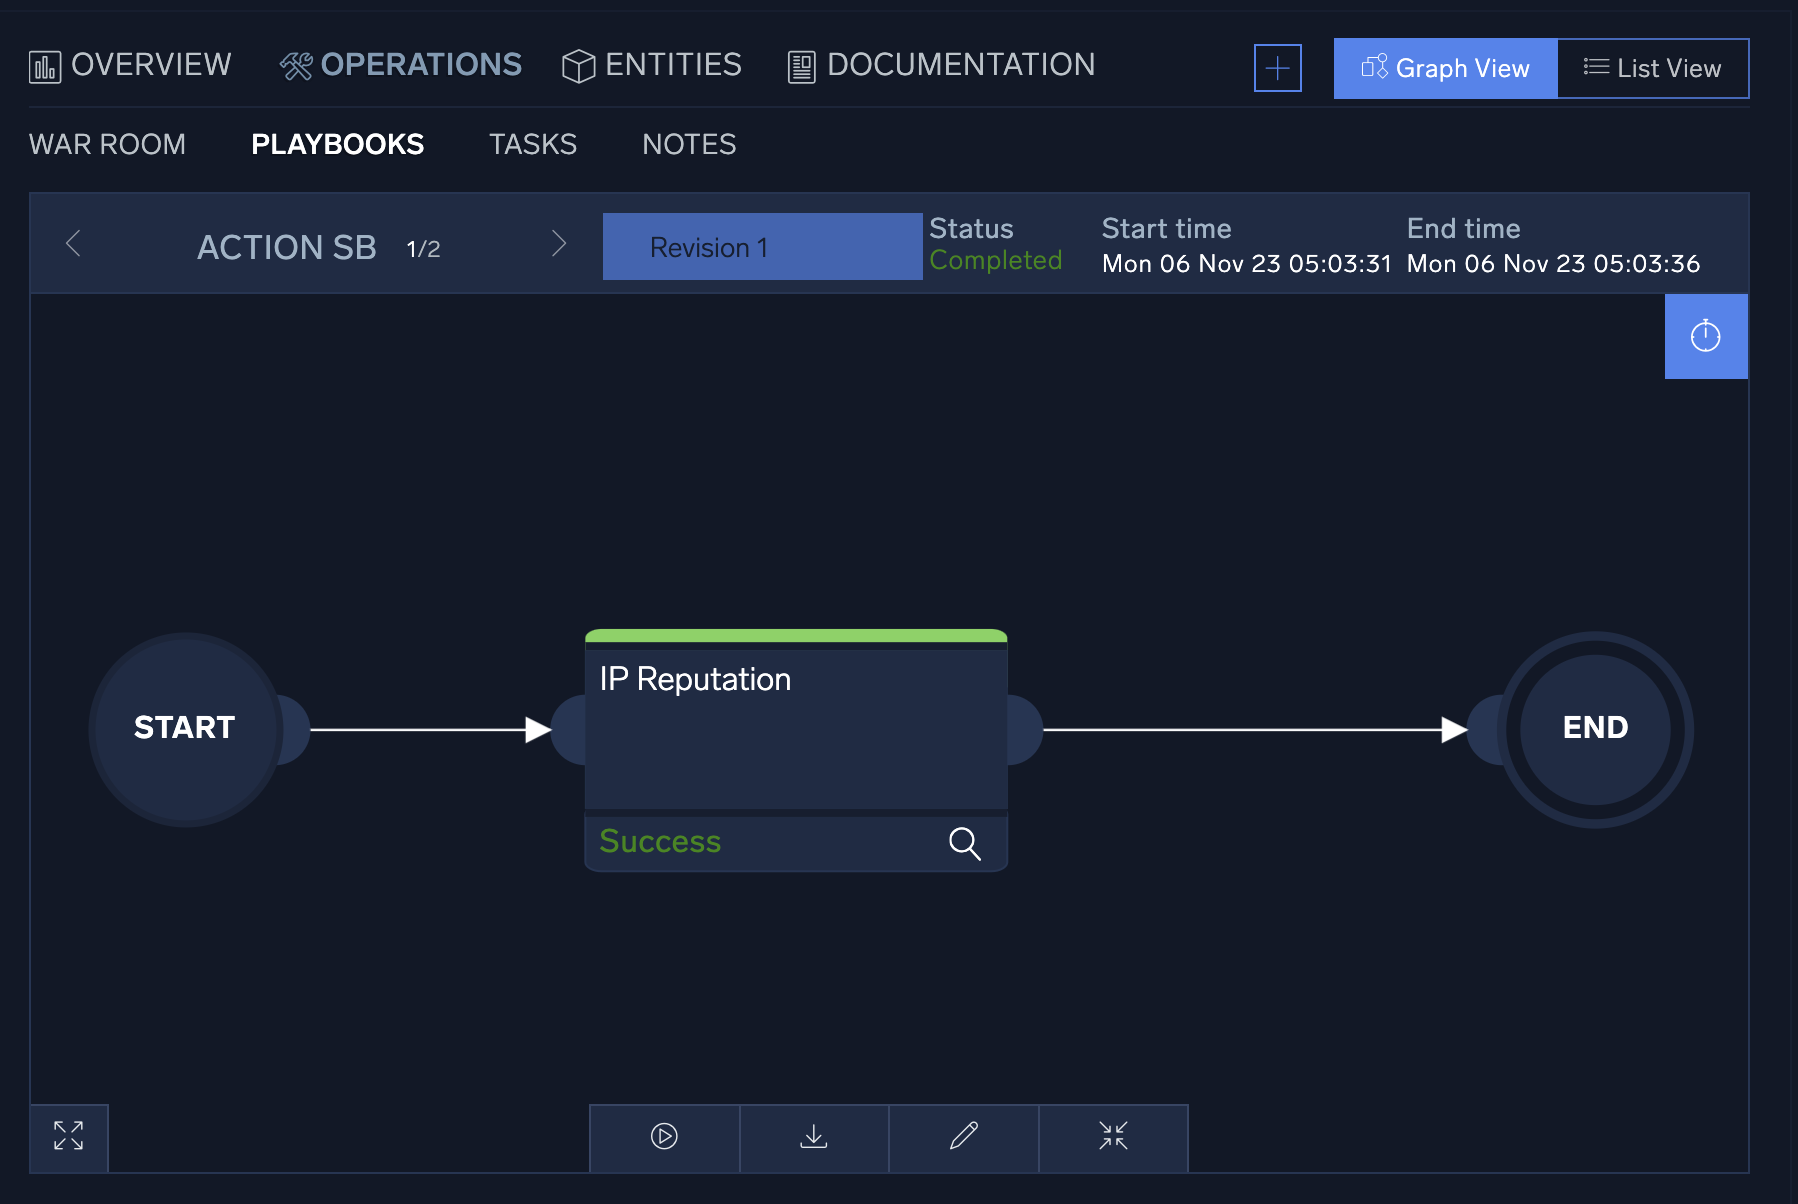
- To view the details of any individual action, click on the action node. A new window displaying the action details will be displayed on the left-hand side of the screen. From this view, you can see the status of the action, its configuration, and have the choice to download the JSON results of the action.
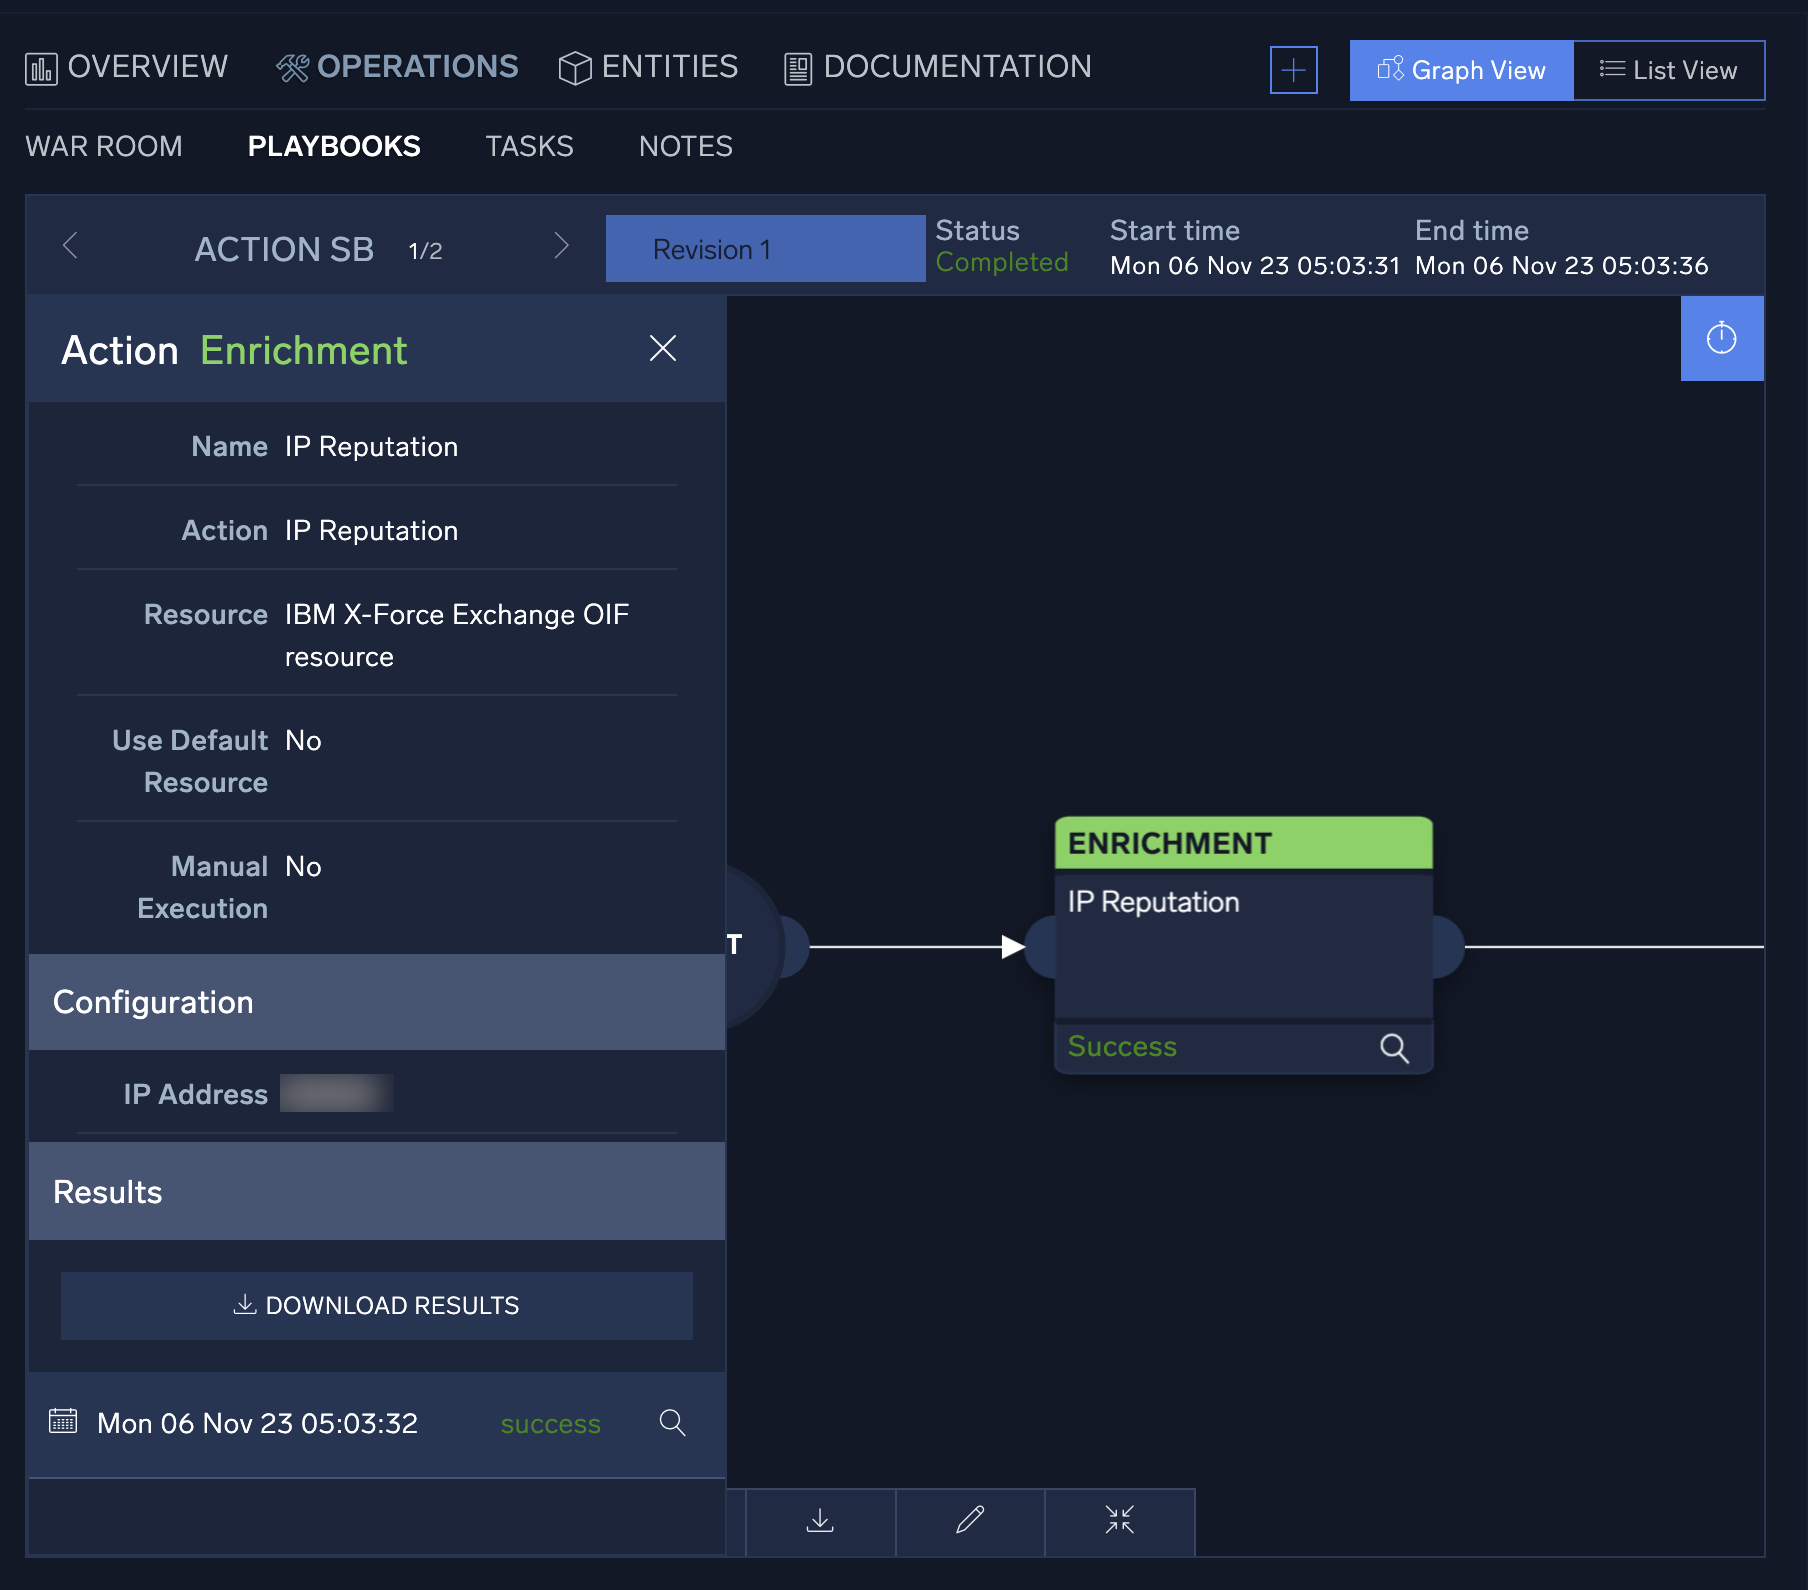
- To view the details of the result, click the magnifying glass icon at the bottom of the action details, and the action result window will display. You can use the search bar at the top of the table to search the results.
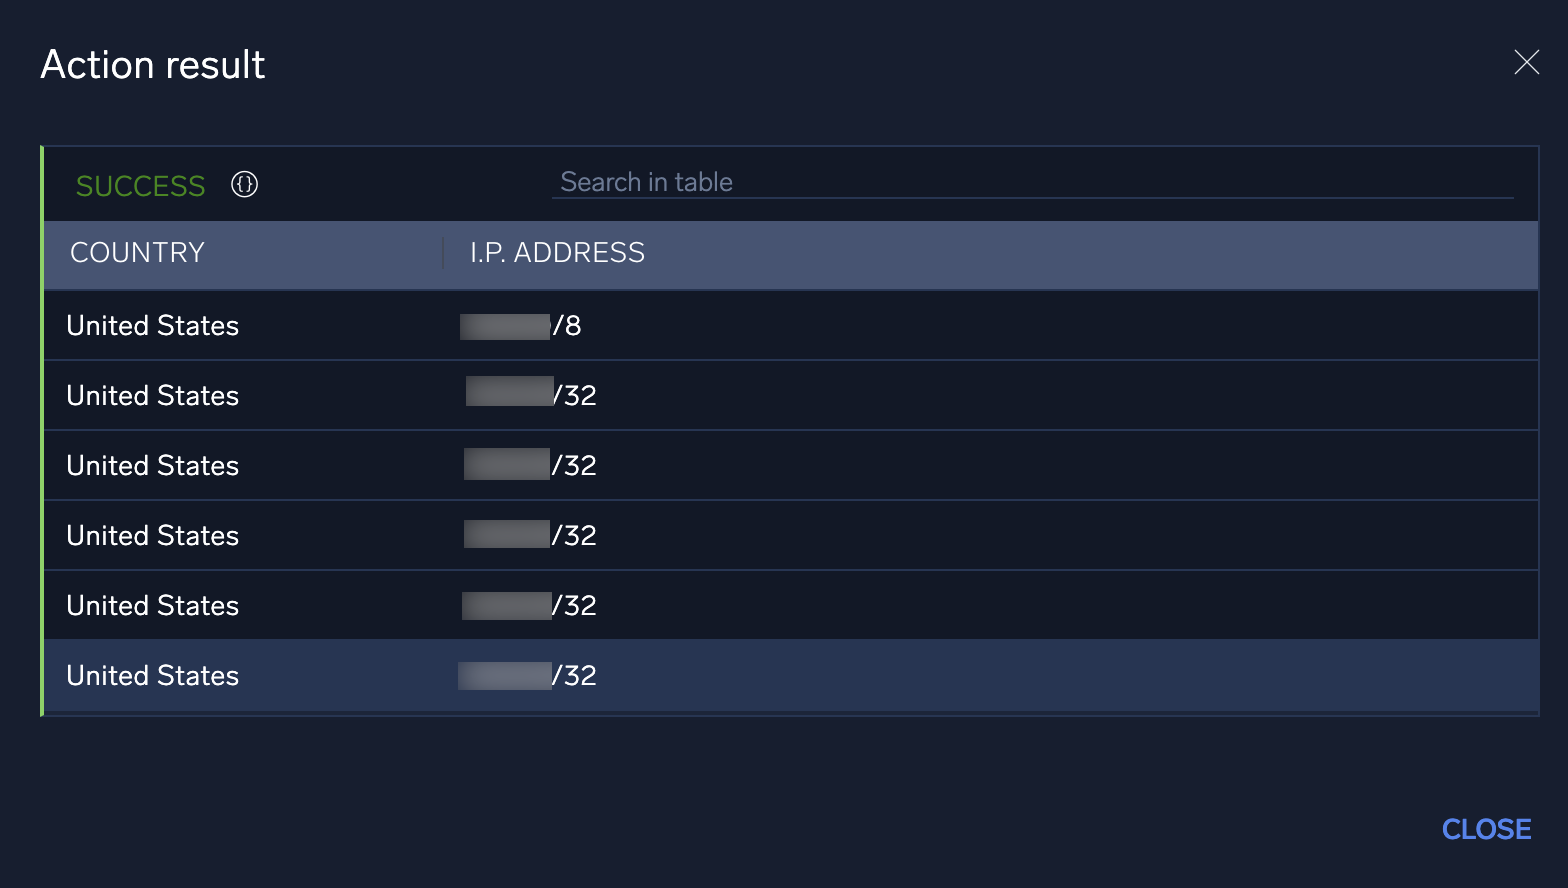
- Because some integrations return large data sets, the table view is designed to show only a select set of attributes. For more detailed information, you can switch to the action's JSON results screen by clicking the JSON Details icon
 next to the action's search bar. The JSON results view displays the full results of the executed action.
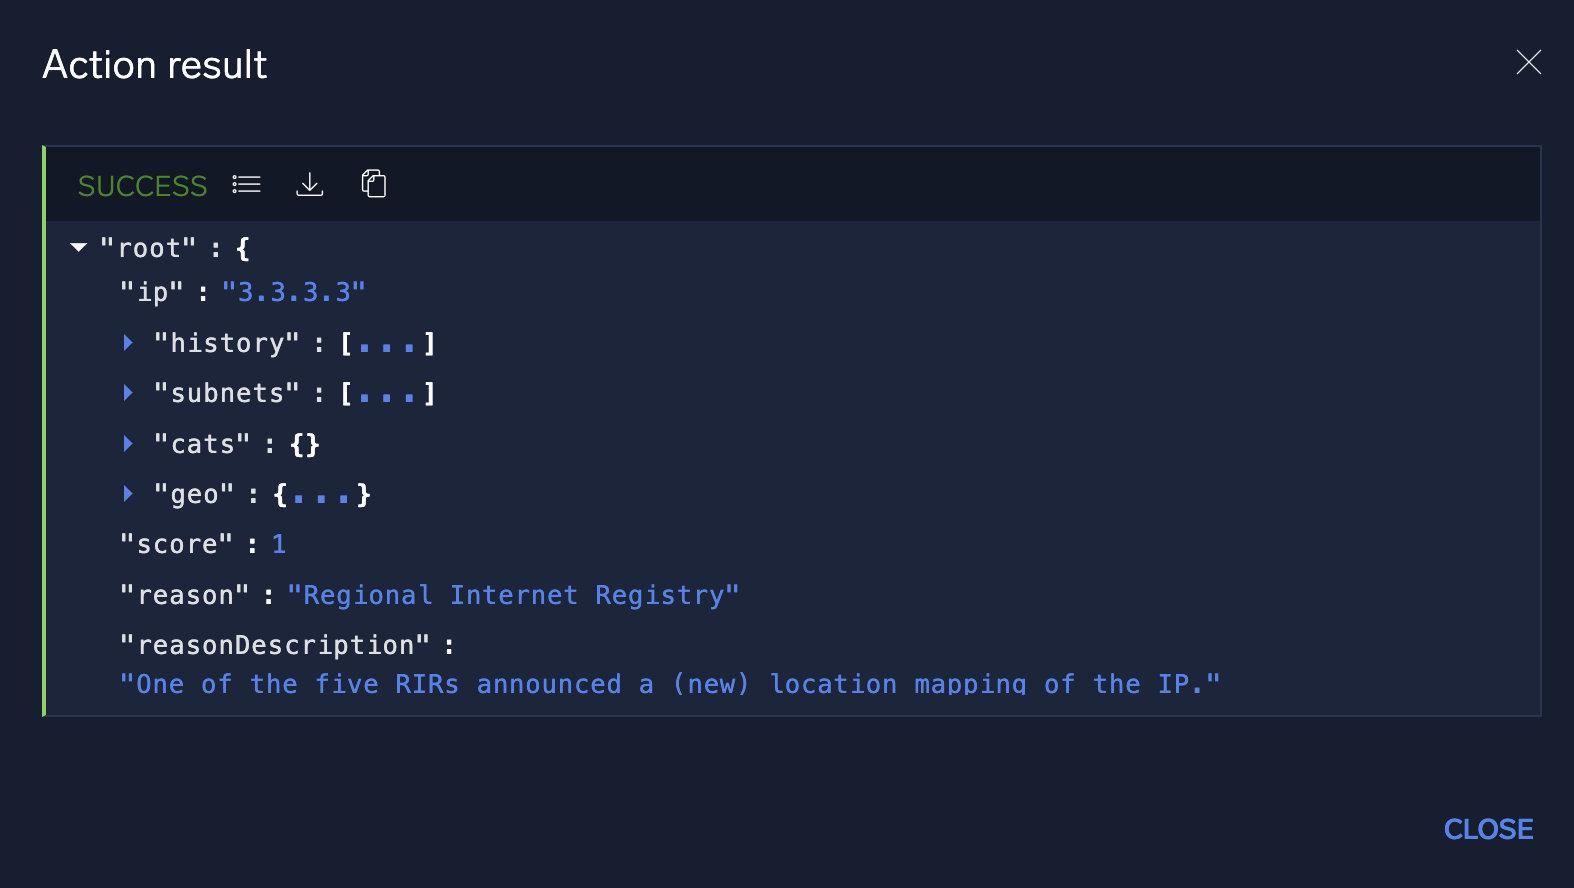
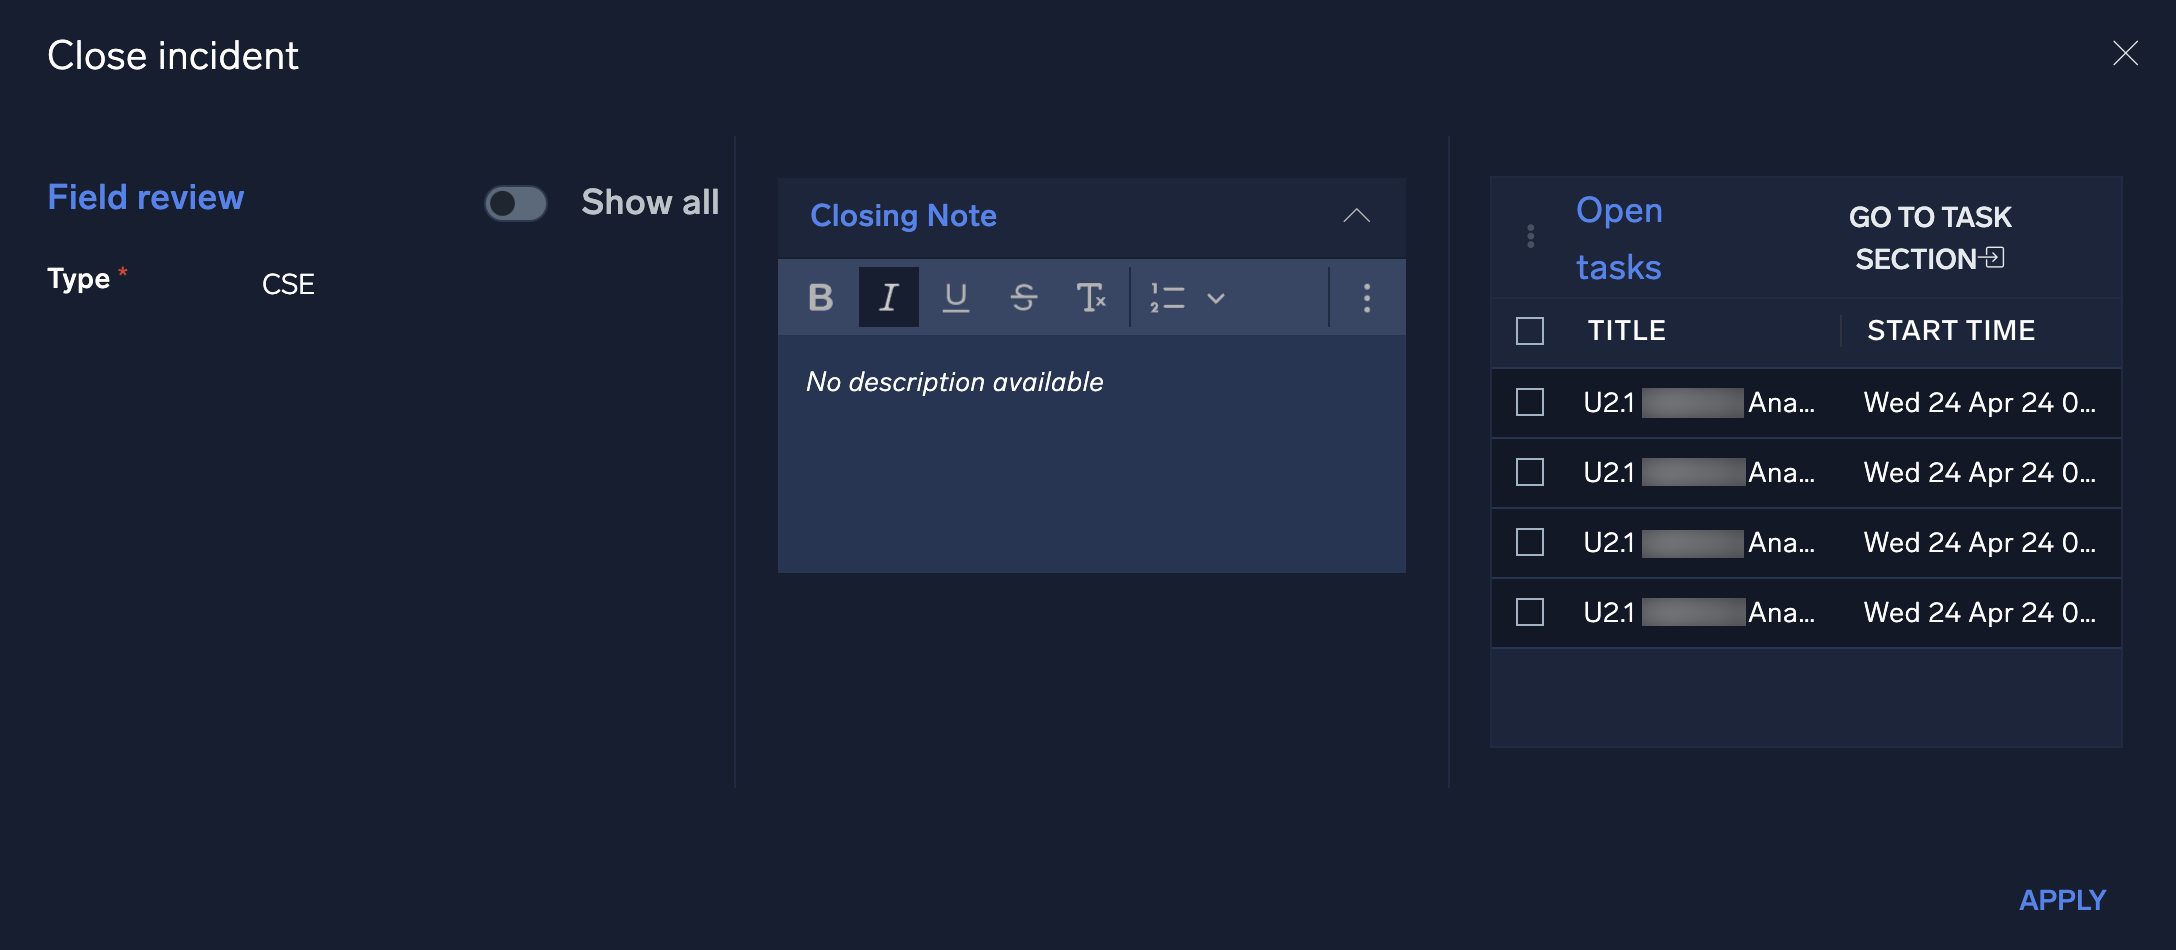
Tasks
The Tasks section allows incident managers to assign and track tasks which must be completed during an investigation. You can add tasks manually here, or add them from playbooks.
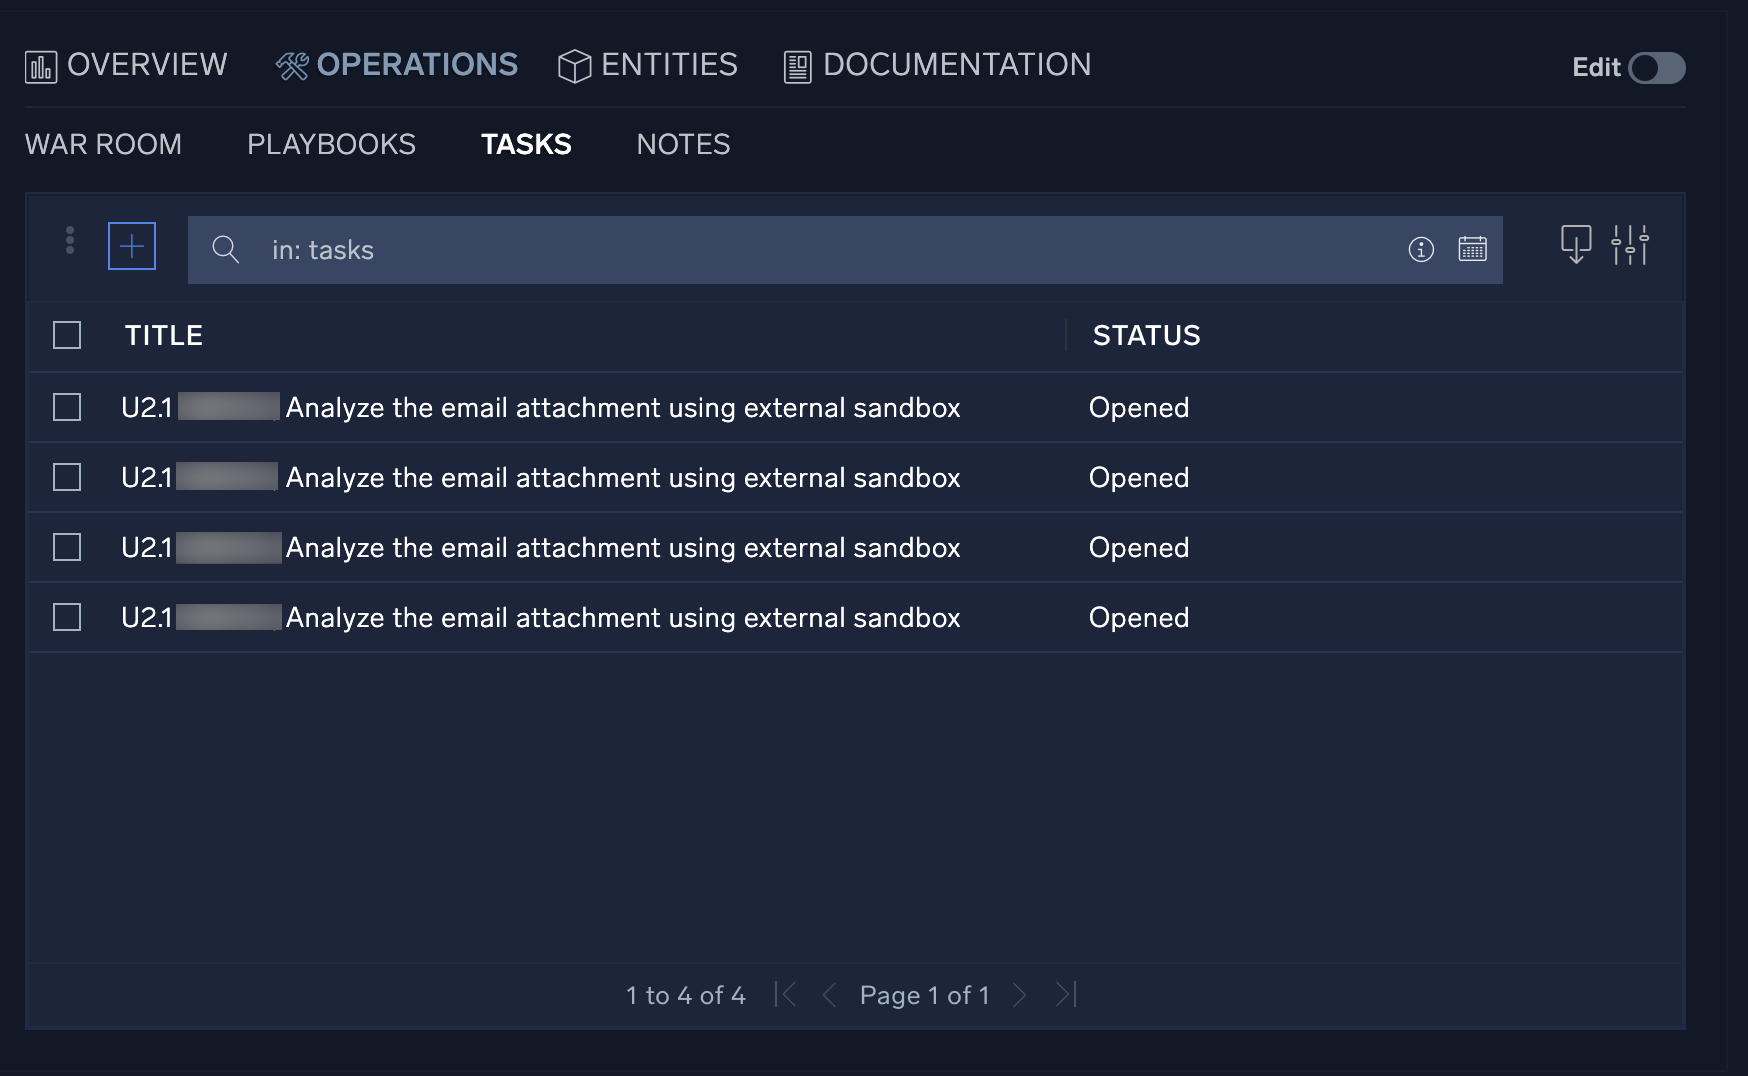
To explore tasks:
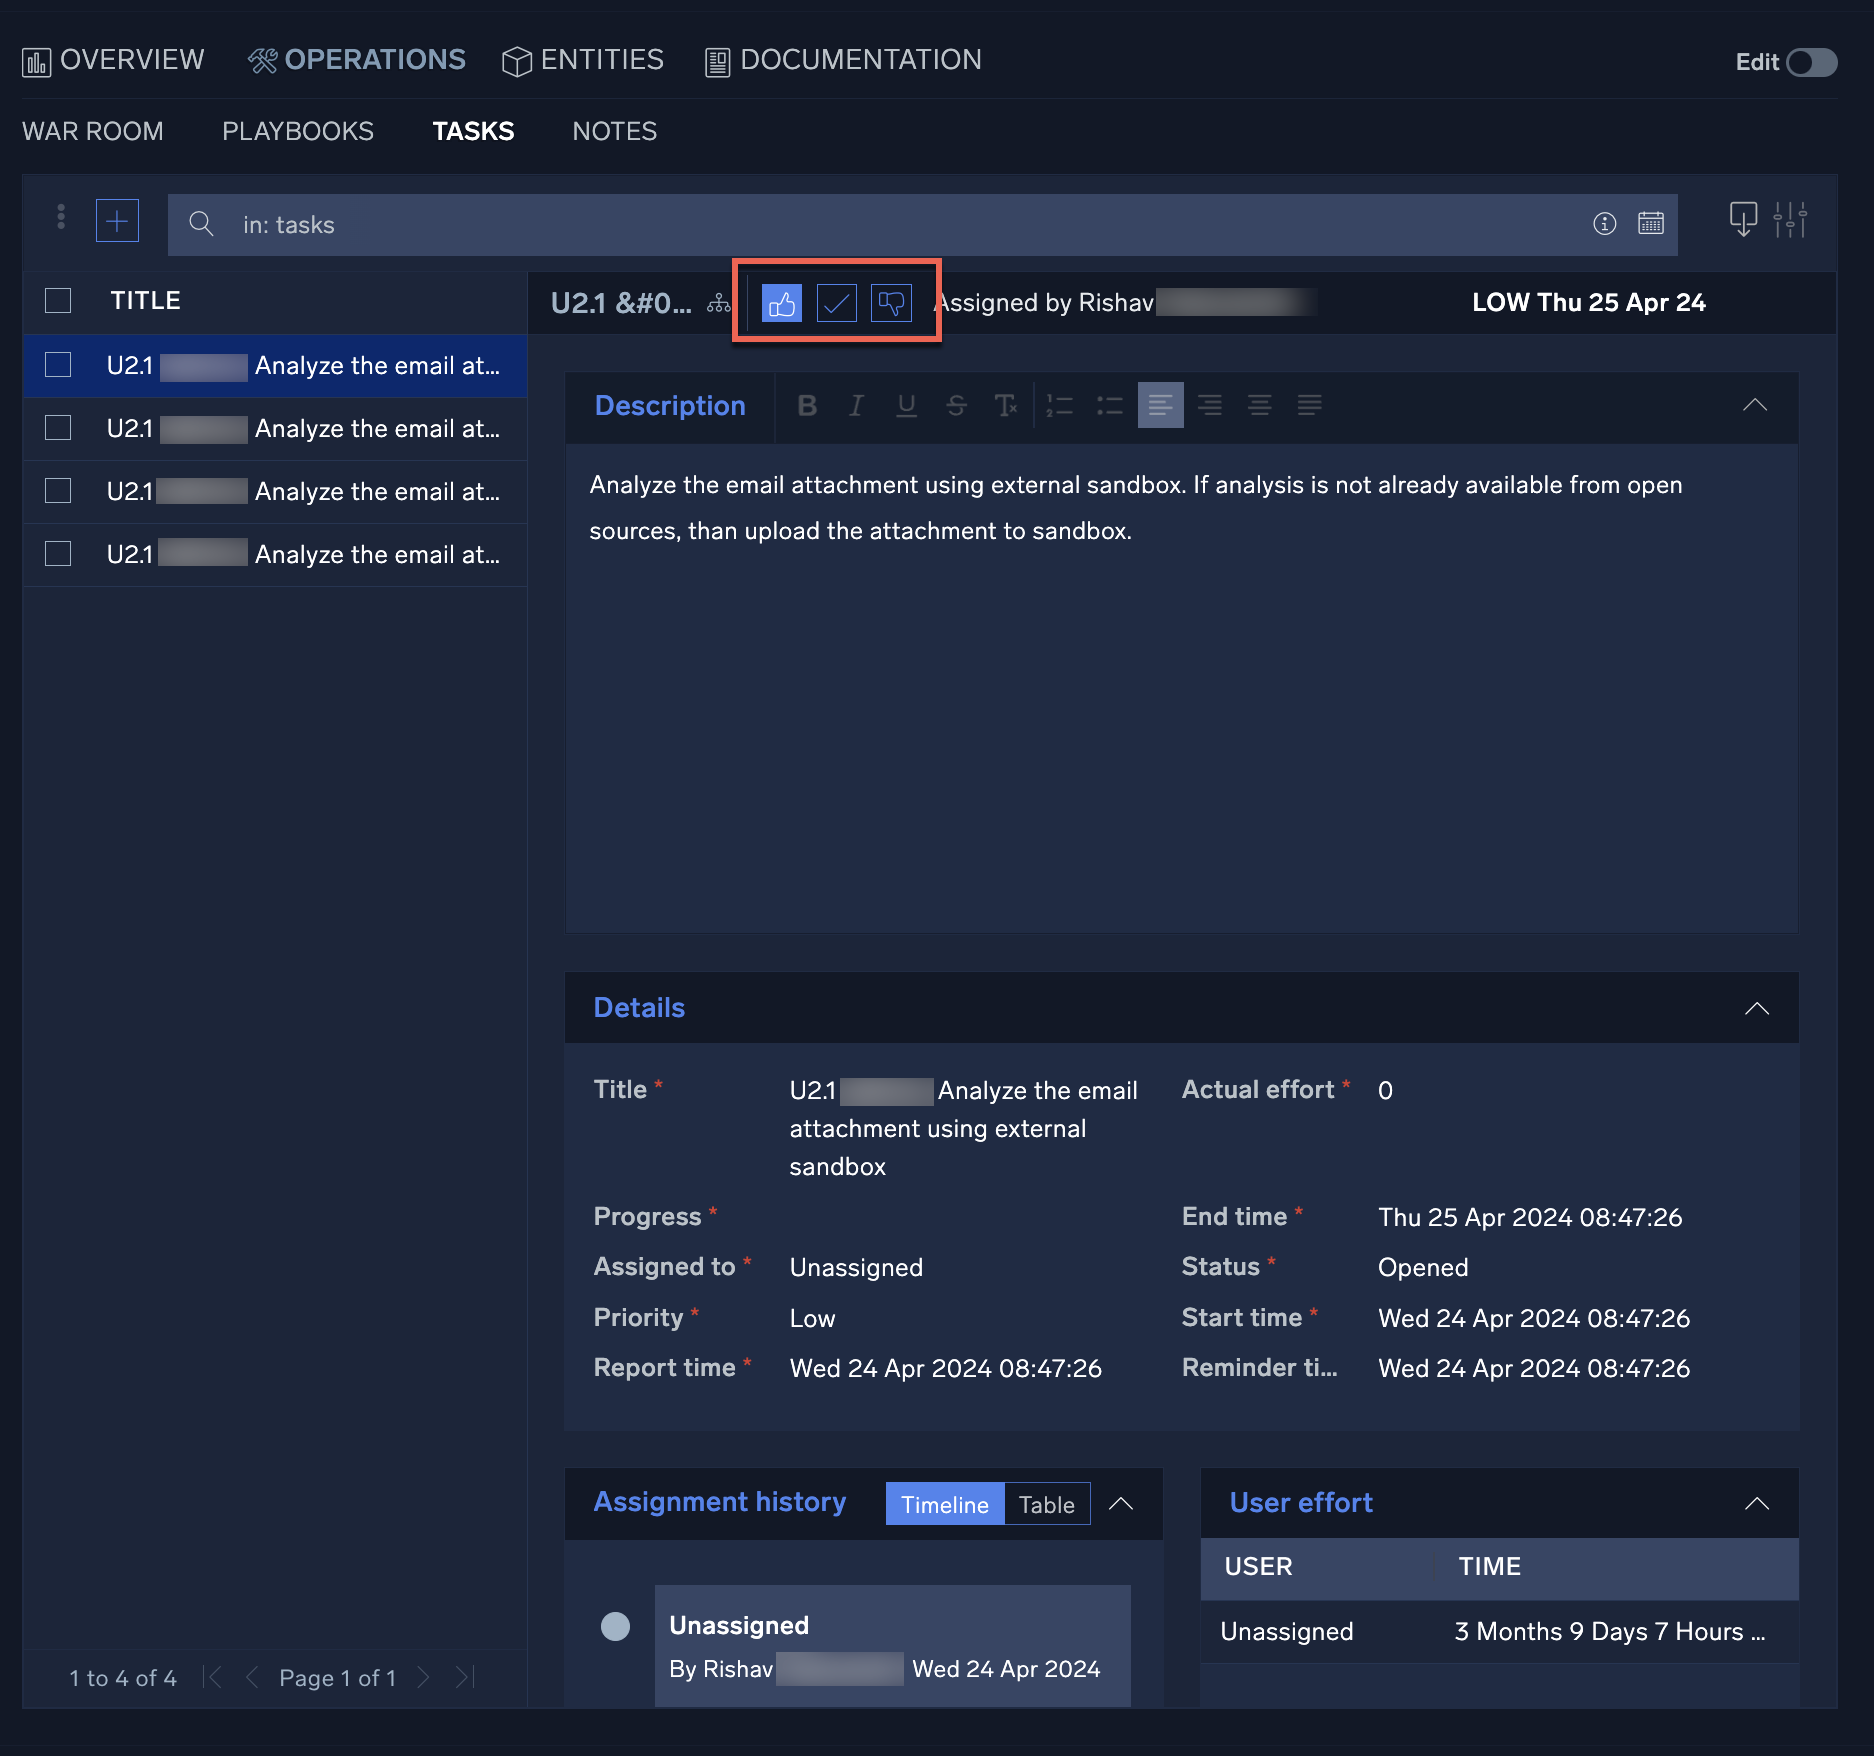
- Click a task to open it. From the resulting window you can not only view information about the task, but take actions such as approve, decline, or close the task, as well as launch the associated playbook.
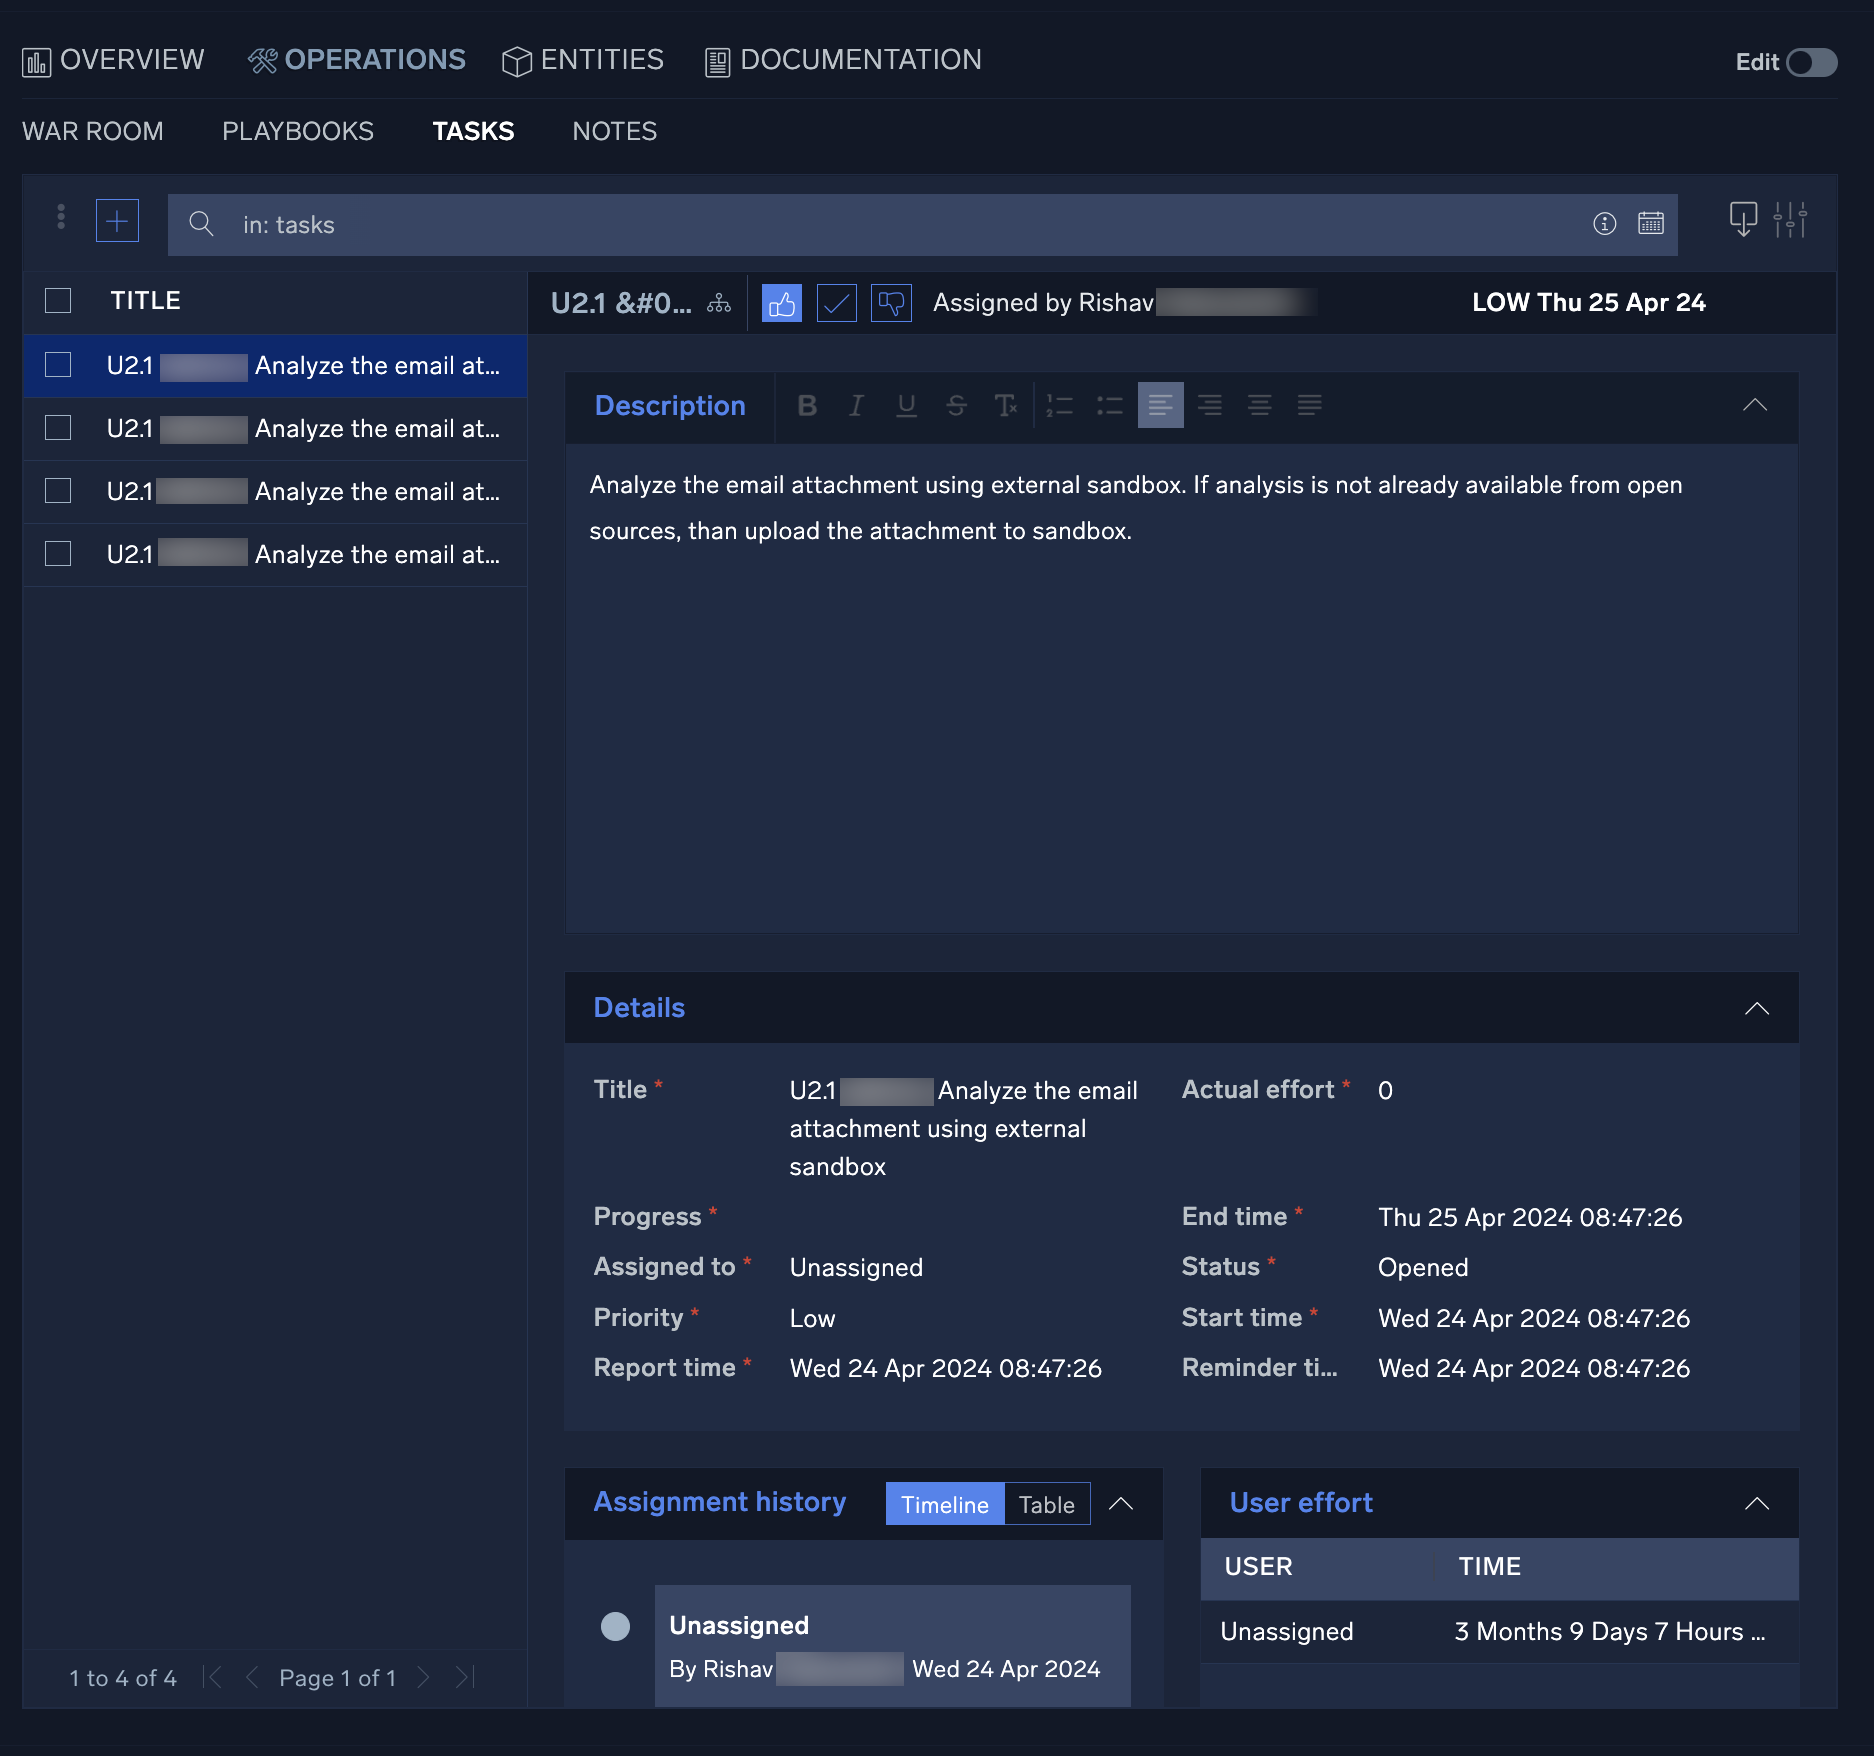
- To add a new Task, click the + button at the top-left of the Task list screen. Fill in all required fields and add any additional information necessary under the Description section if desired.
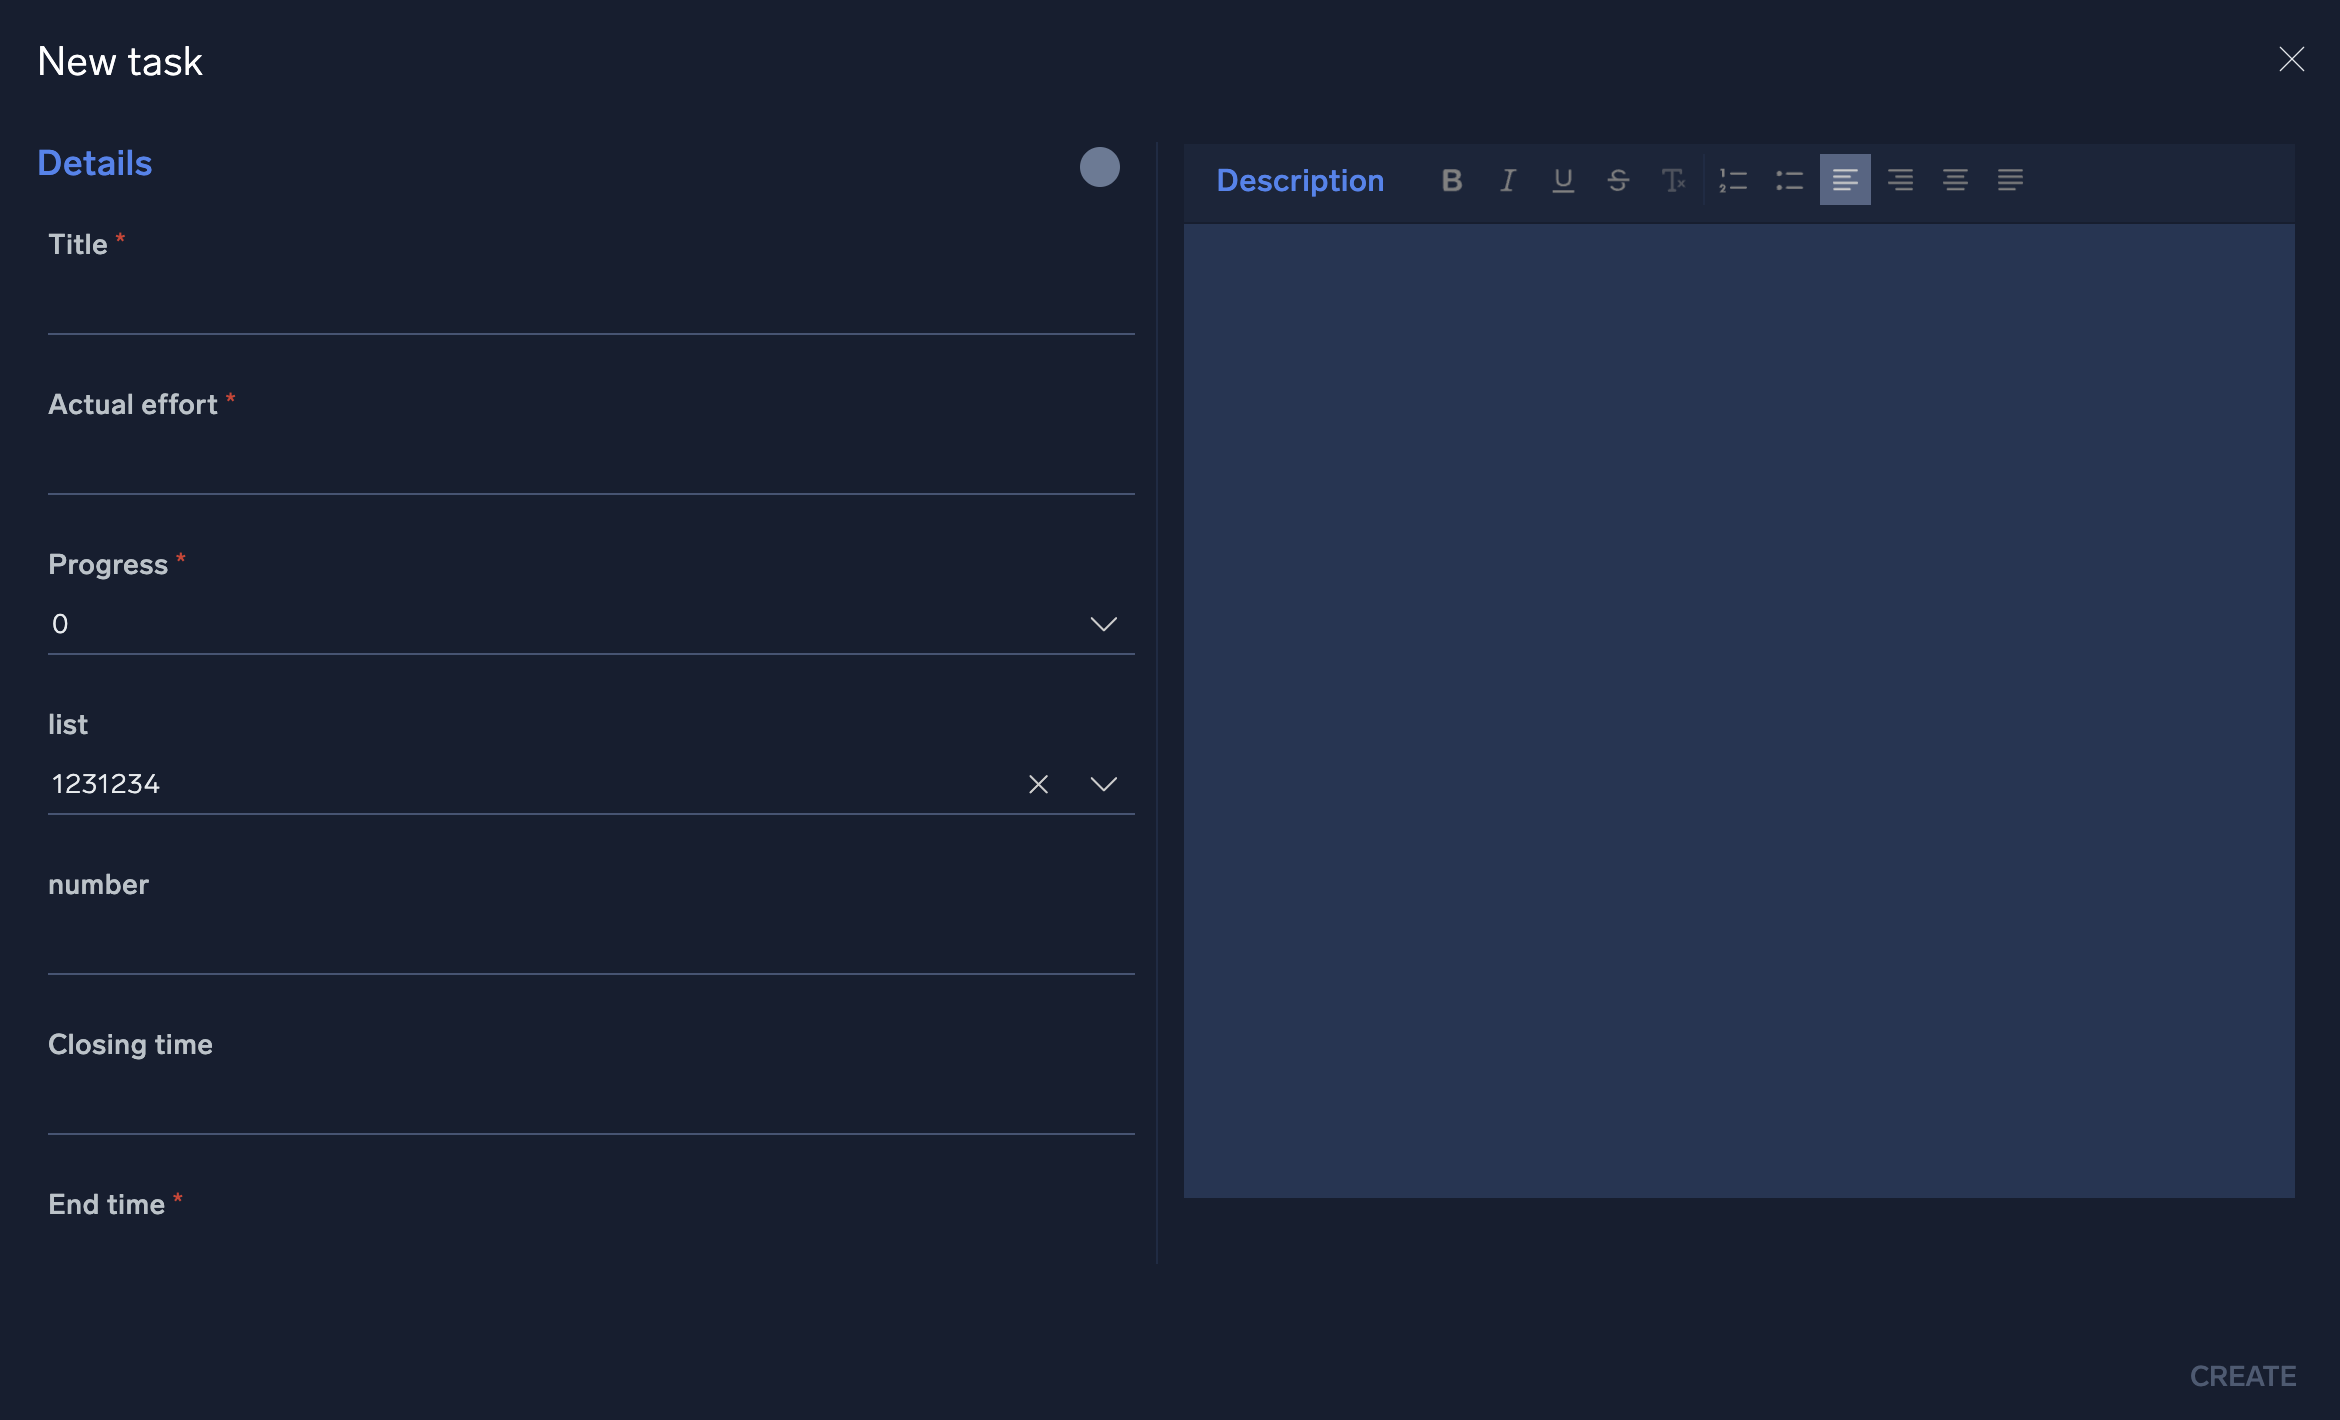
- The user listed in the Assigned to field will be the user responsible for completing the task.
- The field titled Actual Effort should be the number of hours estimated to complete the task. As the task is updated by the assignee, this field should be changed to reflect the actual number of hours that were required to complete the task. This number will be used to provide task assessment information.
- Once a task has been created and assigned, it will appear in the SecOps screen. To view the details of a task, click on the task from the My Operations section of the screen.
- Selecting a task will open the incident where the task was created. This will allow you to review the details of the task and access any automated playbooks and notes from the incident investigation. Once the incident data has been reviewed, investigators can choose to approve, approve and close, or decline a task by clicking the thumbs up, thumbs
down or check mark buttons next to the task's title.
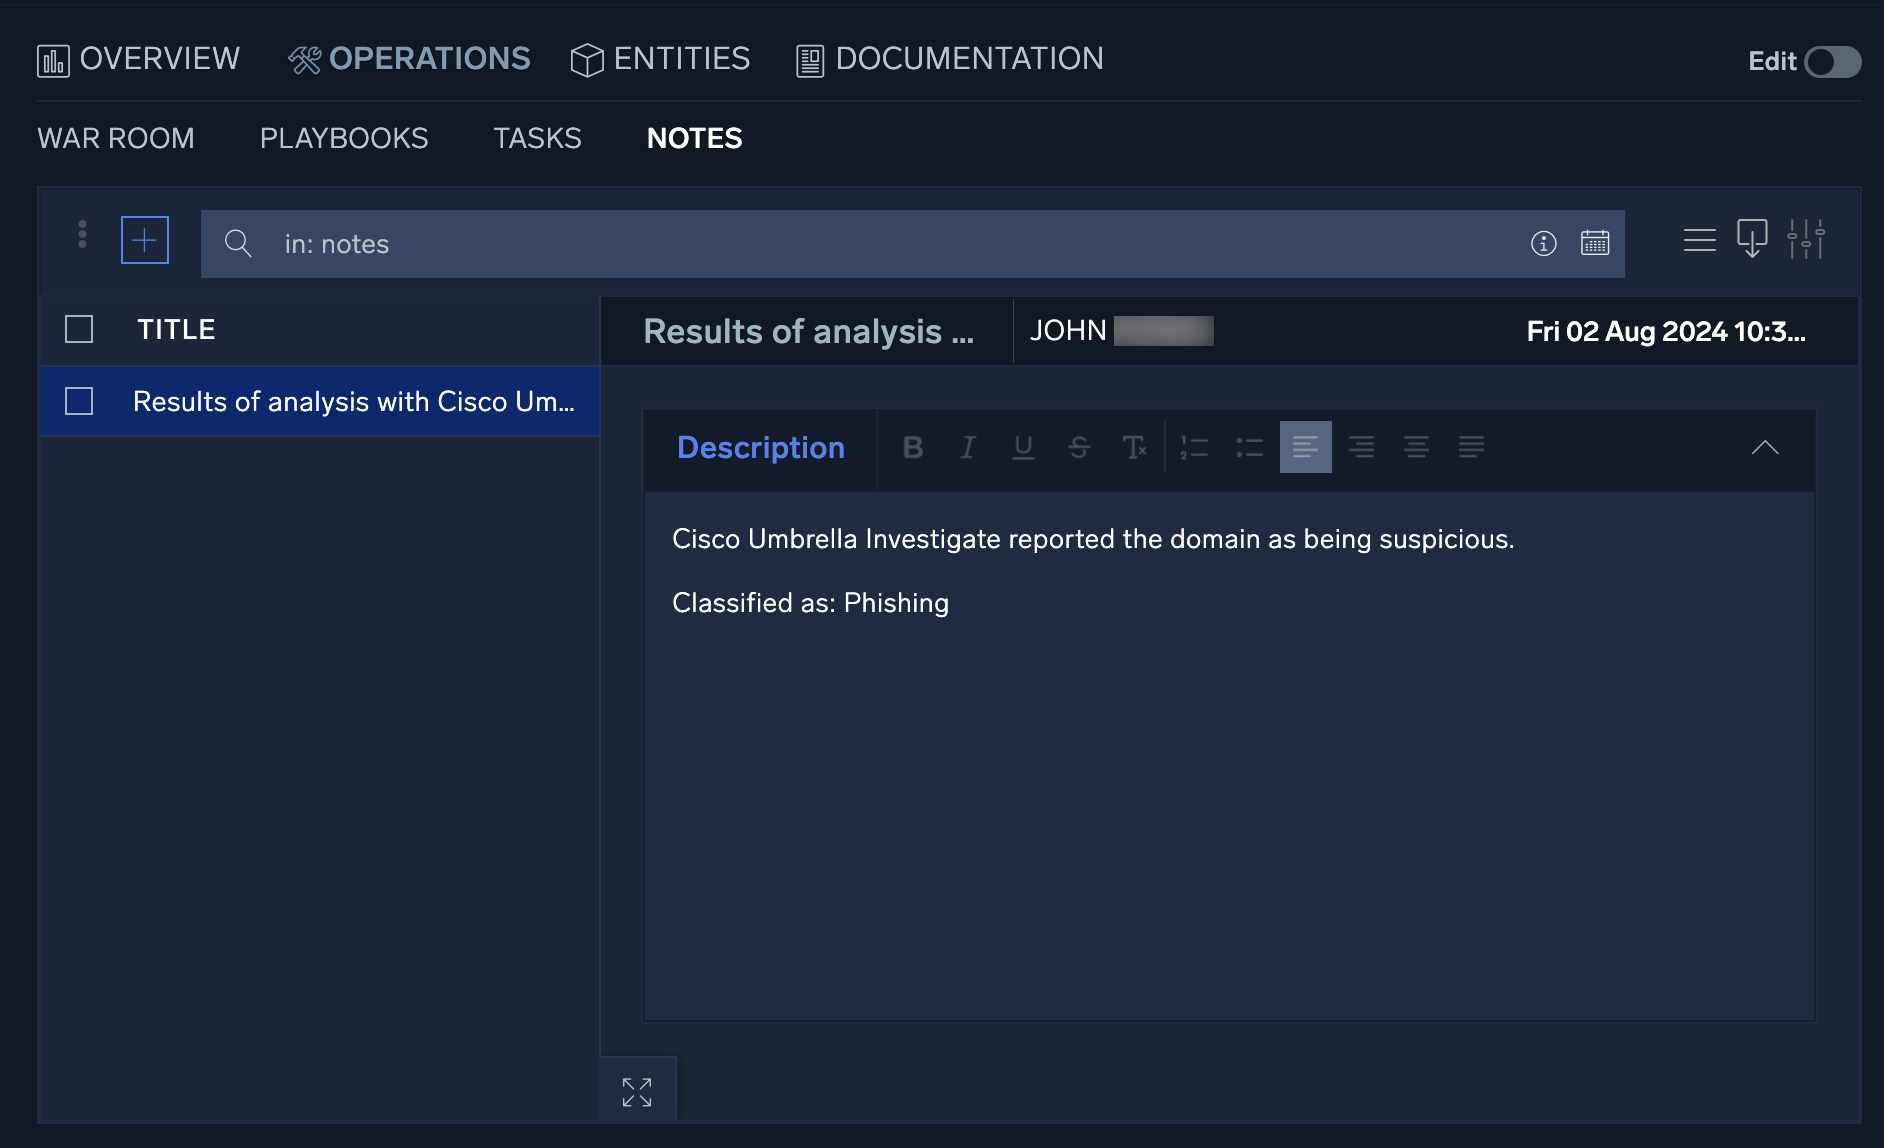
Notes
The Notes section contains all notes either automatically created during a playbook's execution or manually created during the incident's investigation. You can export notes and search for results depending on the operational need.
To explore notes:
- To manually add a note, click + to the left of the search bar and a new configuration screen will appear.
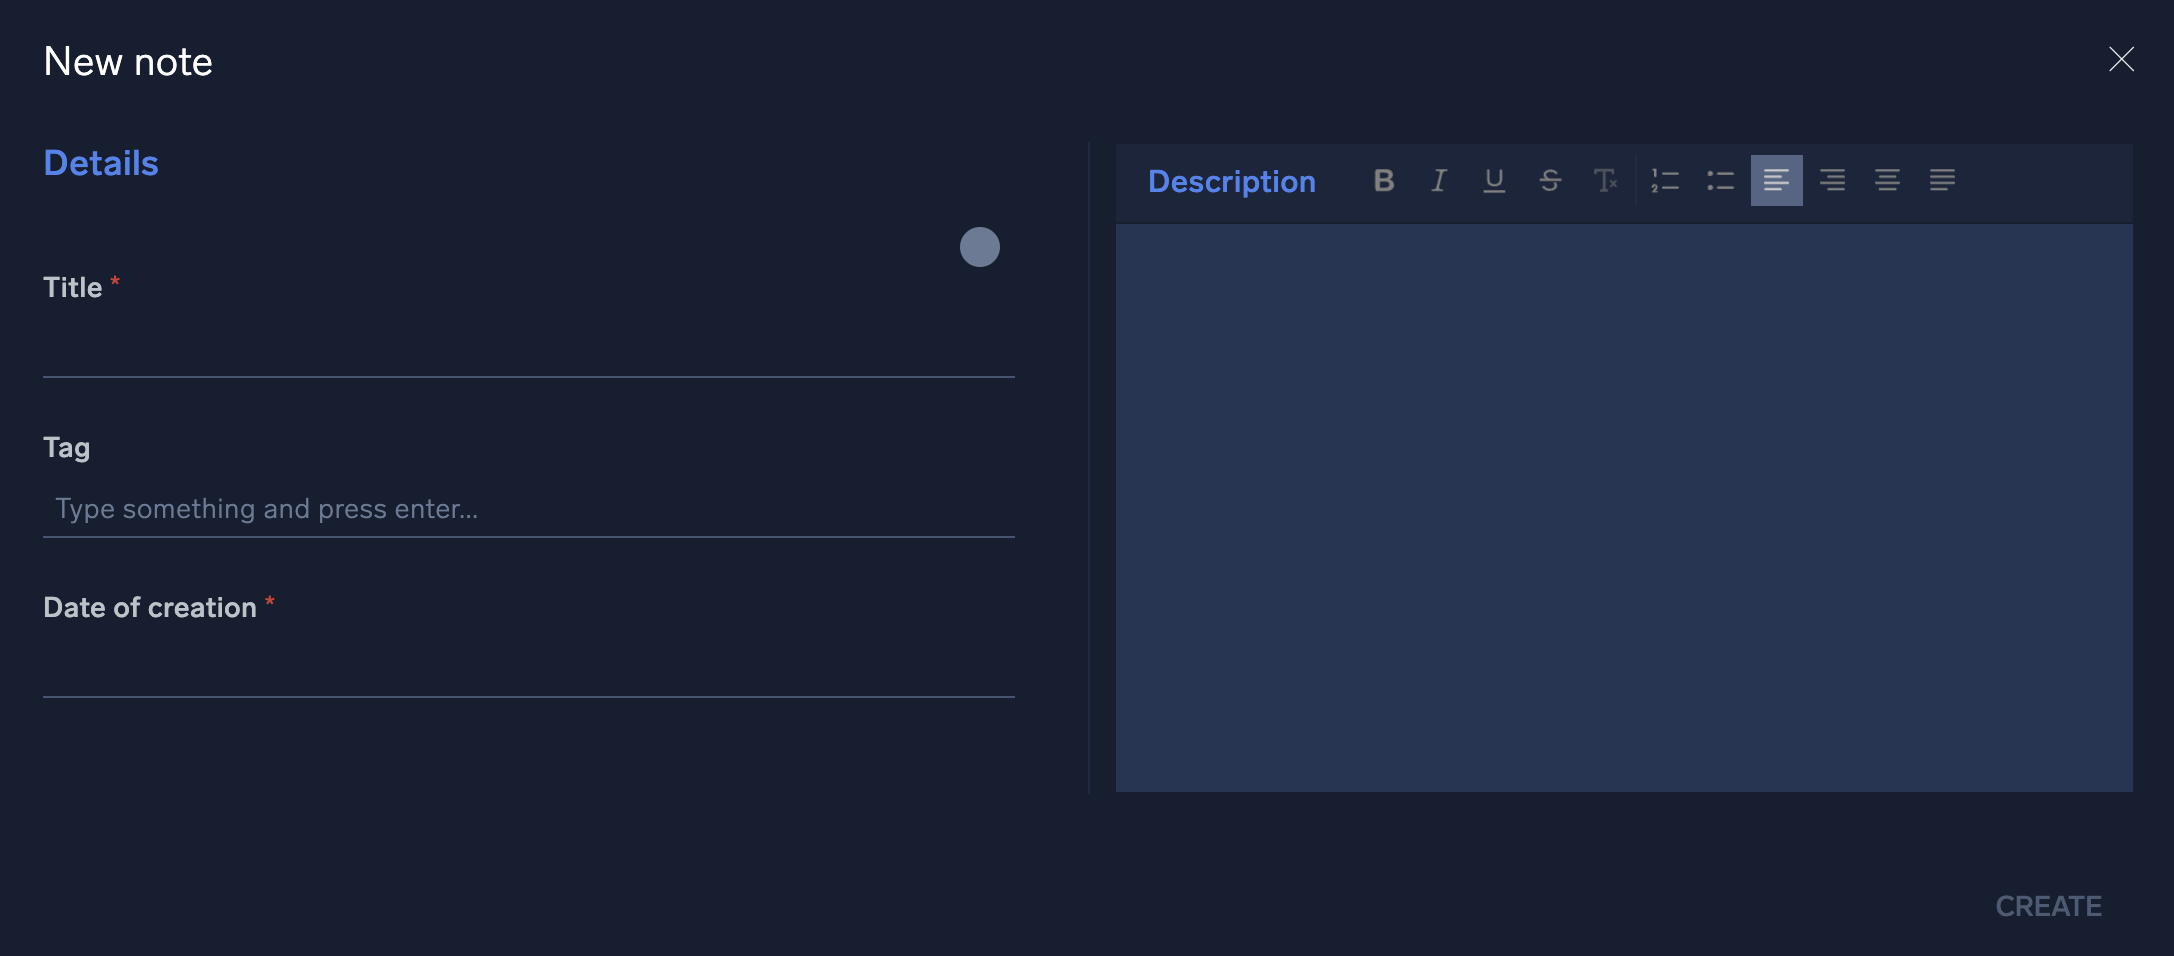
- Enter the note into the free form text box and click Create when finished.
- When you close an incident, the system will prompt you for a note describing the reason.
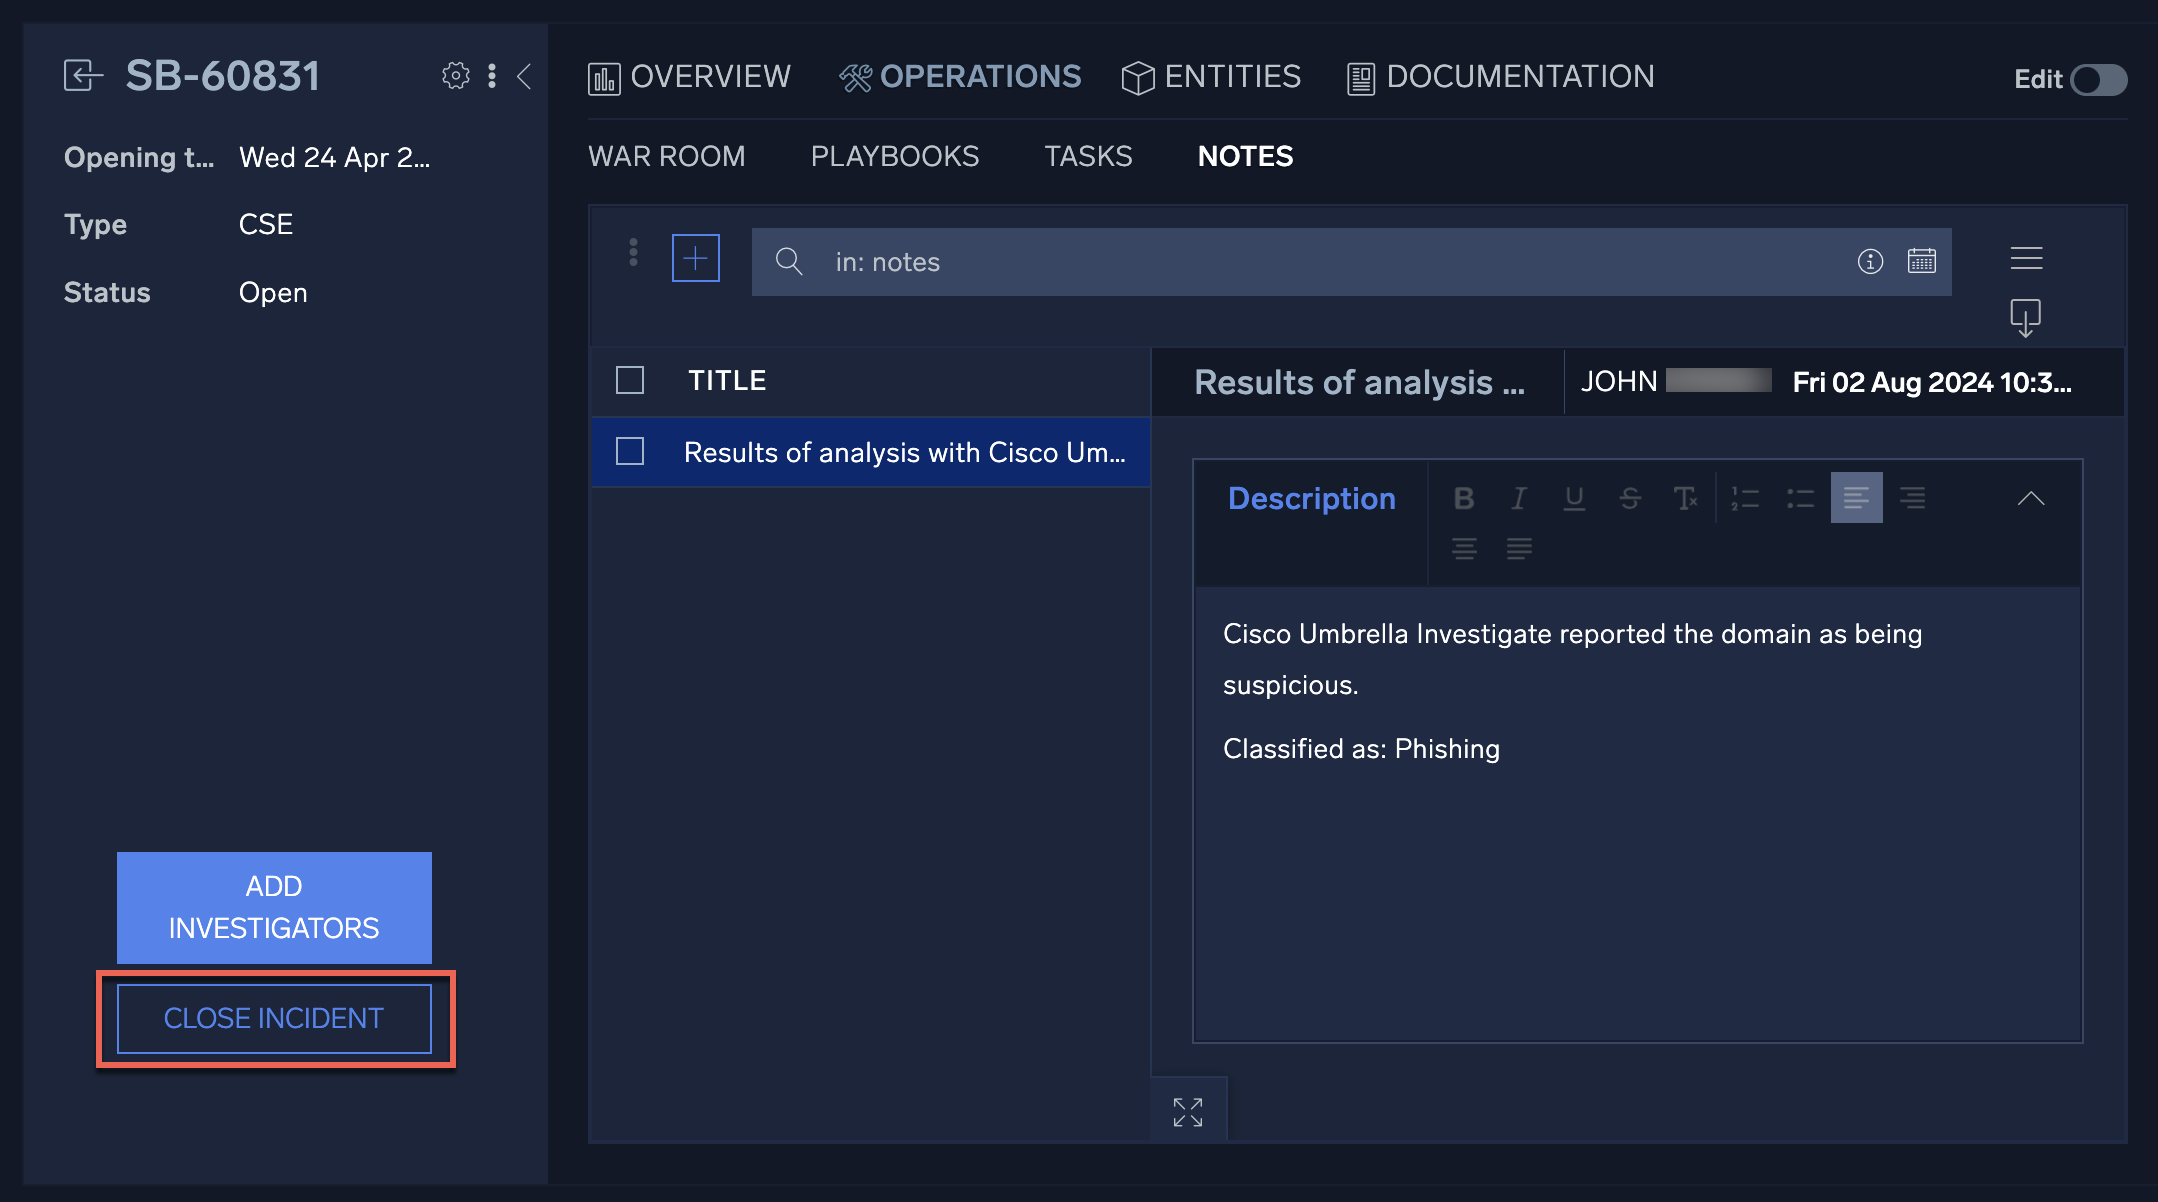
- In the Closing Note field, enter a note explaining the reason for incident closure and click Apply.
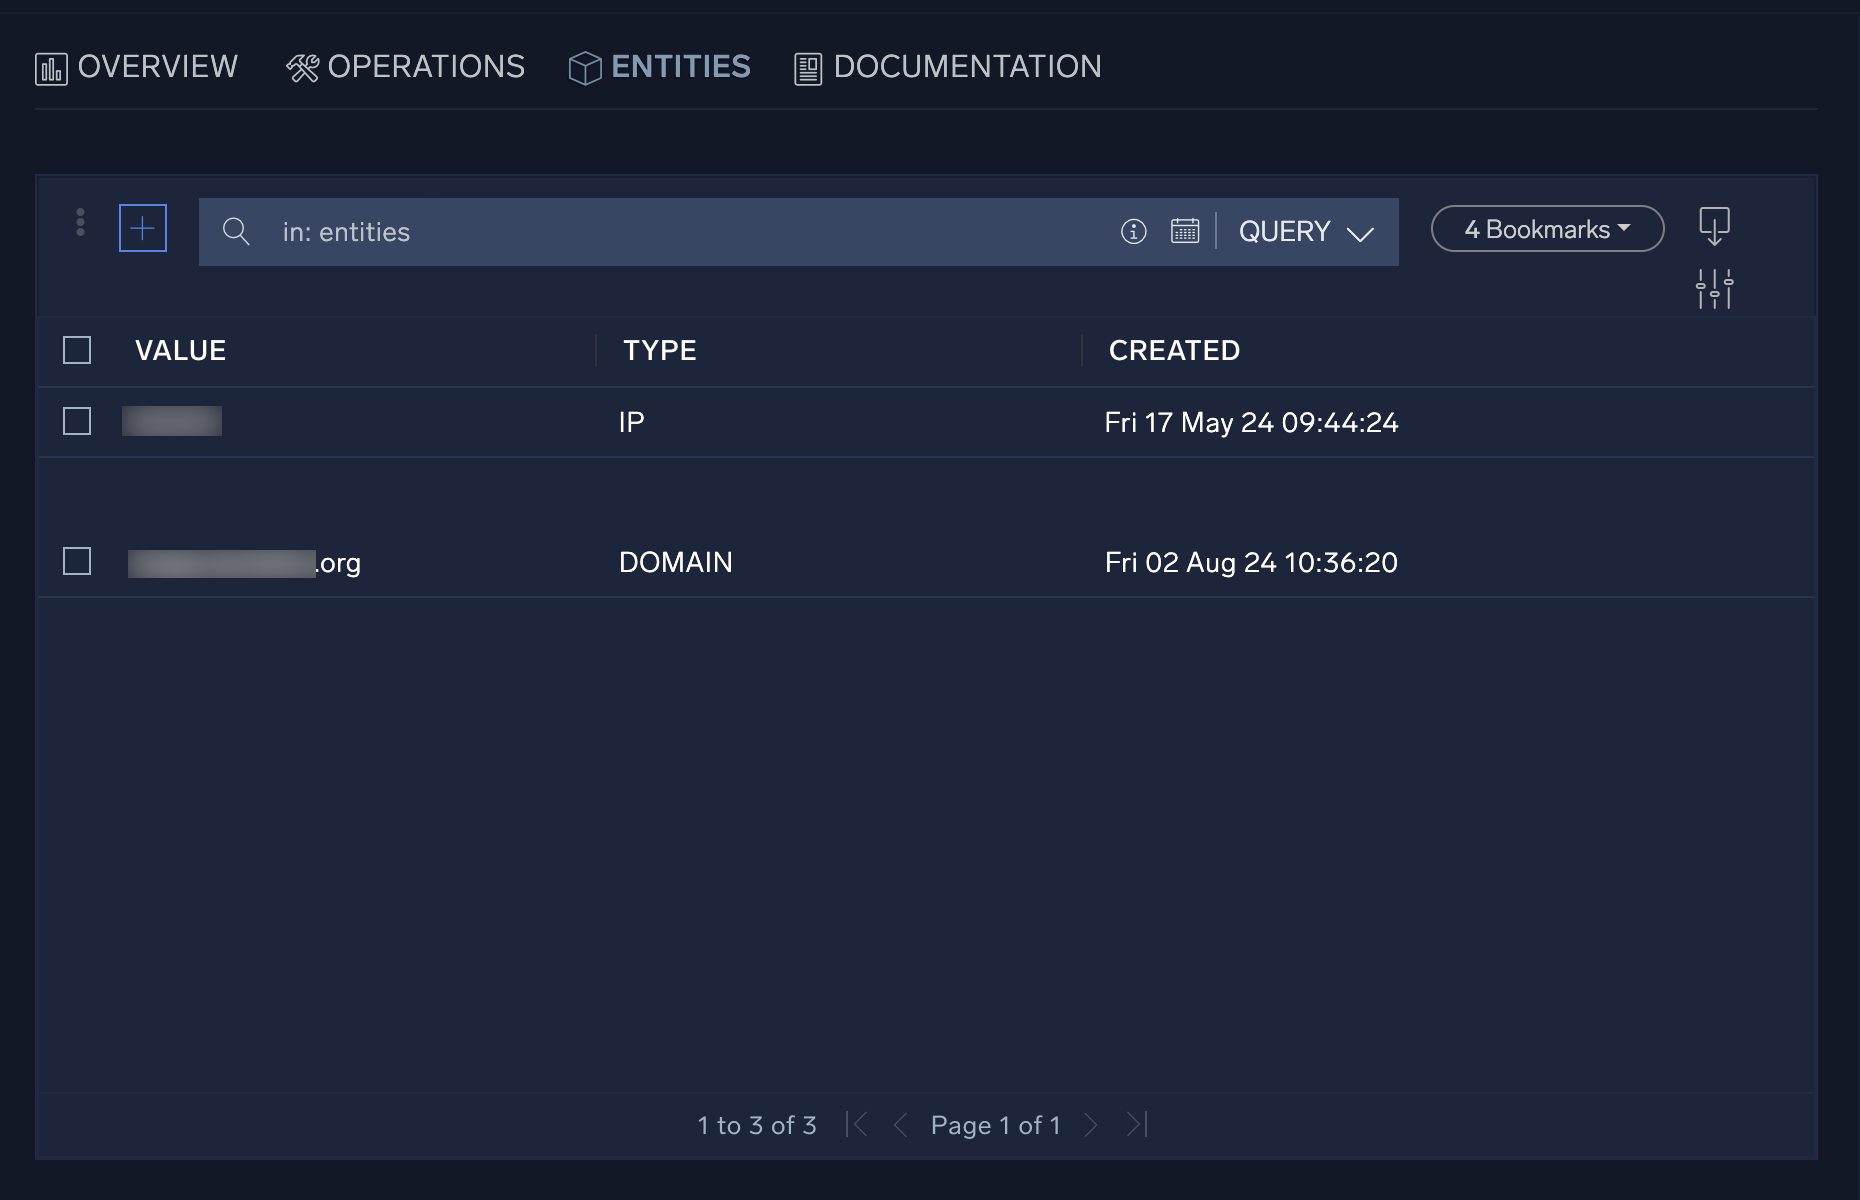
Entities tab
The Entities tab shows the entities associated with the incident. Entities are unique actors encountered in incoming messages, such as a user, IP address, or host.
To see entities for all incidents, open the Entities page. For more information, see Entities.
Documentation tab
The Documentation tab provides investigators with an area to document all steps taken during an incident's investigation.
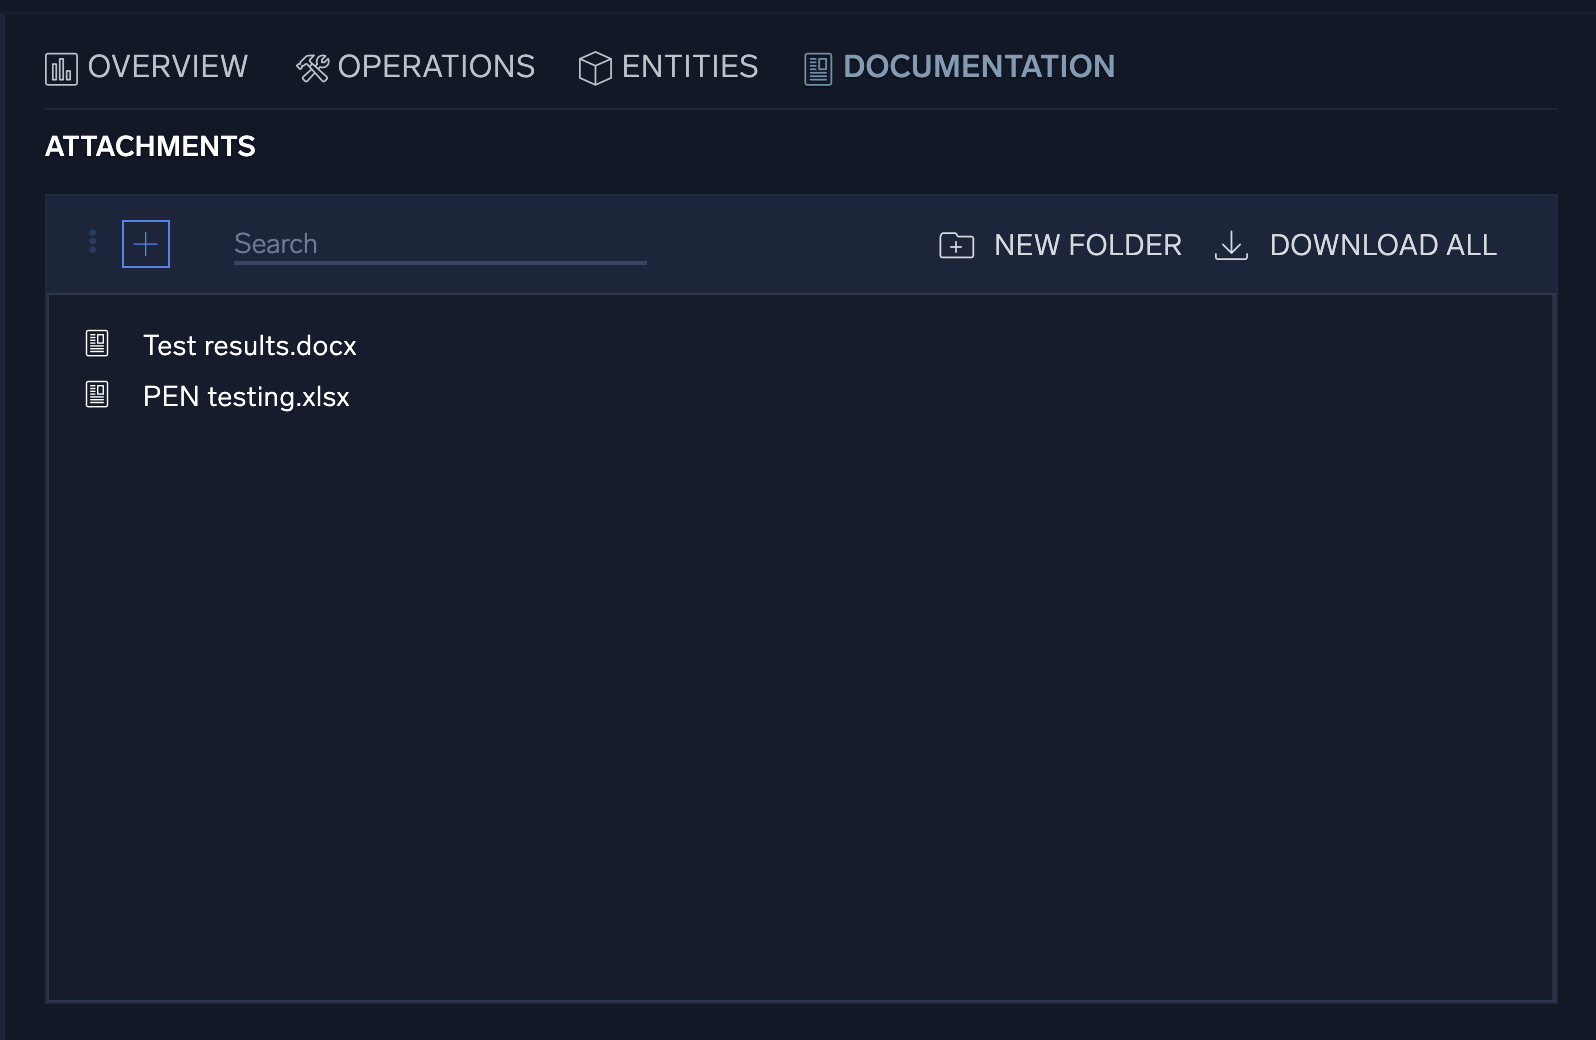
The Attachments section is a repository for investigators to house attachments related to an incident's investigation. The source of this data can vary, but will often be the output of monitoring tools and supporting documents.
To add an attachment, click + to the left of the search bar and provide a description for the attachment. When an attachment is added, the date and the name of the person who added it are recorded with the attachment.
Triage
The Triage screen shows events that have been recorded but not yet converted to incidents.
New UI. To access the Triage screen, in the main Sumo Logic menu select Cloud SOAR > Triage.
Classic UI. To access the Triage screen, in the main Sumo Logic menu select Cloud SOAR. Then in the upper left of the SecOps screen click Incidents > Triage.
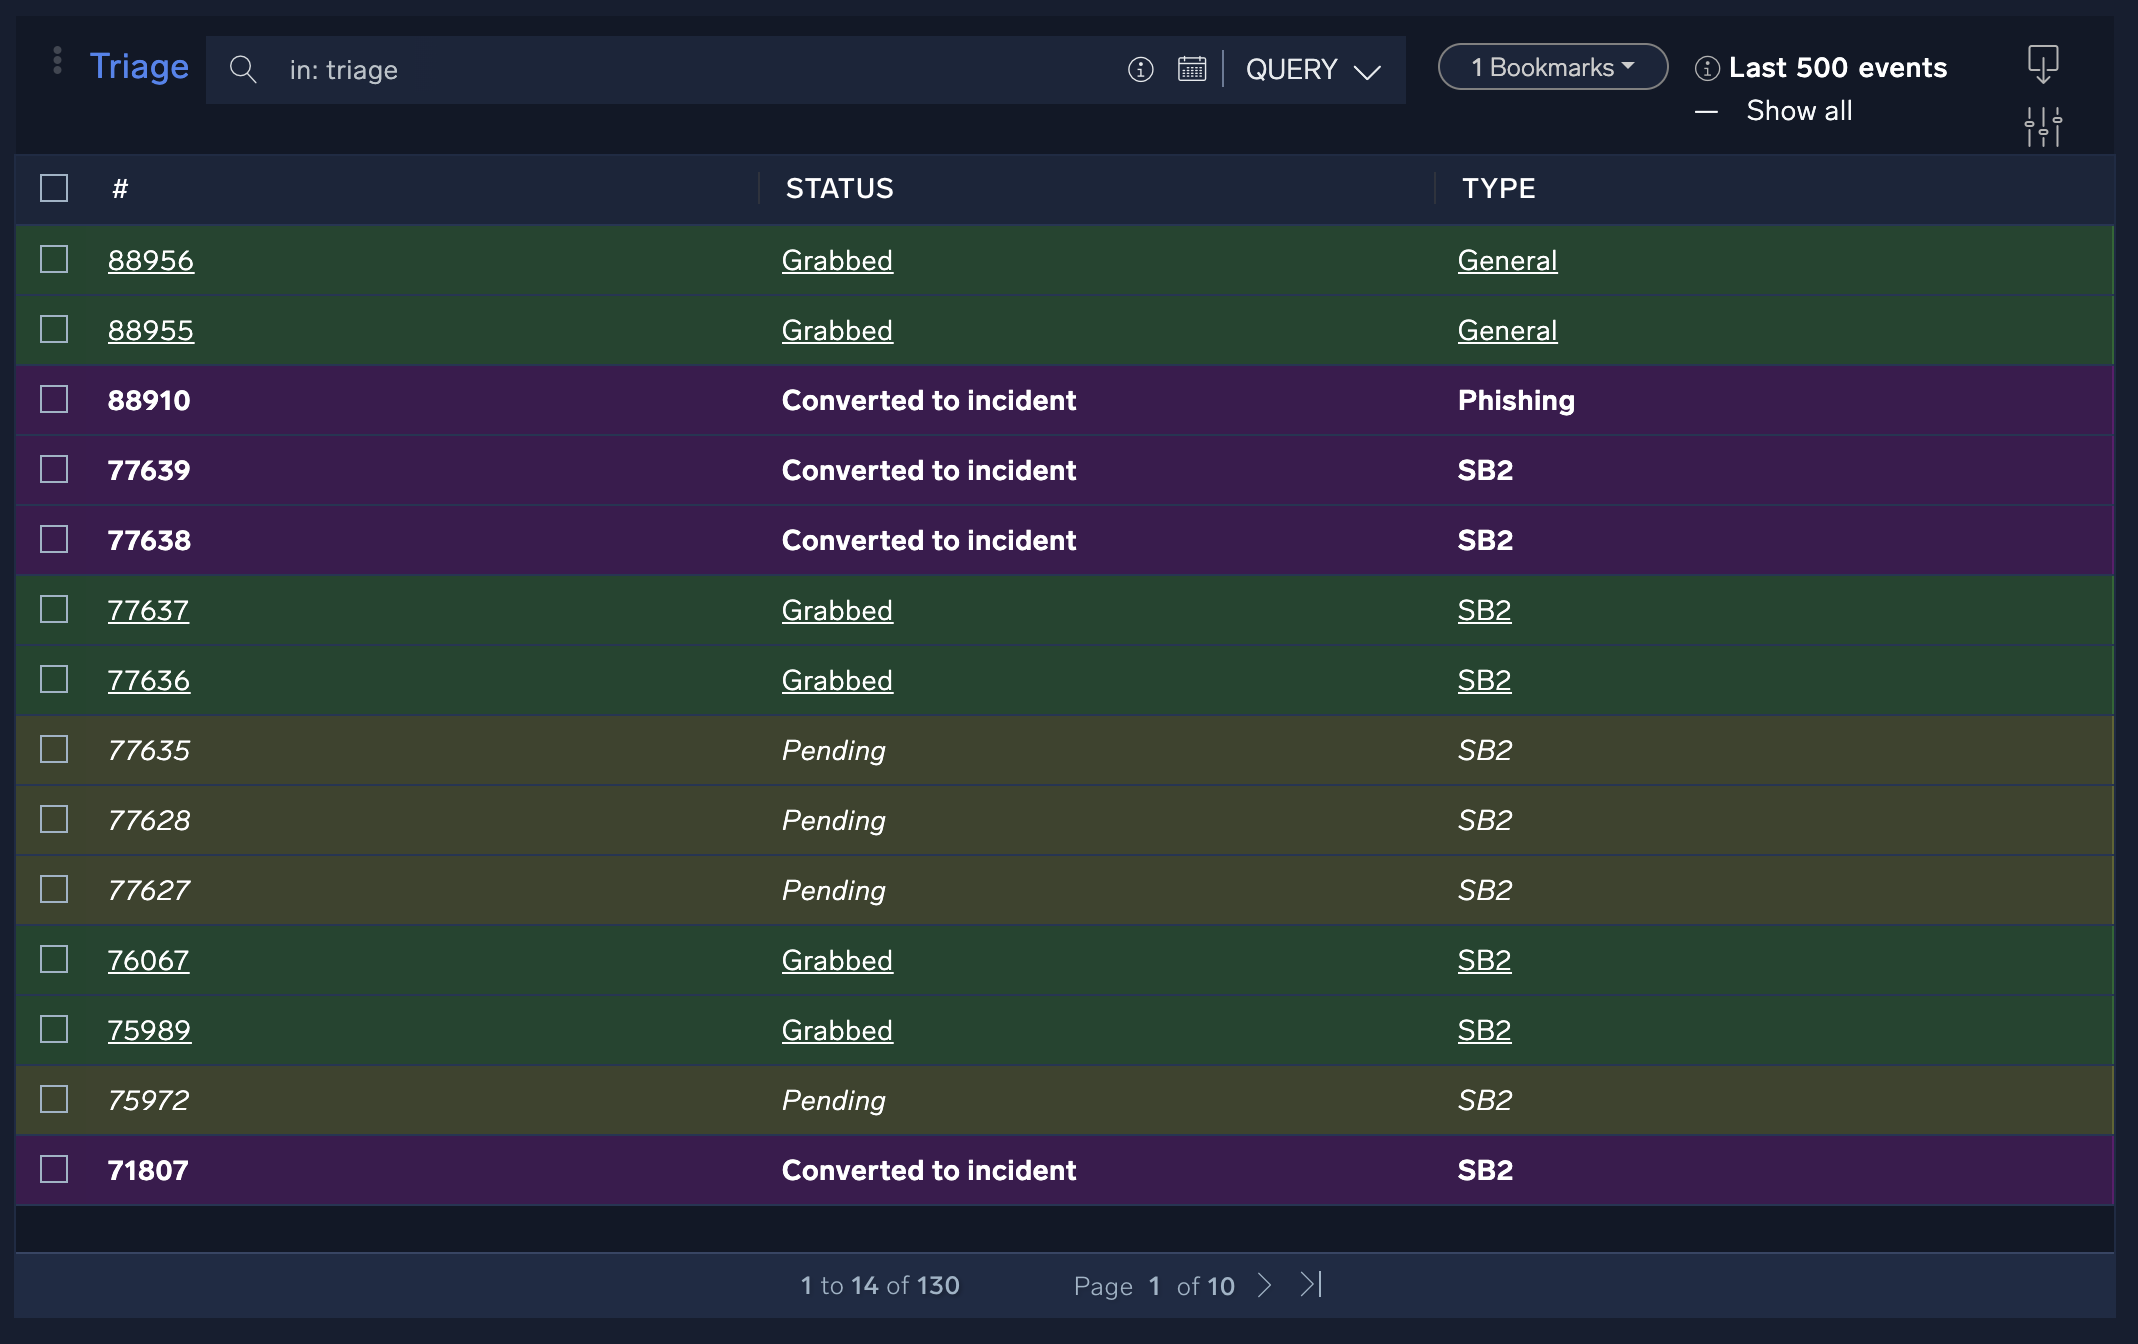
The Cloud SOAR triage module ingests events via the Cloud SOAR API. You can use it to triage events which may be unverified or have a low confidence level before they are converted to incidents. The triage module can be completely customized for use cases from financial fraud to network IDS alerts.
Triage events can be pending (not assigned yet), grabbed (assigned to an analyst), or converted to an incident (either automatically or manually).
Let's suppose you want to look at a pending event to determine if it needs investigation:
- Click a pending event. The event opens.
- You determine that you want to investigate the event. Click the three-dot kebab button and select Grab.
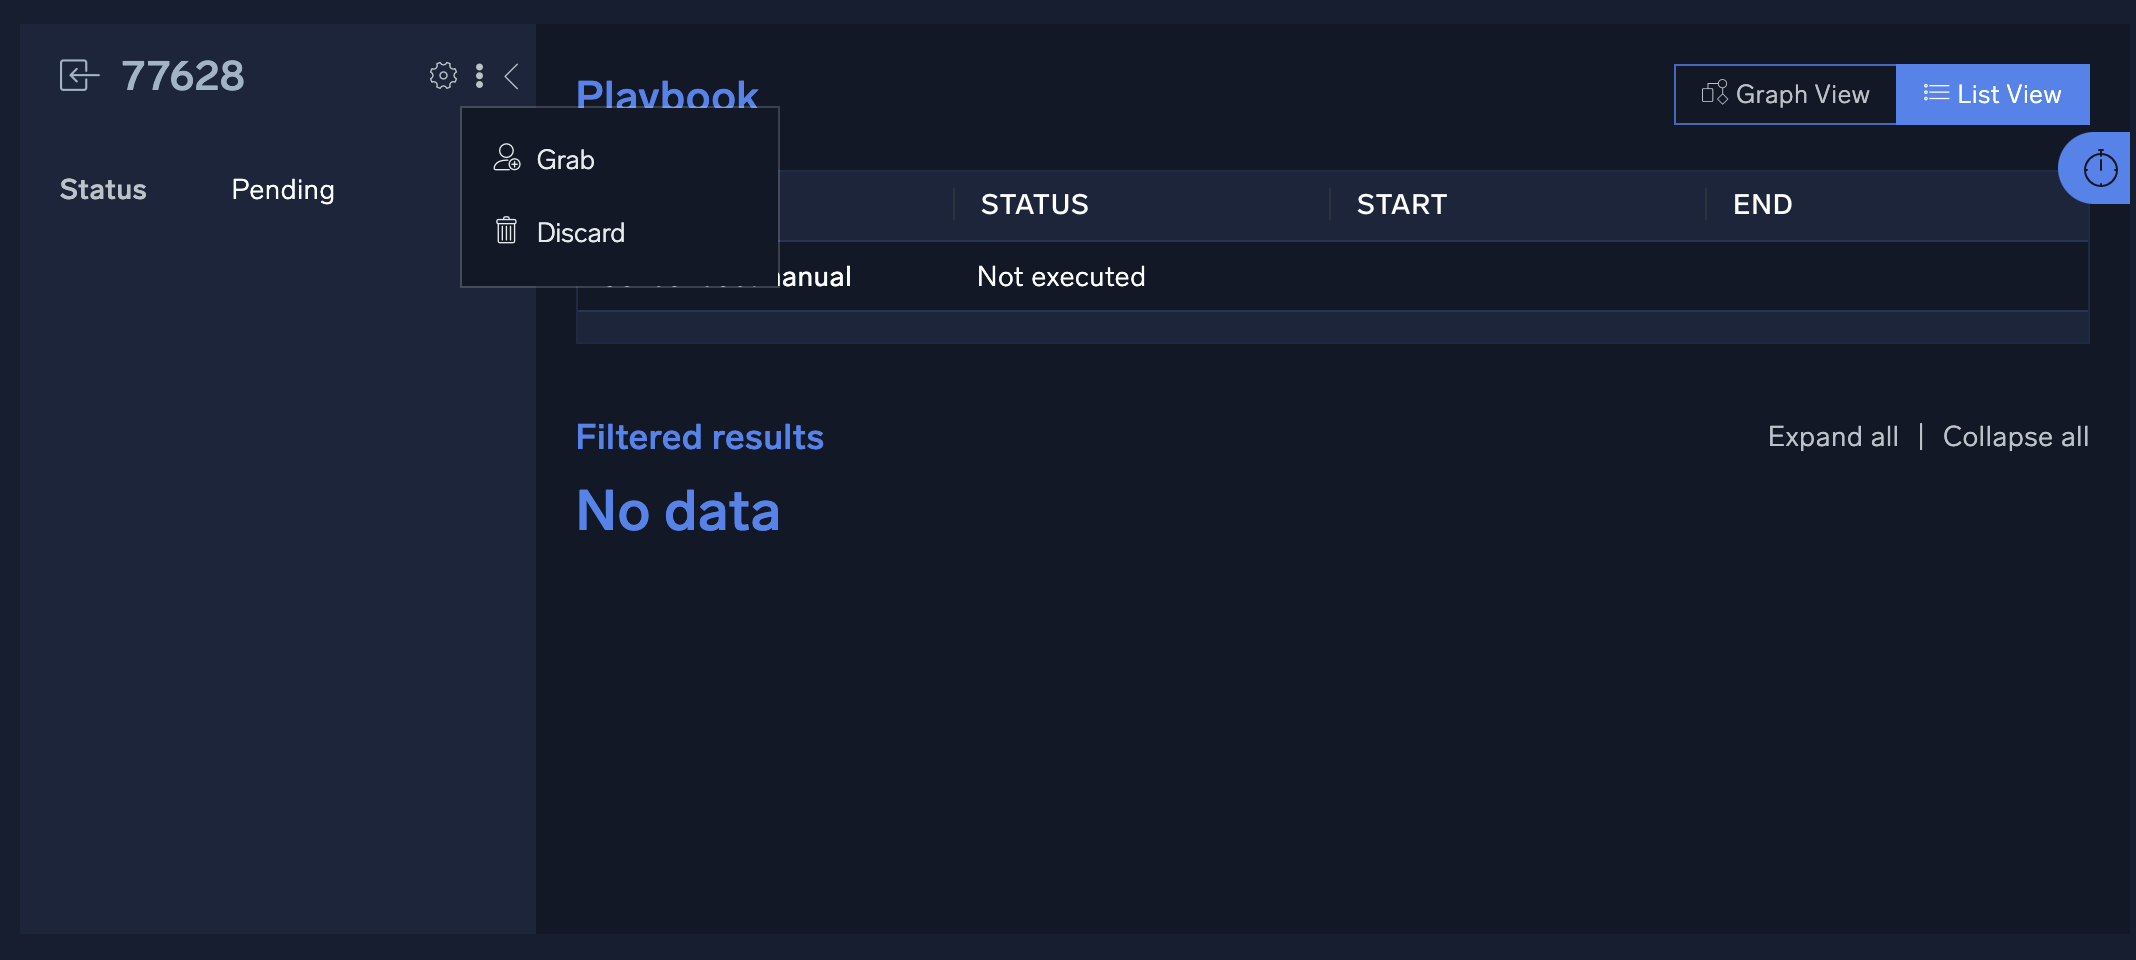
- Once an event is grabbed by an analyst, any playbooks defined for that incident type will be automatically executed and the results will be displayed in the Filtered Results section of the event details screen. Because all playbooks for the specified incident type are automatically executed as soon as the incident is grabbed, it is recommended that separate incident types and playbooks be created for triage events.
- After you triage the event, you may reassign it to another user for further analysis, discard it, or convert it to an incident:
- To reassign the event, click Reassign.
- To discard it, click the three-dot kebab button and select Discard.
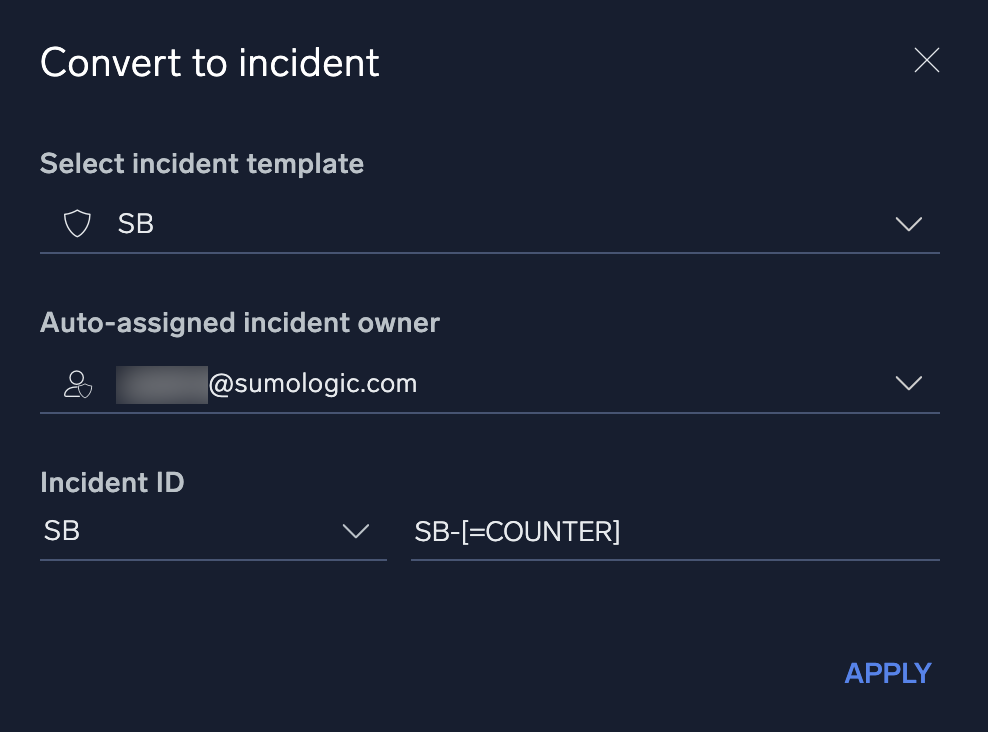
- To convert it an incident, click the three-dot kebab button and select Convert to Incident.
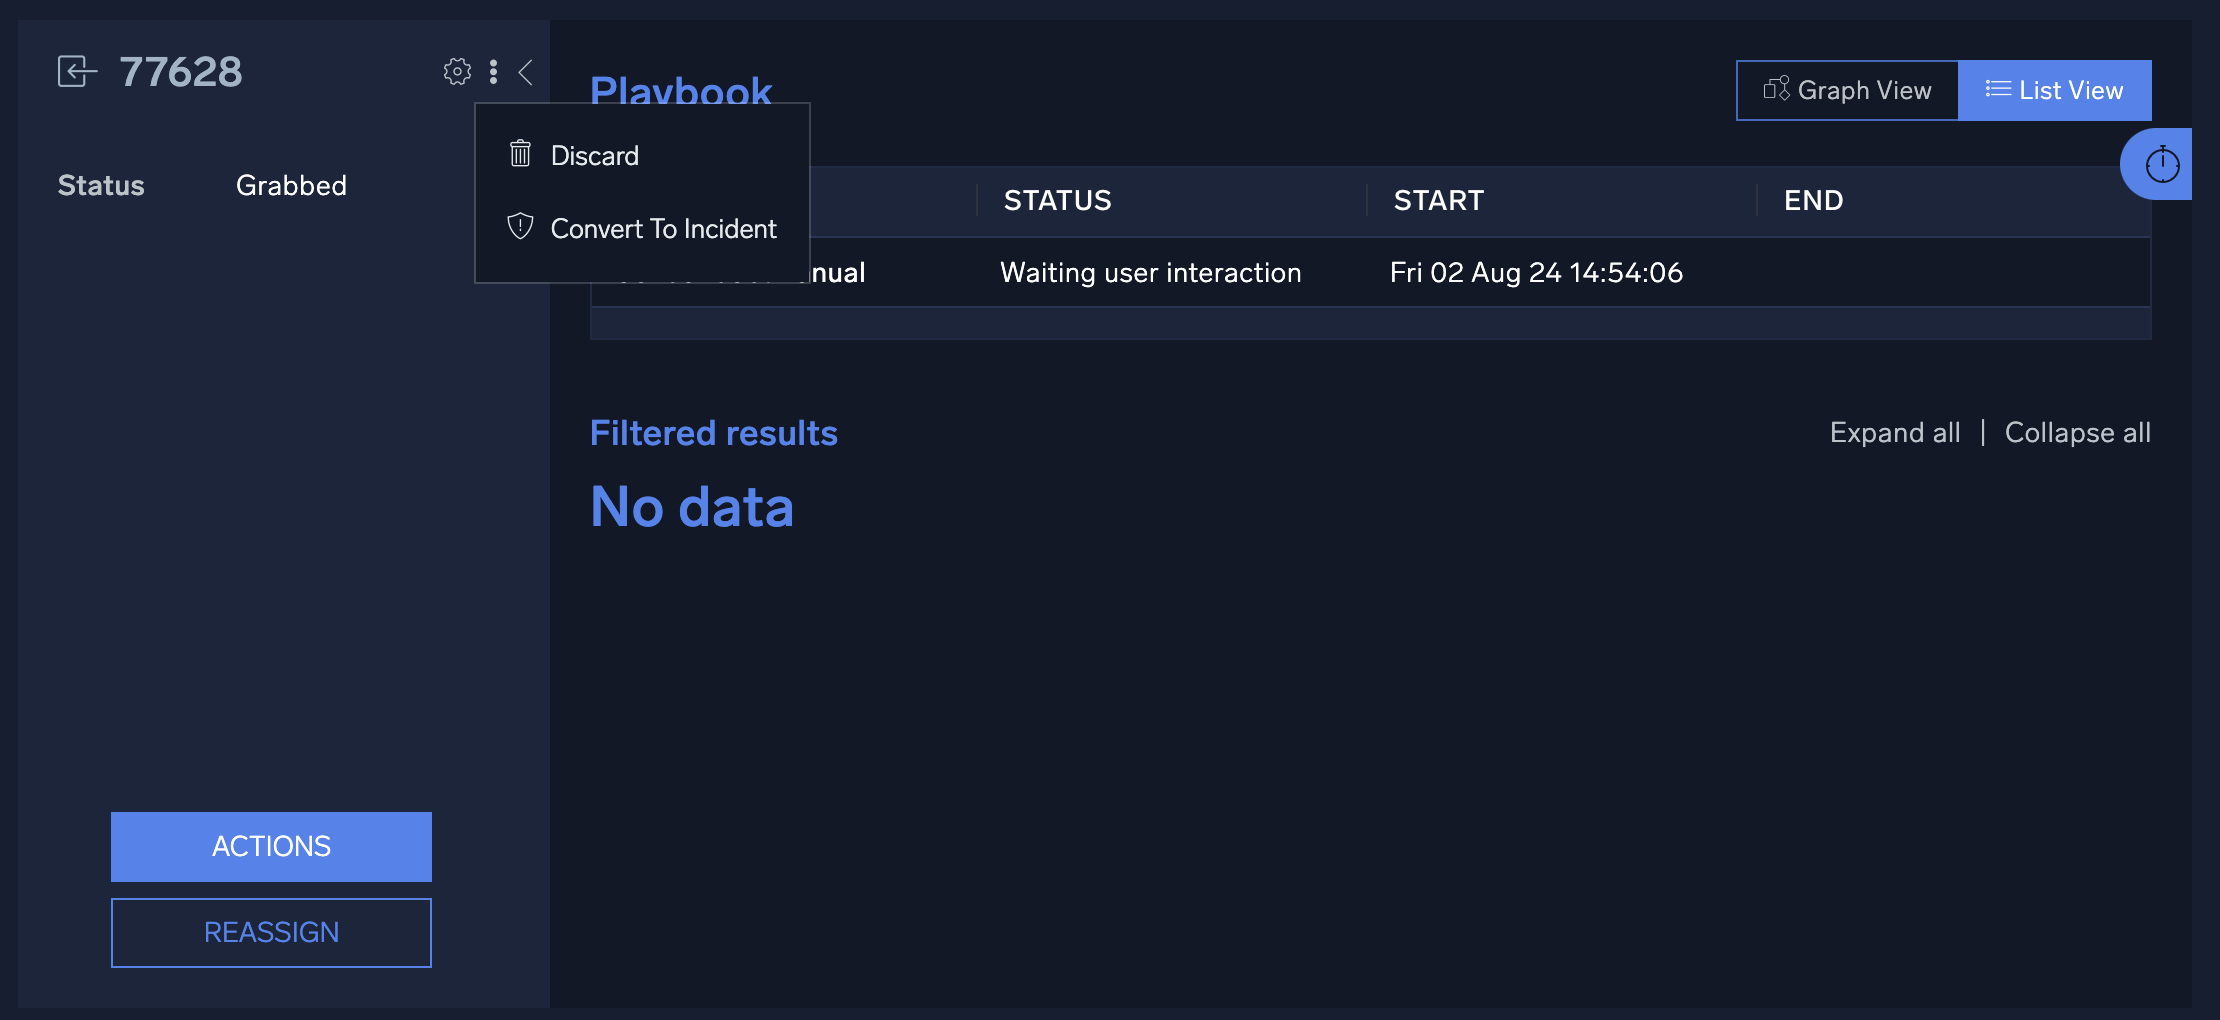
- When you click Convert to Incident, a dialog appears for you to select the conversion settings. Select the appropriate incident template, owner, and ID, then click Apply. The event, including all enrichment information gathered from any playbooks, will be automatically converted to an incident.
Use automation rules to add events to triage
You can create automation rules to evaluate incoming data and route events to the Triage page. This allows you to automatically route suspicious events to triage for evaluation without turning every event into an incident, and to run other automations on the events using playbooks.
Perform the following steps to:
- Create a custom playbook type for triage.
- Create an automation rule to add events to the Triage page (using the Add to Triage action type).
- Create a playbook to run specifically for triage.
- Start by creating a custom playbook type just only for use with triage. This gives you greater control over the playbooks that will run for triage:
- New UI. In the Sumo Logic main menu select Cloud SOAR > Fields.
Classic UI. Click the gear icon in the top right, select Settings, and on the left menu select Customization > Fields.
 - In the Custom Fields dialog select Incidents.
- Hover you mouse over Type and click the Edit button that appears.
- In the Values field, create a playbook type for triage. In the following example, we created a Custom Triage type.
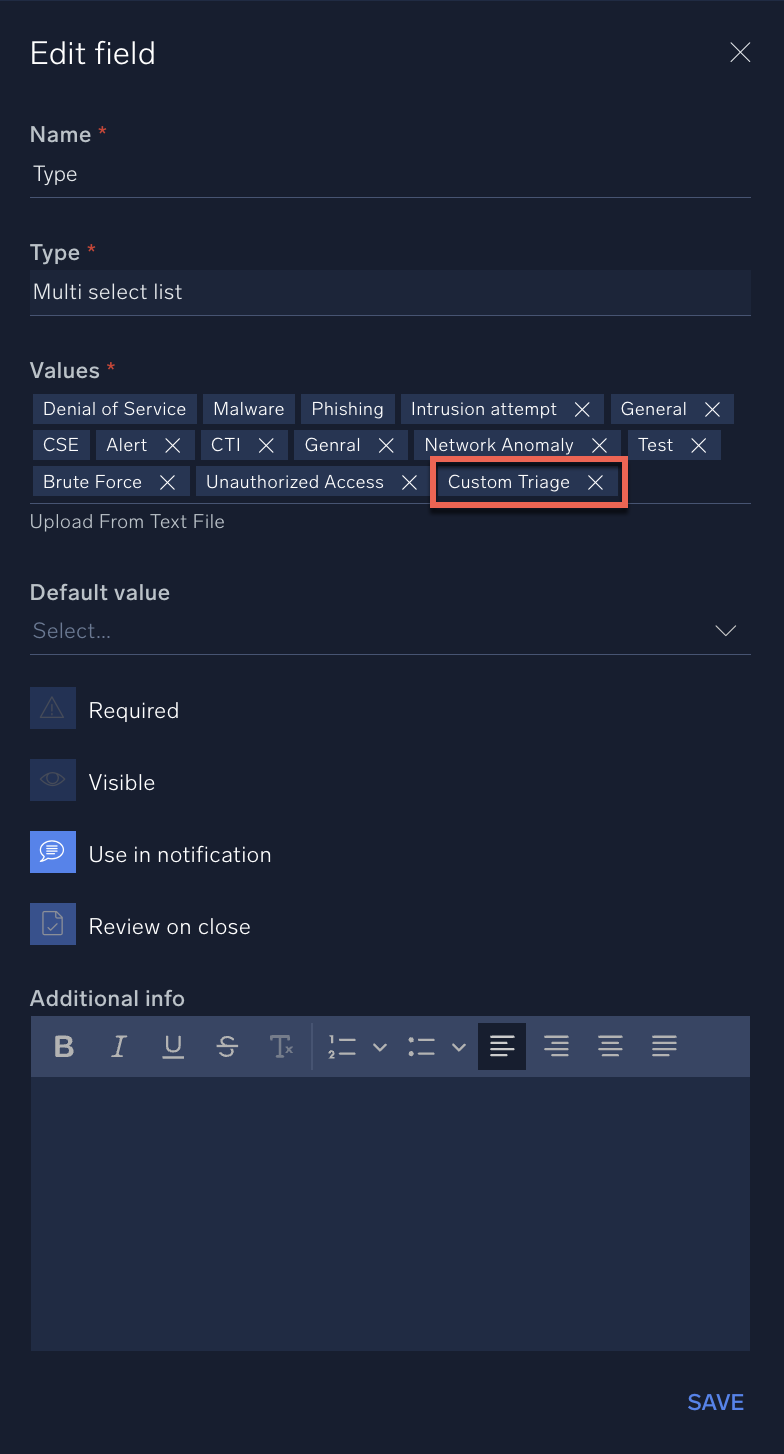
- Click Save. When you create a playbook later, you'll be able to select this custom playbook type.
- New UI. In the Sumo Logic main menu select Cloud SOAR > Fields.
- Create an automation rule that will add events to triage:
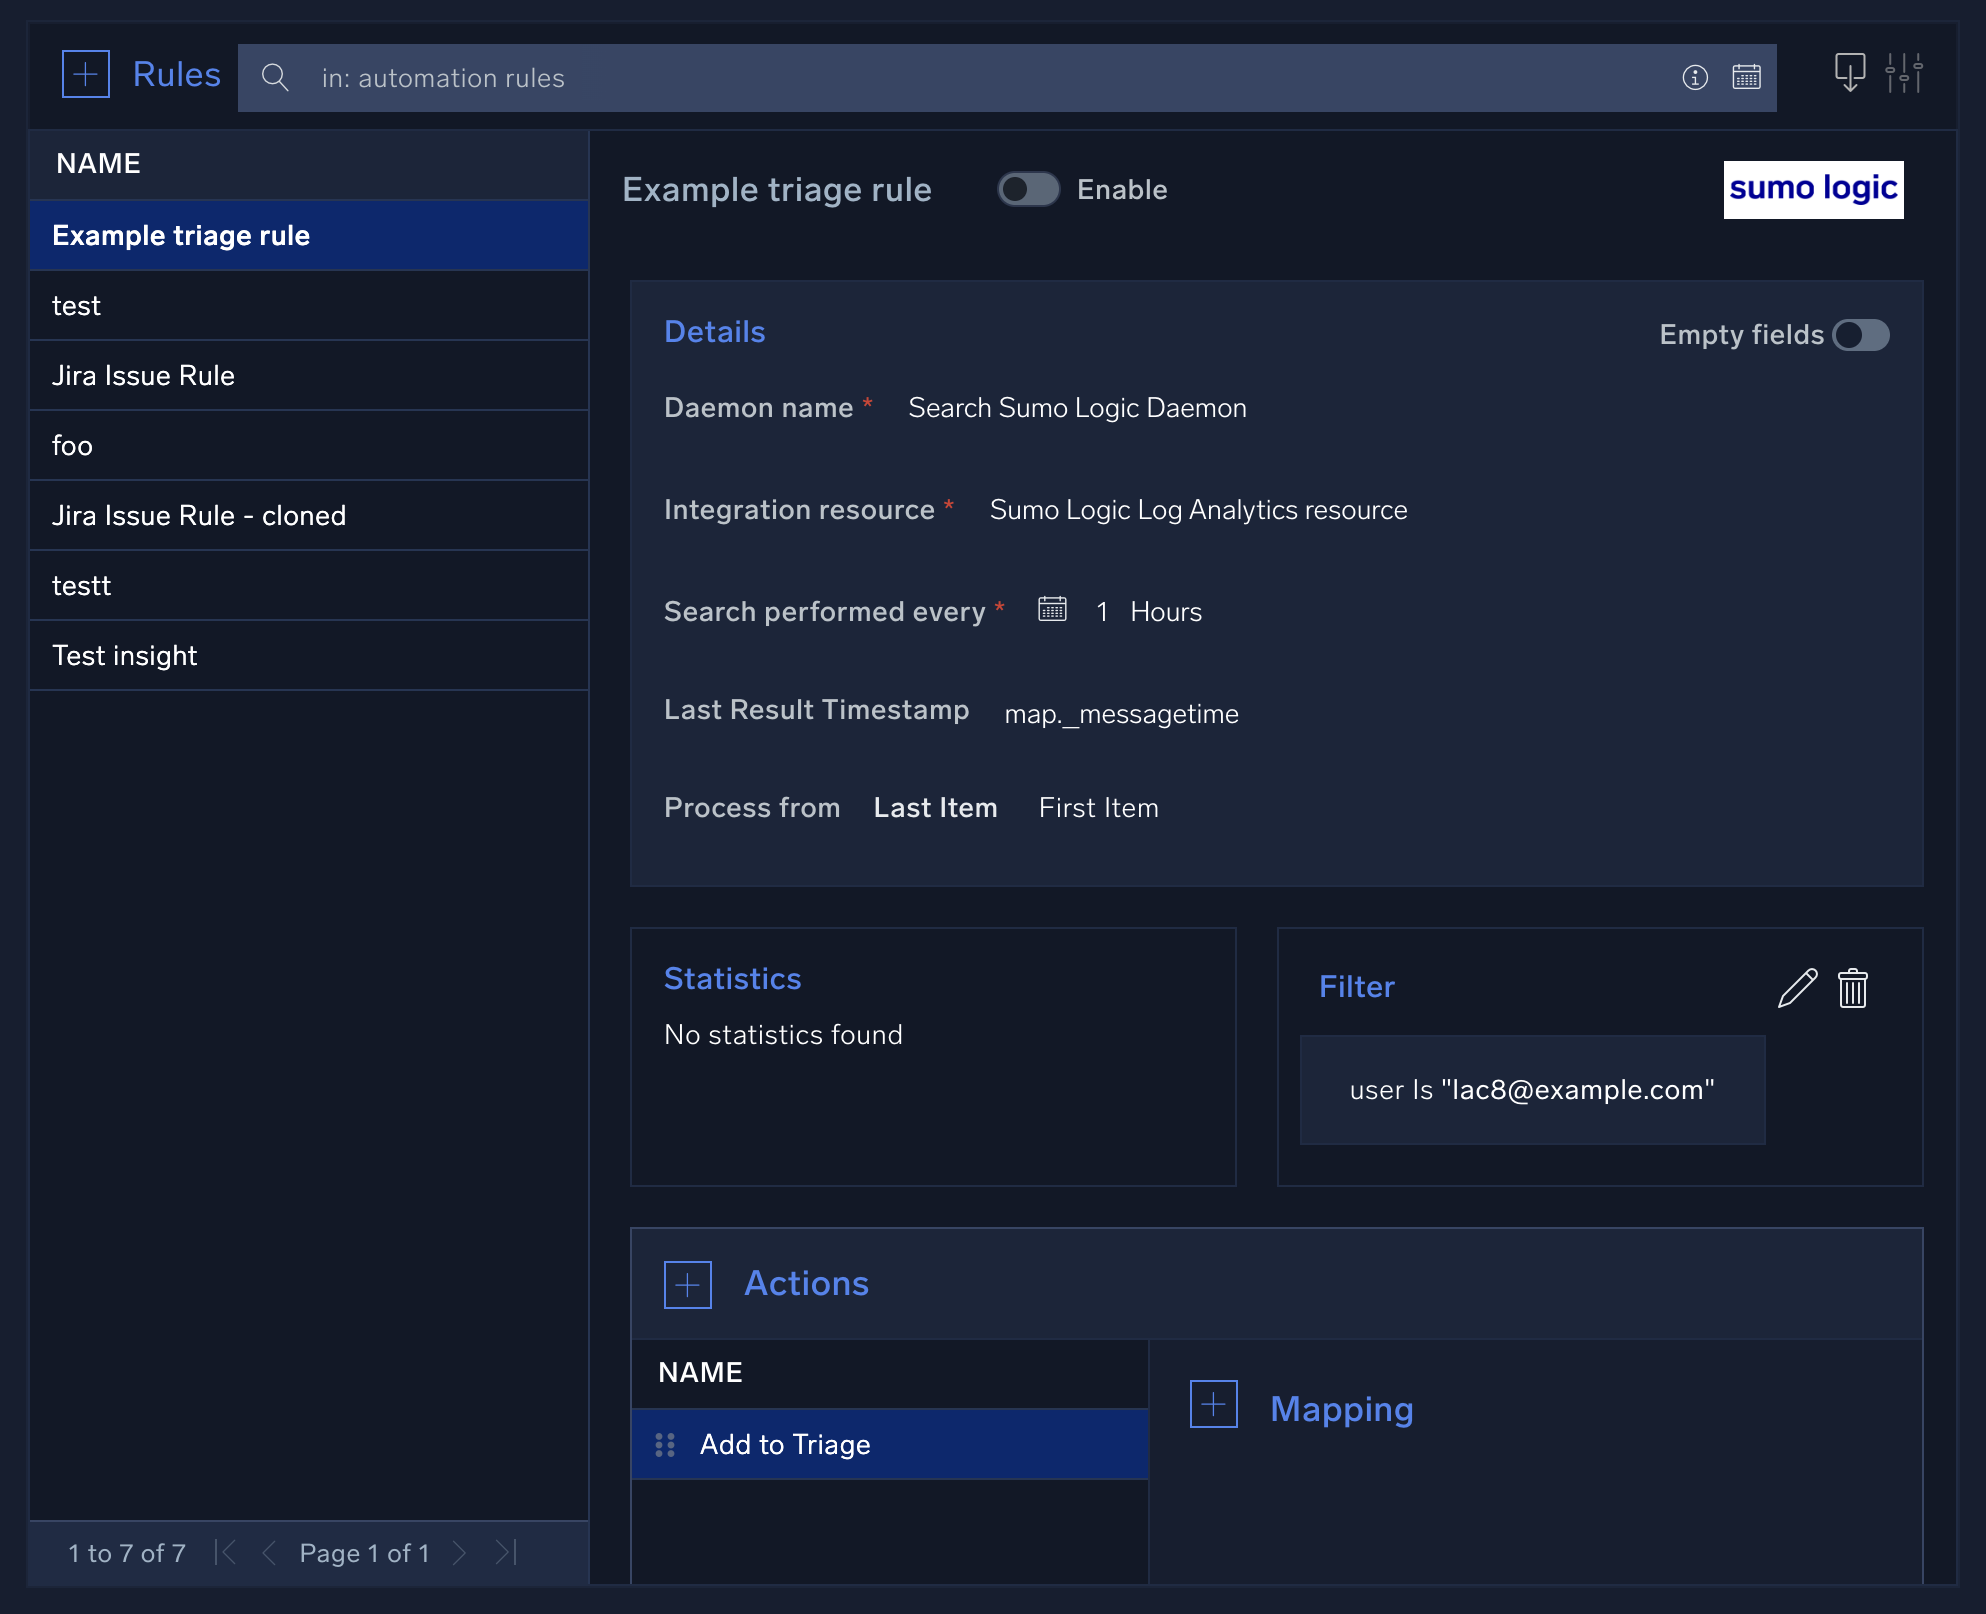
- New UI. In the main Sumo Logic menu select Automation > Rules. You can also click the Go To... menu at the top of the screen and select Rules.
Classic UI. Click the gear icon in the top right, select Automation, and then select Rules in the left nav bar. - Click + to the left of Rules.
- On the Add Automation Rule dialog, select a name for the rule (for example, Triage example). Then select the daemon to use with this new rule, the resource, and fill in all the remaining parameters that you'd like this rule to use.
- Click Save. The rule appears in the list of available automation rules.
- In the Filters field of your triage automation rule, make sure to click the Edit button to add filtering. This is very important to properly evaluate the incoming data and determine when to add an event to triage.
- Click + to the left of Actions.
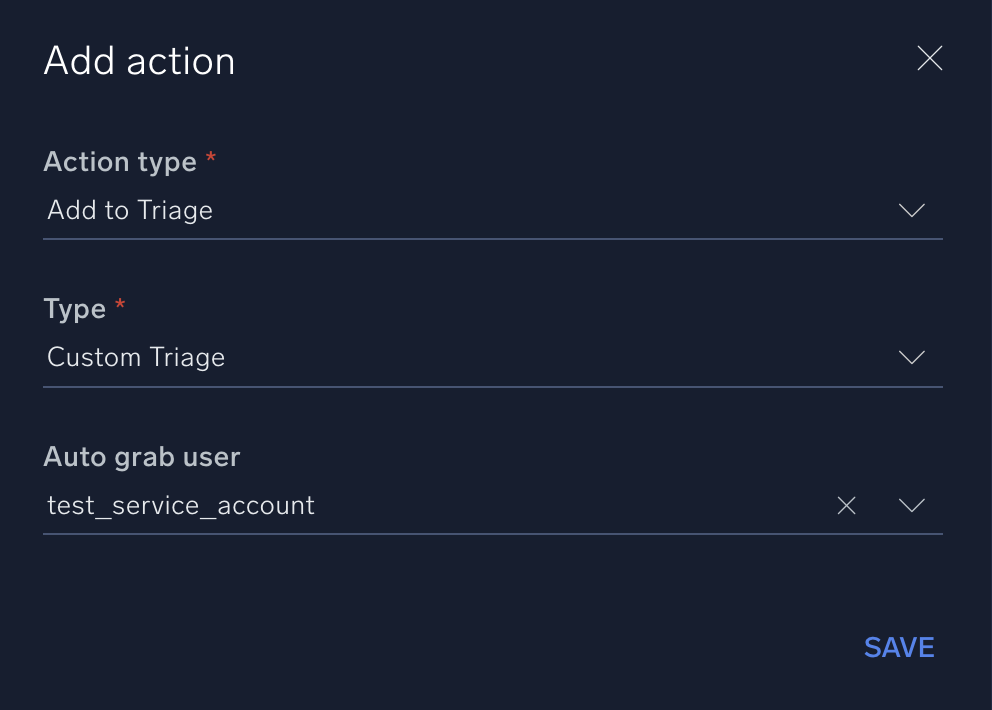
- In the Add action dialog, select the following:
- Action Type. Select Add to Triage. This is the action that automatically adds events to the Triage page.
- Type. Select the playbook type you added in step 1 above (for example, Custom Triage). When the automation rule runs, it will execute all the playbooks that have this type. (While you can select one of the out-of-the-box types here, for our example select your custom type to give you more control over the playbooks that will run.)
- Auto grab user. Select a user to automatically grab the triage when it is added to the Triage page. You can also leave this field empty if you don't want an analyst or group to automatically grab the triage event.
- Click Save.
- When done, your automation rule should look something like this. Note that your automation rule should have the Add to Triage action in order to add events to triage.
- New UI. In the main Sumo Logic menu select Automation > Rules. You can also click the Go To... menu at the top of the screen and select Rules.
- Create playbooks with the custom playbook type you created in step 1 above (for example, Custom Triage):
- Create a new playbook.
- In the Type field of the New Playbook dialog, select the custom playbook type you created earlier (for example, Custom Triage).
- Configure the playbook to run actions on the triage event. For example, you could add actions from the Triage Tools integration to do things like discard the triage event, grab or reassign the triage event, or convert the triage to an incident.
- Enable the playbook.
Once you enable the triage automation rule you created above, when a triage event is grabbed by an analyst, any playbooks defined for that type (in our example, Custom Triage) will be automatically executed. Because all playbooks for the specified playbook type are automatically executed as soon as the triage event is grabbed, we recommended that you create separate playbook types and playbooks for triage events. Keep in mind that you can nest playbooks to run specific workflows for triage.
Triage field settings
By default, the triage module contains two fields, Status and Type. Additional values may be added to the Status field; however, the Type field is directly linked to the incident type field and cannot be modified directly.
New types must be added from the incidents section of the Custom Fields page. Up to 100 custom fields and be created for the triage module, allowing customization for any use case. To add additional custom fields for triage, see Custom fields.
Note that to be able to filter events in the triage module based on the values of a field, Use as filter must be checked when adding or modifying a field. As fields are created, they will be assigned a number starting at 1, which will be used to identify the field when adding events via the API. The first field added will be identified as opt_1, the second as opt_2, and so on. Regardless of the ordering of the fields on the screen, these numbers will remain the same. If a field is deleted, the number will not be reused. For example, if you have defined opt_1 through opt_8 and delete the field opt_8, the next field added will still become opt_9. It is important to remember these field numbers, as they will be used when the API is invoked.
Attributes sent from Cloud SIEM
You can ingest Cloud SIEM Insights into Cloud SOAR for incident triage using the GetInsight Cloud SOAR API. The following Insight attributes are returned.
When you create an incident from an Insight, you can map the Insight attributes to fields in Cloud SOAR as follows:
| Attribute in Cloud SIEM | Field in Cloud SOAR |
|---|---|
assignee | Insight Assignee (custom field) |
created | Start time |
description | Additional Info |
entity.value | Primary Entity (custom field) |
entity.type | Entity Type (custom field) |
id | Insight ID (custom field) |
involvedEntities[].value | Involved Entities (custom field) |
readableId | Incident ID |
severity | Severity |
status.displayName | Status |
tags[] | Tags |
When creating incidents from Insights, adding additional required attributes to the incident template will result in an error. Only those attributes sent over with Insights can be used as required attributes on the template.
Entities
The Entities screen shows information about entities, unique actors encountered in incoming messages, such as a user, IP address, or host. Entities displayed here are from all incidents. To see entities associated with a specific incident, see Entities tab.
New UI. To access the Entities screen, in the main Sumo Logic menu select Cloud SOAR > Entities.
Classic UI. To access the Entities screen, in the main Sumo Logic menu select Cloud SOAR, and then click the Entities button at the top of the screen.
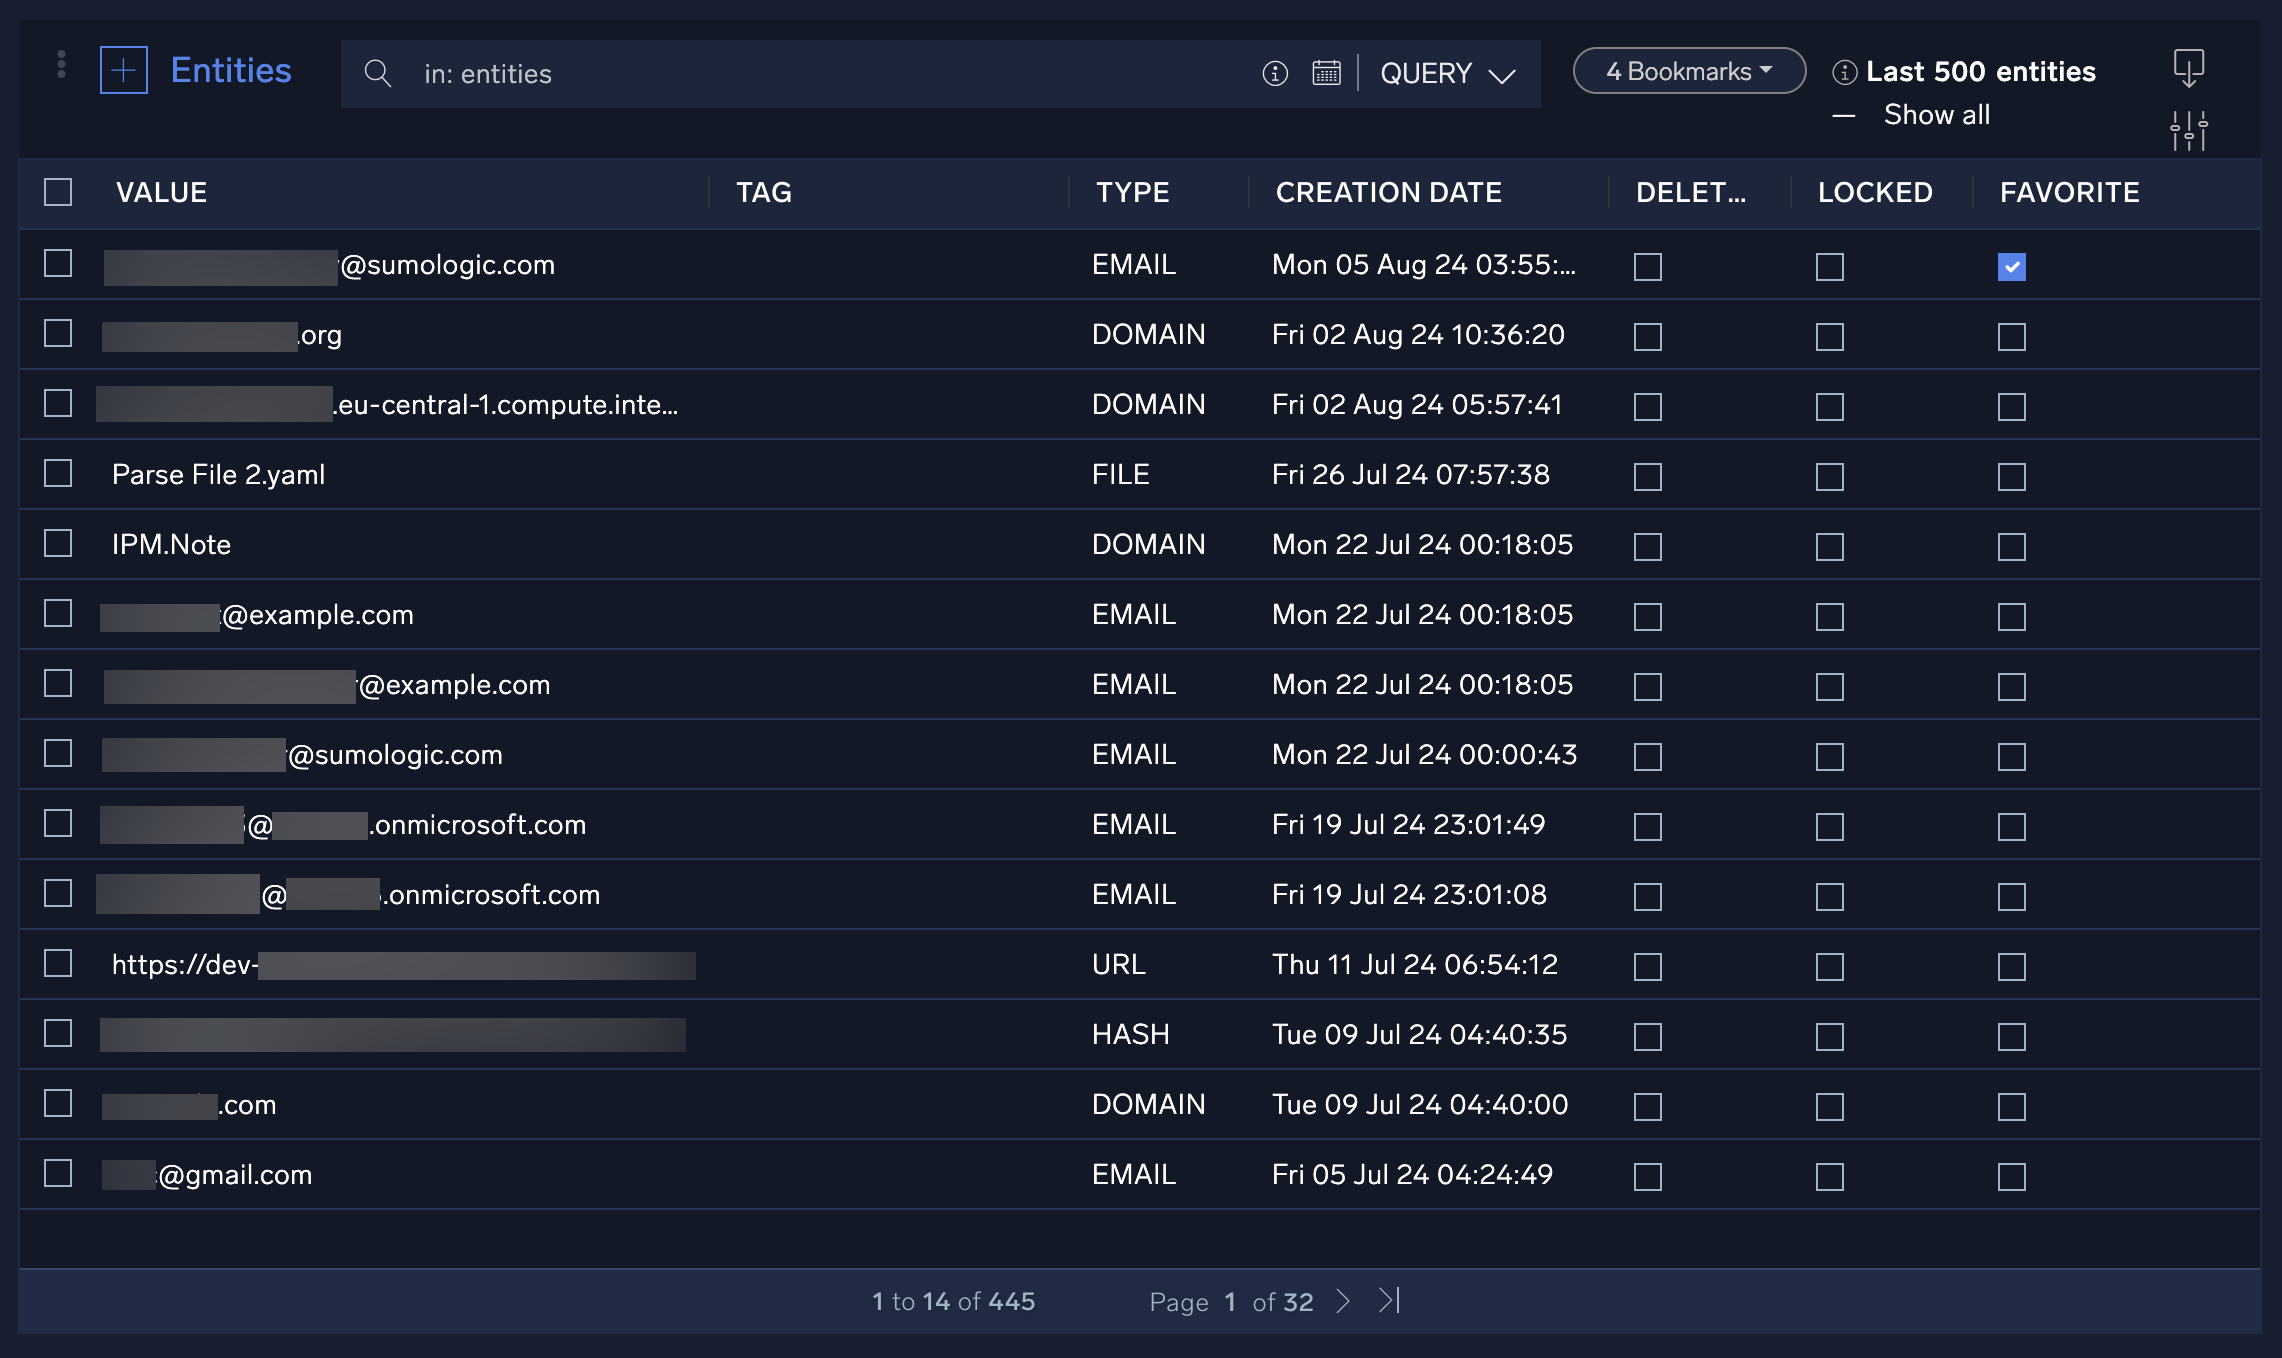
To explore entities:
- Click an entity in the list to display the results of any previous actions taken on the entity, or where in the incident the entity was extracted.
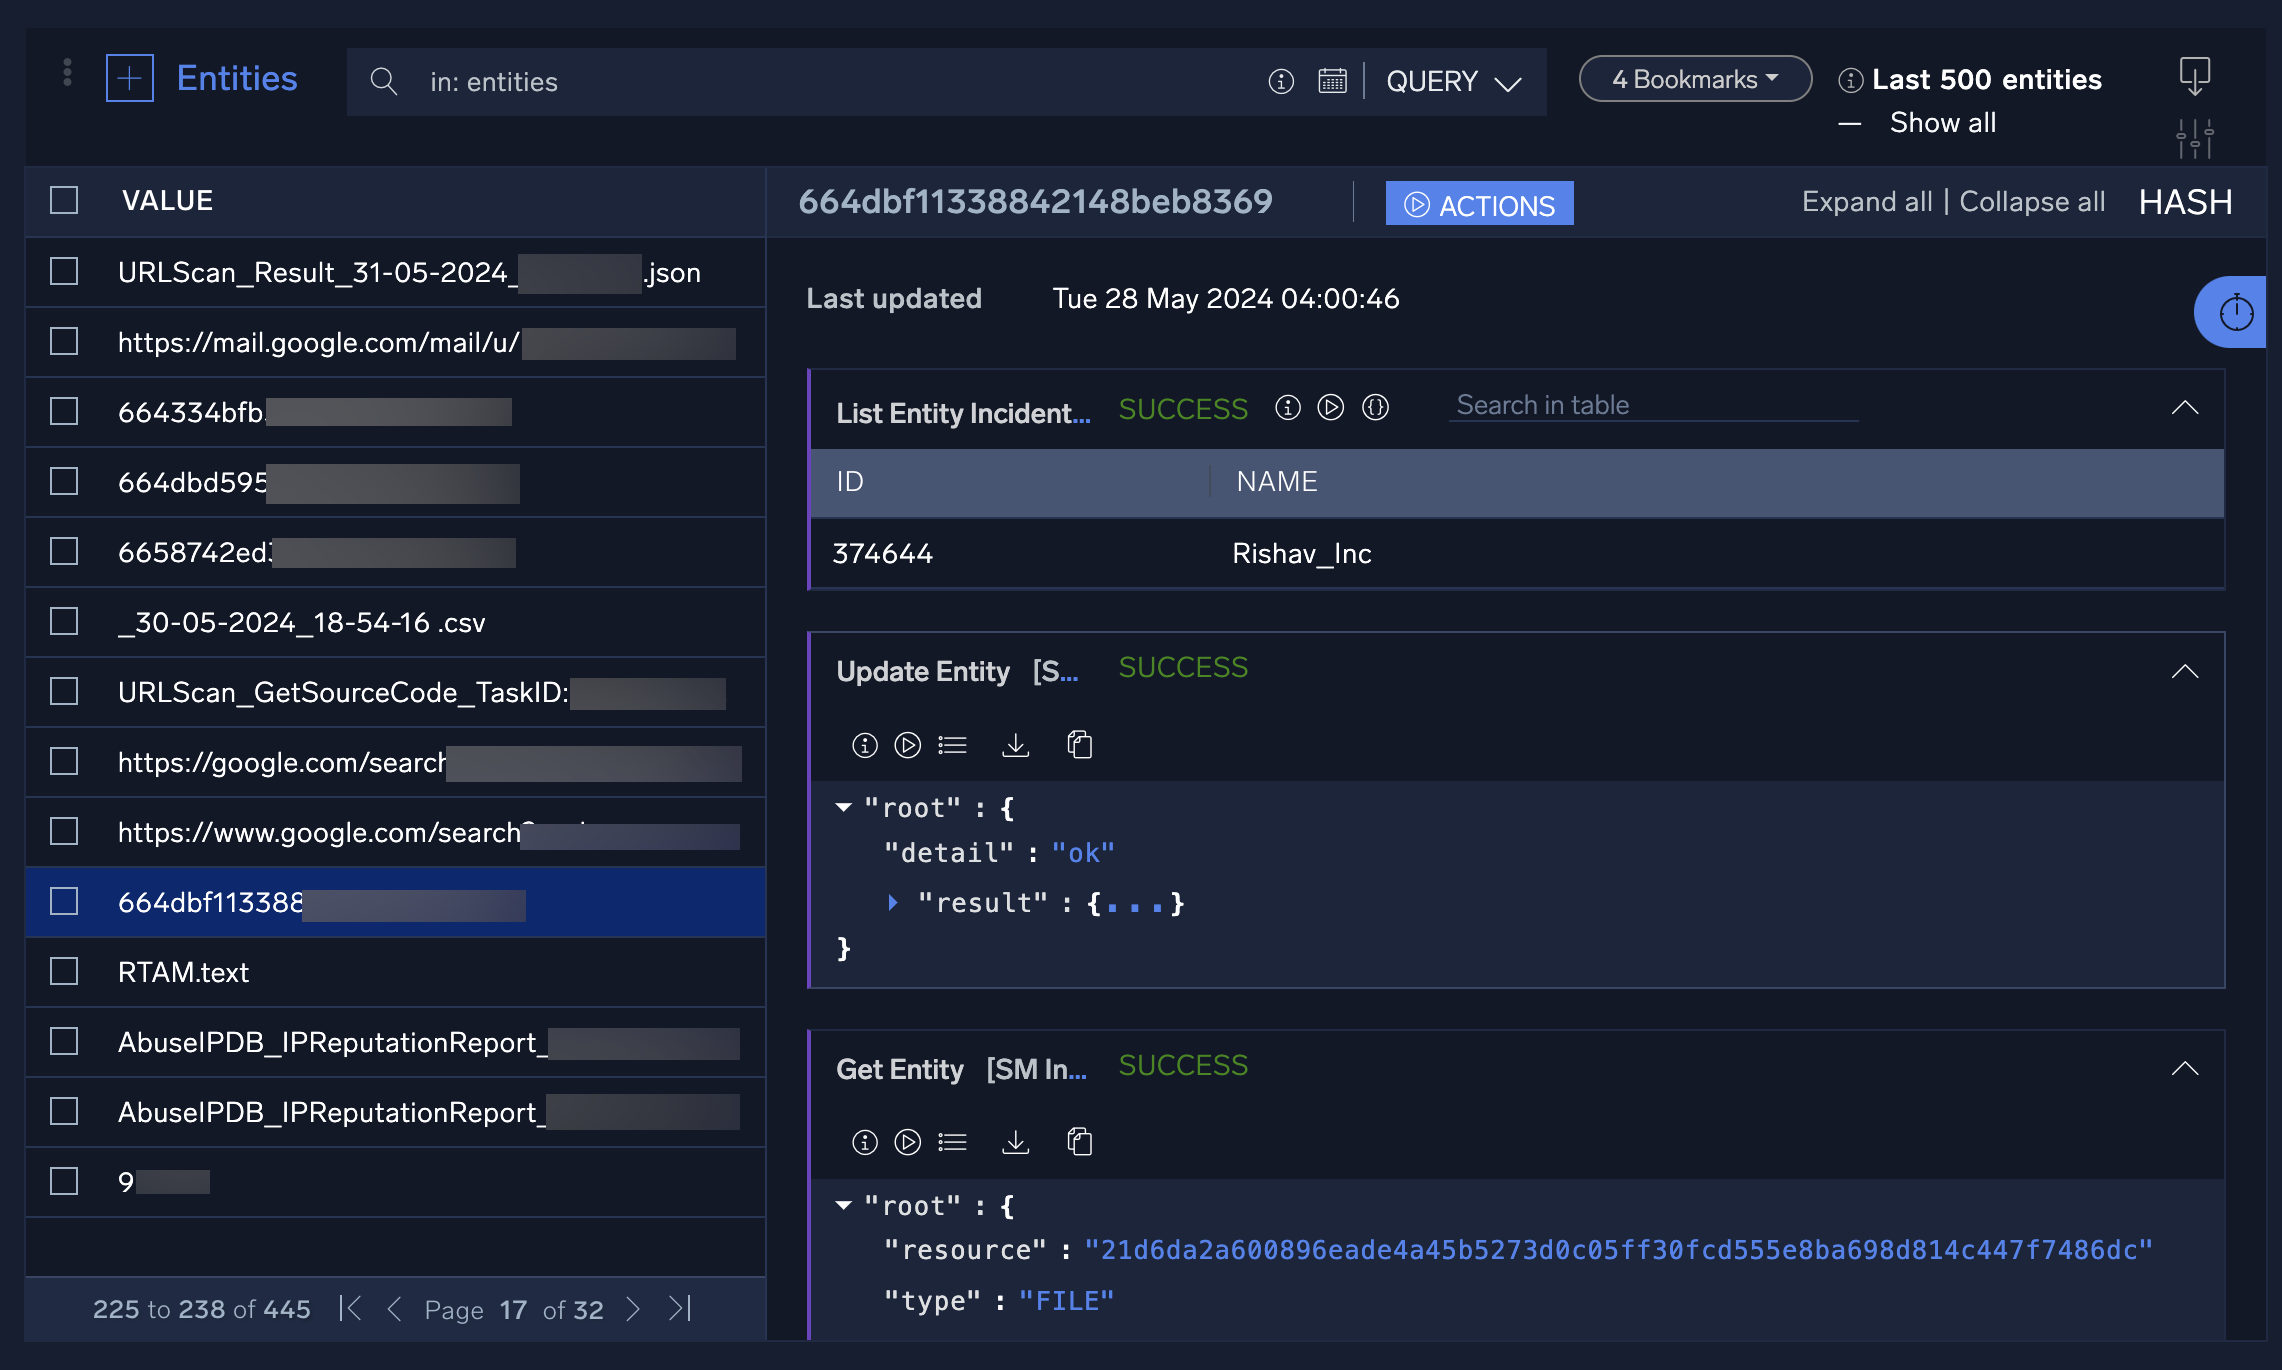
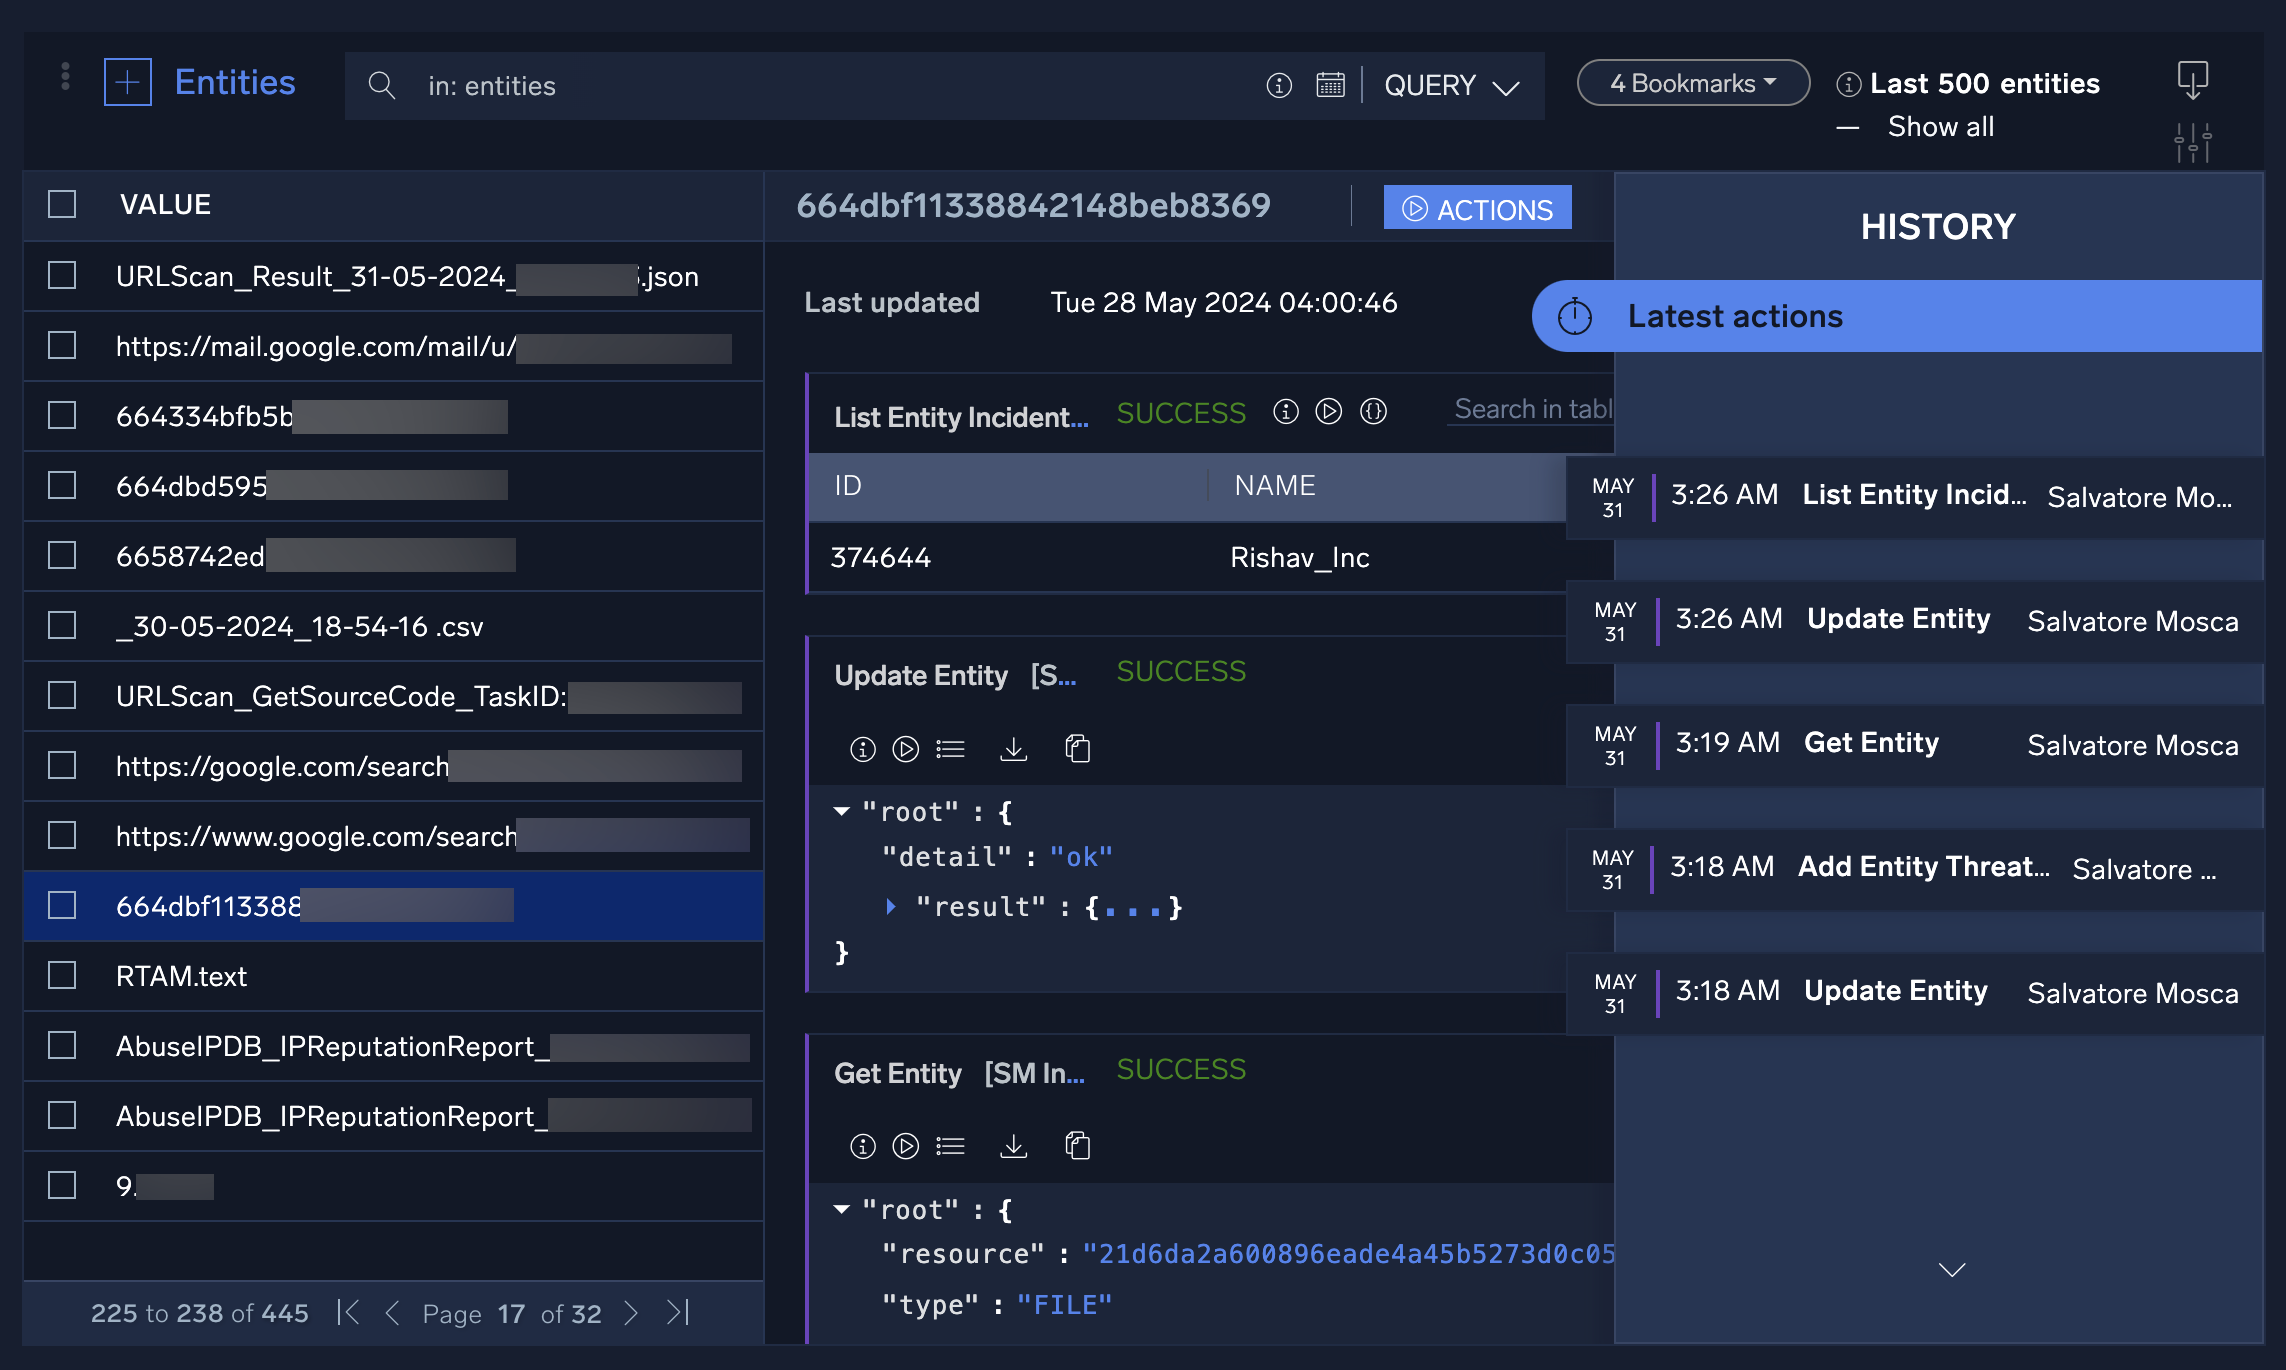
- Click the stopwatch icon to see the entity's history timeline. Click the date tabs to see additional information about the actions taken on each date.
- Hover your mouse over an entity to:
- Lock: Lock the entity to prevent any actions from being taken on it. This may be useful if you want to ensure that no enrichment actions are taken on attacker-controlled infrastructure or that an entity is not accidentally blocked.
- Delete: Delete the entity record.
- Favorite: Mark the entity as a favorite and move it to the top of the entity list.

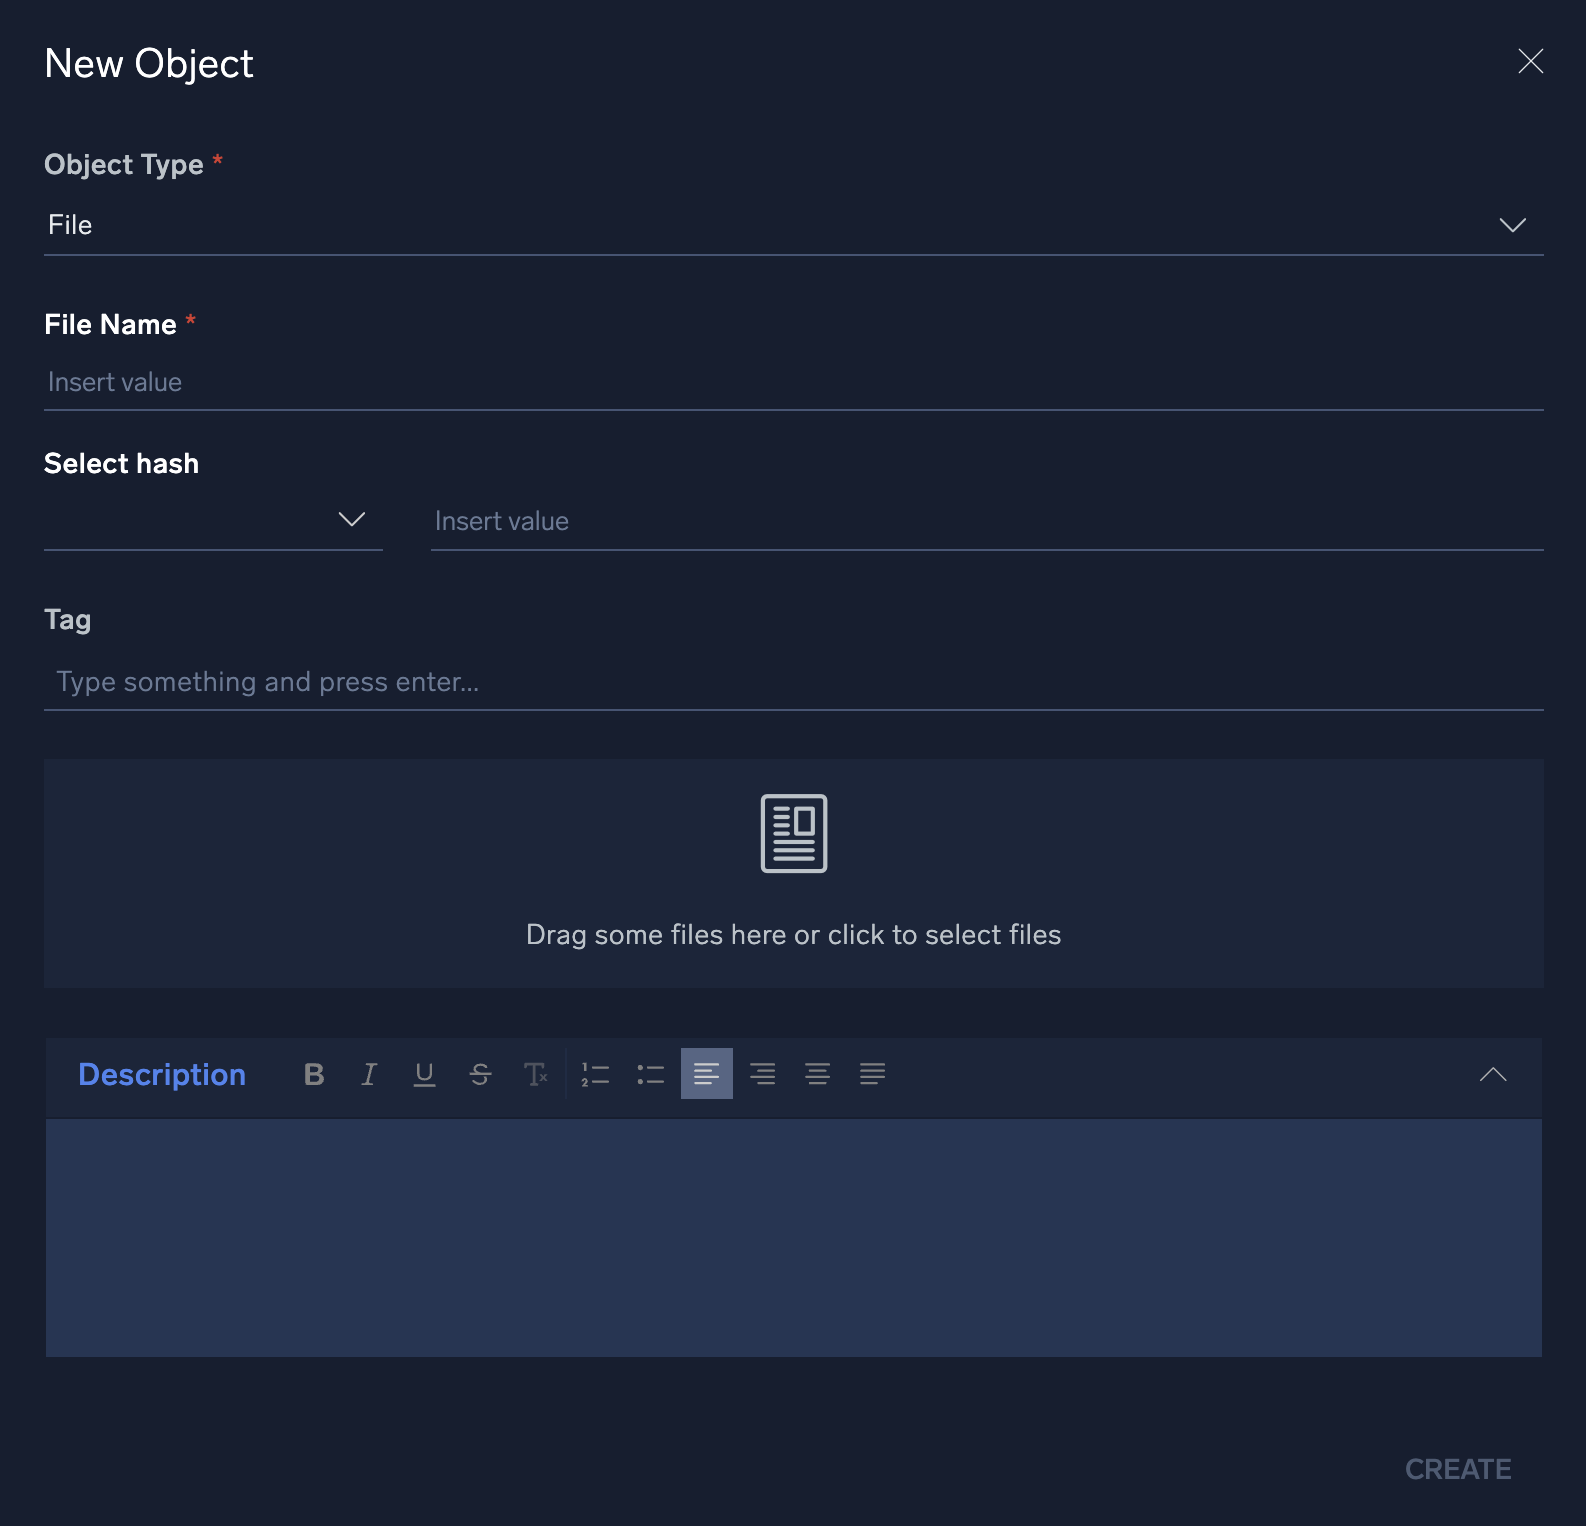
- To manually add an entity, click + at the top of the screen to the left of Entity.

- In the New Object dialog, select an entity type from the Object Type dropdown menu. Enter information about the entity and then click Create.
Dashboards
Cloud SOAR's Dashboards section highlights the most important pieces of data to the user or investigator who is logged into the platform. This data is presented through the use of multiple widgets that you can add, remove, and customize to include all data relevant to your job functions and duties.
Watch the following micro lesson to learn about dashboards.
Create a dashboard
You can create dashboards in Cloud SOAR similar to dashboards in the core Sumo Logic platform. You can also create widgets to use in the dashboards that display text, graphs, and charts containing details about incidents and other aspects of Cloud SOAR.
- New UI. In the main Sumo Logic menu, select Cloud SOAR > SecOps & Dashboard. You can also click the Go To... menu at the top of the screen and select SecOps & Dashboard.
Classic UI. Go to the home screen. - Select Dashboard in the upper-left corner of the UI.
- Click the + icon in the upper-right corner of the UI and select New Dashboard.
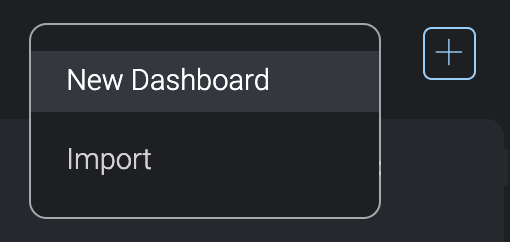
A blank dashboard screen appears.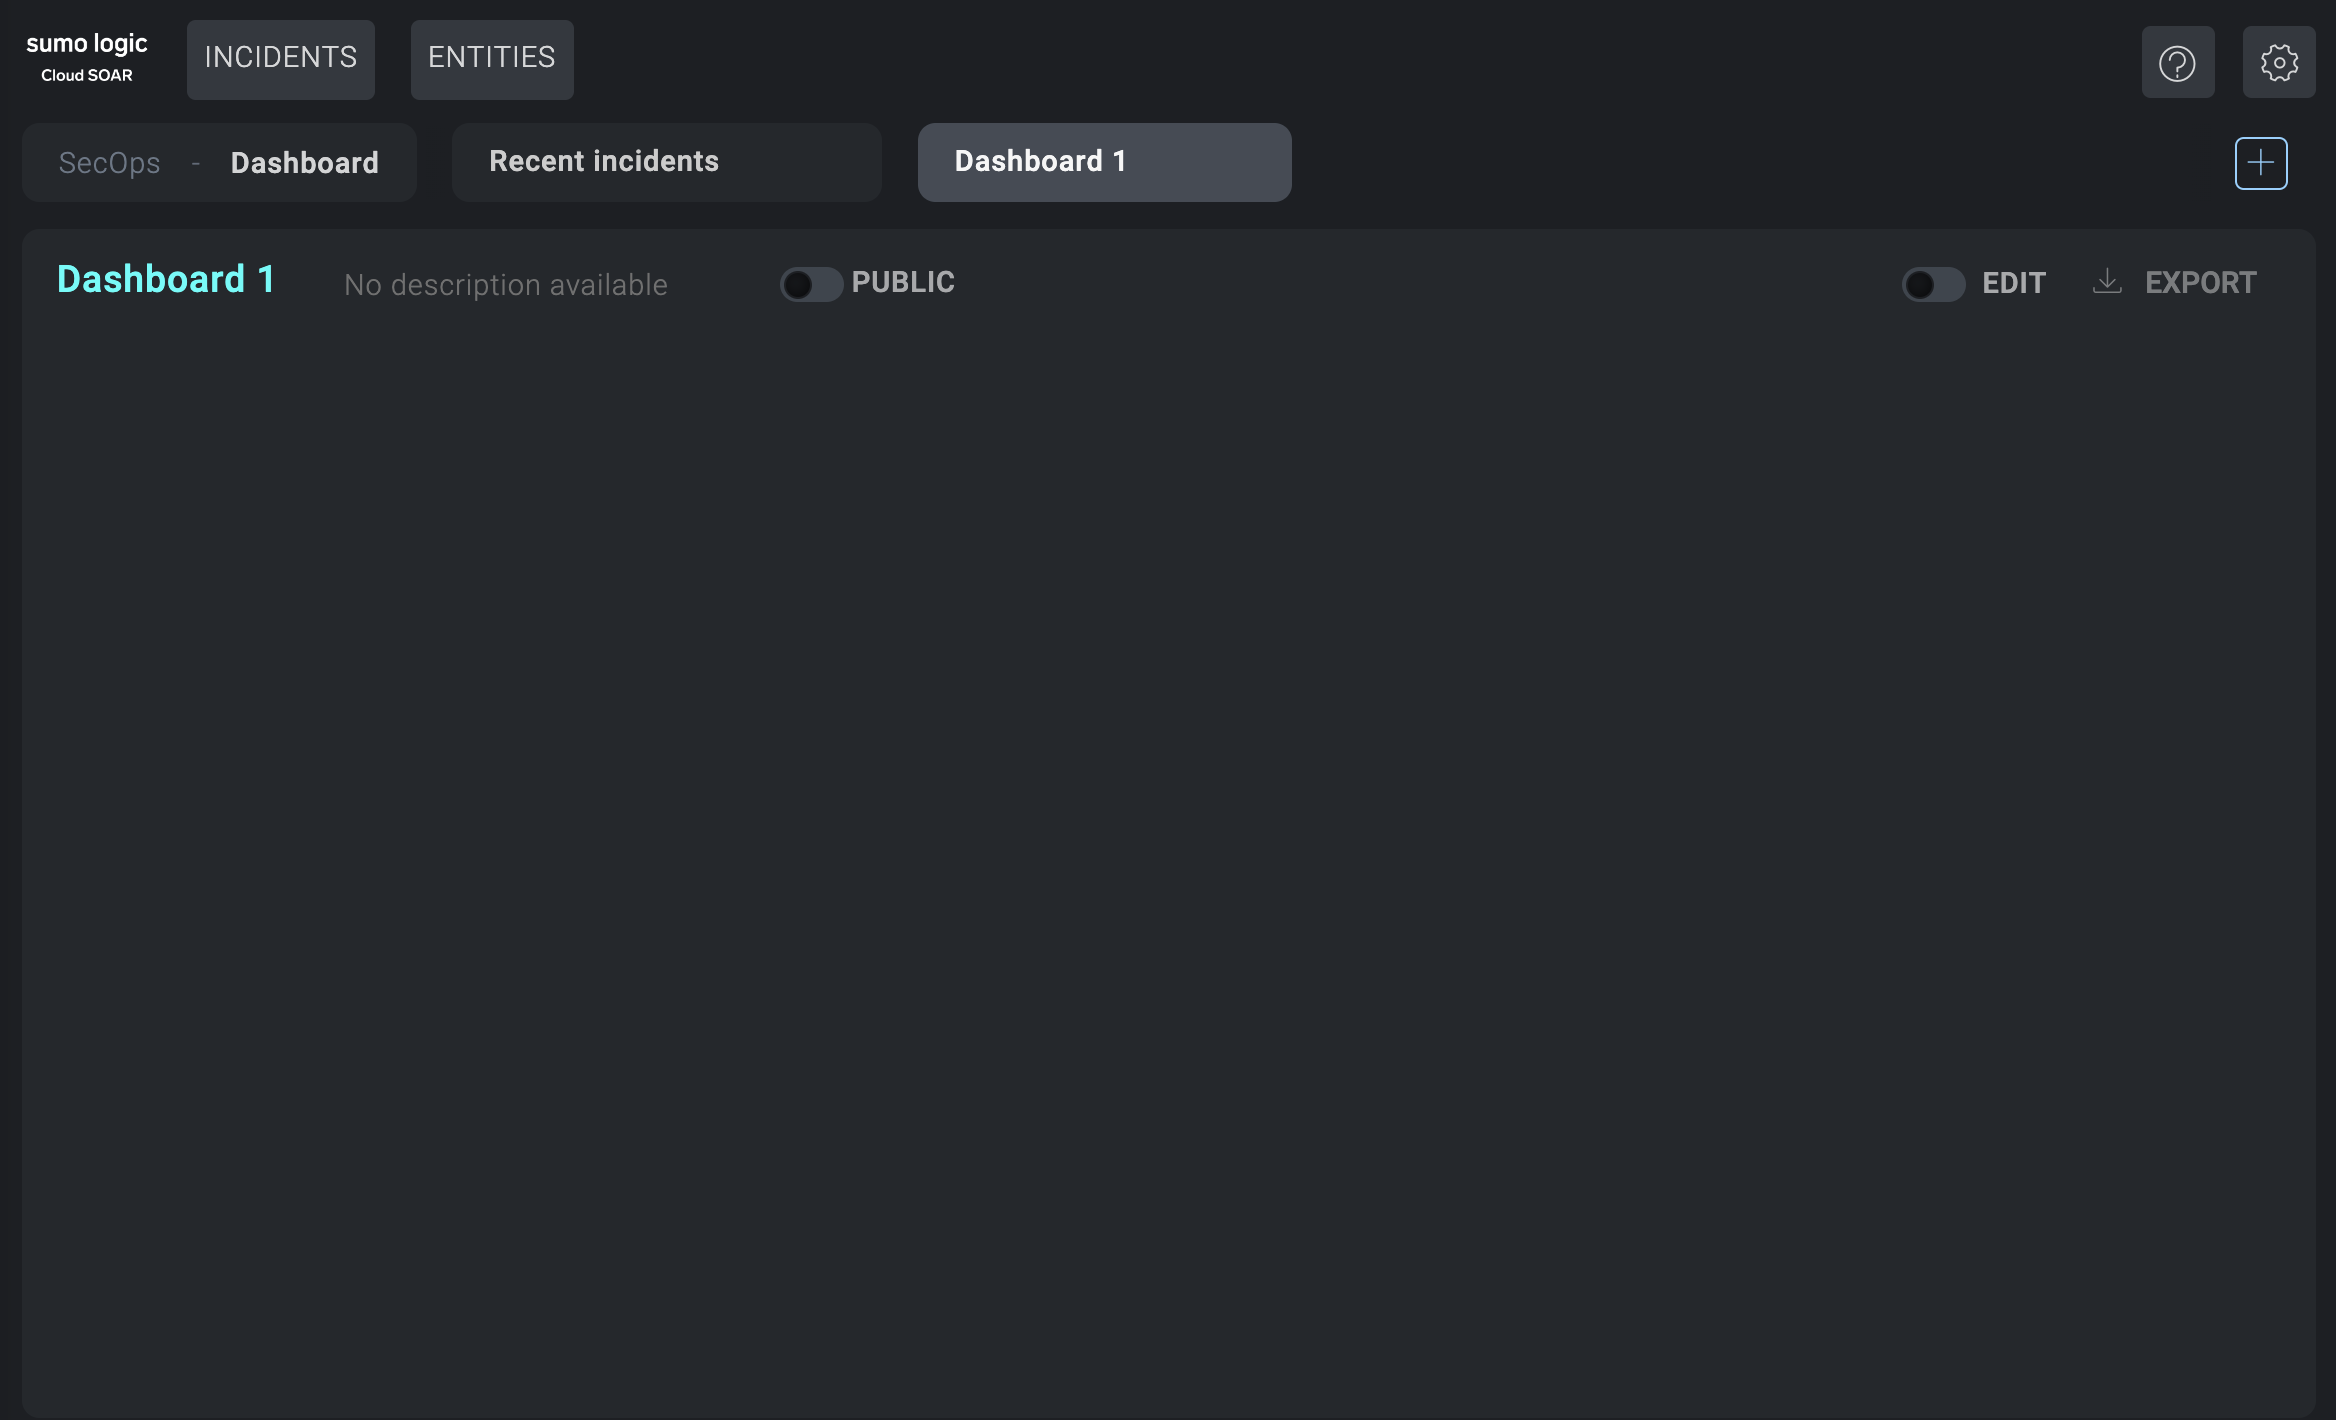
- Click on the name of the blank dashboard (such as Dashboard 2 in the example), and give the dashboard a name. Click No description available and type a description.
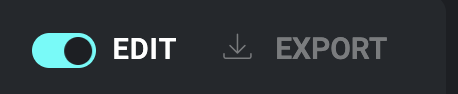
- Click the Edit button.
The widgets panel displays to the right of the dashboard.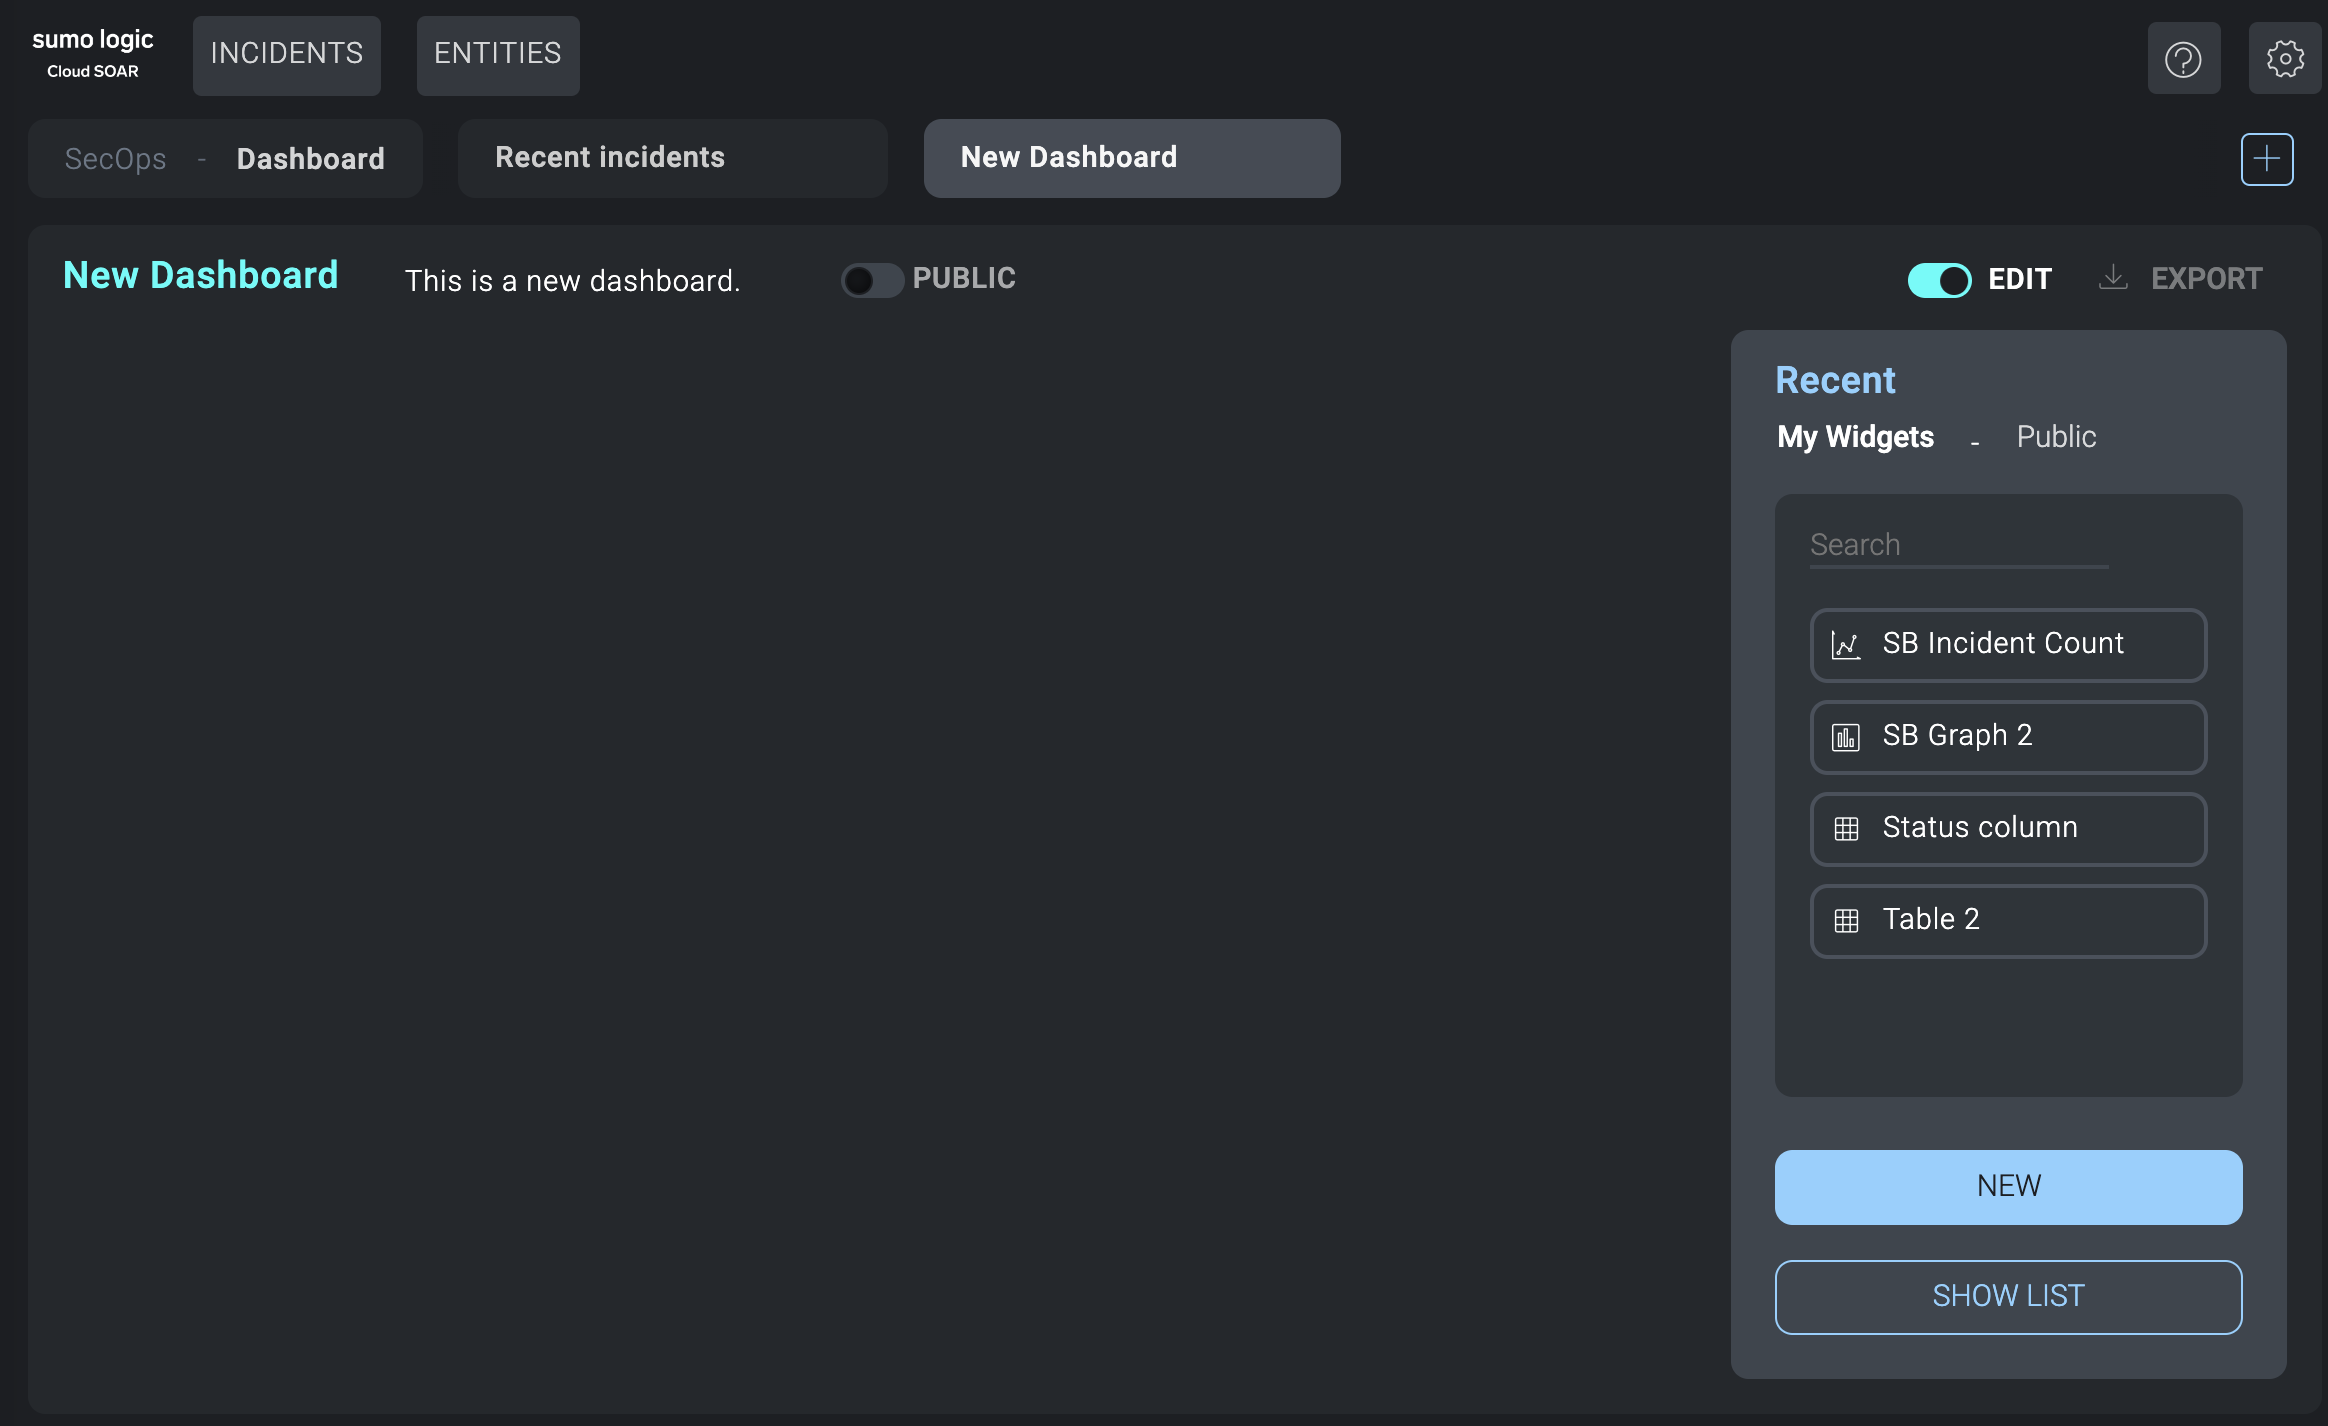
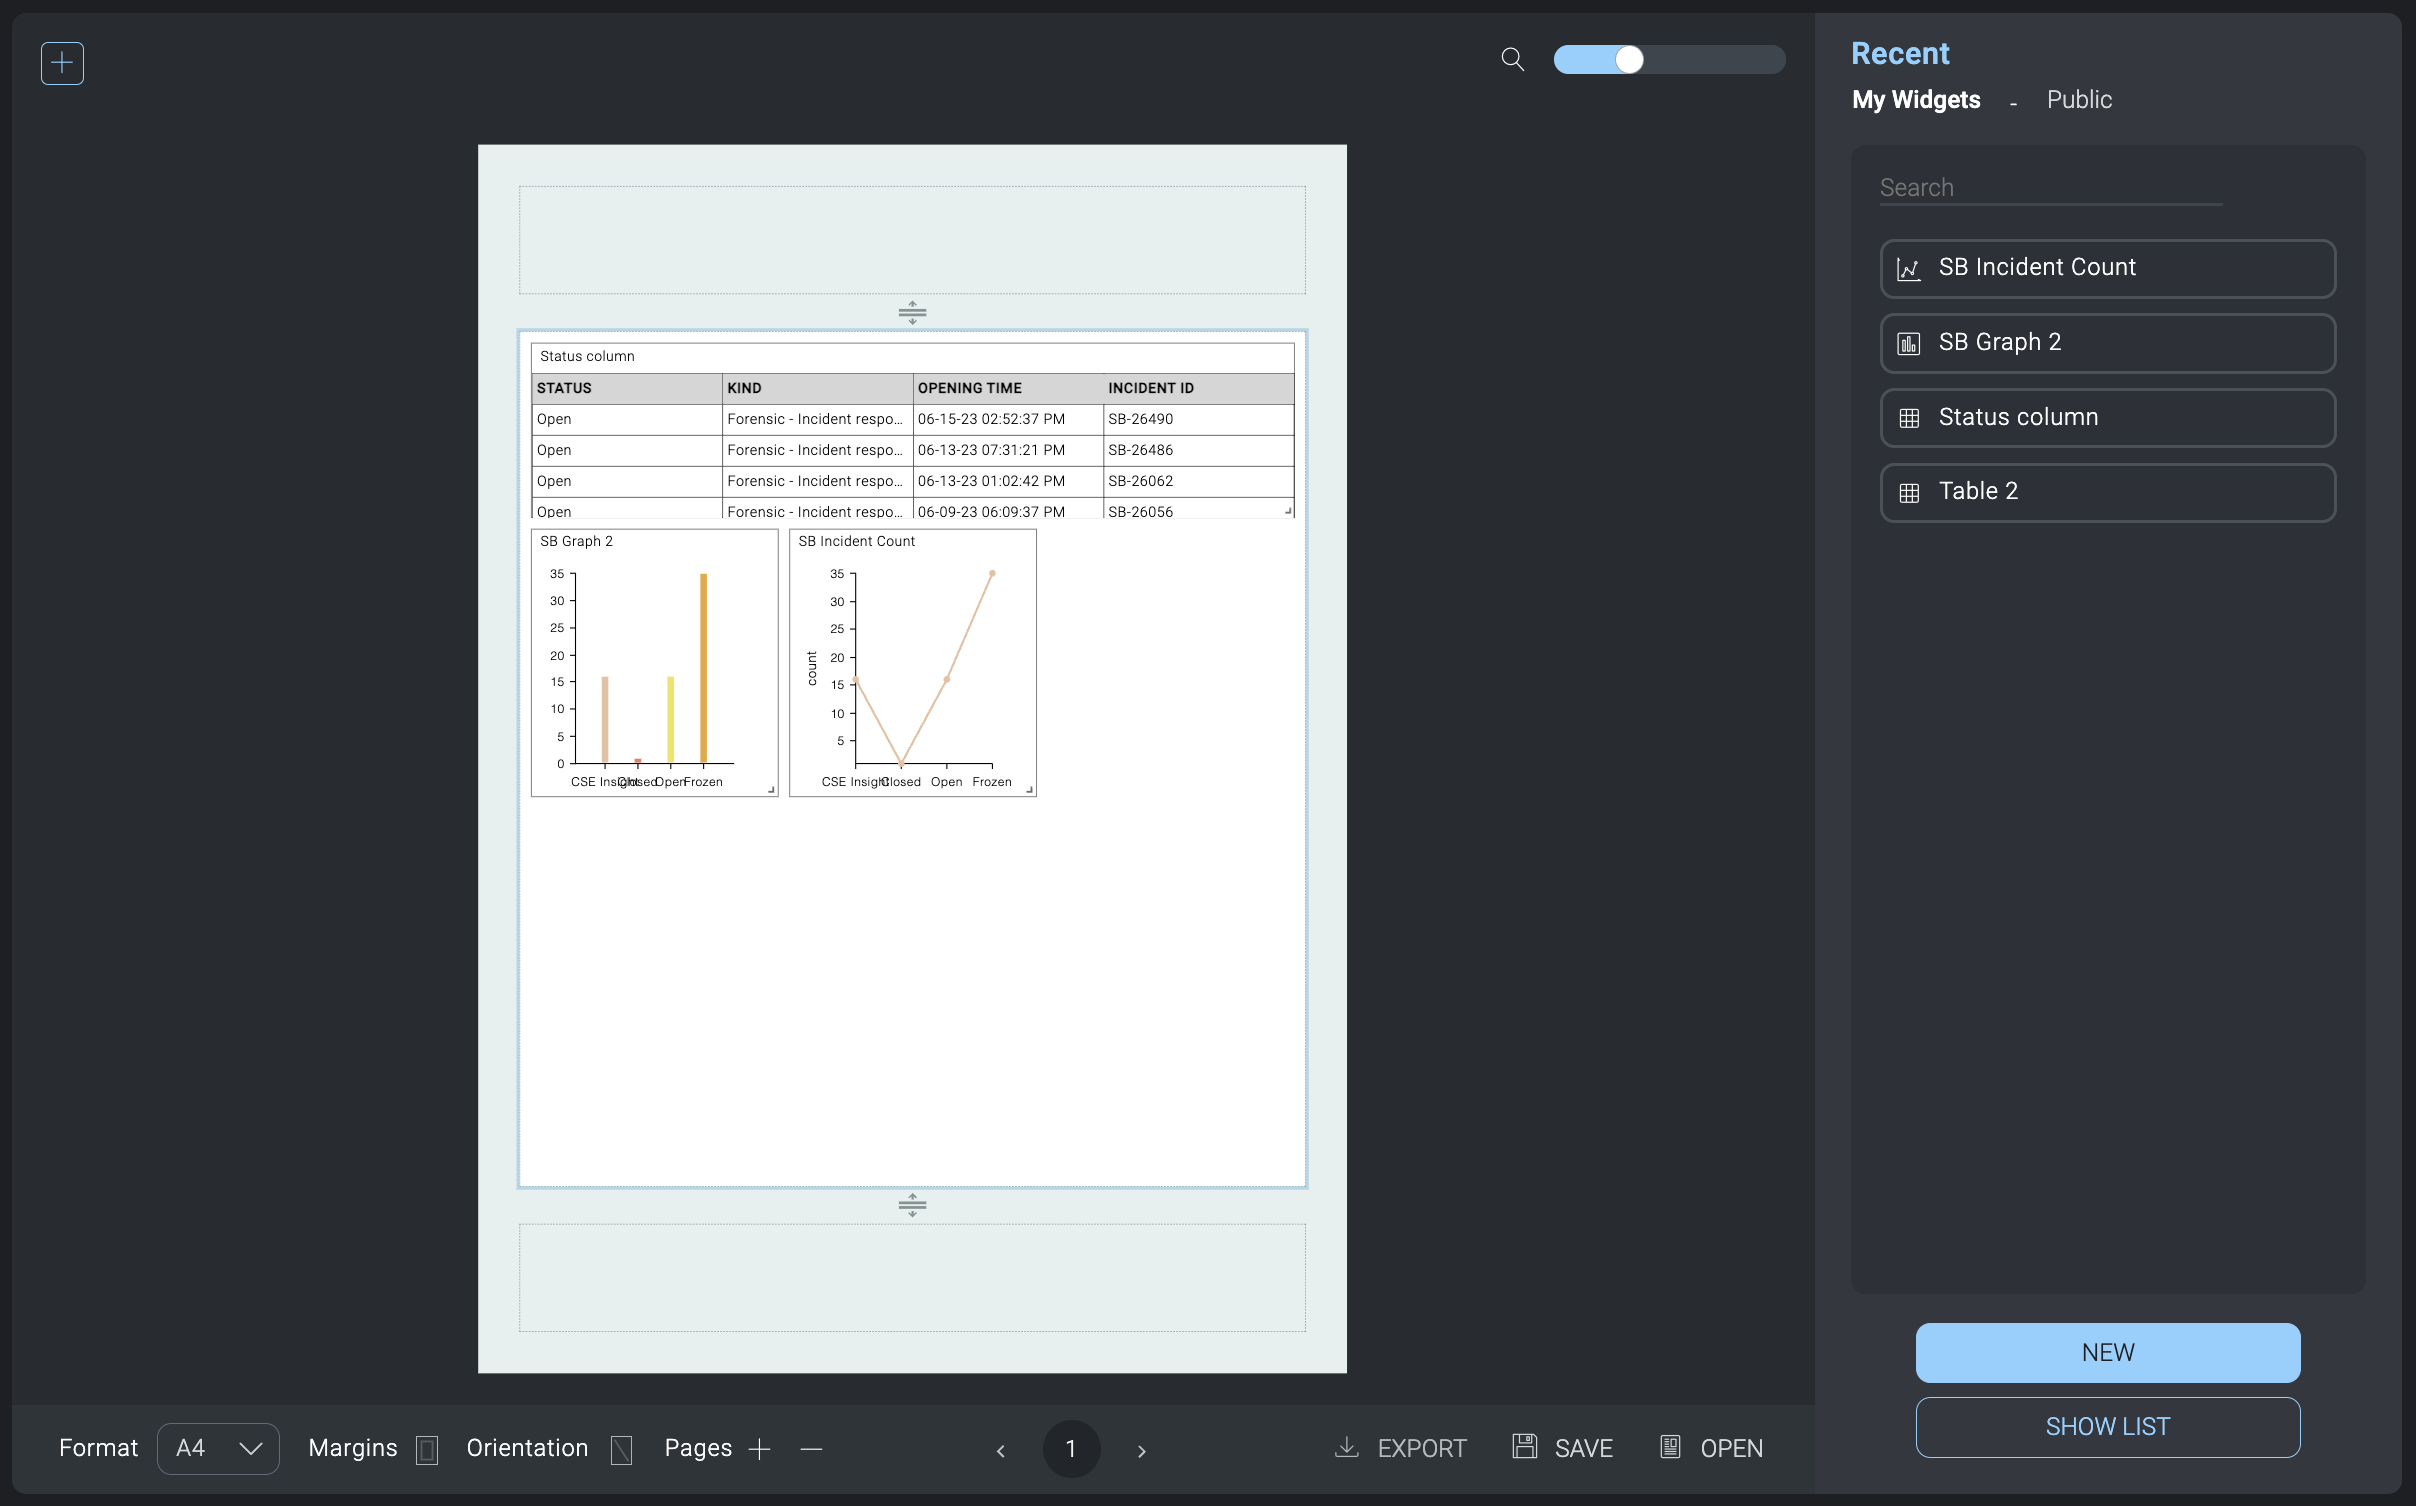
- Under My Widgets or Public, select widgets you'd like to add to the dashboard. These are the same widgets that are available to use in reports. Widgets can be graphs, charts, tables, or any kind of visual element that contains information. Click New to create a new widget. Click Show List to see all available widgets.
- Rearrange the widgets in the dashboard as desired.
- (Optional) Click Public at the top of the dashboard panel if you want to make the dashboard available for others to use.
- (Optional) Click Export to to the upper-right of the dashboard panel to export the dashboard to PDF.
Create widgets
You can create widgets as needed to help analysts and administrators quickly get the information they need. Widgets are reusable pieces that display information in different forms, such as text, pie chart, bar chart, graph, or table.
- Open the widgets panel:
- New UI. In the main Sumo Logic menu, select Cloud SOAR > SecOps & Dashboard. You can also click the Go To... menu at the top of the screen and select SecOps & Dashboard.
Classic UI. Go to the home screen. - Select Dashboard in the upper-left corner of the UI.
- Select a dashboard.
- Click the Edit button.
noteWidgets are shared between Dashboards and Reports.
- New UI. In the main Sumo Logic menu, select Cloud SOAR > SecOps & Dashboard. You can also click the Go To... menu at the top of the screen and select SecOps & Dashboard.
- The widgets panel displays to the right of the screen.
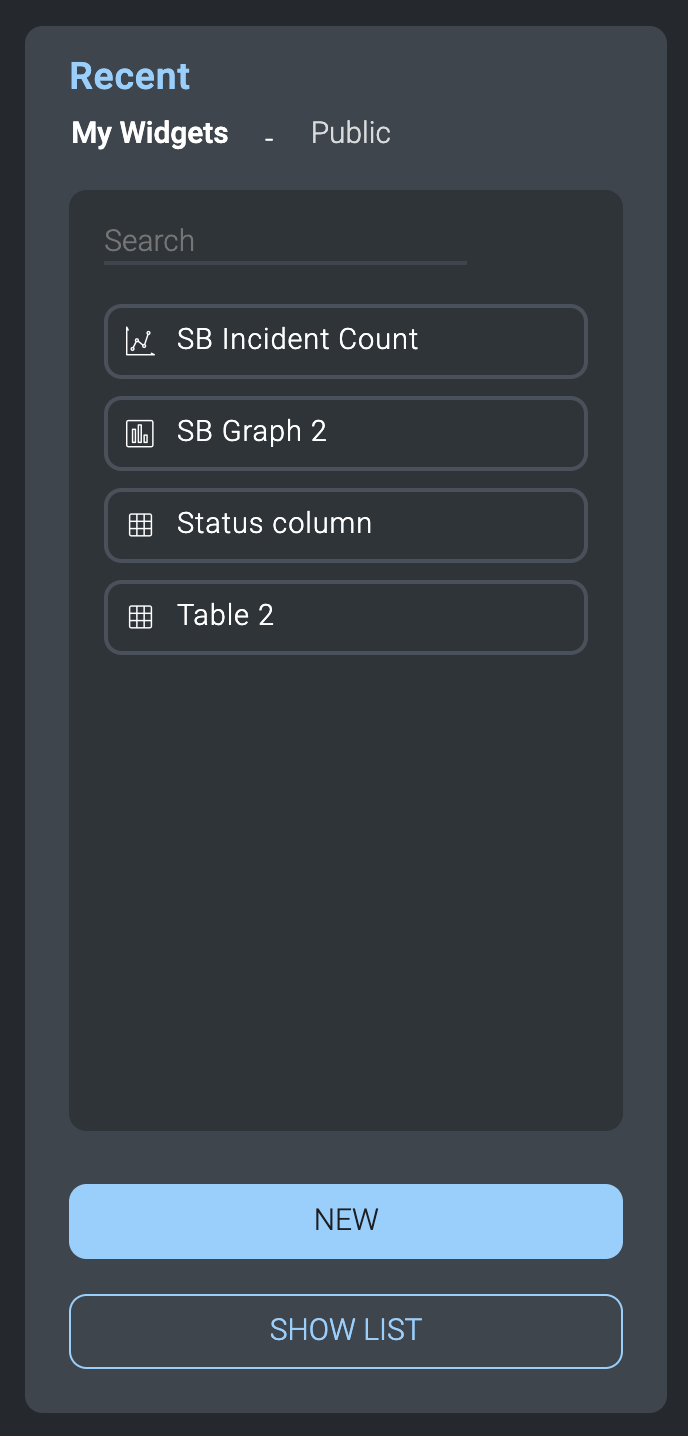
- Click New.
The dialog to create new widgets displays.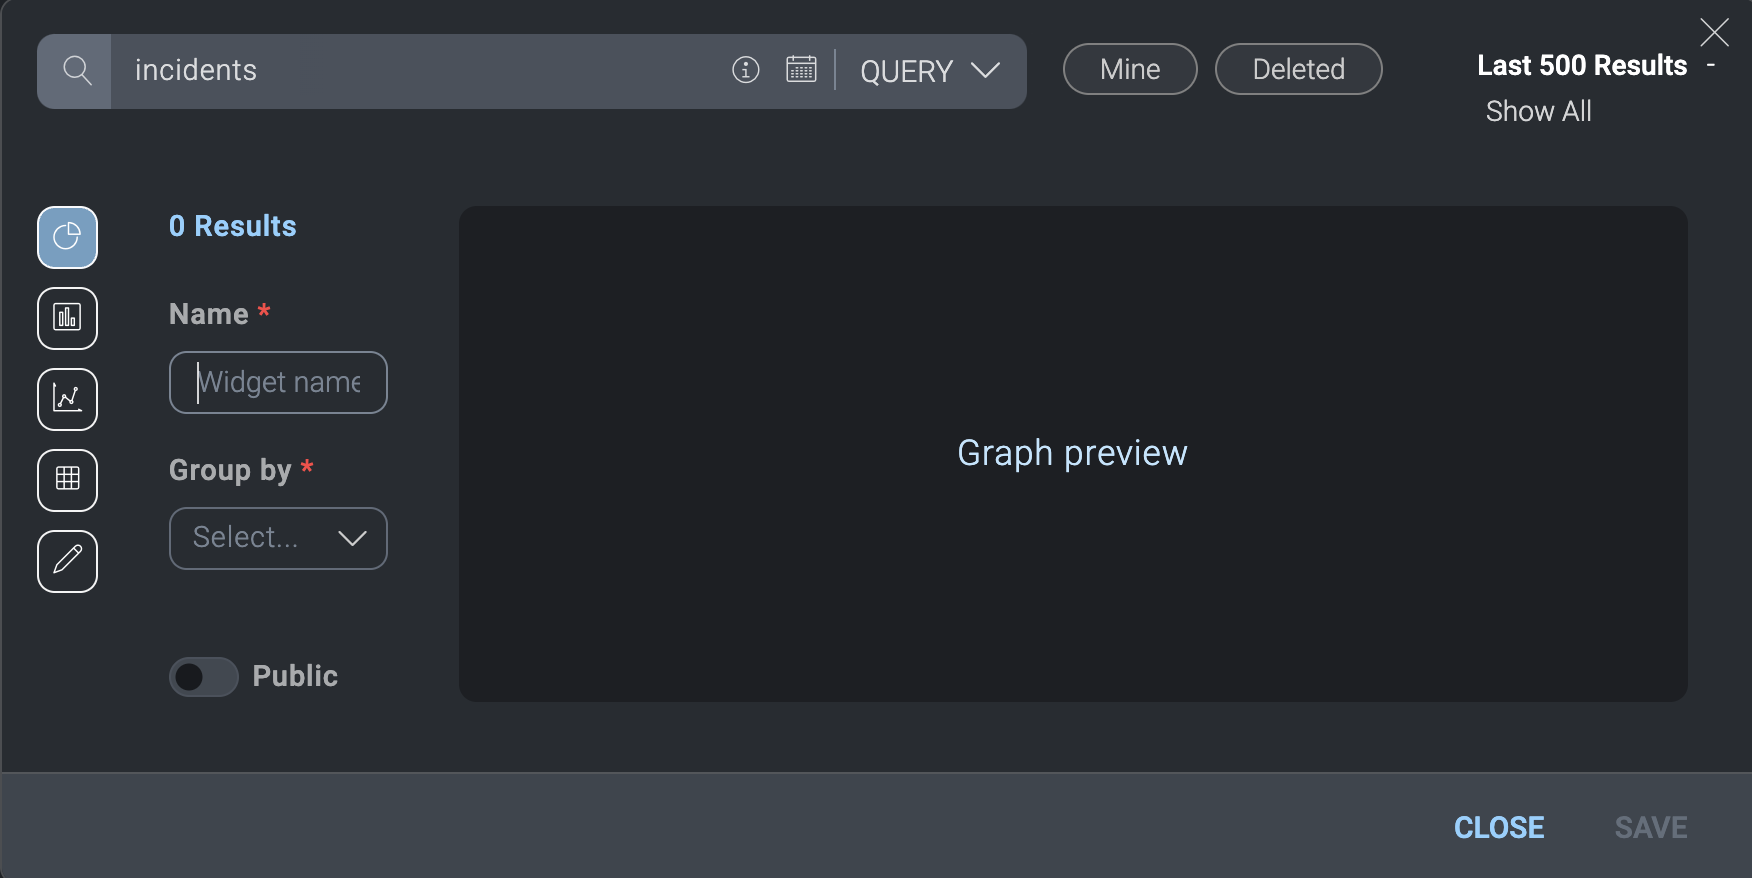
- In Name, provide a name that clearly explains the widget's purpose.
- In Group by, select whether you want incidents listed in the widget to be grouped by Status, Incident ID, or Start time.
- On the left, select the type of widget to create (pie chart, bar chart, graph, table, or text).
- At the top, query for incident data to view in the widget.
tip
Experiment with creating incident queries to learn how to get exactly the results you want in widgets. See Query incidents.
- Click Public if you want to make the widget available for others to use.
- Click Save when done.
Example widgets
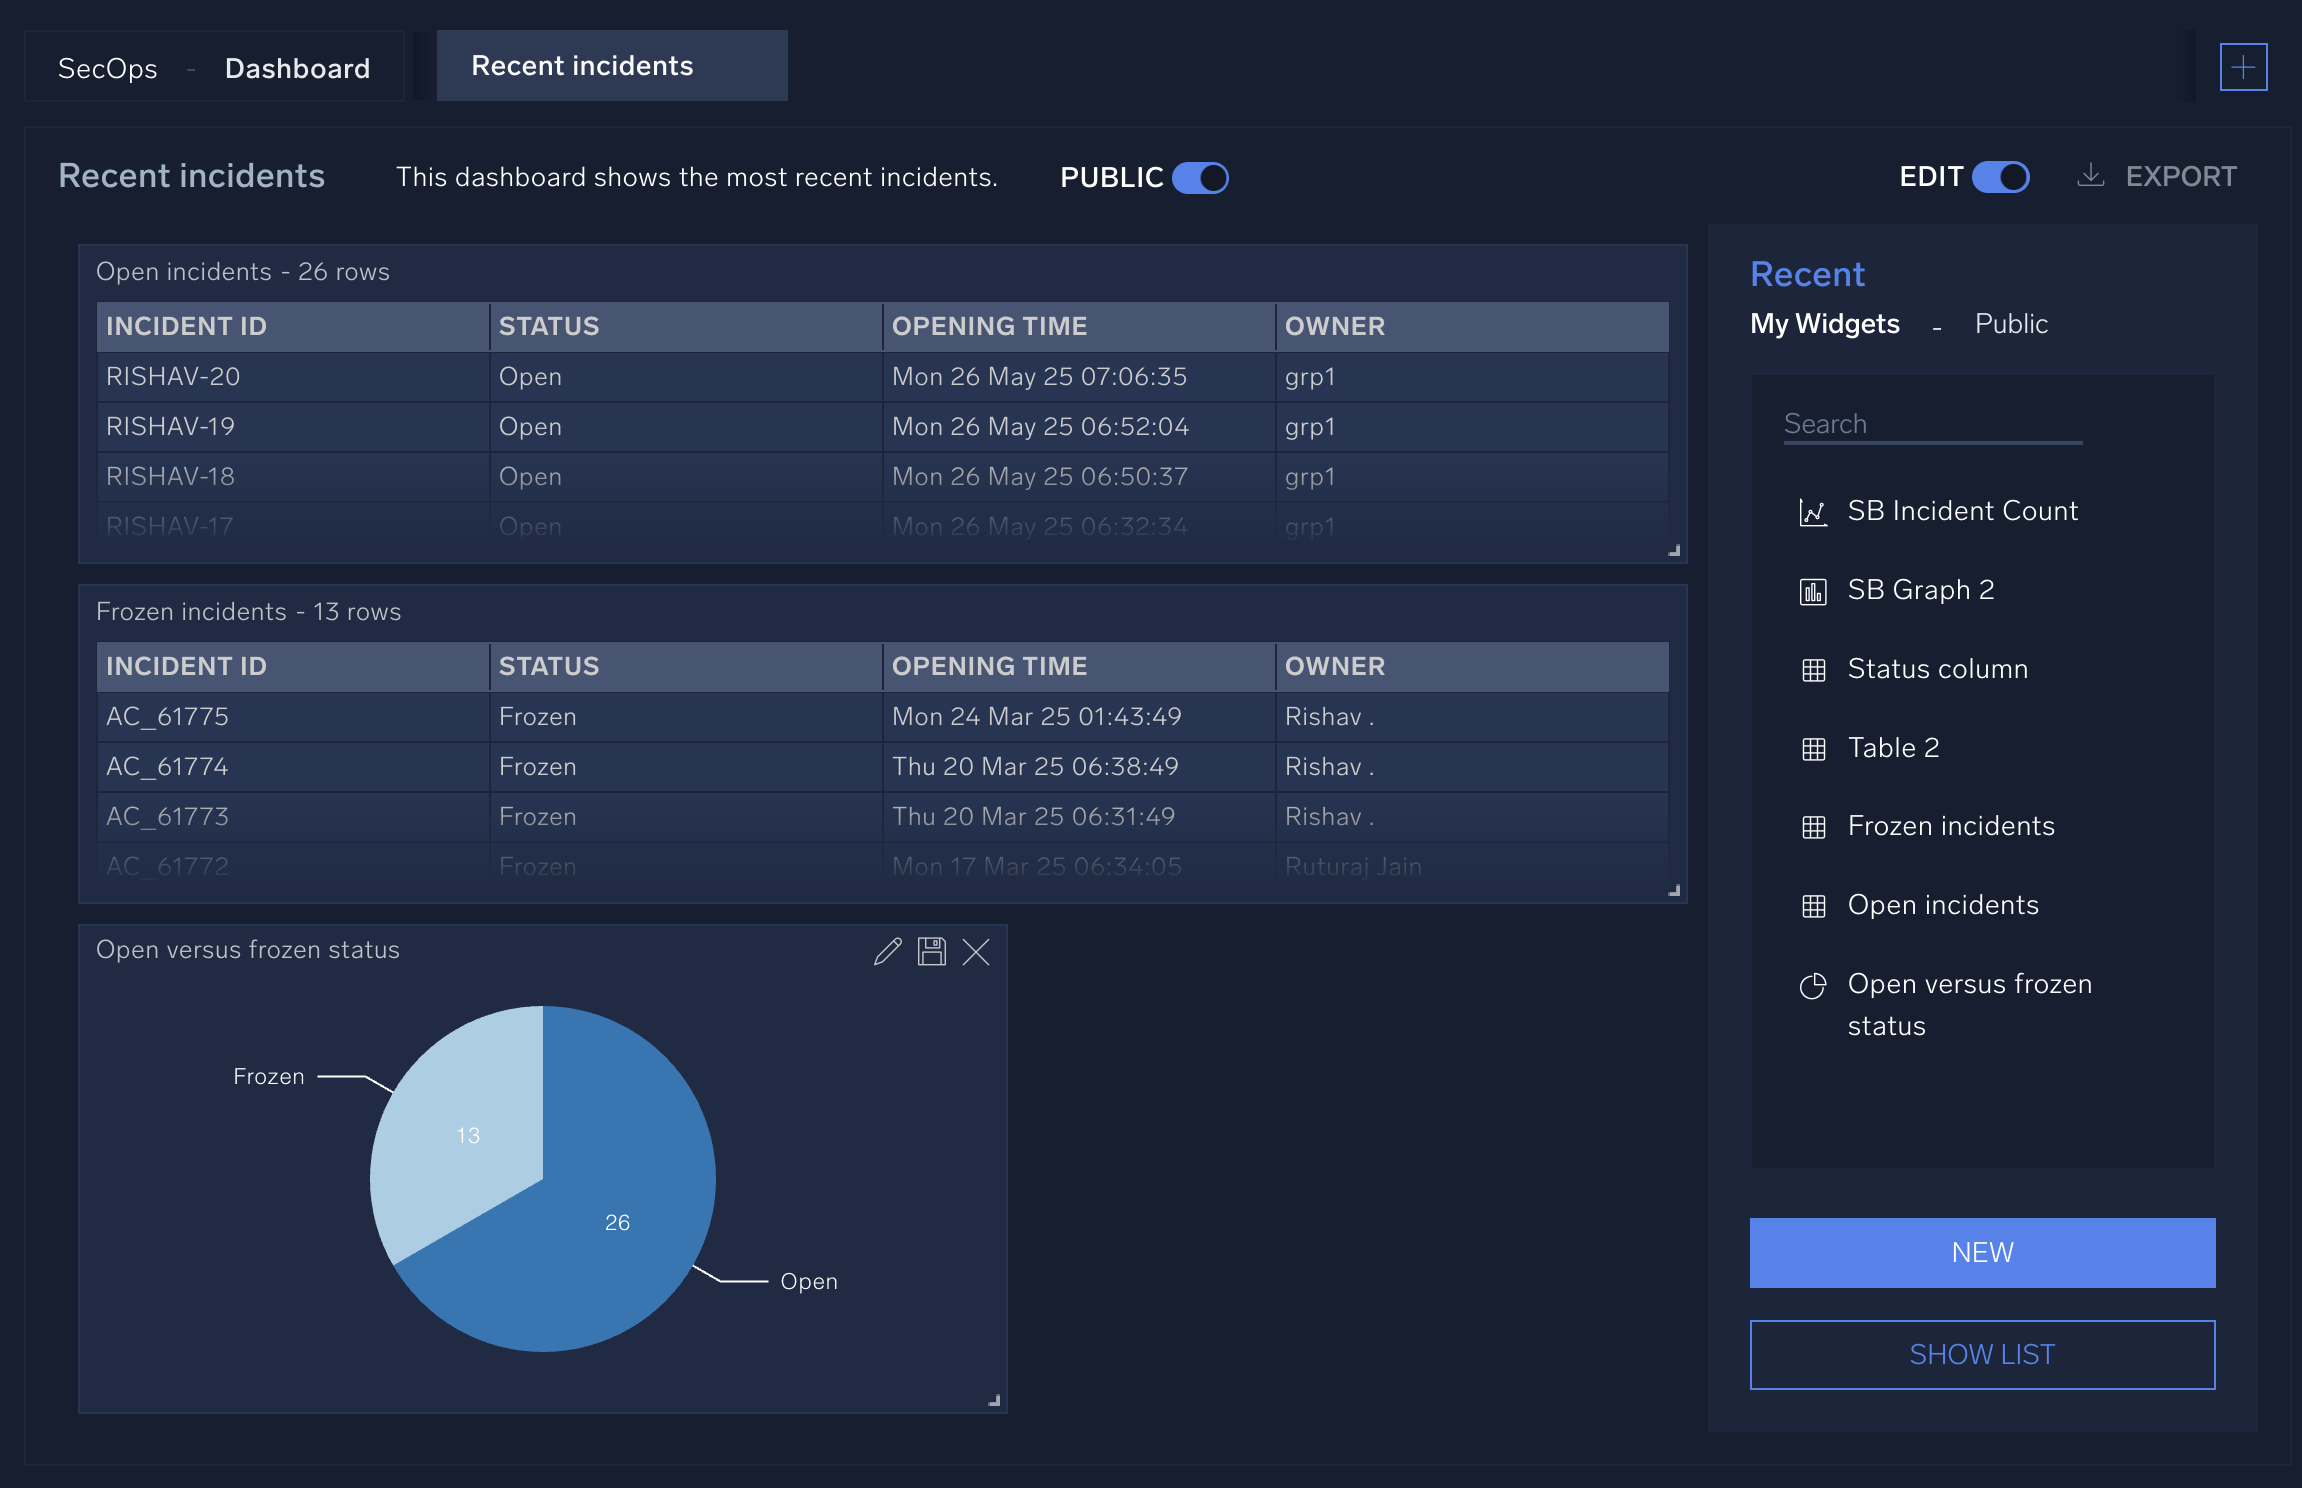
Let's suppose we want to create a dashboard that shows the current open and frozen incidents. To do that, we need to create a widget for each type of incident, then add those widgets to the dashboard.
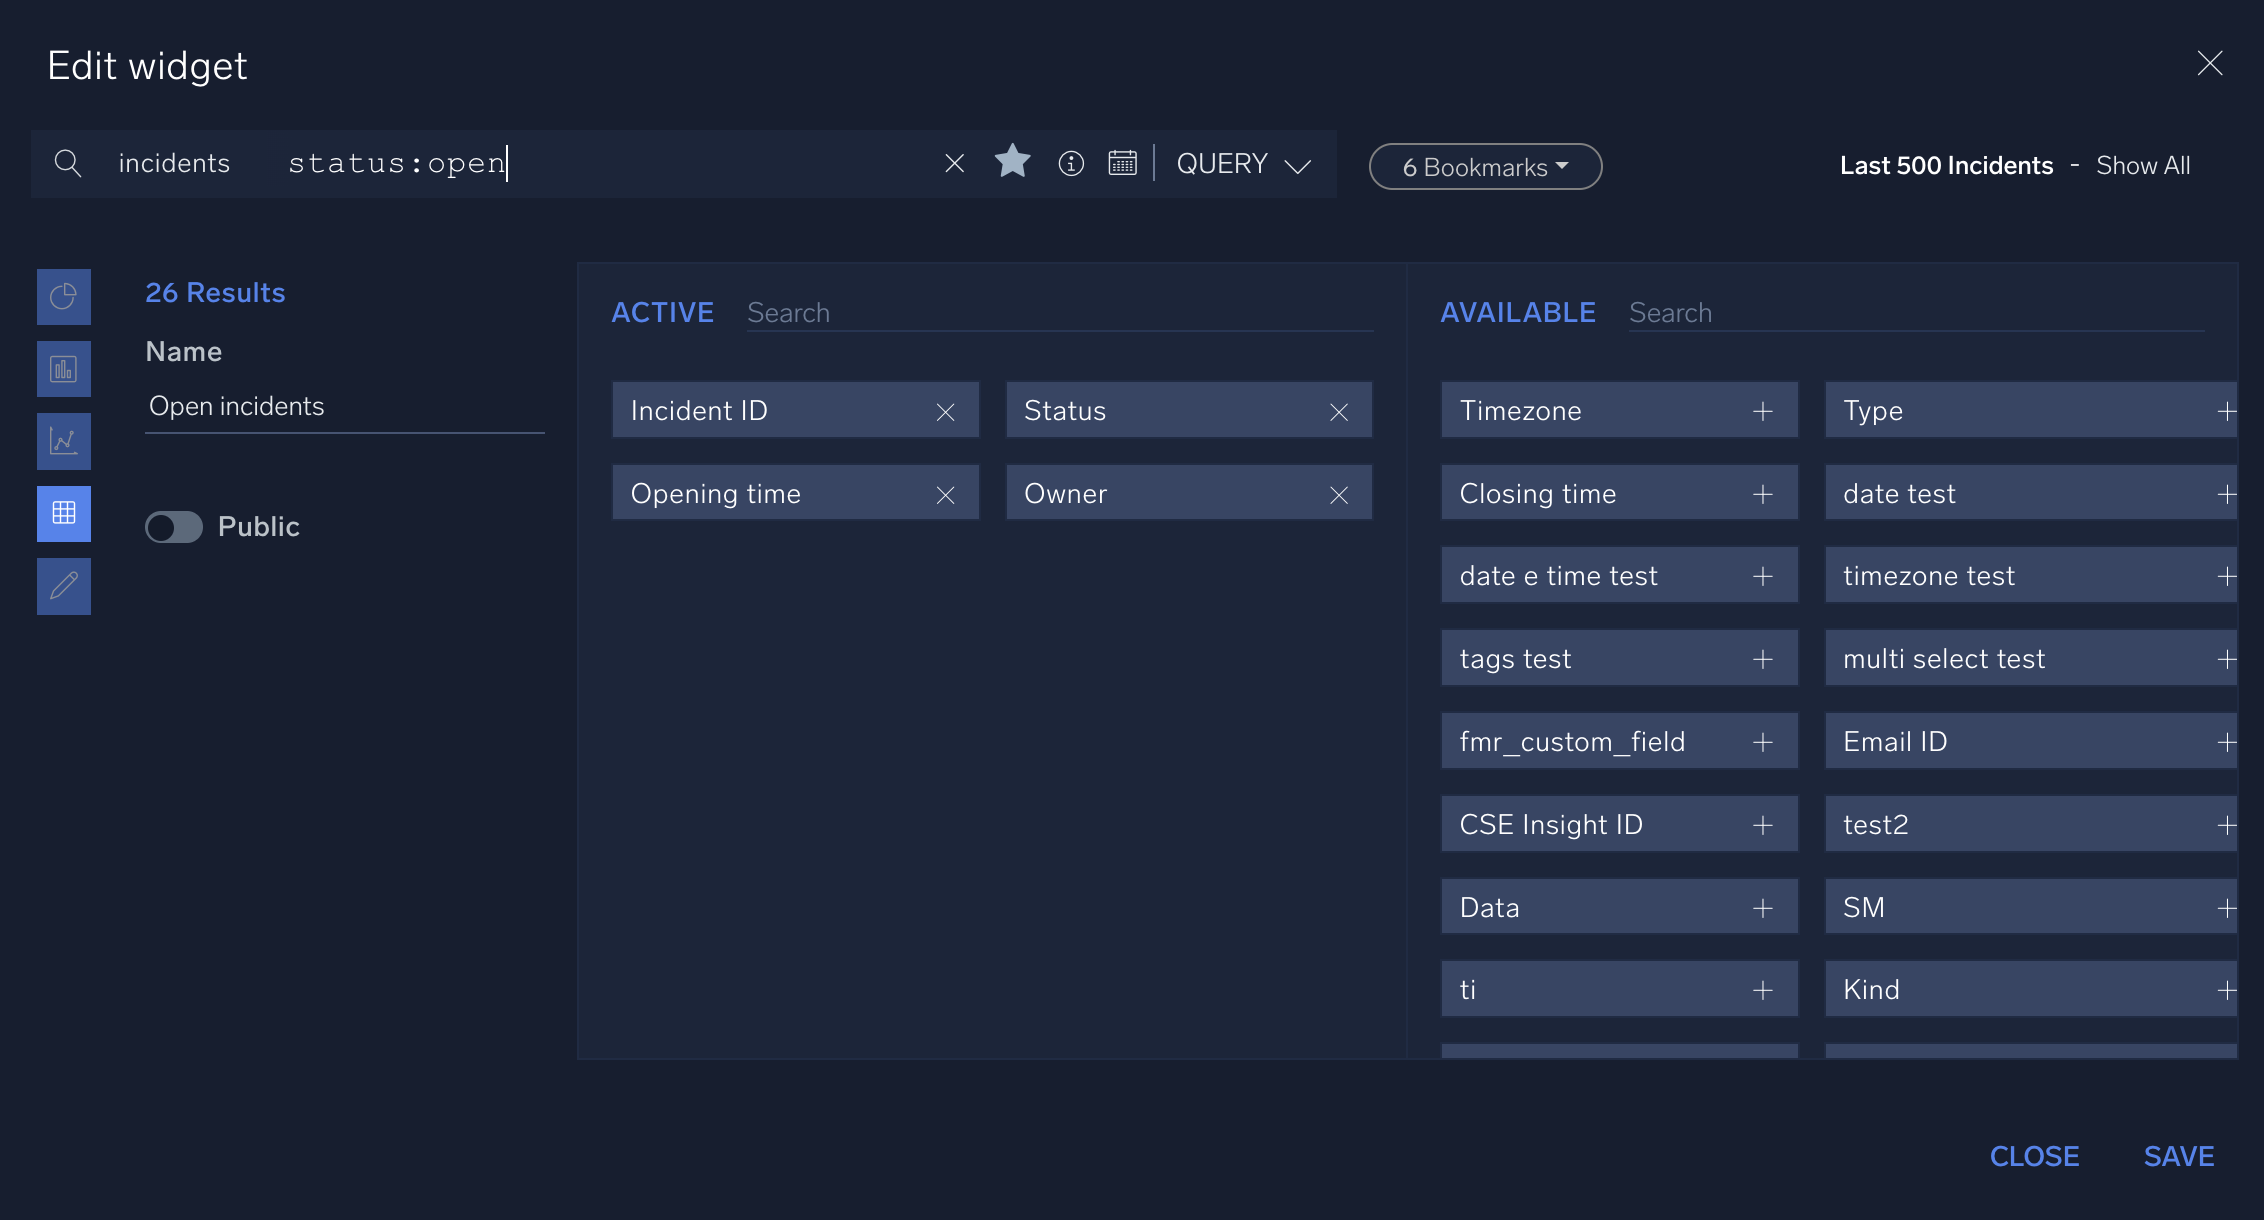
- Create a widget to list open incidents in a table:
- In the query bar at the top of the widget creation screen, enter
status:opento query for all open incidents. (For information about creating incident queries, see Query incidents.) - From Available, select the columns to display in the widget: Incident ID, Opening time, Status, Owner.
- In the left-hand side, select the table icon to display the data as a table.
- Click Save.
- In the query bar at the top of the widget creation screen, enter
- Create a widget to list frozen incidents in a table. Make the widget just like you did for the open incidents, but in the query bar at the top of the widget creation screen enter
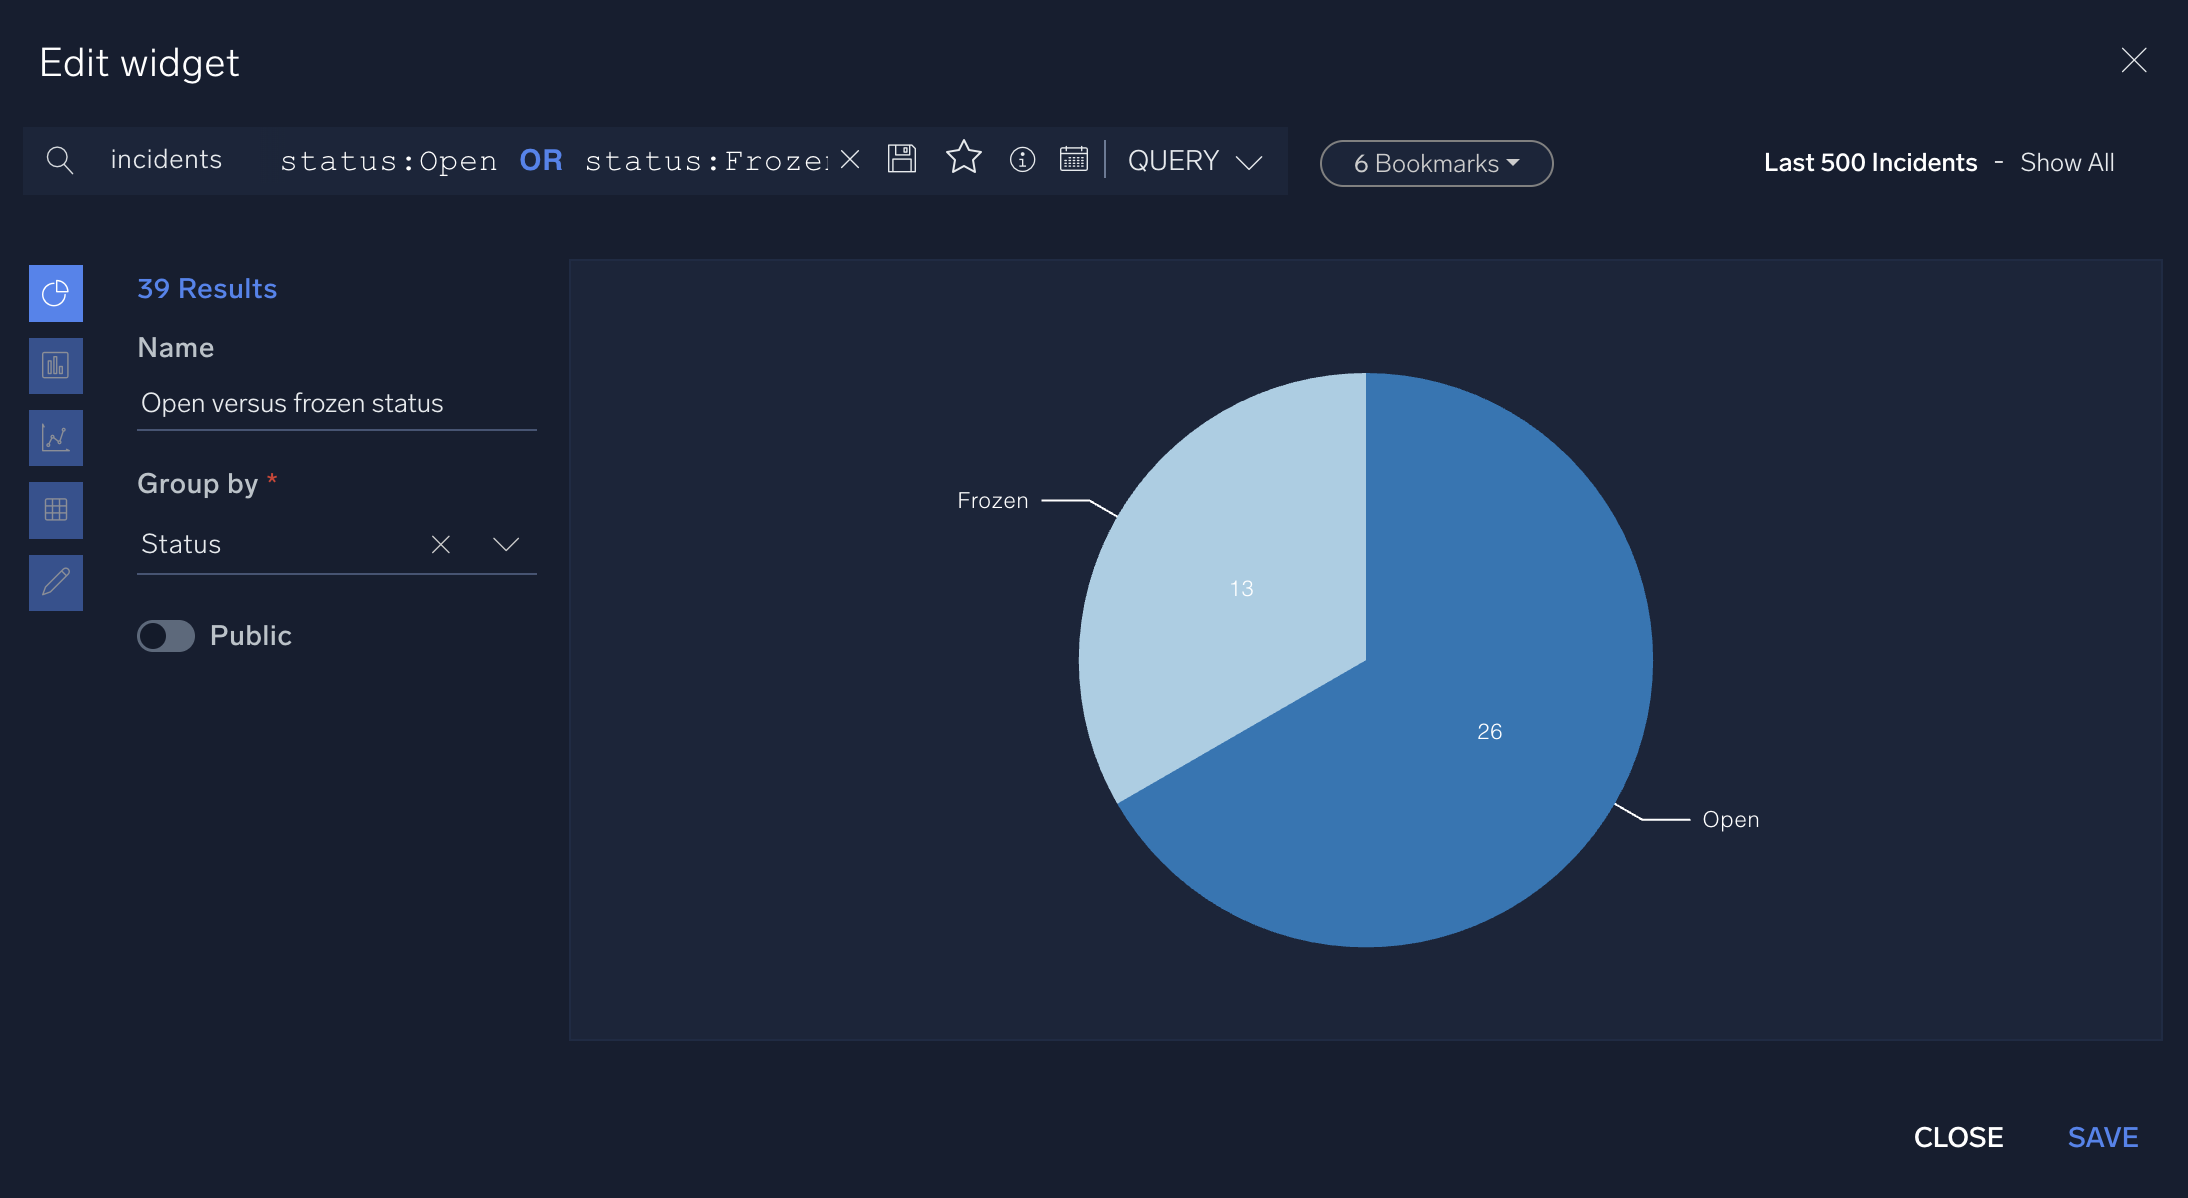
status:frozento query for all frozen incidents. - Create a widget to show the number of open versus frozen incidents in a pie chart:
- In the query bar at the top of the widget creation screen, enter
status:Open OR status:Frozento query for all open or frozen incidents. - In the left-hand side, select the pie chart icon to display the data as a pie chart.
- In Group by select Status.
- Click Save.
- In the query bar at the top of the widget creation screen, enter
- Create a dashboard and add the widgets to it:
Report
With the Report option, you can create incident reports to share with others as well as widgets to use in the report that display text, graphs, tables, and charts containing details about incidents and other aspects of Cloud SOAR.
- New UI. In the main Sumo Logic menu, select Cloud SOAR > Report. You can also click the Go To... menu at the top of the screen and select Report.
Classic UI. Click the gear icon in the top right and select Report.
The Report UI appears.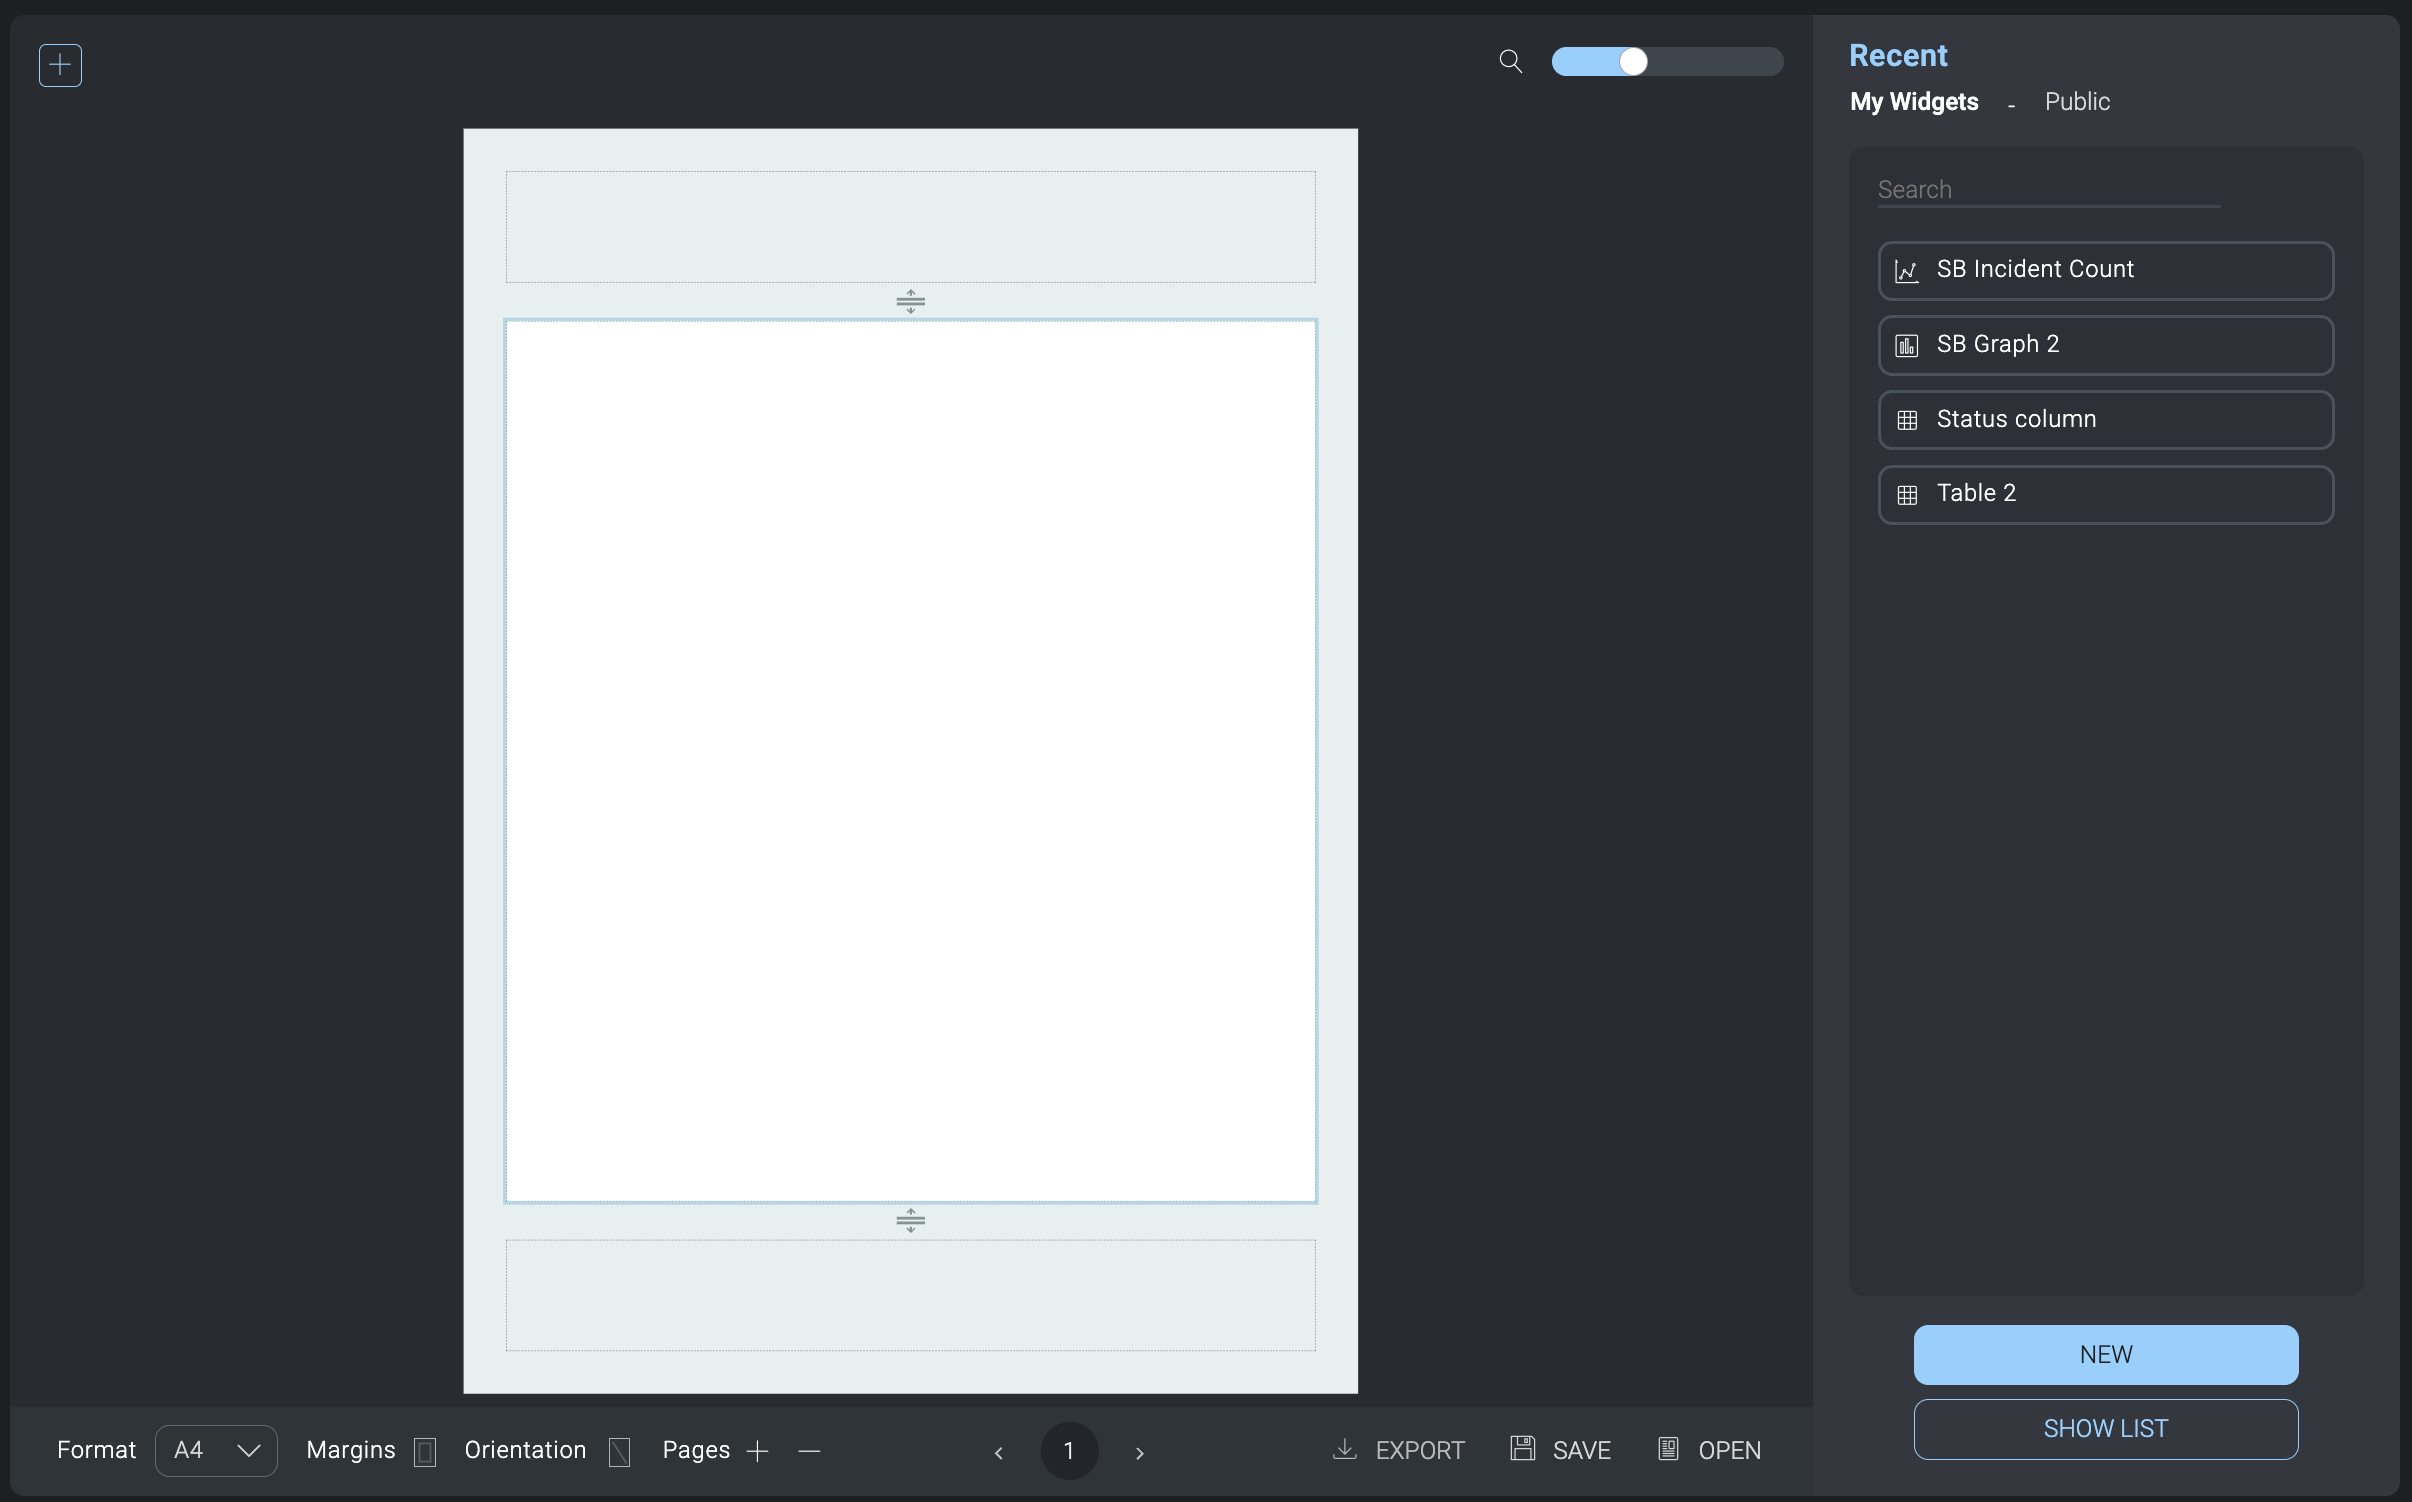
- Click the + icon in the upper left corner.
- On the right side, select widgets to add to the report from My Widgets or Public. These are the same widgets that are available to use in dashboards. Widgets can be graphs, charts, tables, or any kind of visual element that contains information. Click New to create a new widget. Click Show List to see all available widgets.
- Rearrange the widgets in the report as needed.
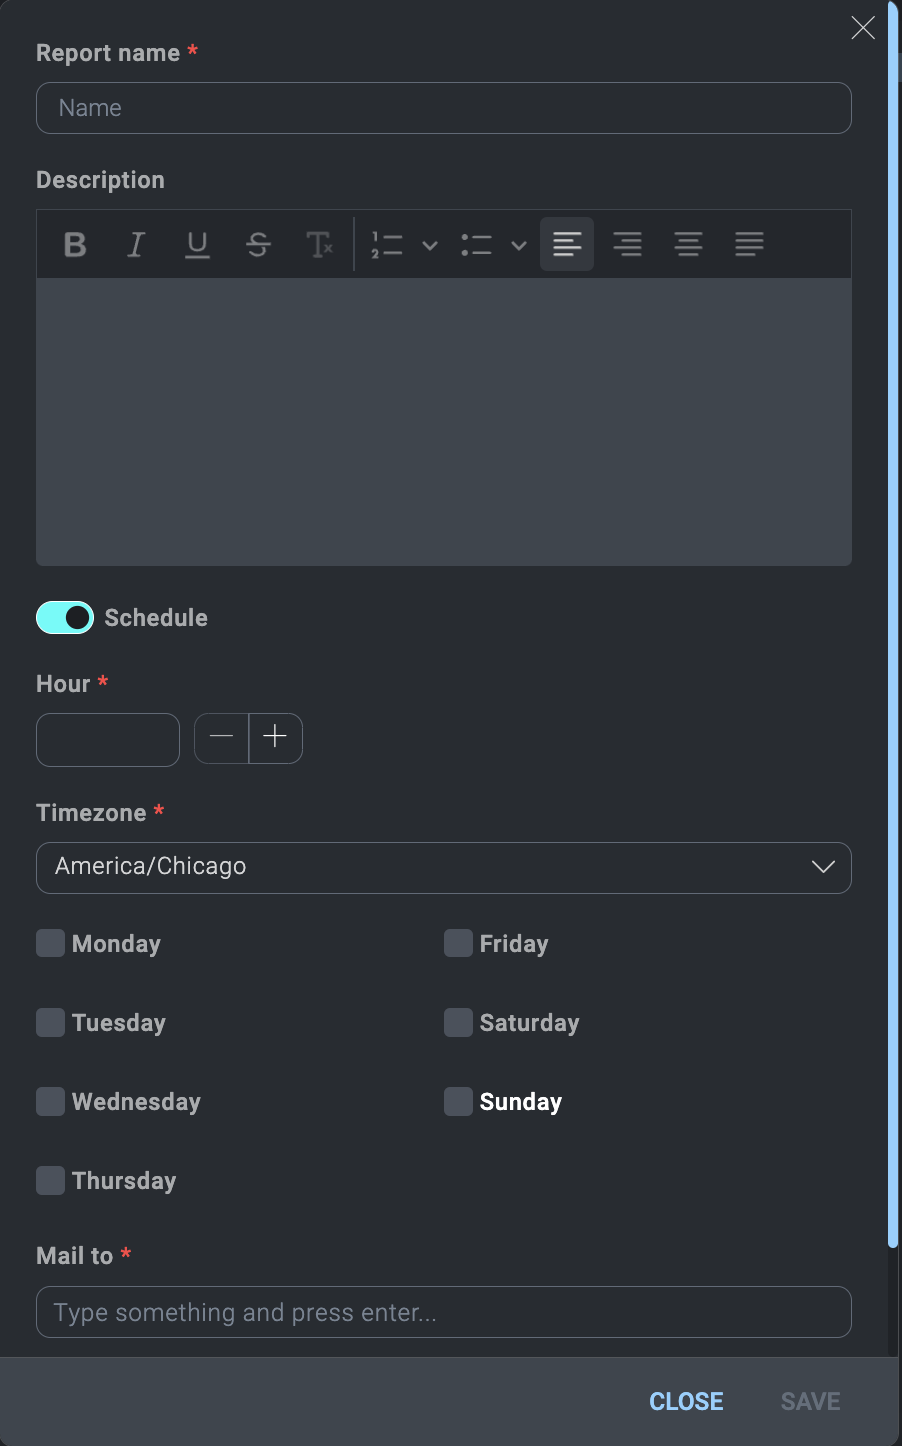
- Click Save. In the dialog:
- Provide a Report name and a Description.
- Click Schedule to schedule the report to run on a regular basis.
- Scroll to the bottom of the dialog and click Public if you want to make the report available to others.
- Click Save.
- Click Export to export the report to PDF.
- Click Open to open available reports.
Additional resources
Blog: Want to improve collaboration and reduce incident response time? Try Cloud SOAR War Room