Introduction to Cloud SOAR
This article provides an introduction to Cloud SOAR for analysts and administrators.
If you are unsure whether you are an analyst or administrator, you can view your role in Preferences (see Onboarding Checklists).
Introduction to Cloud SOAR for analysts
Cloud SOAR can help security analysts orchestrate and automate many pieces of the response process with playbooks. Playbooks are powerful, customizable tools that can help with incident containment, eradication, and recovery. Cloud SOAR also offers dashboards and reports to help you communicate across different teams in your organization.
What is Cloud SOAR?
Security Orchestration, Automation, and Response
Broadly speaking, Security Orchestration Automation and Response (SOAR) is a collection of scripts, APIs, playbooks, daemons, threat intelligence databases, dashboards, and other tools. In this introduction, we’ll be focusing on a few tools in particular:
- Threat Intel. A database of information gathered by external sources about various entities, such as host names, file hashes, IP addresses, and other known Indicators of Compromise.
- Playbooks. A collection of automated or semi-automated workflows that use Cloud SOAR integrations, tasks, and a variety of flow control decisions such as conditional statements.
- Dashboards. A quick, visual depiction of key information, including alerts, graphs, and tables to help monitor systems, make decisions, and communicate with other teams.
These tools work together to automate and orchestrate many processes that are a routine part of responding to security incidents. Threat Intel leverages the collected knowledge of many organizations to help find indicators of compromise faster. Playbook automation offloads many tedious, repetitive tasks from the security operations center (SOC) team, reducing response time and allowing SOC analysts to focus on other mission critical tasks. Dashboards provide a central place for different teams to work together to orchestrate their response in a timely, synchronized manner.
Sumo Logic's security solutions
The cybersecurity cycle is an iterative, scientific process, much like troubleshooting. In both cybersecurity and troubleshooting, you first monitor your system. Once an anomaly is detected, you can make a hypothesis about how it happened and diagnose or investigate the problem. Finally, you can take action to respond to the issue.
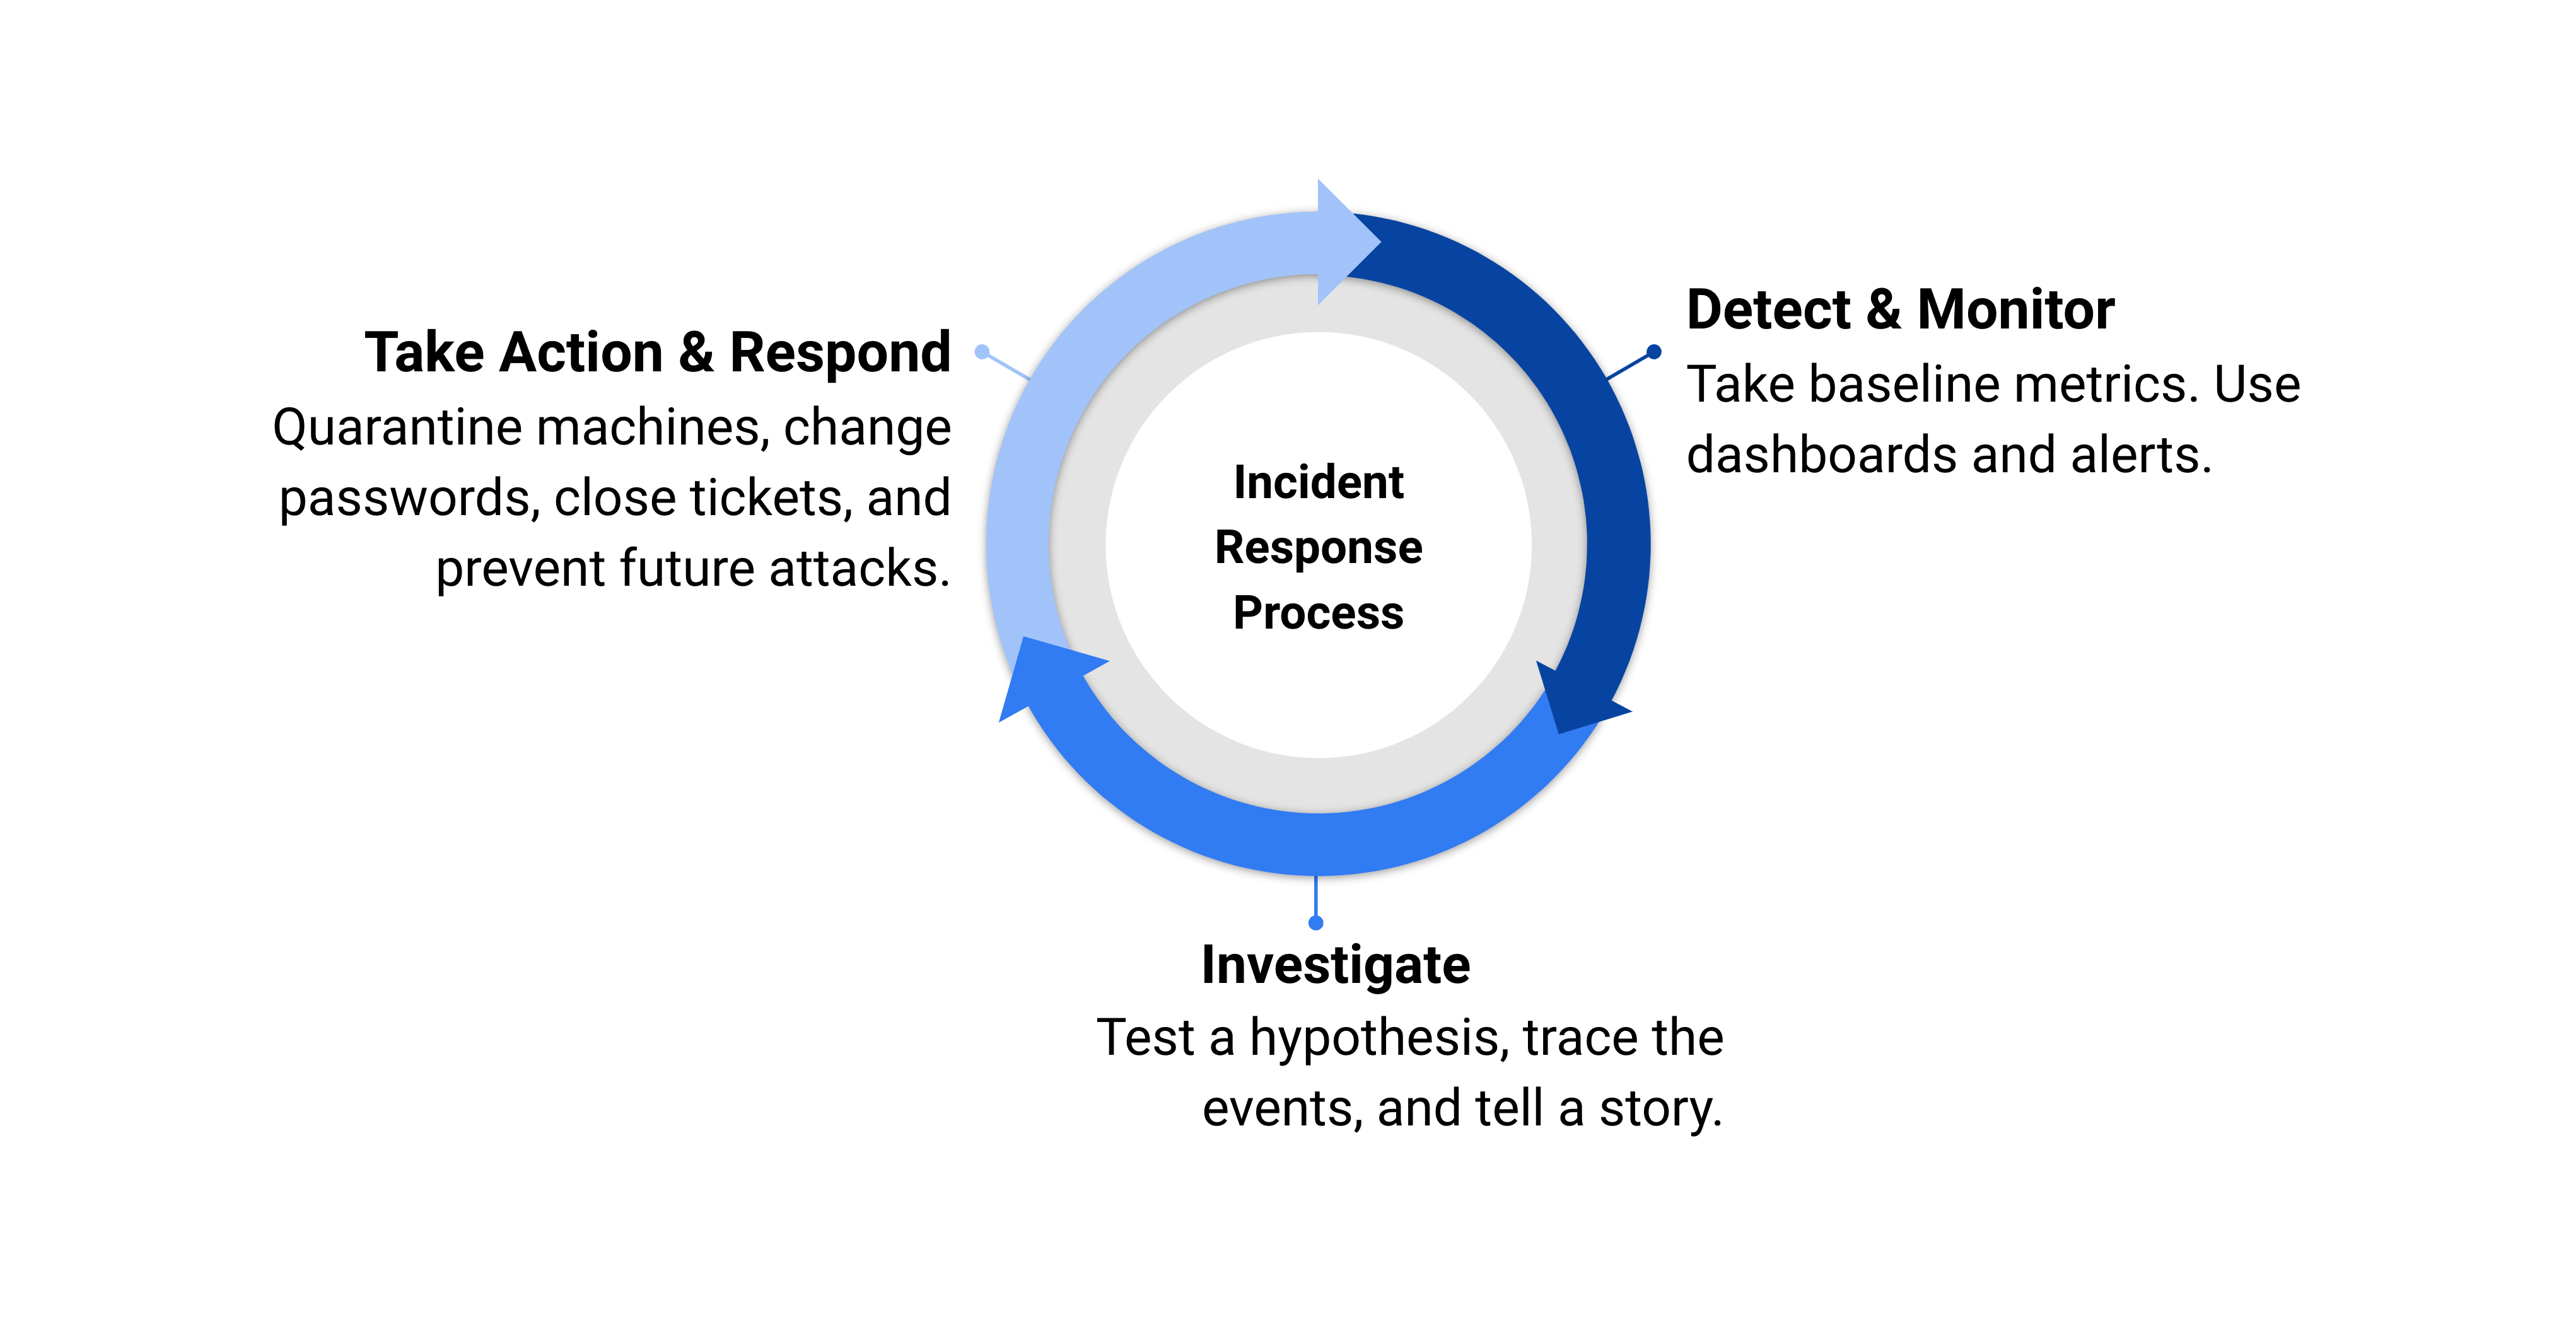
While Security Information Event Management (SIEM) tools help automate the threat hunting and investigation process, Security Orchestration Automation and Response (SOAR) tools are typically used in response to an active or potential threat. Both these tools work together as part of the security pipeline in your security operations center (SOC).
All of Sumo Logic’s security solutions can help with every step of this process. However, broadly speaking, Cloud SIEM focuses on the investigation phase, and Cloud SOAR focuses on the response phase. All our solutions can be used on their own, or together. For example, you can investigate an Insight in Cloud SIEM, then use the Actions button inside the Insight to send the information to Cloud SOAR, where you can orchestrate the response to the incident.
In this introduction, we'll focus on learning how to use Sumo Logic's Cloud SOAR to automate many parts of incident response and streamline your SOC.
Automating your SOC
As the newest member of your company's SOC team, it’s your task to set up some dashboards and playbooks to help monitor the system and automate daily security tasks, as well as prepare for compliance audits. The activities in this section will walk you through some of this using Sumo Logic’s Cloud SOAR.
The Sumo Logic security pipeline
Your company's apps and services generate logs, metrics, and tracing data.
When you ingest that data into Sumo Logic, you have one centralized location to query and visualize all that data. Sumo Logic’s Log Analytics Platform uses threat intelligence, so you can start getting security alerts and hunt threats. You can learn more in Additional Security Features.
You can take your security one step further with Cloud SIEM. When you forward your log messages to Cloud SIEM, they are parsed, mapped, and enriched into Cloud SIEM records. These records are compared to security rules. If a rule is triggered, an entity is extracted, a severity score is assigned, and a signal is created. If enough signals with the same entity cluster together, they become an Insight. Insights are likely risks that need your attention.
Finally, you can take the Insights from Cloud SIEM and automatically respond to them with Cloud SOAR. Cloud SOAR helps orchestrate and automate the incident response cycle.
Why use Cloud SOAR?
- Faster responses. Cloud SOAR can automate parts of your SOC, leading to faster response time
- Close the skills gap. Analysts of all skill levels can deploy playbooks. Veteran analysts can spend more time on threat hunting.
- Consolidate tools. Orchestrate all your security tools in one location with integrations and custom APIs.
- Part of a security suite. Cloud SOAR integrates with Sumo Logic's Log Analytics Platform and Cloud SIEM for a complete, end-to-end security solution.
Inside Sumo Logic Cloud SOAR
Sumo Logic’s Cloud SOAR is a cloud-based web application available as an add-on to existing Sumo Logic deployments. Some of Cloud SOAR’s key features include:
- War Room. A central location for all the information, analysis, and actions related to an incident. This includes notes, documentation, and knowledge transfer as well as tools for collecting data and assessing, investigating, and correlating different incidents.
- App Central. A large out-of-the-box library of playbooks, integrations, and use cases for different threats to get you started.
- Cybersecurity best practices. Cloud SOAR’s design and architecture meets many cybersecurity industry standards, regulatory frameworks, and best practices from organizations like ISO, GDPR, OASIS, NIST, and many others.
Below is the SecOps and Dashboard page.
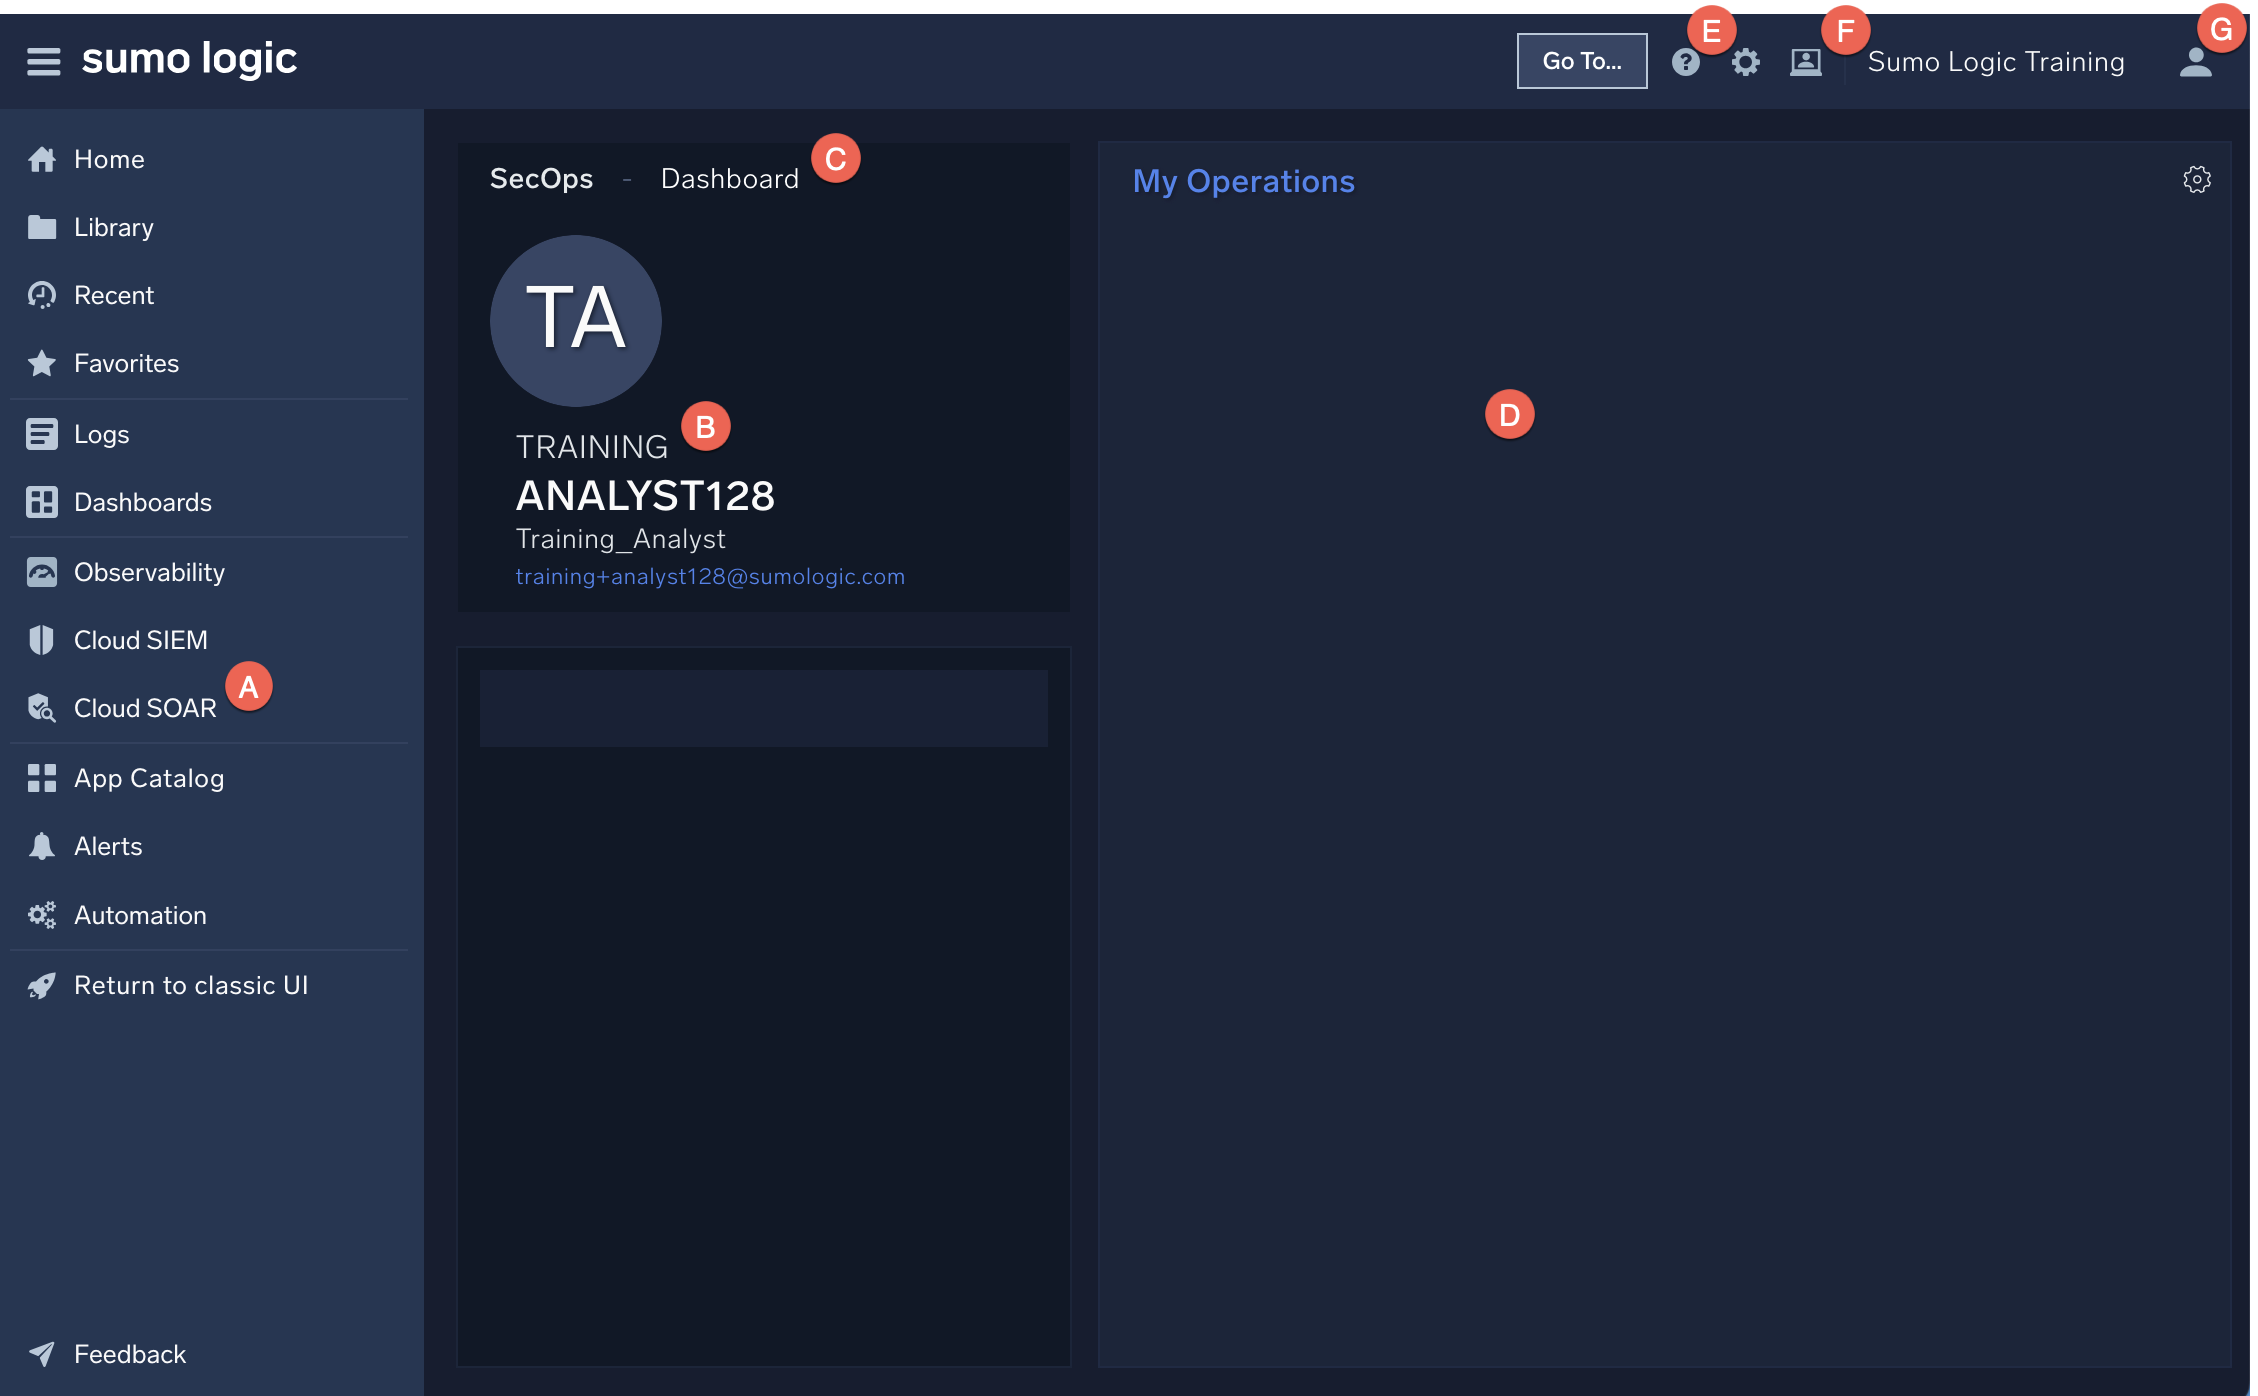
- A. Navigation. Use the side nav menu to access various Cloud SOAR views for incidents and entities.
- B. Username. Your username is shown here.
- C. Dashboard. The Dashboard page has an overview of current incidents as well as statistics for recent incidents.
- D. Work area. If you have any tasks to do or alerts you're monitoring, you'll see them here.
- E. Support. The Support page has downloadable PDF instruction manuals, API documentation, and contact information if you need help.
- F. Configuration and administration. Configuration and Administration menu options can be found here.
- G. Profile. The Profile page will show what permissions you and other users in your org have. You can also change settings like your timezone here.
Nearly everything in Cloud SOAR is fully customizable, from reports to dashboards to playbooks. You can even create custom playbooks using the drag-and-drop WYSIWYG.
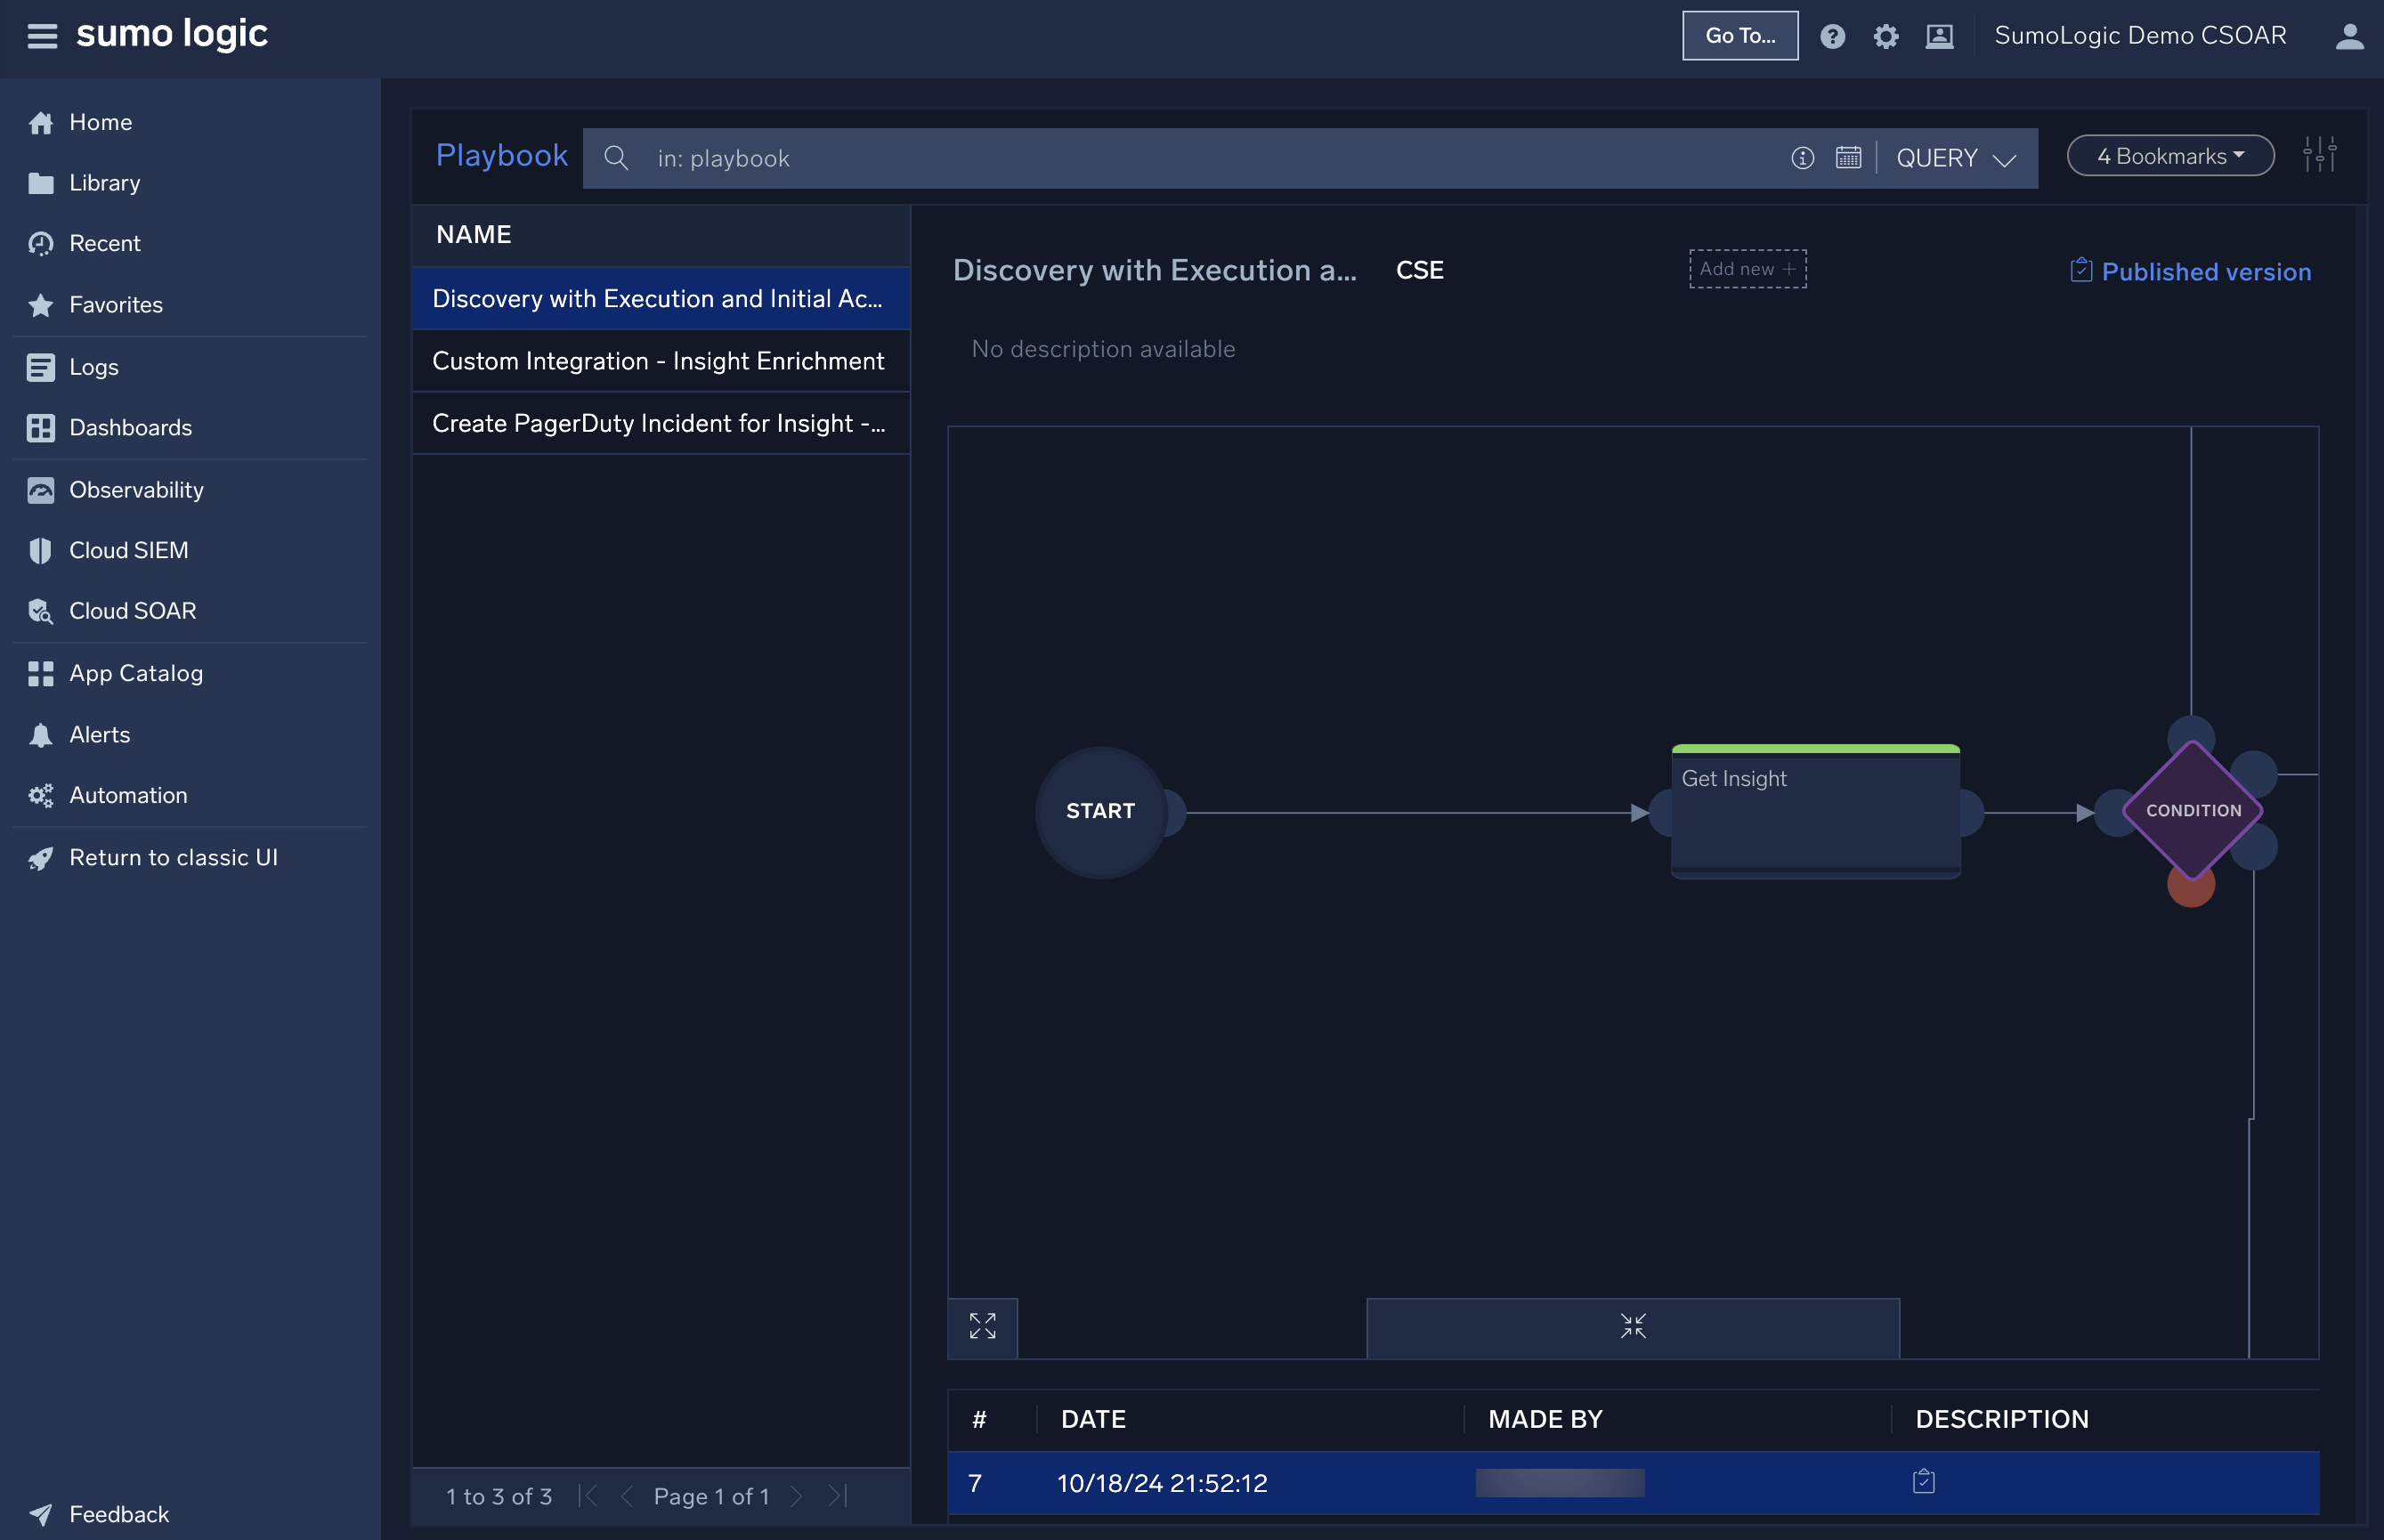
Playbooks are central to SOAR automation. Inside playbooks, you can add nodes with actions, tasks, conditions, user choices, or even embed other playbooks. Each action can either be executed automatically based on a condition, or manually by a user or group you authorize. Cloud SOAR’s playbook creation tool helps you visualize the workflow of each of these actions and conditions.
Explore the Sumo Logic Cloud SOAR UI
In this section, you’ll get to know the different parts of the Cloud SOAR UI.
- Navigate to the SecOps page.
New UI. In the main Sumo Logic menu select Cloud SOAR > SecOps & Dashboard. You can also click the Go To... menu at the top of the screen and select SecOps & Dashboard.
Classic UI. In the main Sumo Logic menu select Cloud SOAR.
If you have any tasks or alerts assigned to you, you’ll see them here in the My Operations panel.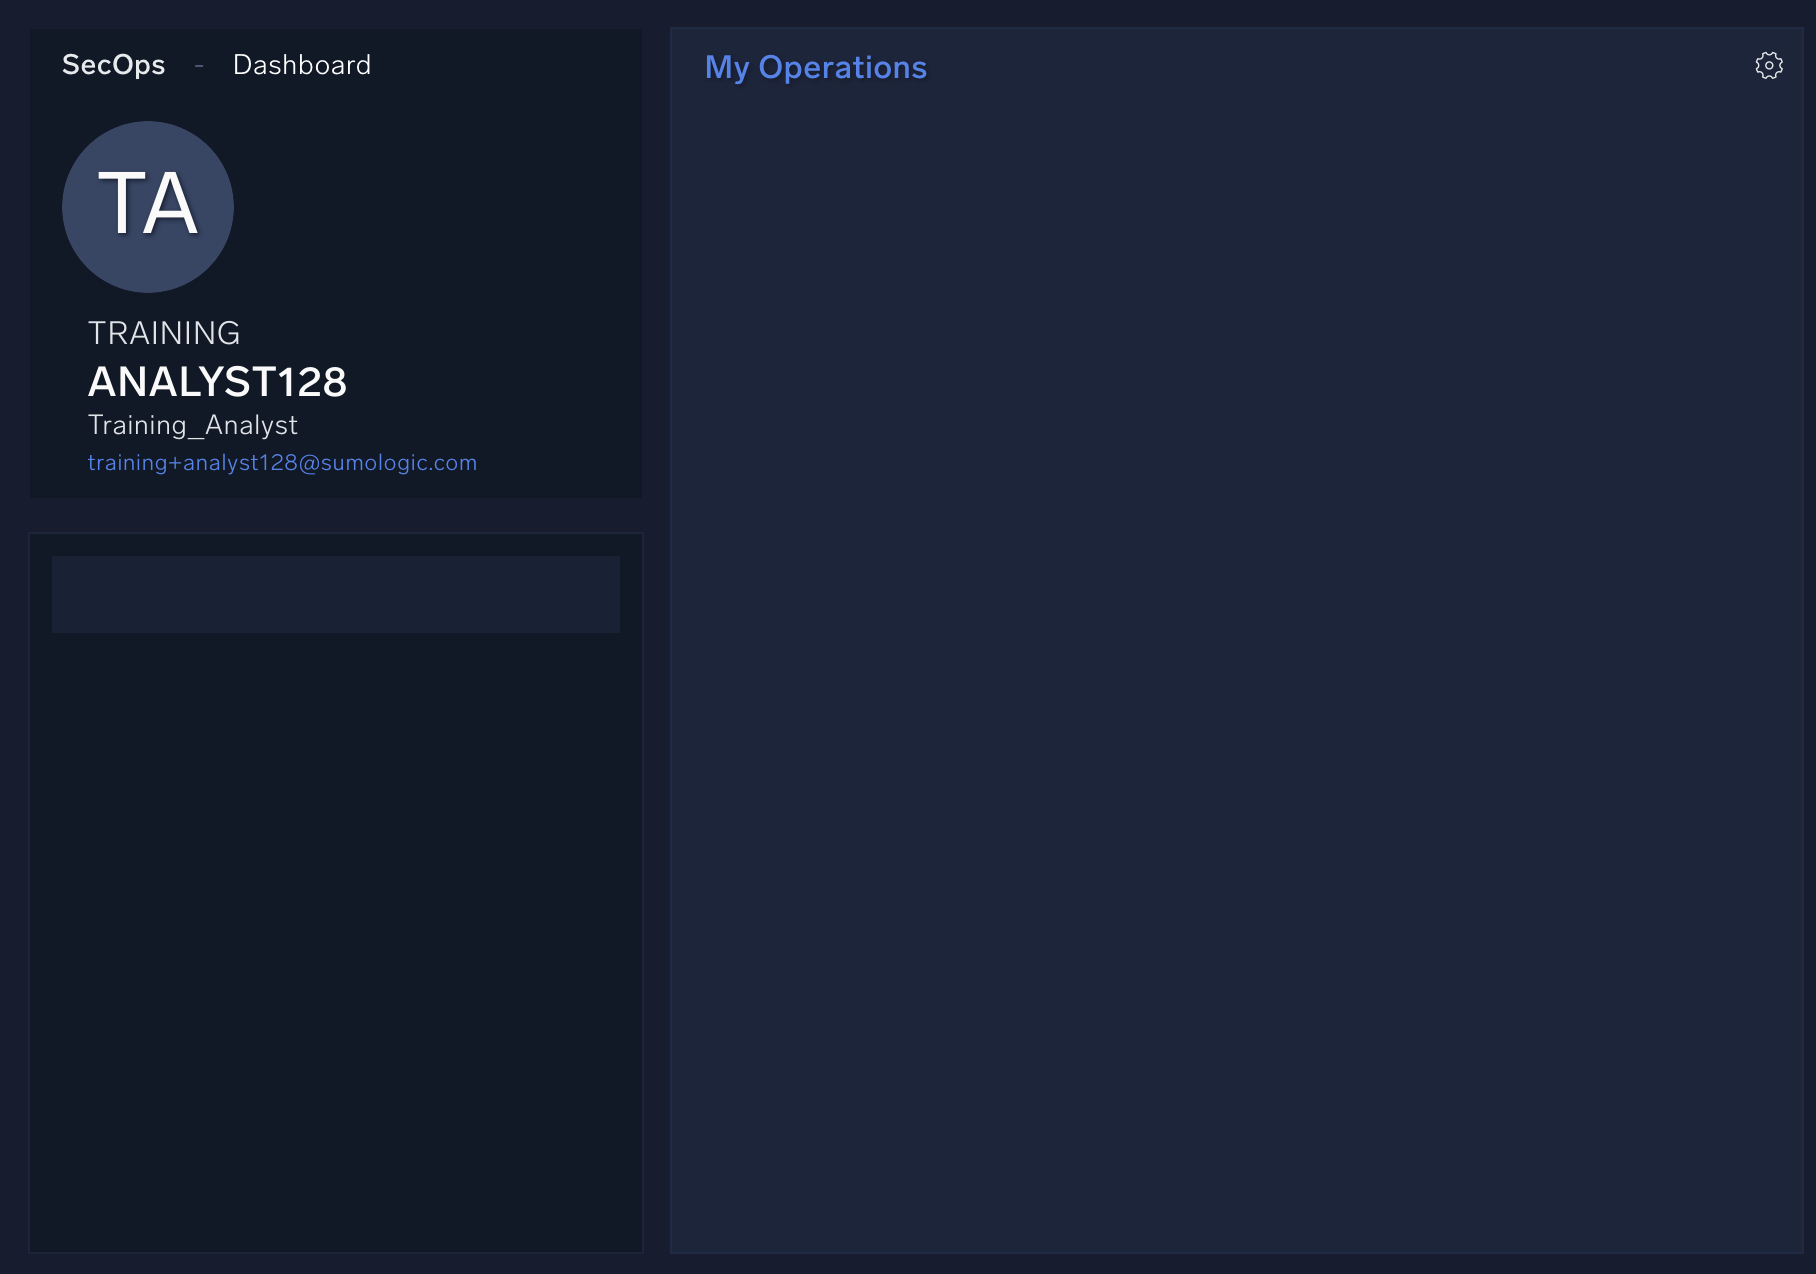
- Near the top left corner, above your user name, click Dashboard.
This will take you to your main dashboard page for your organization. Here you’ll see an overview of current incidents as well as statistics for recent incidents. We’ll learn how to customize this area in a later section.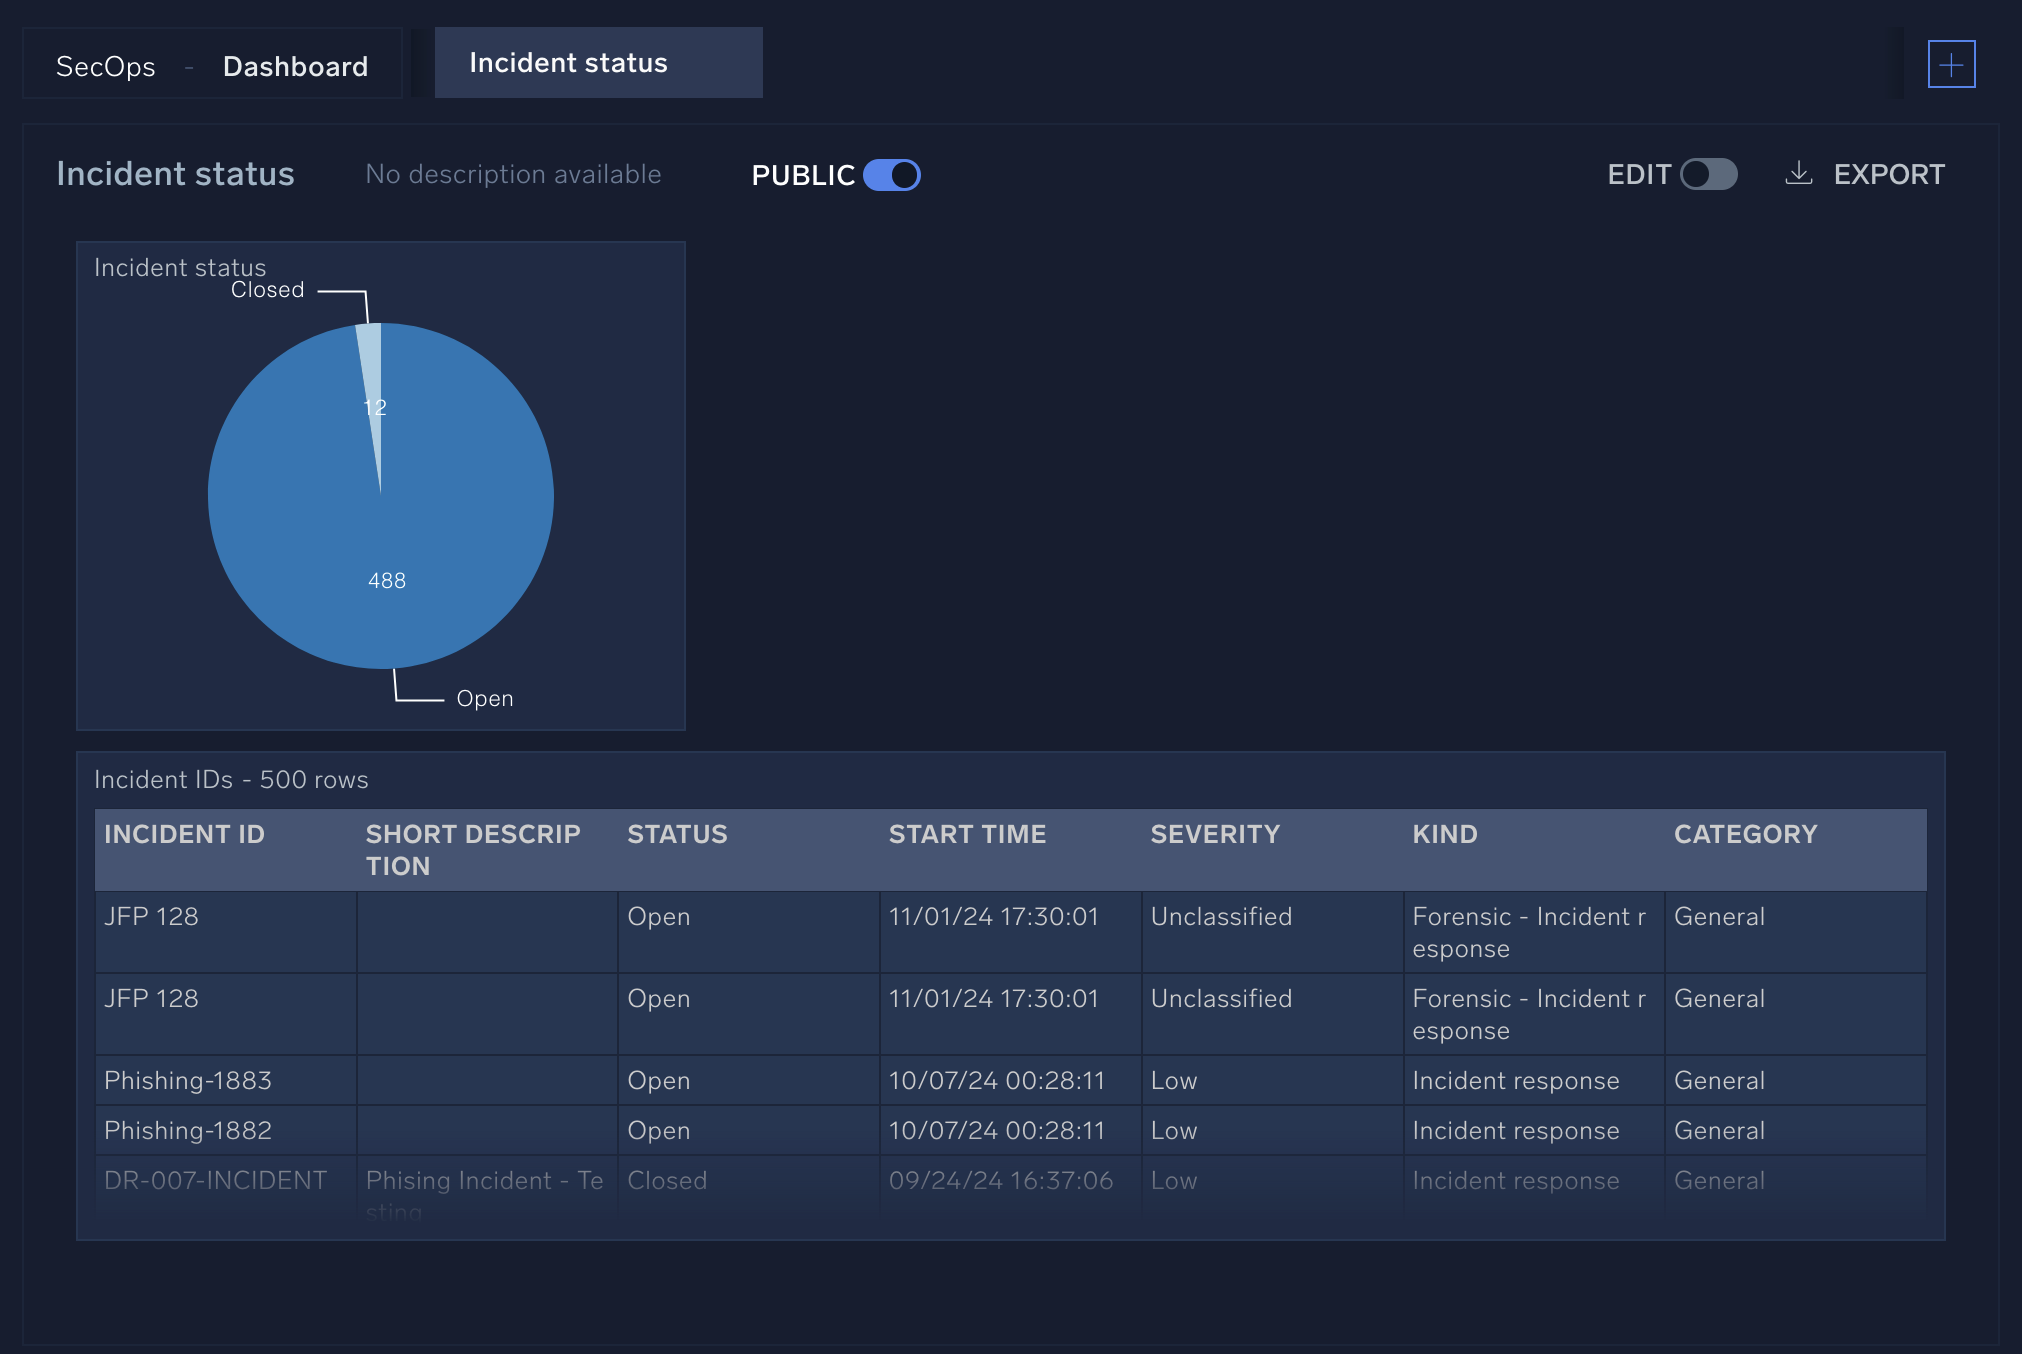
- Navigate to the Incidents page.
New UI. In the main Sumo Logic menu select Cloud SOAR > Incidents. You can also click the Go To... menu at the top of the screen and select Incidents.
Classic UI. In the main Sumo Logic menu select Cloud SOAR, and then select Incidents at the top of the SecOps screen.
Here you’ll see a list of all incidents for your organization. You can filter by various categories and search terms. For example, if you click Bookmarks and then select Mine you’ll only see incidents that have been assigned to you.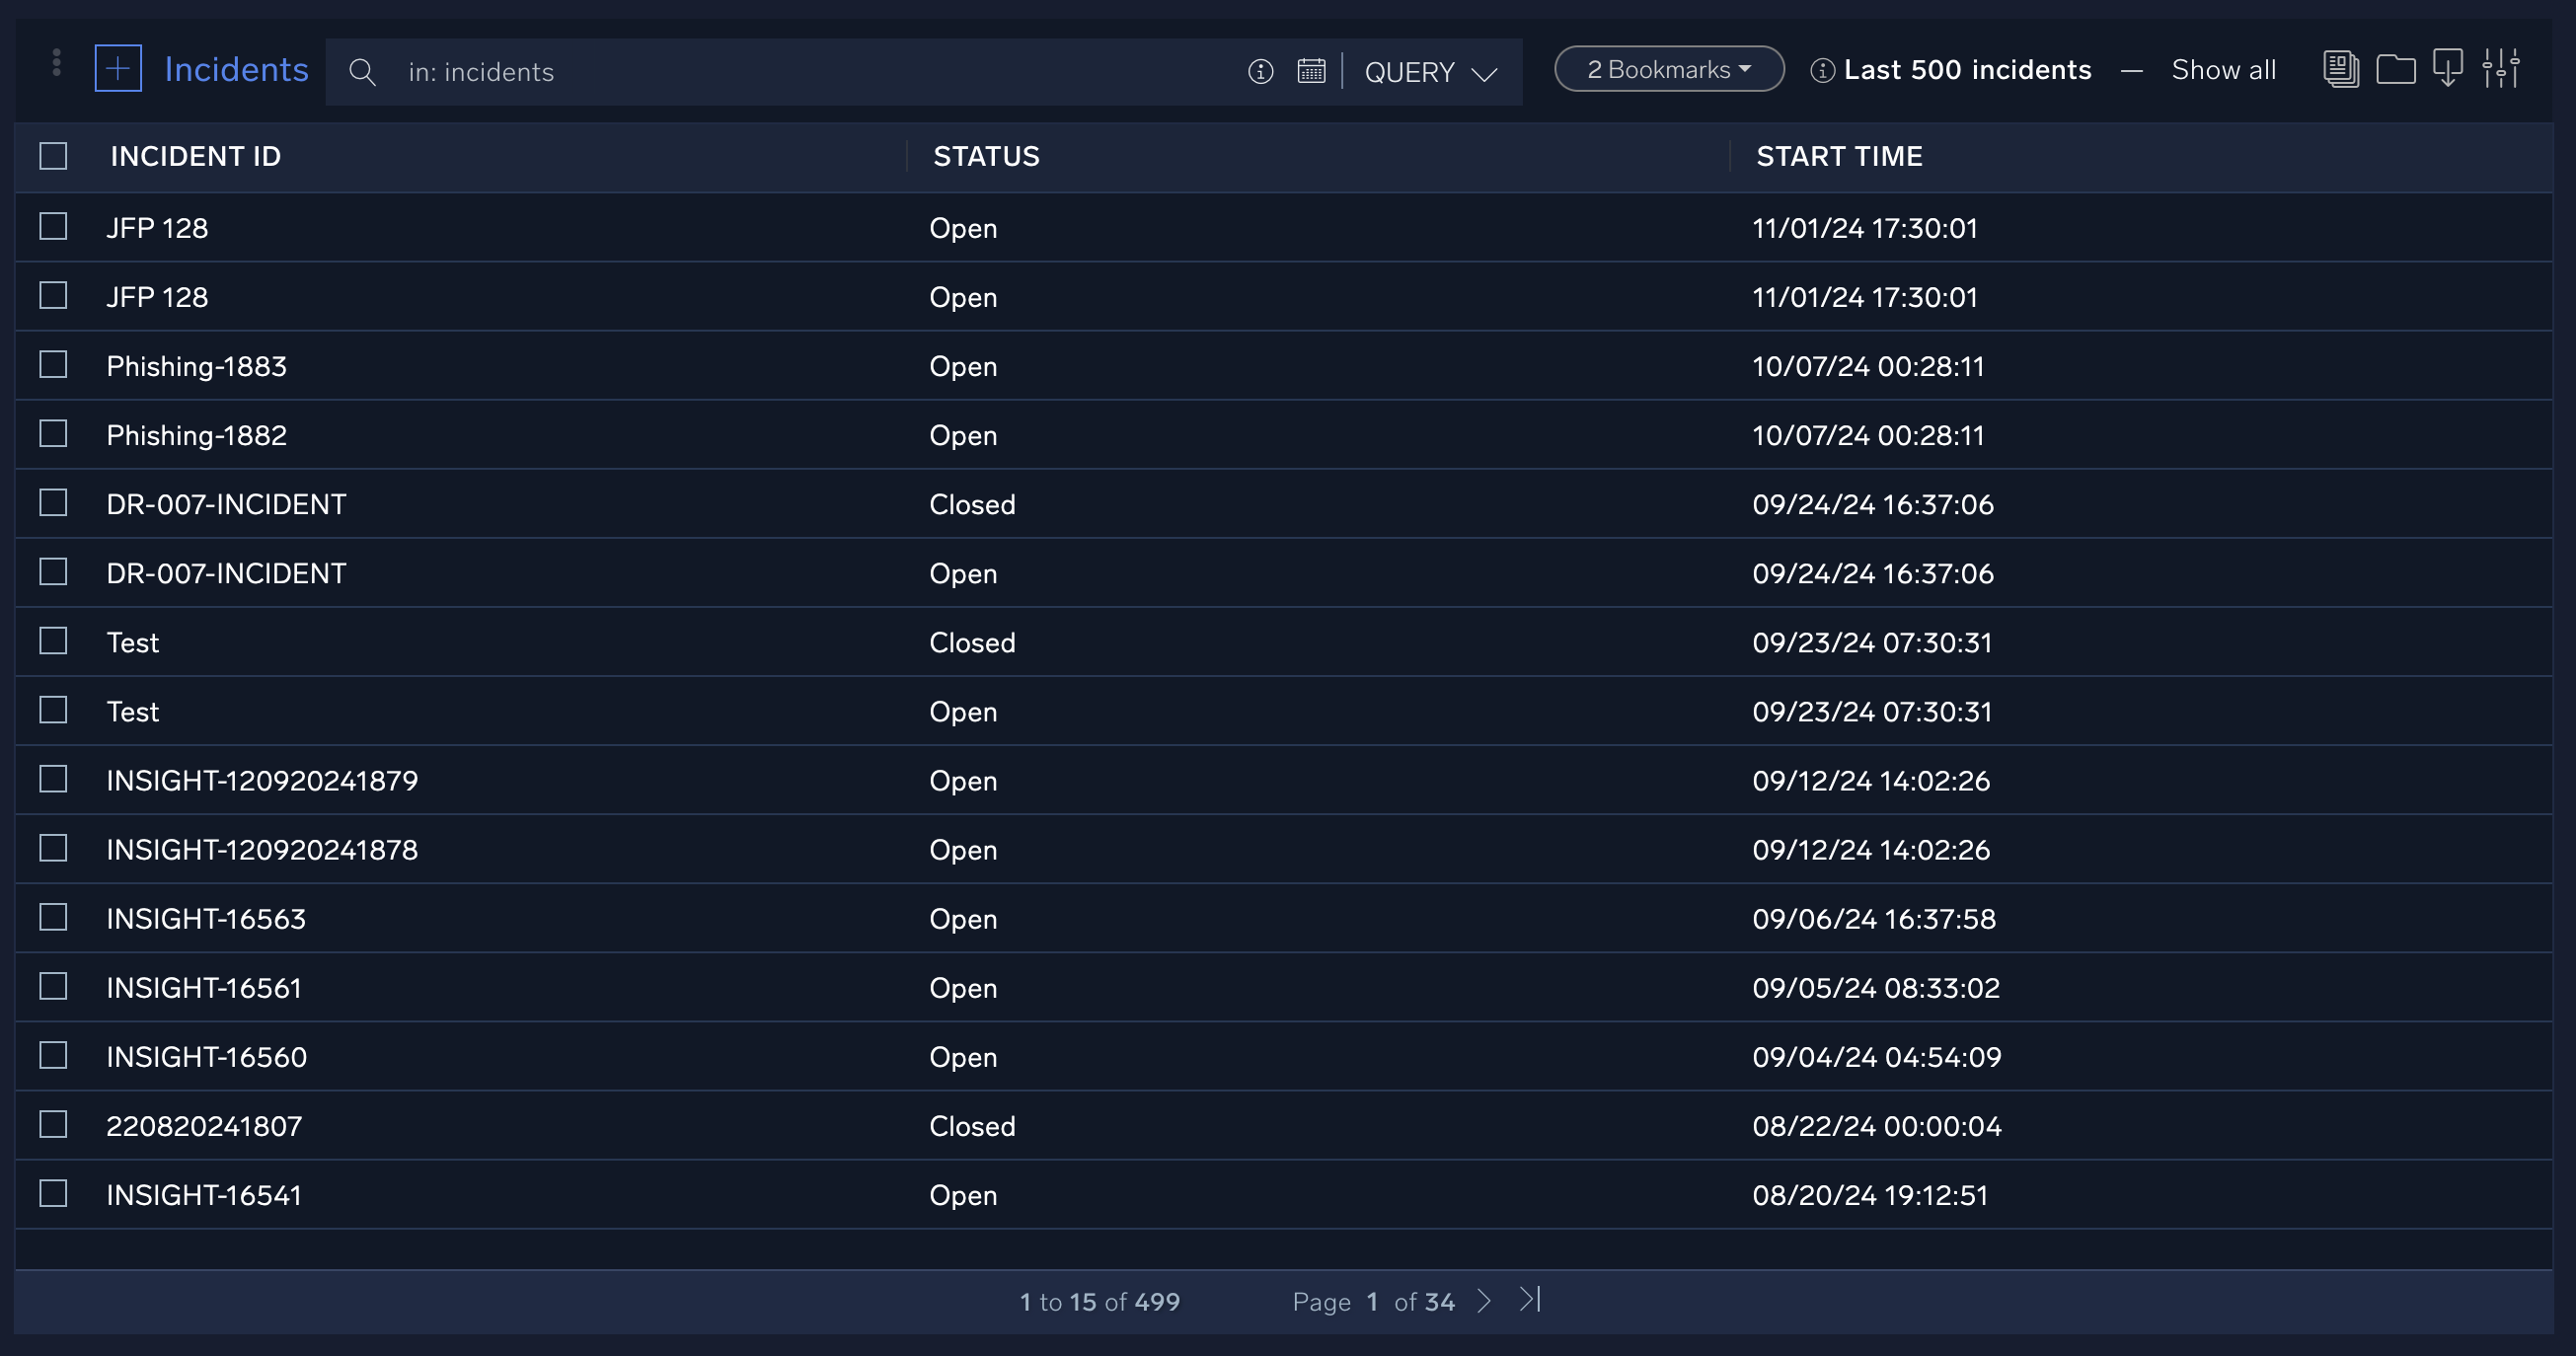
- Navigate to the Entities page.
New UI. In the main Sumo Logic menu select Cloud SOAR > Entities.
Classic UI. In the main Sumo Logic menu select Cloud SOAR, and then click the Entities button at the top of the screen.
Here you will see a list of all entities, such as IP addresses, host names, and other potential indicators of compromise. Entities are unique identifiers that can help you figure out who the potential threat actors are. Like the Incidents page, you can use filters and queries on the Entities page to sort through the entities in Cloud SOAR.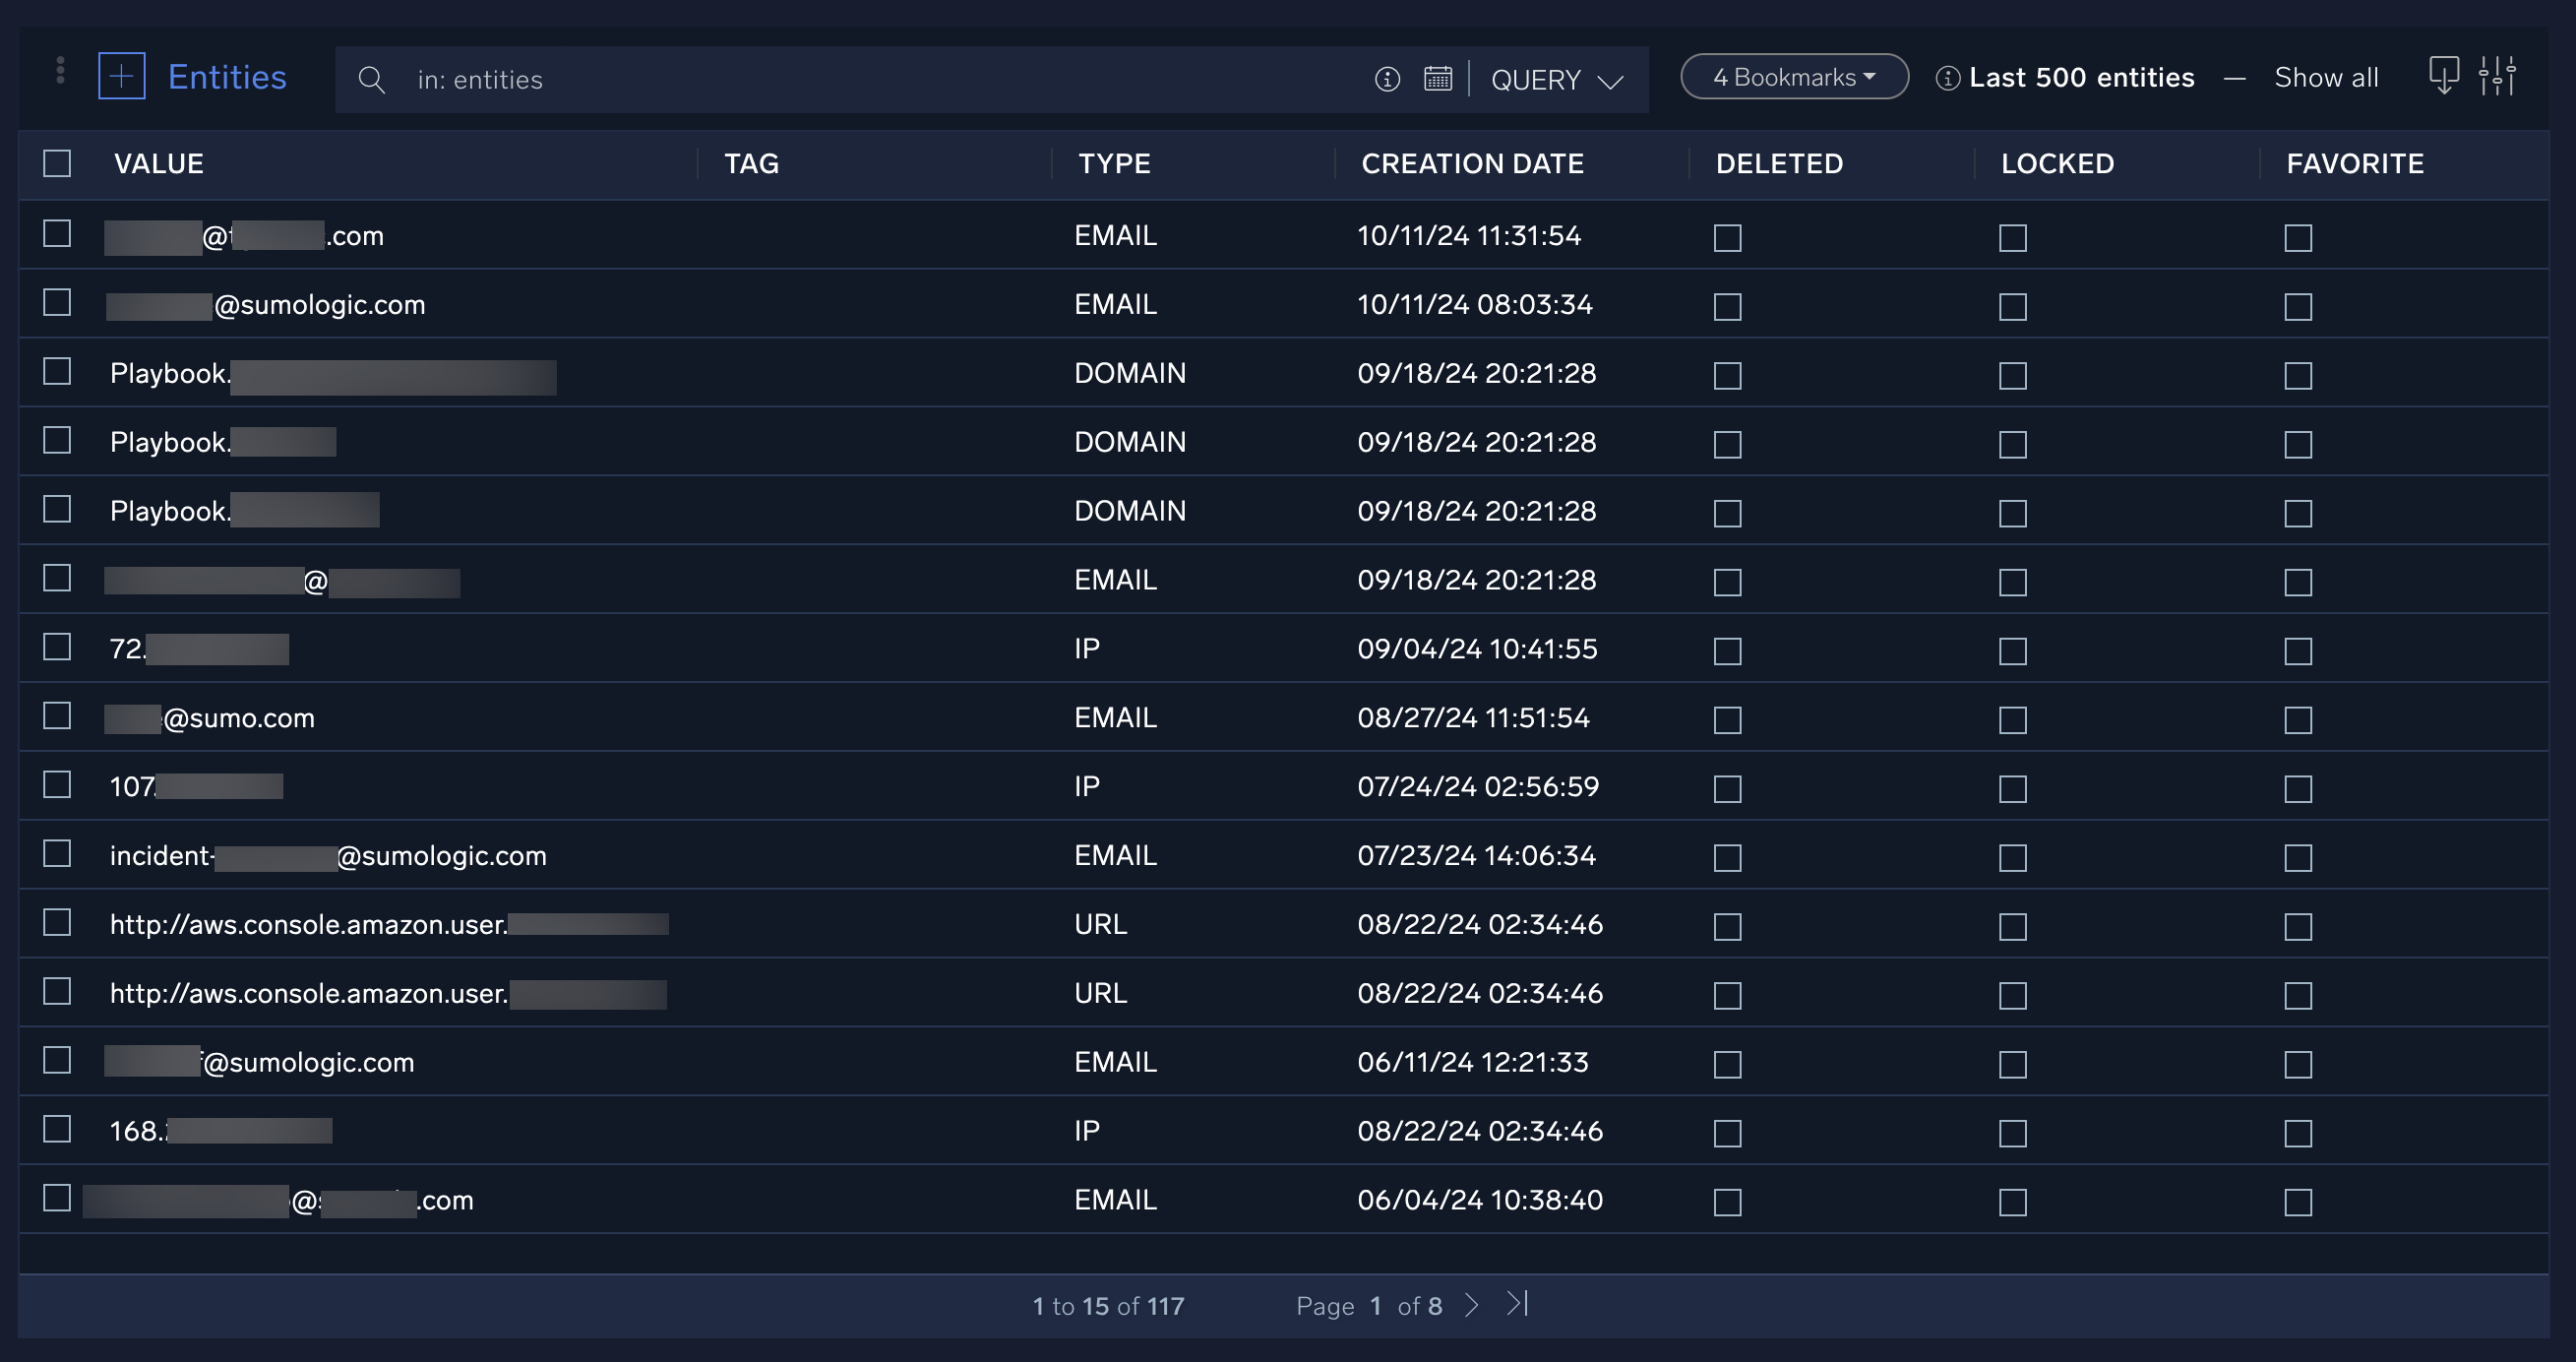
- Visit the Support page.
New UI. Click Help (question mark icon) in the upper right.
Classic UI. Click Help (question mark icon) in the upper right.
Classic UI. Click Profile (person icon) in the upper right corner.
Here you’ll find links to documentation, information about APIs and integrations, and contact information if you need to reach out to the Sumo Logic support team. - View your profile.
New UI. Click Profile (person icon) in the upper right corner.
Here you’ll see details about your user profile, including the roles you’ve been assigned.
Case management
Cloud SOAR case management
Case management is like project management, but the project you’re working on is a cybersecurity threat. Case management helps set priorities, assign tasks, and communicate information across different teams.
Cloud SOAR has some tools to help you with case management.
- SecOps. Contains all the tasks assigned to you and the groups you’re in. You can approve, decline, or close tasks here. Each task may be related to one or more incidents.
- Dashboards. Contains summary statistics for current and past incidents. You can view trends over time and get a high-level overview of what needs to be done.
- Incidents. Contains all current and past incidents, along with filters. You can open, close, and assign investigators and owners to incidents. Clicking an incident will take you to that incident’s War Room. This is a good place to start a threat investigation.
- Triage. Contains events which may be unverified or have a low confidence score. These are potential incidents and a good place to hunt for threats.
- Entities. Contains information about IP addresses, user names, hostnames, and other entities that have been involved in any incident in Cloud SOAR. This is another good place to hunt for threats or conduct a threat investigation
When you log in to Cloud SOAR, you can use these main pages to get a sense of what’s going on in your environment and what needs to be done. You can immediately identify the most recent tasks and actions waiting for approval by analysts. We can move inside the Incidents and Entities pages to have a complete overview of our system for further investigation. Analysts can also check playbooks and the results of actions.
Since Cloud SOAR integrates with hundreds of technologies, you can also interact with multiple ticketing and case management systems. The API-based communication between technologies is bidirectional, meaning Cloud SOAR can both receive and send information, at any time.
Threat Investigation with Cloud SOAR
One major component of case management is threat investigation.
Threat investigation is an iterative, scientific process, much like troubleshooting. In both threat investigation and troubleshooting, you first monitor your system with dashboards and alerts. Once an anomaly is detected, you can make a hypothesis about how it happened and investigate the problem. As you dig deeper, you may revise this initial hypothesis and find more clues about why or how the attack or error happened. As you investigate and trace the events, try to answer as many wh- questions as you can about the event to tell the story:
- Who is behind the event?
- What assets did the event affect?
- Where did the event occur?
- When did the event occur?
- Why did the event occur?
- How did the event occur?
Finally, you can then take action to resolve the issue. There are many actions you might take in response to an incident. For example, you might work with your IT team to isolate and wipe laptops infected with malware to prevent spread of malicious code. Or, you might work with your HR team to enforce mandatory anti-phishing training among all employees to prevent future attacks.
Before you can respond to an incident, you must investigate it to determine who the attacker is, what kind of threat it is, where the threat is coming from, and how or why the attack was made.
Remember, threat investigation is reactive while threat hunting is proactive. Typically, threat investigation happens in reaction to an alert. Once you’ve investigated a threat, you can proactively hunt for similar threats and take precautionary steps to prevent attacks from happening again.
You can do both threat investigation and threat hunting using Cloud SOAR. You may have gotten an alert from Sumo Logic, Cloud SIEM, or directly from Cloud SOAR. Armed with this information, you can log in to Cloud SOAR. You can click the Incidents page to learn more about what happened, or click the Entities page to learn more about who the potential threat actors are.
Only after you’ve gathered enough information about the incident can you decide how to respond to the incident.
Exploring an incident with Cloud SOAR
Every incident in Cloud SOAR follows an Incident Template. These templates define attributes such as the incident type, severity, who is assigned to the incident, and other parameters.
When you click an incident in Cloud SOAR, you’ll be taken to the incident Overview page.
Here you’ll find basic information such as the severity level, category, opening time, and status. You can also customize your incidents and enrich them with new information by going into Edit mode.
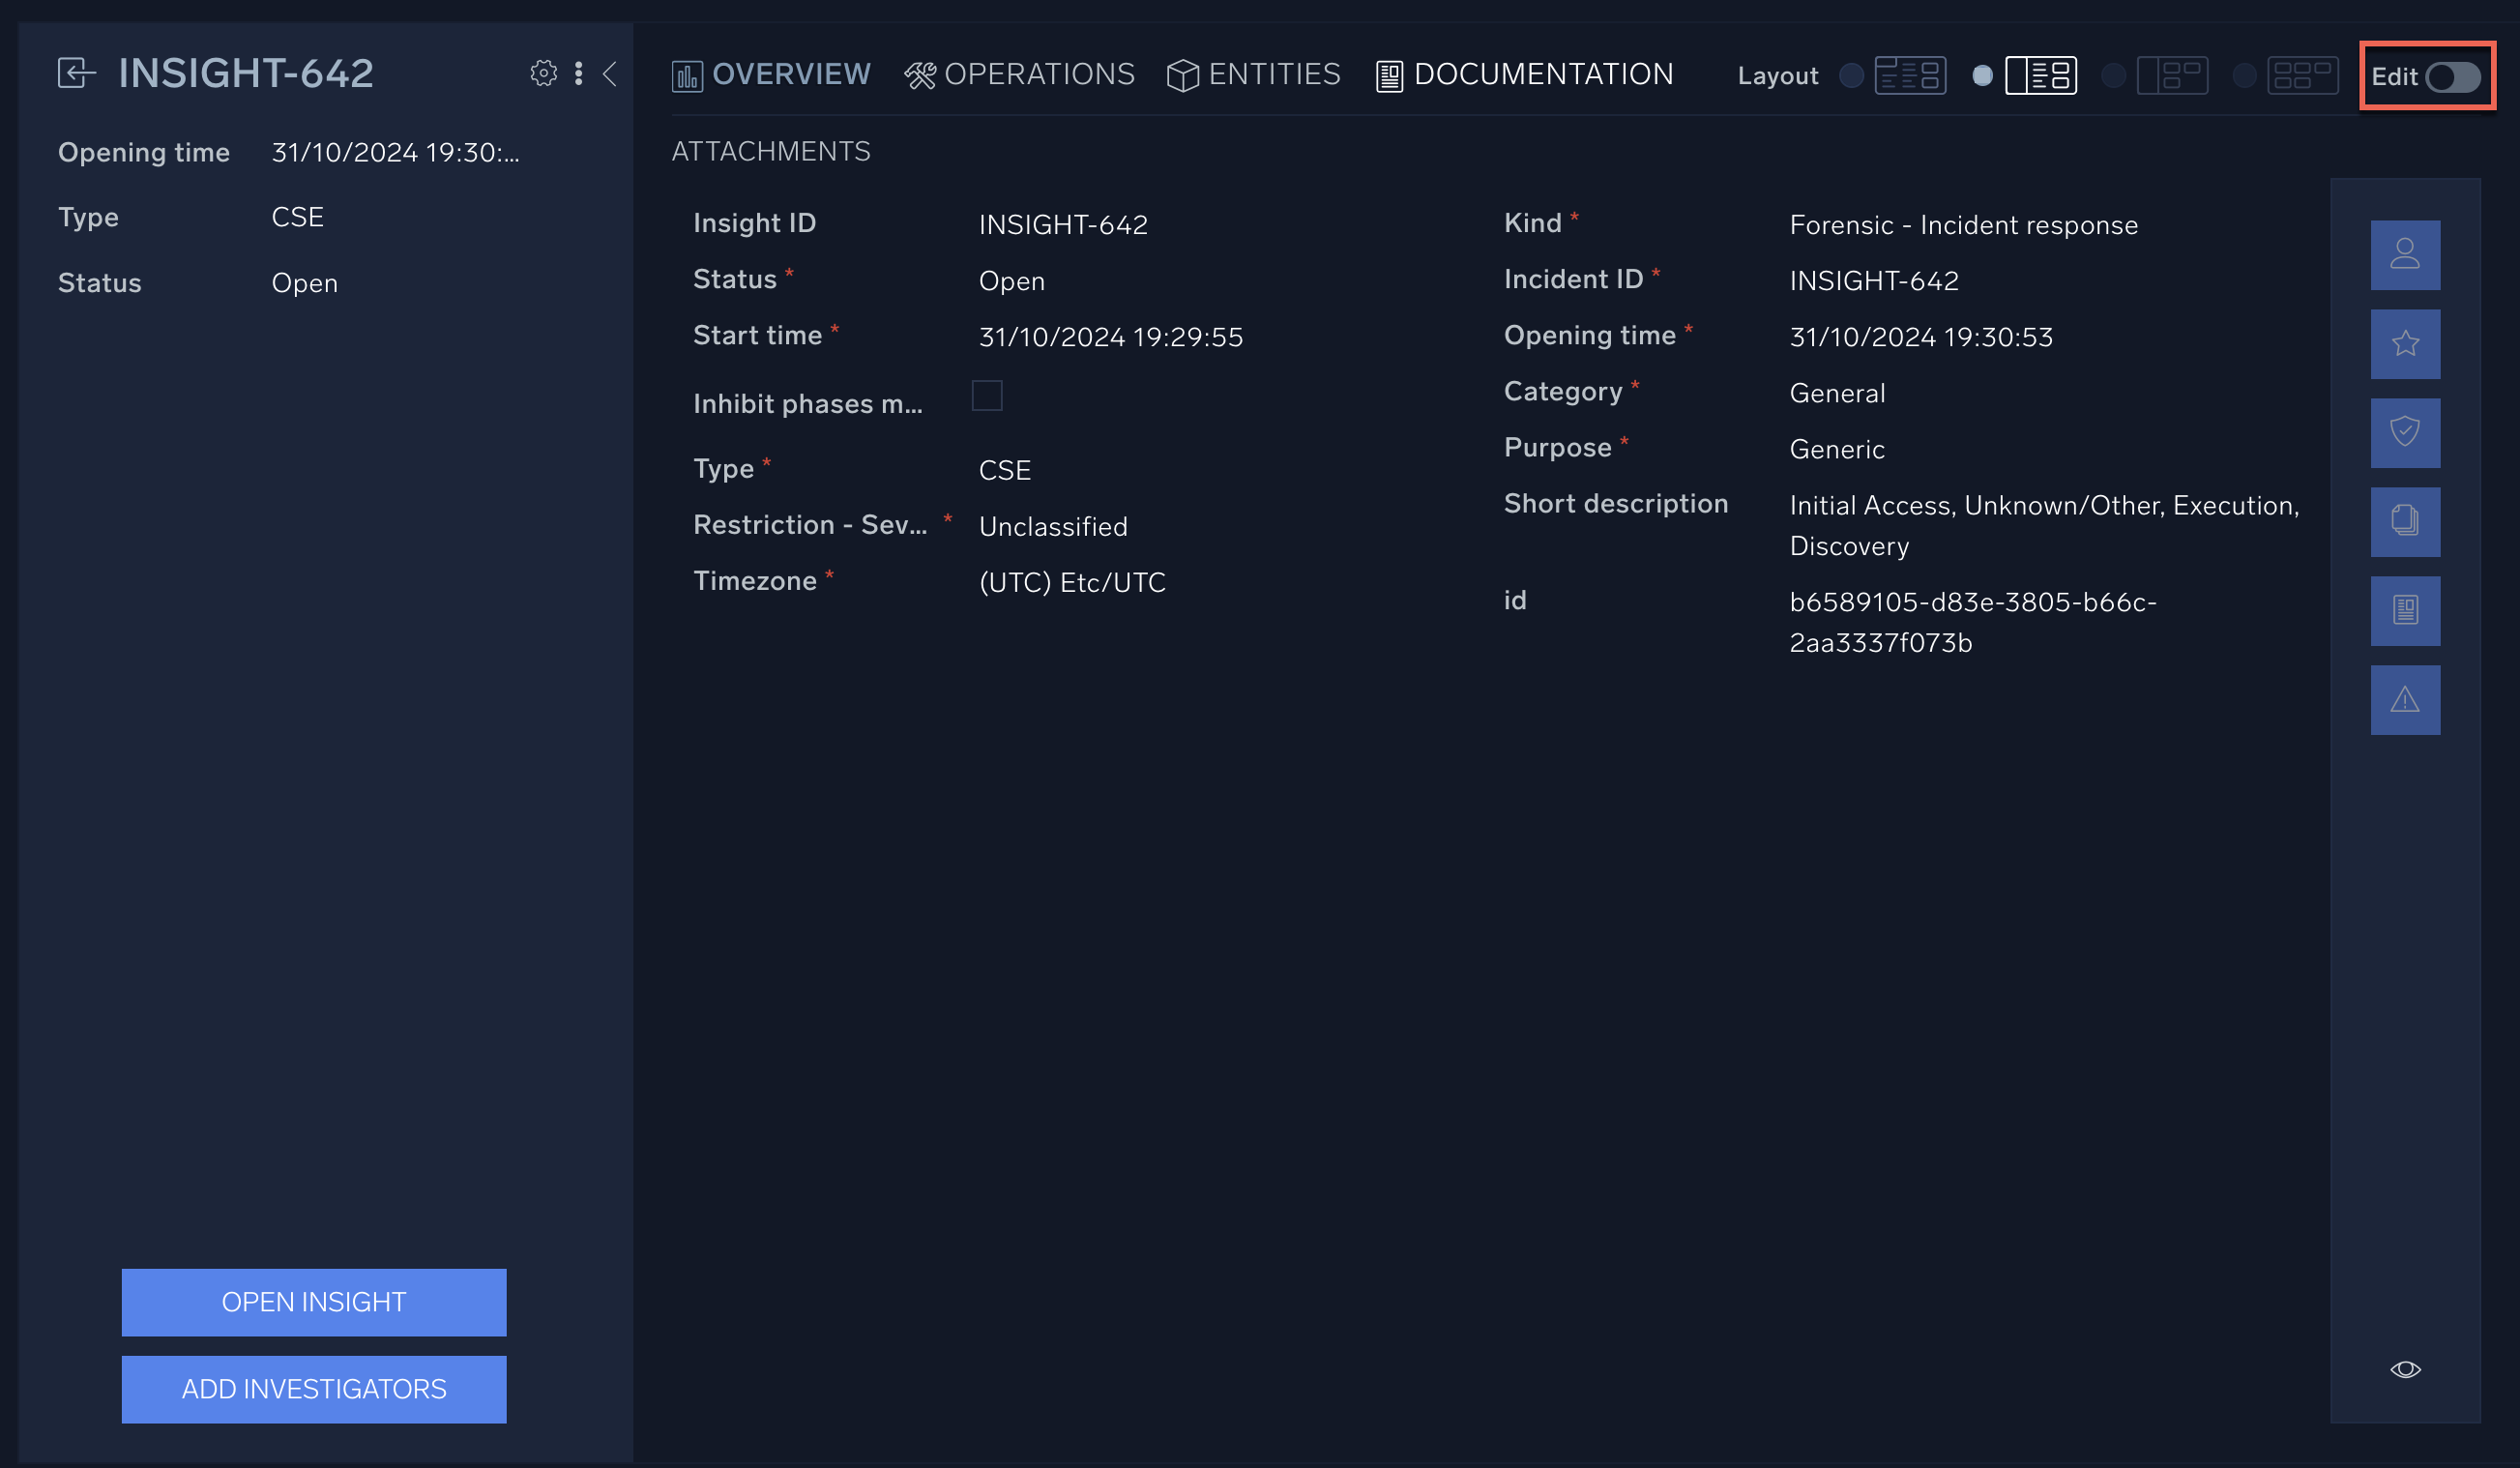
Once in edit mode, you can add various widgets from the right navigation pane. These widgets can help you check who owns the incident, add new owners, view the history of the incident, and many other tasks.
In addition to the Overview page, every incident also has an Operations, Entities, and Documentation page.
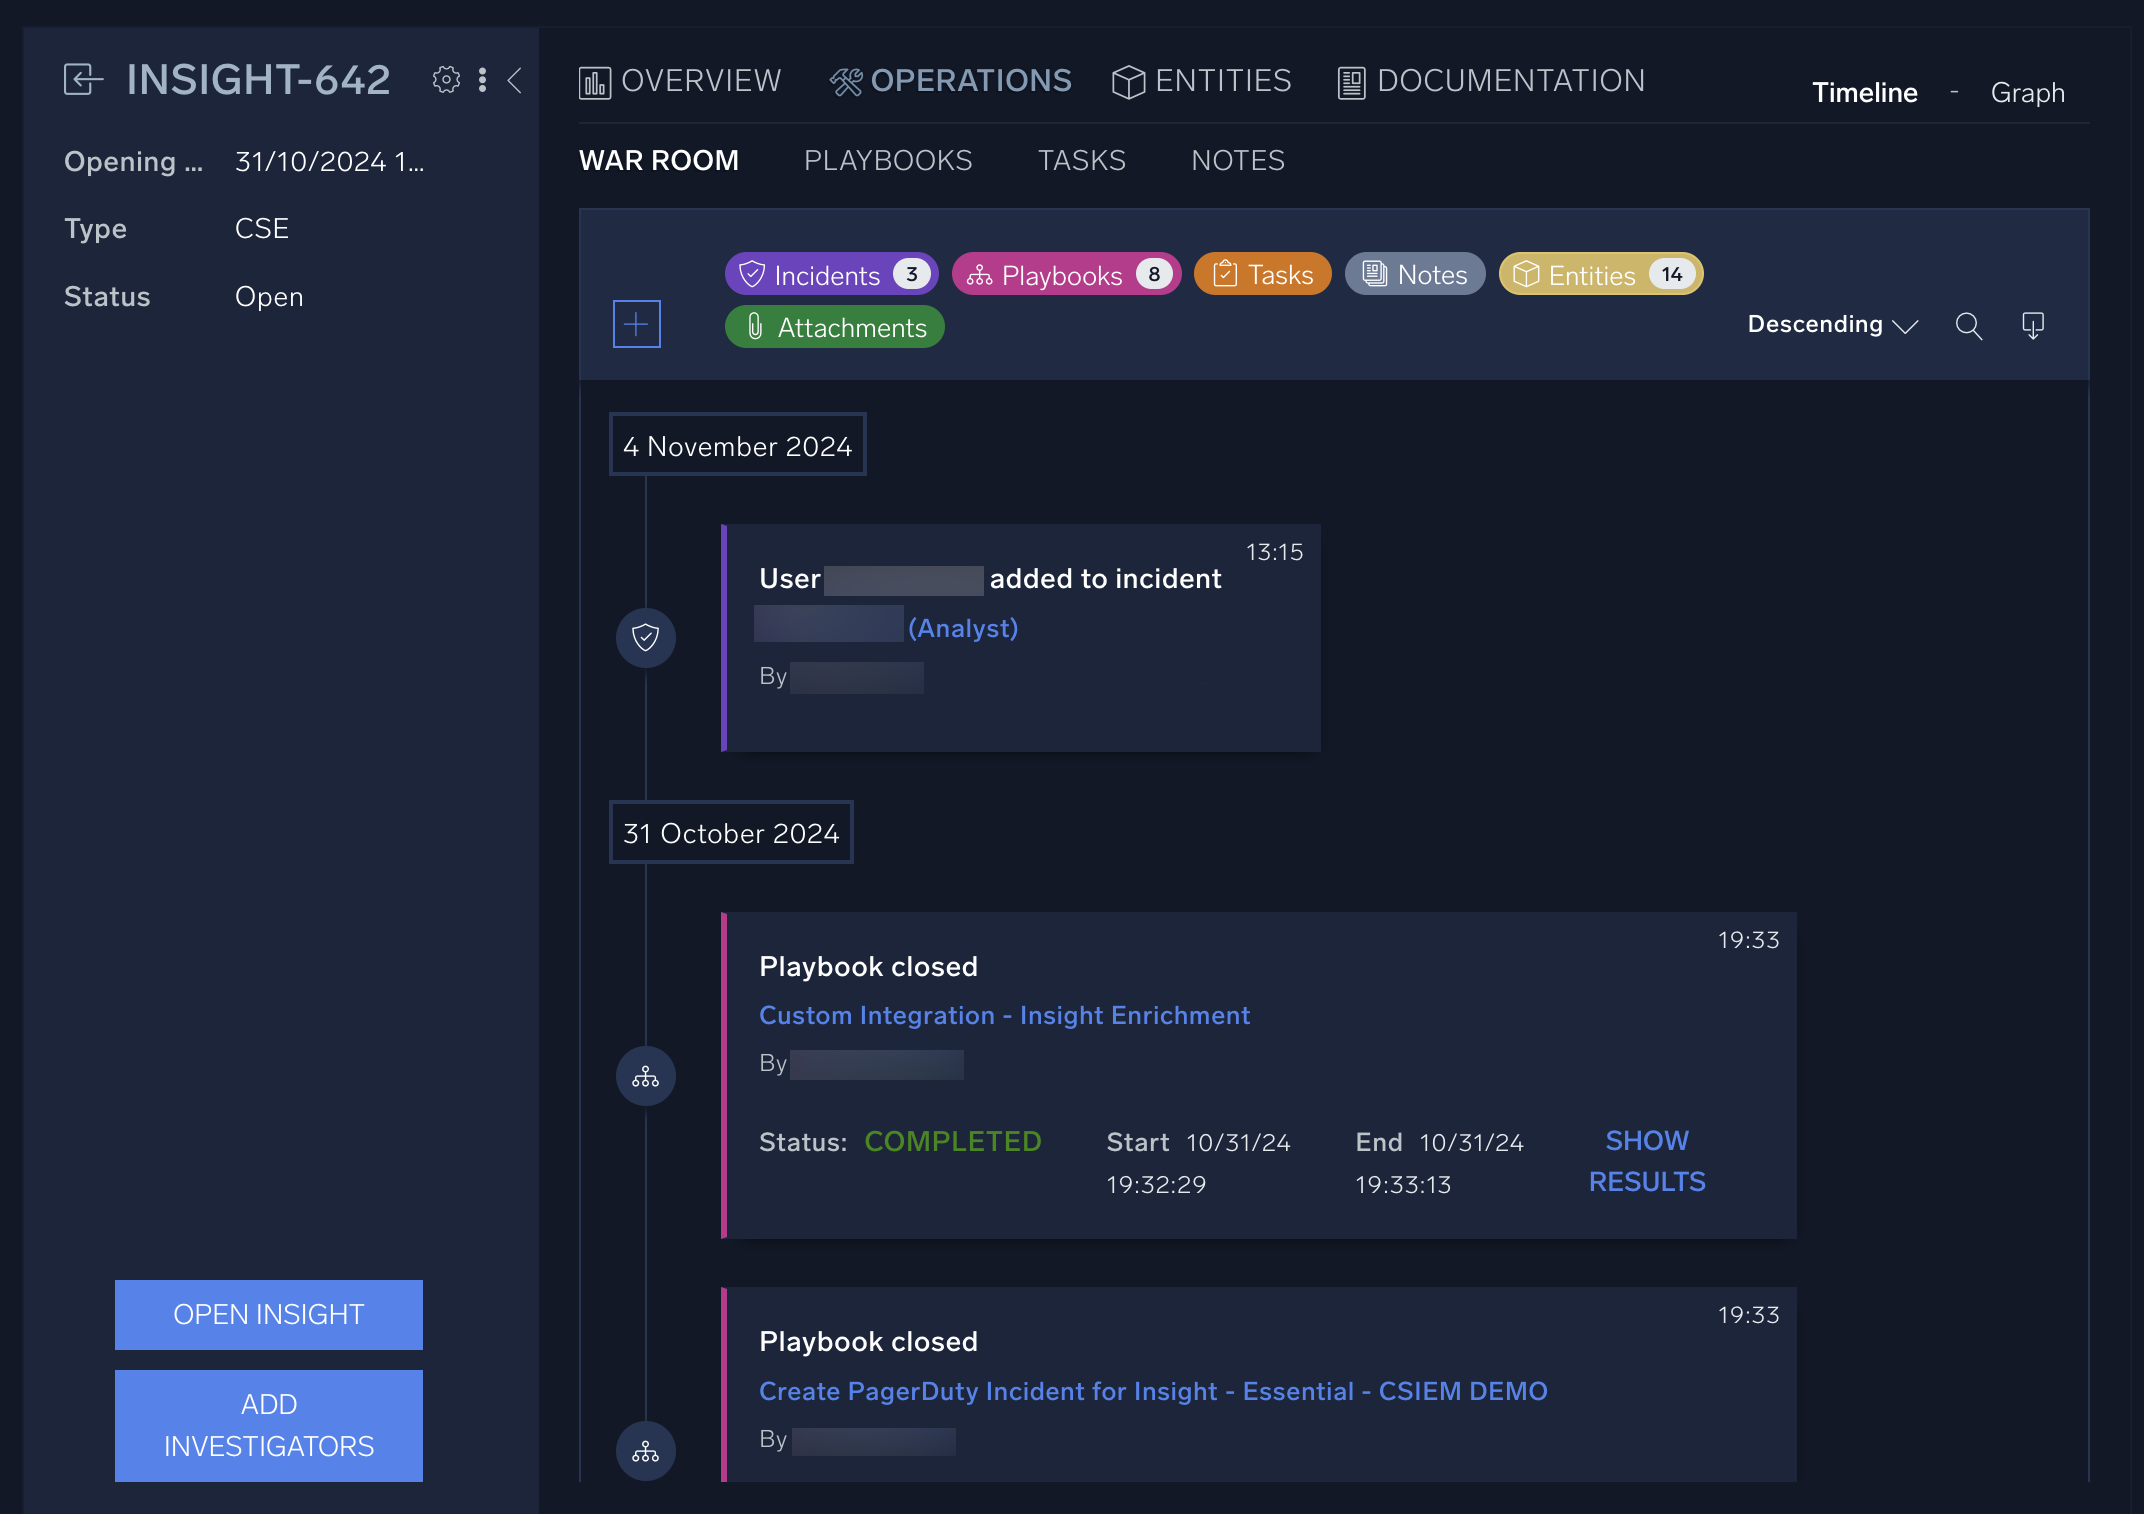
The Operations page is where you’ll find the War Room for an incident, as well as access playbooks, tasks, and notes related to the incident. While you’re investigating and responding to an incident, you’ll likely spend most of your time in the War Room. Cloud SOAR Playbooks will be displayed in the Playbooks sub-section of the Operations tab. From this tab, you can run, kill, edit and check the results of a playbook. Finally, the Tasks and Notes tabs contain notes and to-do lists that are either automatically generated by playbooks or manually created by SOC analysts.
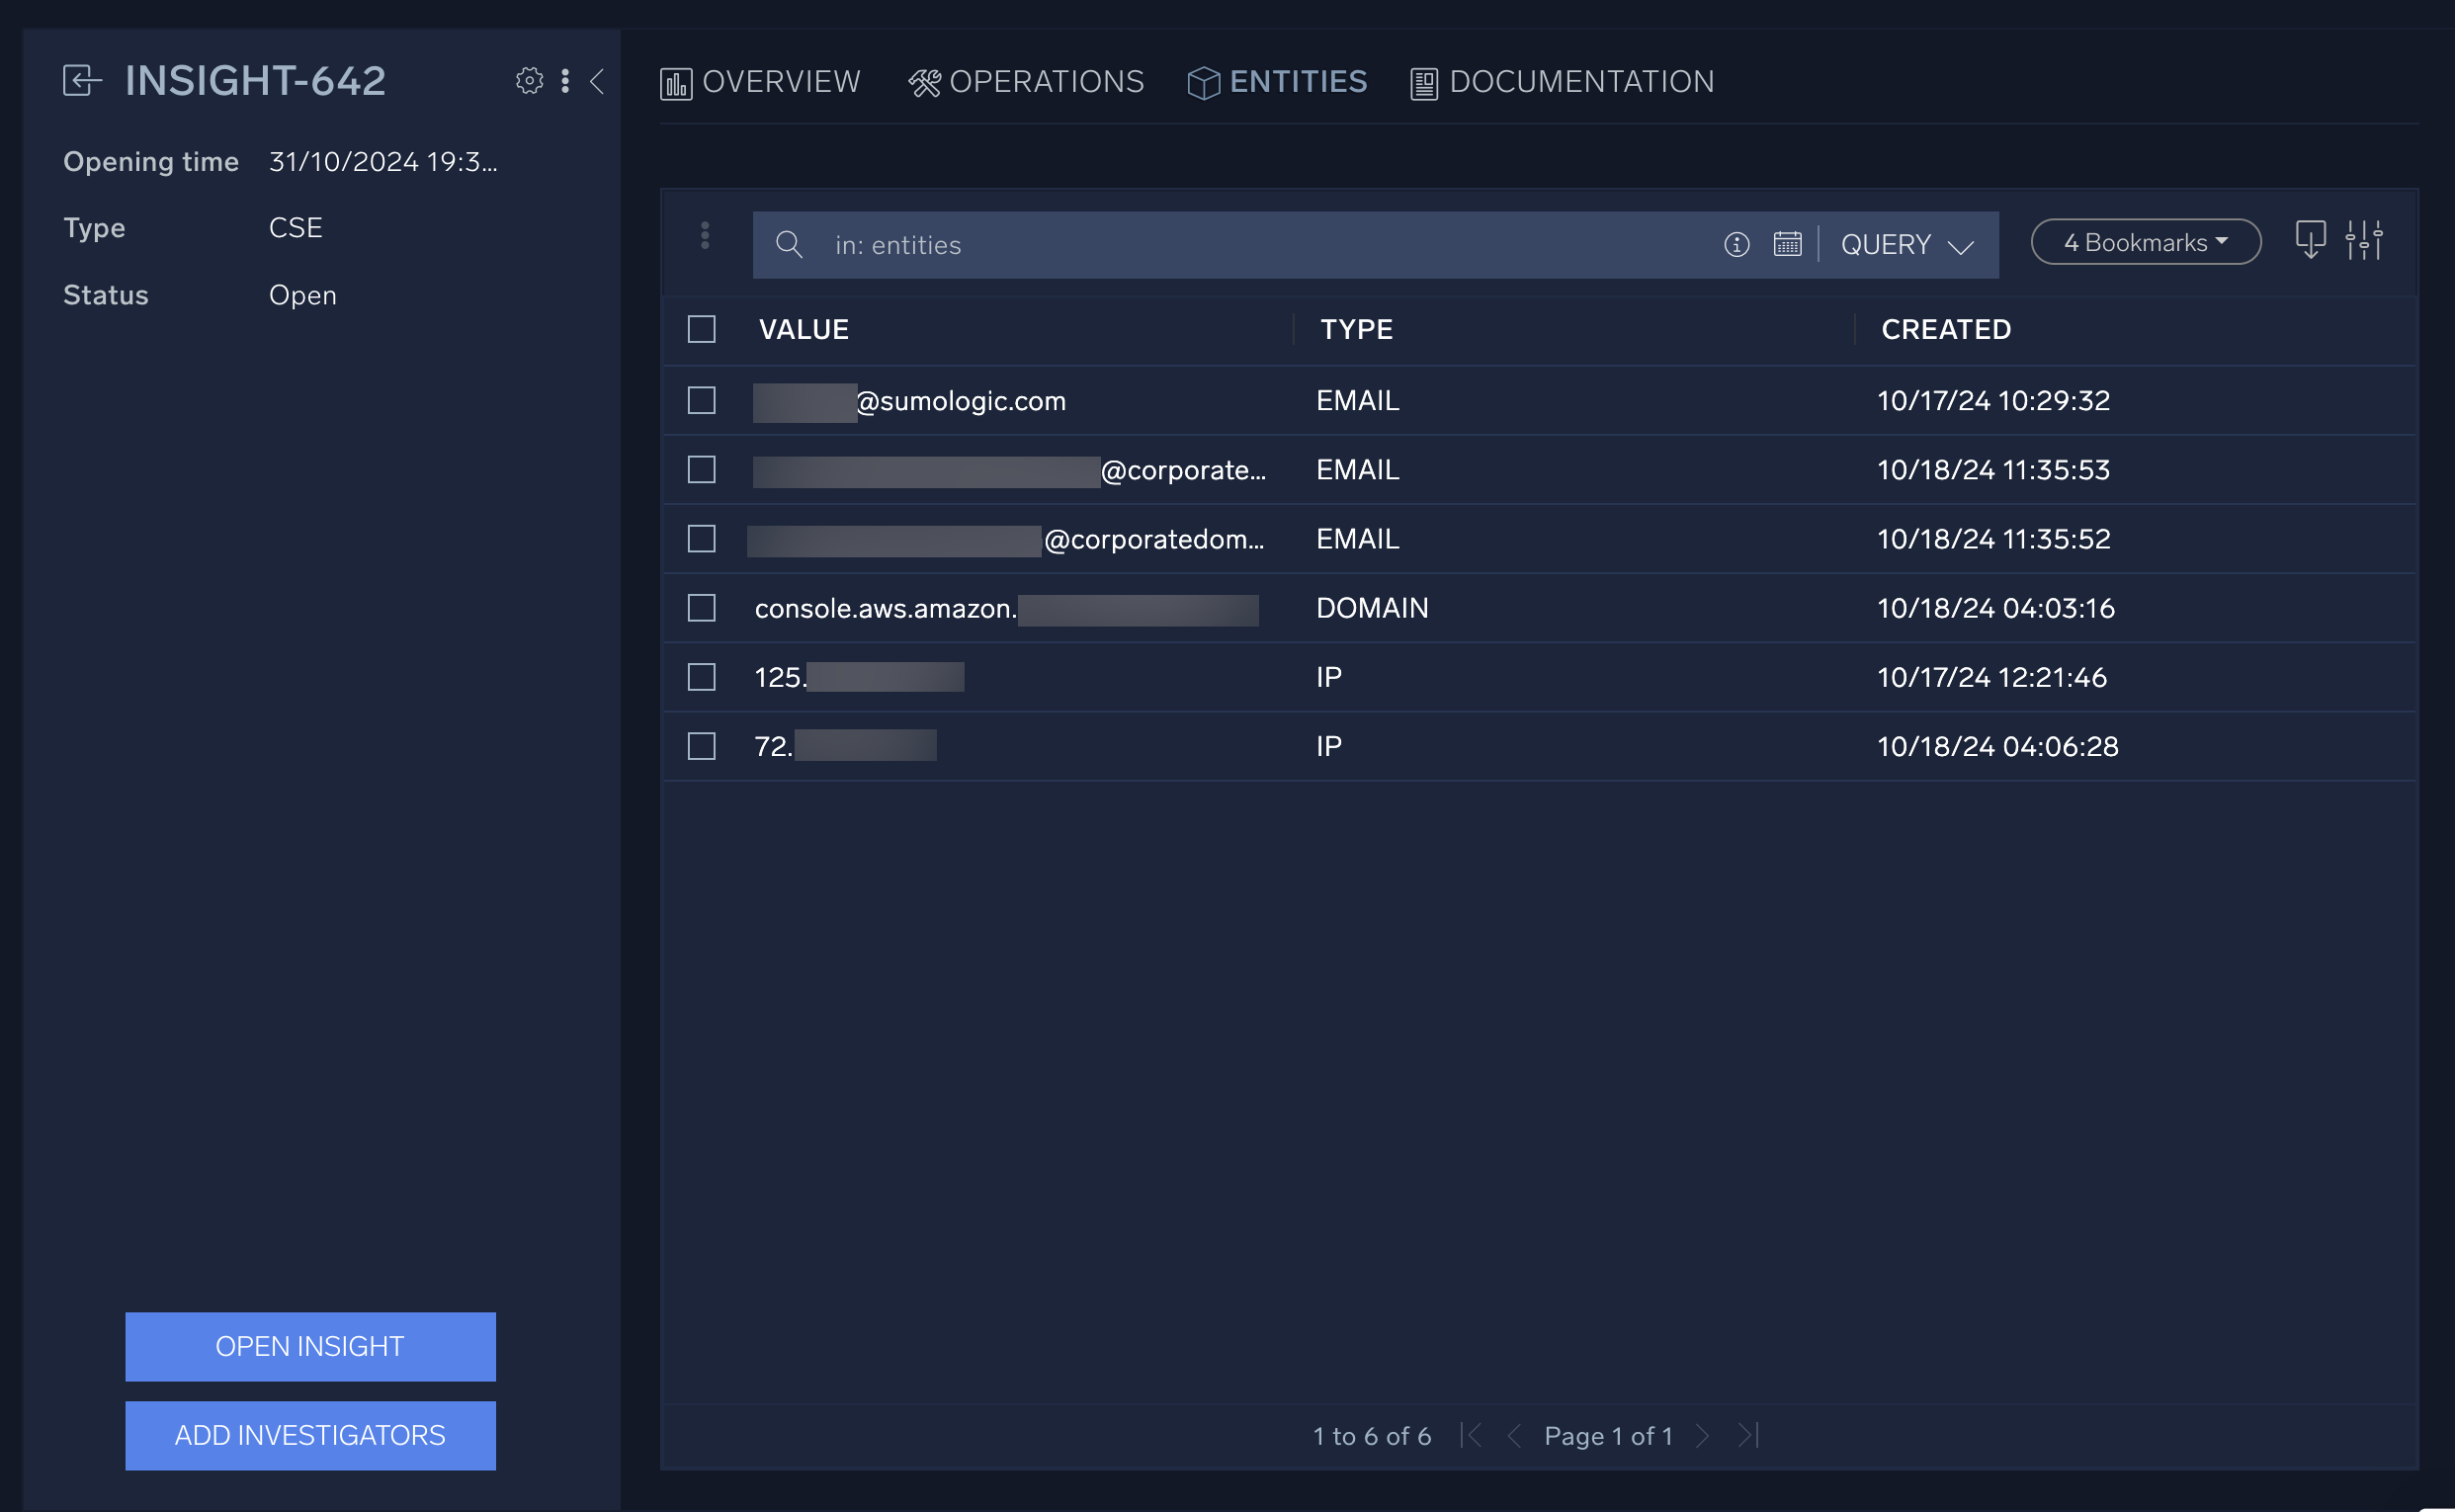
The Entities page contains in-depth information about entities related to the incident. The Documentation page contains any attachments you’ve added and any reports you’ve generated about the incident.
Investigate an incident
In this section, you’ll investigate an incident, gather information, and decide what to do in response to it.
- Navigate to the Incidents page.
New UI. In the main Sumo Logic menu select Cloud SOAR > Incidents. You can also click the Go To... menu at the top of the screen and select Incidents.
Classic UI. In the main Sumo Logic menu select Cloud SOAR, and then select Incidents at the top of the SecOps screen. - Click the column configuration icon in the upper right.

- Make sure Short Description is under the Active column. If it isn’t, click the + next to Short Description in the Available column. Do the same with the Type and Category fields. Then click Apply. You’ll now see a short description based on the MITRE ATT&CK framework of each incident.
- Click any incident with a status of Open.
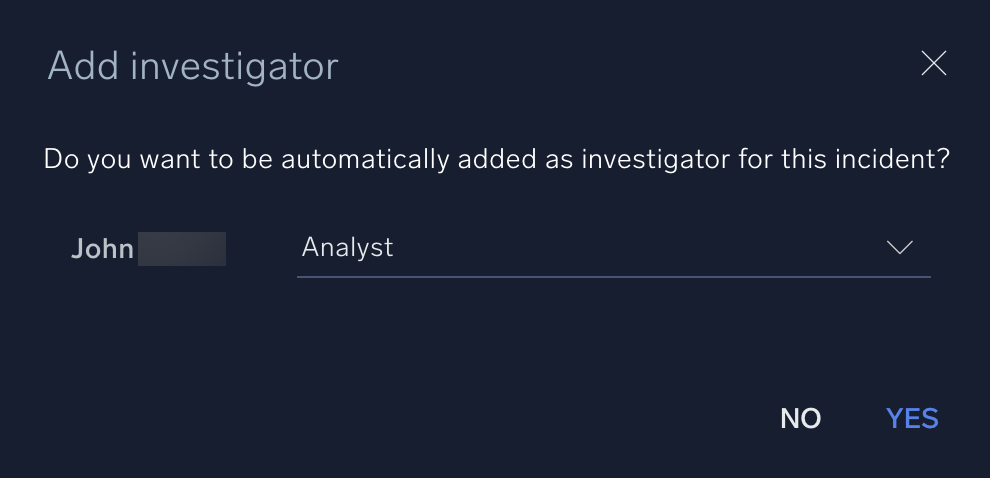
- As you click on the incident, you'll see a popup asking if you want to make yourself the investigator for this incident. Select the role to assign yourself (for example, Analyst), then click Yes to add yourself as an investigator.
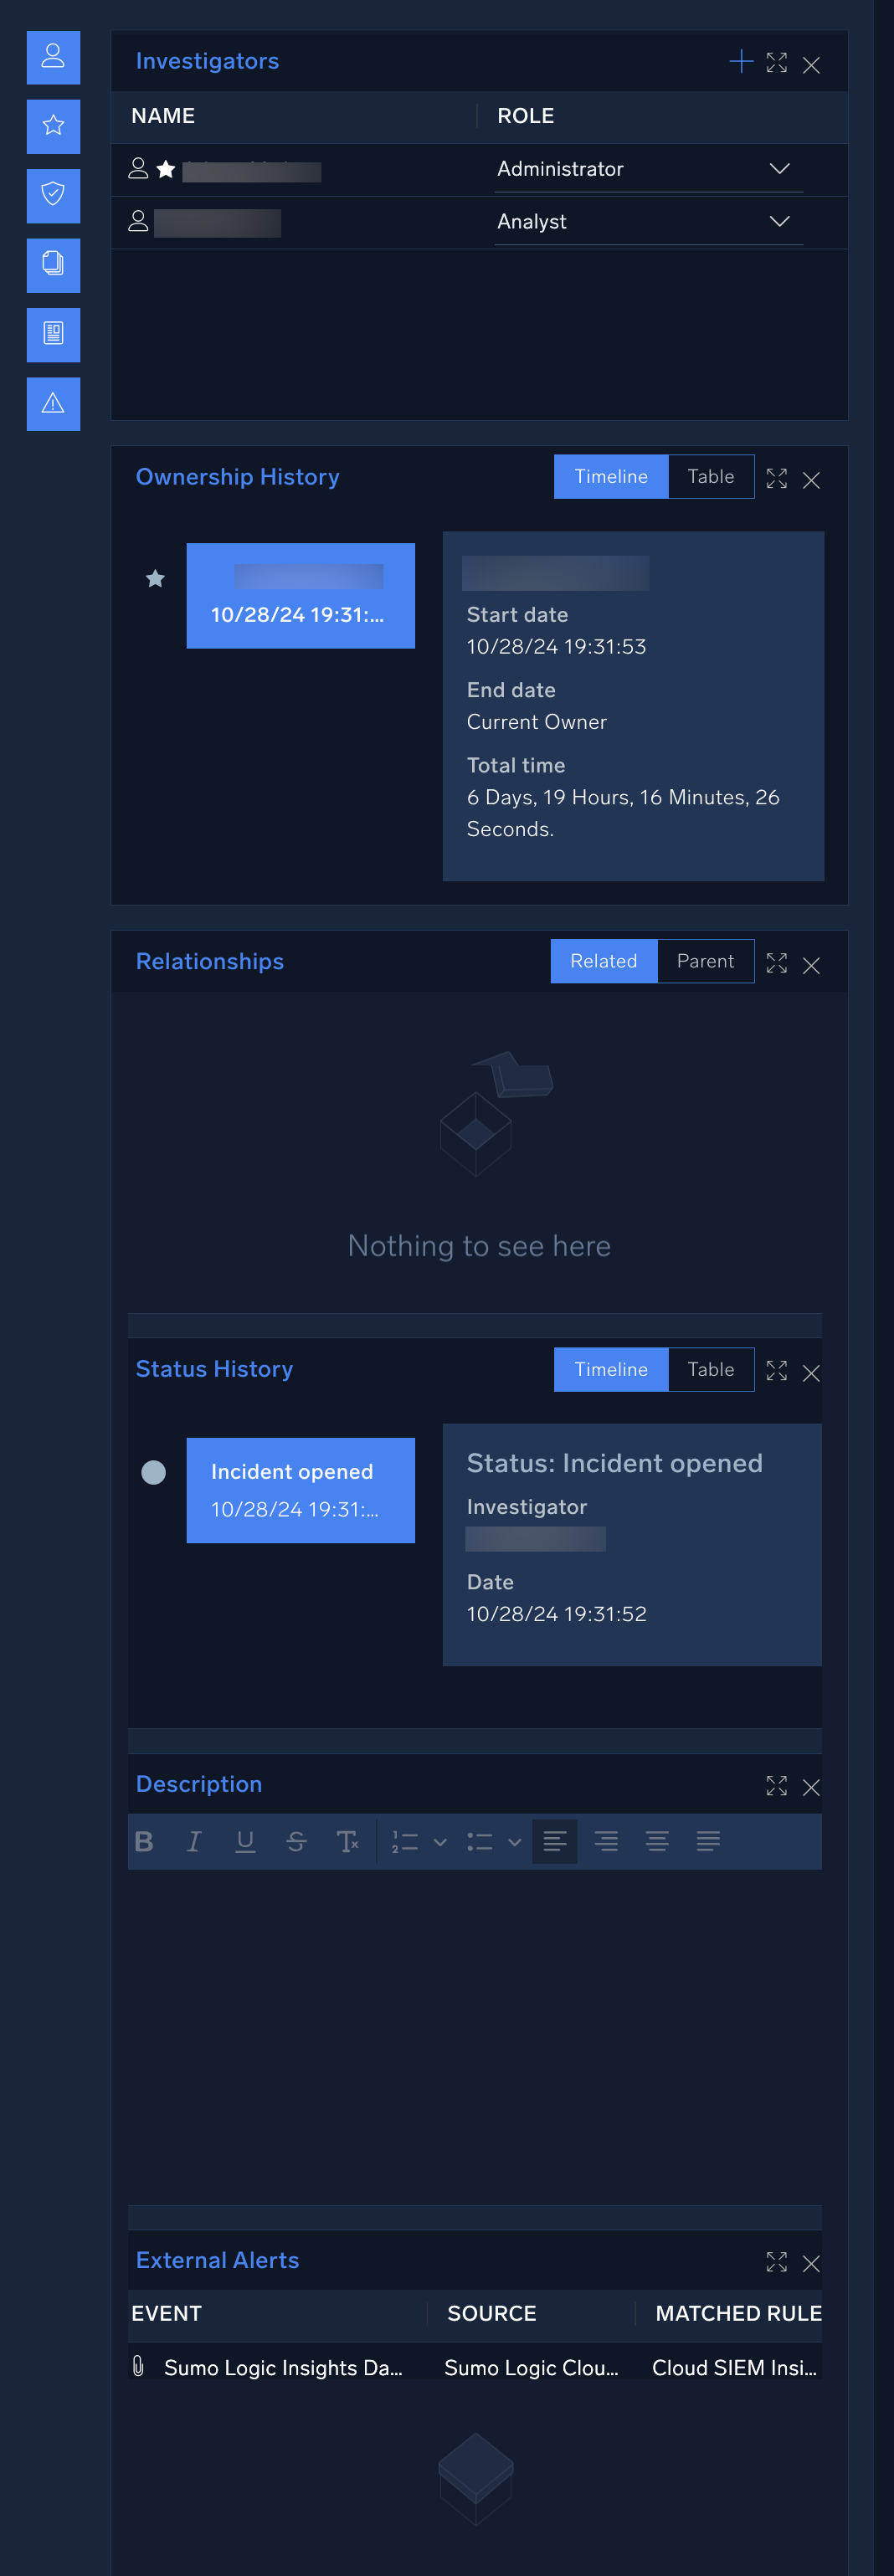
- Click the Overview tab. Here you’ll see basic information about the incident, like the entities involved in the incident and the time the incident was opened. If the incident was imported from Sumo Logic Cloud SIEM, it contains the Cloud SIEM incident ID as well as a short description based on the MITRE ATT&CK framework.
- On the right side of the Overview tab you can open up a sidebar with various widgets showing the list of investigators, ownership history, relationships, incident status history, and/or incident description.
- Click the Operations tab, and click the War Room tab underneath it.
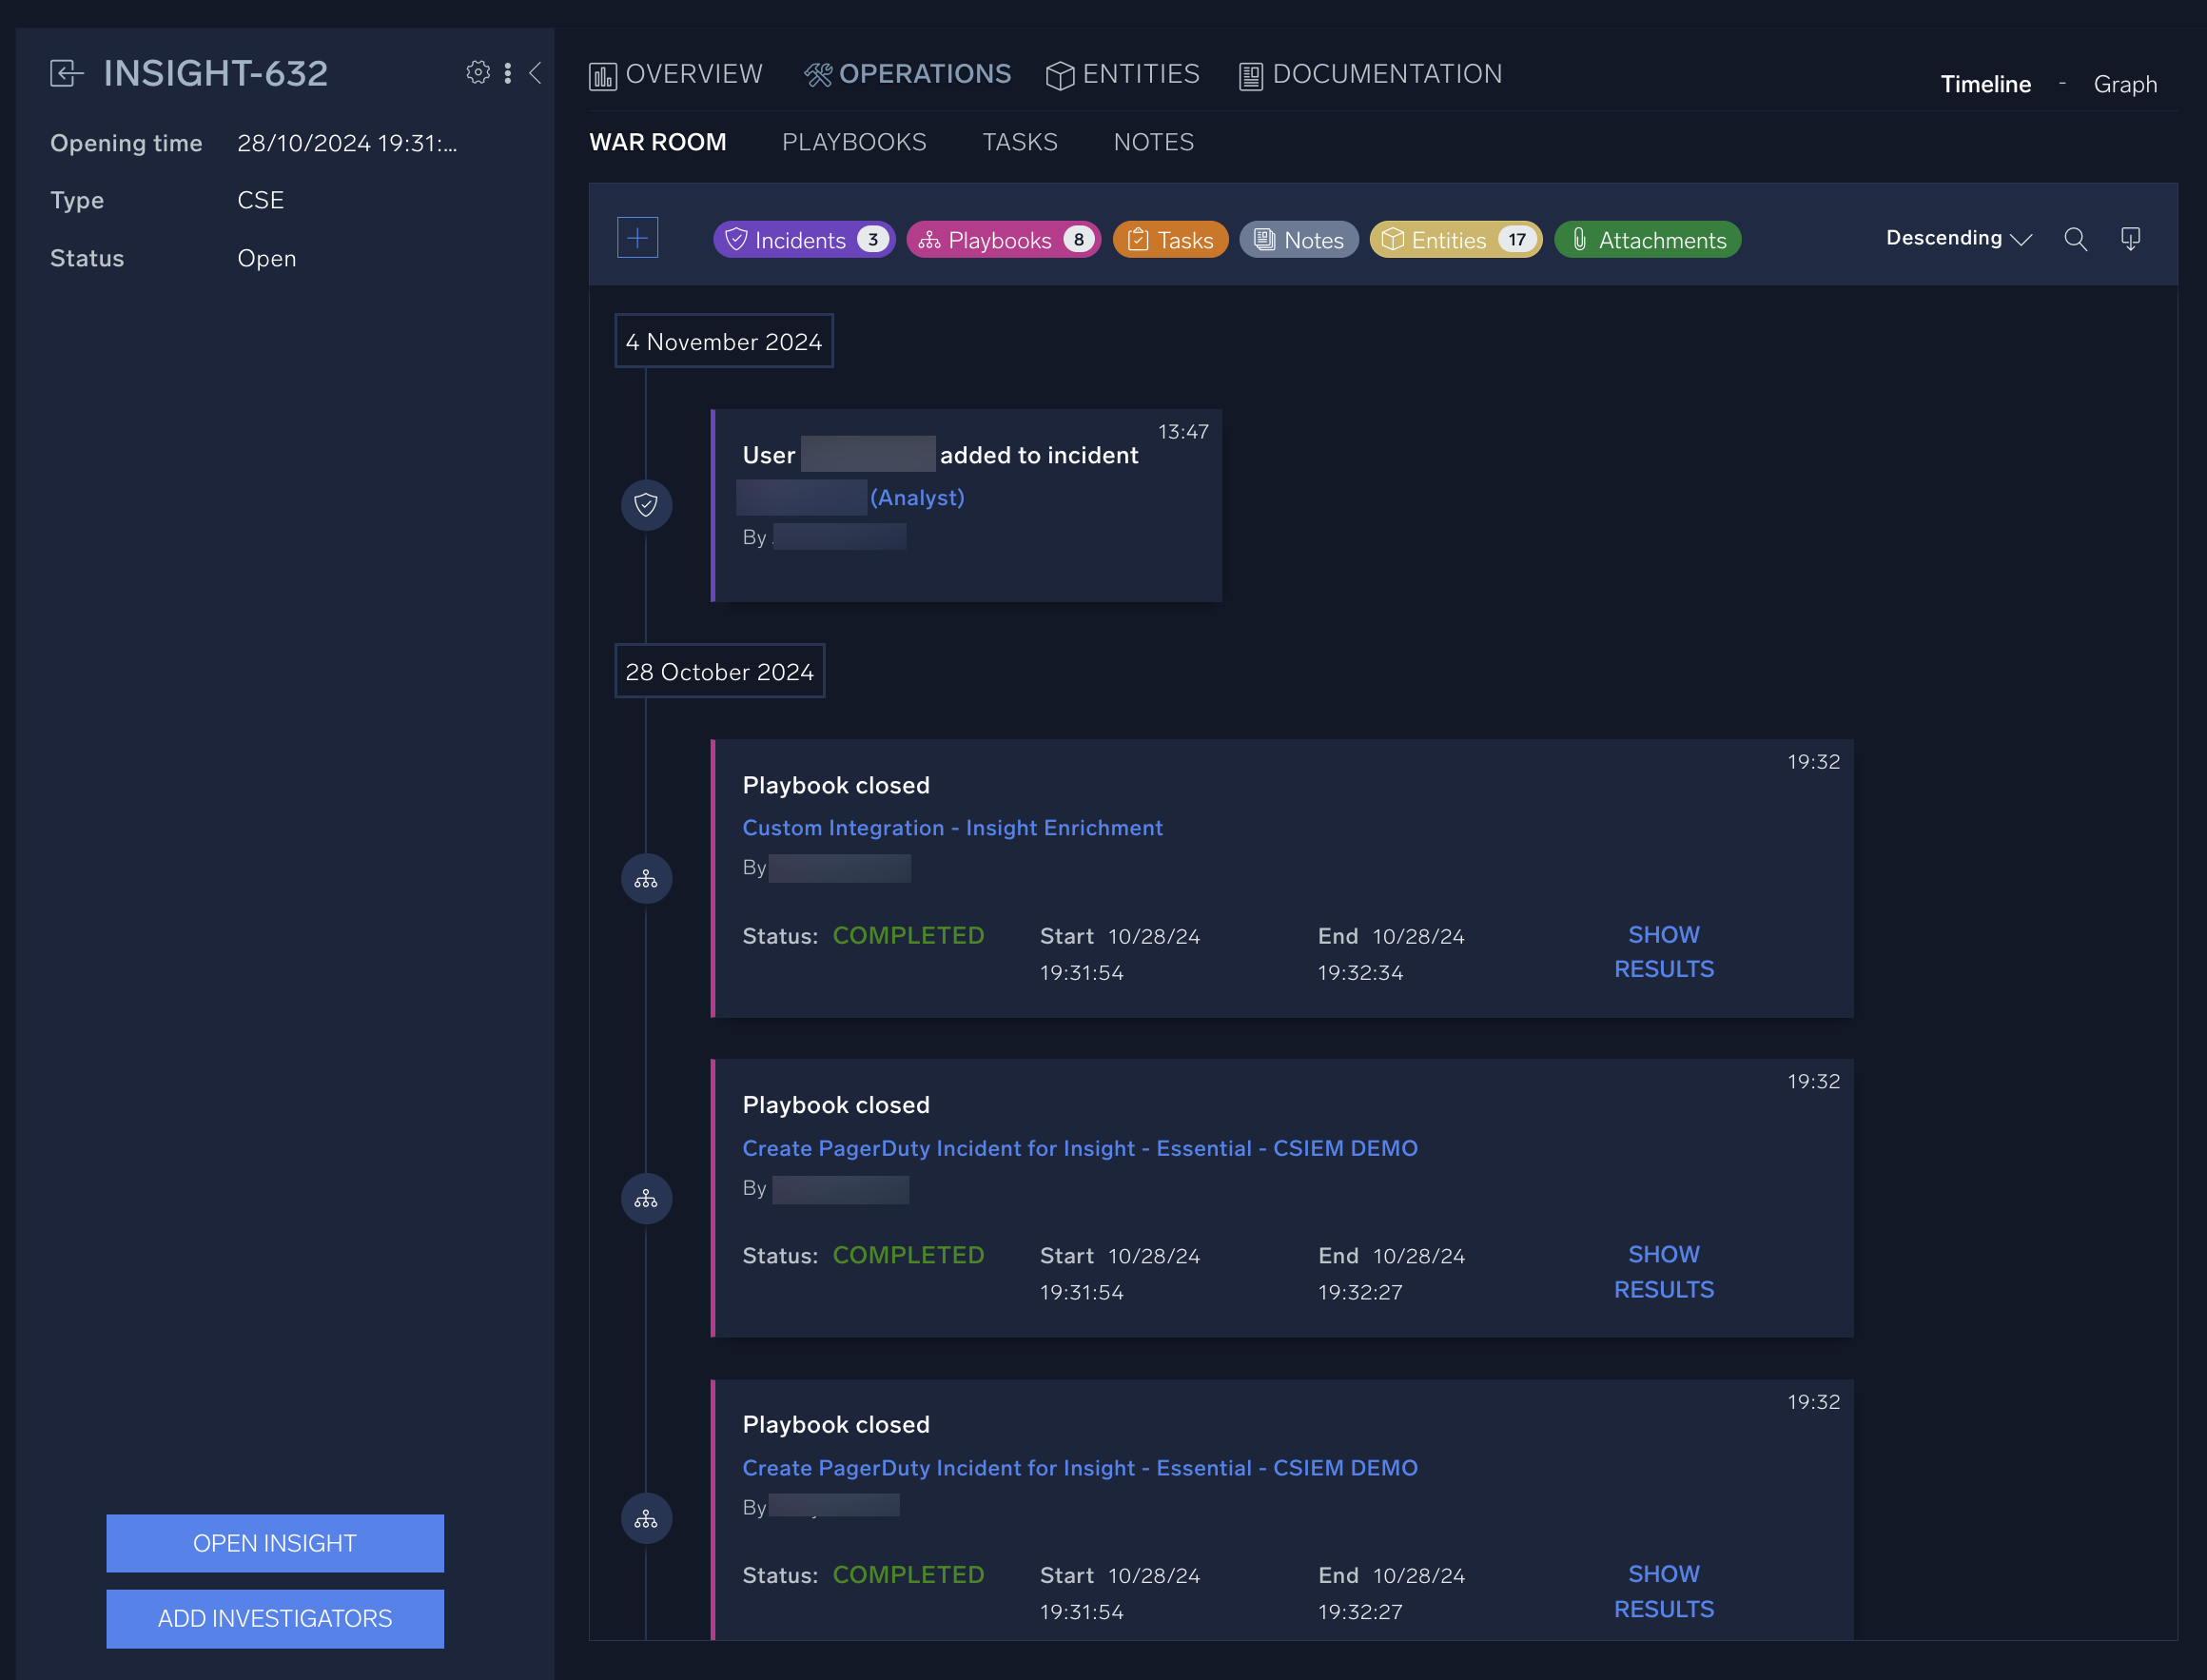
The War Room contains a history of the incident, including any tasks and investigators that have been assigned, playbooks that have been executed, entities that are being tracked, and any other notes or attachments. - Under the Operations tab, click Notes.
- Click the + to add a new note.
- Give your note a title.
- Add a date of creation using the date picker. You can choose today’s date.
- Type a few sentences in the Description field. You can use the summary of the events above, or you can rewrite it in your own words. You can also make suggestions about your next steps.
- Click Create to save your note.
Incident response
What is incident response?
There are six steps to cybersecurity incident response cycle:
- Preparation. Prepare your environment with firewalls, multi-factor authentication, compliant software, and other security measures to prevent attacks.
- Identification. Monitor your systems for indicators of compromise and get alerted when a potential threat happens. Investigate the potential threat and triage it.
- Containment. Reduce further damage by isolating files, machines, and users or by blocking IoCs related to the incident.
- Eradication. Delete malware, phishing emails, or anything else related to the incident.
- Recovery. Use backup files, reinstall software, and get your environment up and running as it was before the incident.
- Lessons Learned. Discuss what worked and what went wrong. Use these findings to prepare better, then start at step 1 again.
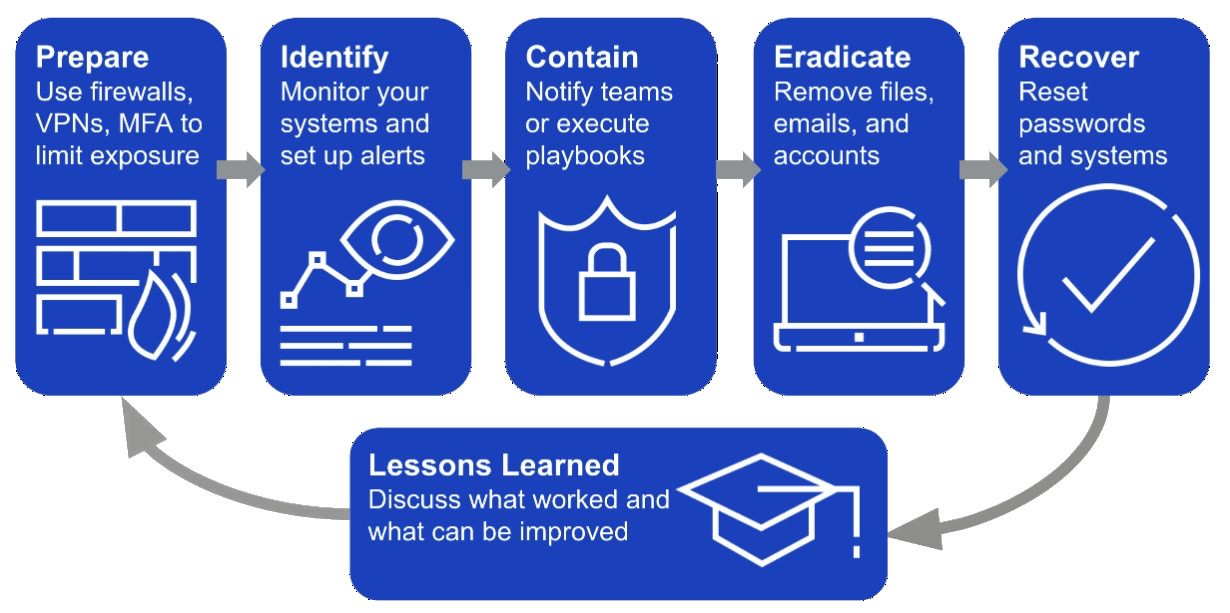
For example, let’s say one of the employees at your company accidentally downloaded some malware onto their laptop, despite your preparation by installing VPNs on all employee machines. Once you have identified the malware, you may want to quarantine the infected laptop but putting it behind a firewall to contain it. You might also want to scan all the laptops in your company for that same malware, and block the IP address that’s the source of the malware download to eradicate the threat. Finally, you’ll need to provision a new laptop for the employee and recover their files. Then, you may need to assign them some cybersecurity training as part of lessons learned.
How can playbooks help with incident response?
The main way to respond to an incident in Cloud SOAR is by executing a playbook. Playbooks are automated, or partially automated, workflows that act based on information from an incident. You typically execute a playbook after you have identified a threat. The playbook will then automatically orchestrate many parts of the investigation, containment, eradication, and recovery processes.
For example, let’s say you identified potential malware on an employee’s computer. First you must investigate to verify that the threat isn’t a false positive, for example by checking the data against an external threat intelligence database. Once the threat is verified, notifications have to be sent to relevant teams through Slack. You then need to contain the threat by quarantining the infected machine with a Palo Alto firewall to block the IP address source of the attack. Containment might also include resetting passwords via an SSO service like Okta. Finally, you can open a Jira ticket to assign the IT department to provision a new laptop to infected users to recover and restore. And finally, you need to open another Jira ticket for the HR department to assign cybersecurity training to the infected employees, as part of lessons learned.
Many of these tasks can be automated through APIs and other integrations. All of these steps can be bundled together in a playbook. We could create a playbook called "Malware Detected" in Cloud SOAR. Then, instead of remembering to do each of these tasks individually, we can simply click "Run" on the playbook, and all the tasks will be done automatically.
Here are some other workflows you could automate with a playbook:
- Phishing. An employee reports suspicious email. A playbook uses threat intel to decide if it’s a phishing attempt. It confirms the employee didn’t click any links, then blocks the malicious email address.
- Brute force. A user gets a request for multi-factor authentication access. When they confirm they weren’t trying to log into their account, a playbook automatically investigates the source of the login attempt and resets the user's password.
- Data exfiltration. If network activity spikes, a playbook automatically investigates to determine whether data is being exfiltrated legitimately. It can prevent the flow of data by applying endpoint patches and increasing firewall security, and chang
Cloud SOAR has hundreds of prebuilt playbooks and templates, so you can quickly and easily automate any of these tasks, or create new custom playbooks to suit your specific business needs. Normally, playbooks are automatically attached to incidents based on information like entities and severity scores.
App Central, custom integrations, and other automations
Cloud SOAR has hundreds of pre-built playbooks which you can use as-is or customize. You can also build your own custom playbooks, which you can learn about in the Cloud SIEM Administration class.
Both pre-built and custom playbooks are simply combinations of various integrations and automations. These integrations can also be used stand-alone rather than as part of a playbook. Typically, an integration in Cloud SOAR contains one or more of these actions:
- Enrichment. Adds information, metadata, or context, such as from a threat intelligence database.
- Containment. Reduces further damage by isolating files or machines related to a threat.
- Daemon. A background process that can ingest data.
- Notification. An alert sent via email, Slack, PagerDuty, or most other services you can connect with an API.
- Custom. Scripts and any other automations you can create using Perl, Python, PowerShell or Bash.
Actions are the building blocks of integrations. You can find many pre-built playbooks, integrations, and automations in Cloud SOAR’s App Central. From App Central, analysts can easily install and deploy a wide variety of automations that leverage these actions.
The Sumo Logic Cloud SOAR team is constantly adding new integrations, playbooks, and use cases to App Central. These playbooks in App Central are only a starting point, however. You can build off of them and create custom playbooks of your own as well.
App Central may not be available to all users. Ask your Cloud SOAR admin if you need access to App Central.
When you open a playbook, you'll see a flowchart like the one below.

- A. Condition. Playbooks can use conditions to fork into different paths. For example, if the threat intelligence enrichments confirm the threat, the fork goes up and the severity is changed to "High". If the enrichments find the threat is a false positive, the fork goes down and the severity is changed to "Low".
- B. Enrichment. Green nodes enrich data. For example, a node could use an integration to check whether an email contains a virus.
- C. Branching. All playbooks have branching paths. Use these arrows to connect different nodes to create your playbook.
- D. Custom. Purple nodes use custom APIs.
- E. Notification. Blue nodes are notifications. They can send alerts or add notes in Cloud SOAR.
You can modify an existing playbook or build one from scratch by dragging and dropping each node in edit mode. Each node is an integration: enrichment, containment, daemon, notification, or custom API.
Respond to an incident
To respond to an incident you investigated previously:
- Navigate to the Incidents page.
New UI. In the main Sumo Logic menu select Cloud SOAR > Incidents. You can also click the Go To... menu at the top of the screen and select Incidents.
Classic UI. In the main Sumo Logic menu select Cloud SOAR, and then select Incidents at the top of the SecOps screen. - Select the incident you want respond to.
- Click the Operations tab, then click Playbooks.
- Click the + icon.

- Search for a playbook to respond to the incident.
You can drag the playbook flowchart around and use scroll to zoom in and out on the different pieces. You can also click each node to find out more about it. Take a moment to explore the playbook and familiarize yourself with it so you know how it will respond to the incident. - Click the checkbox next to the playbook, then click ADD.
- Click Run (play button icon) at the bottom.
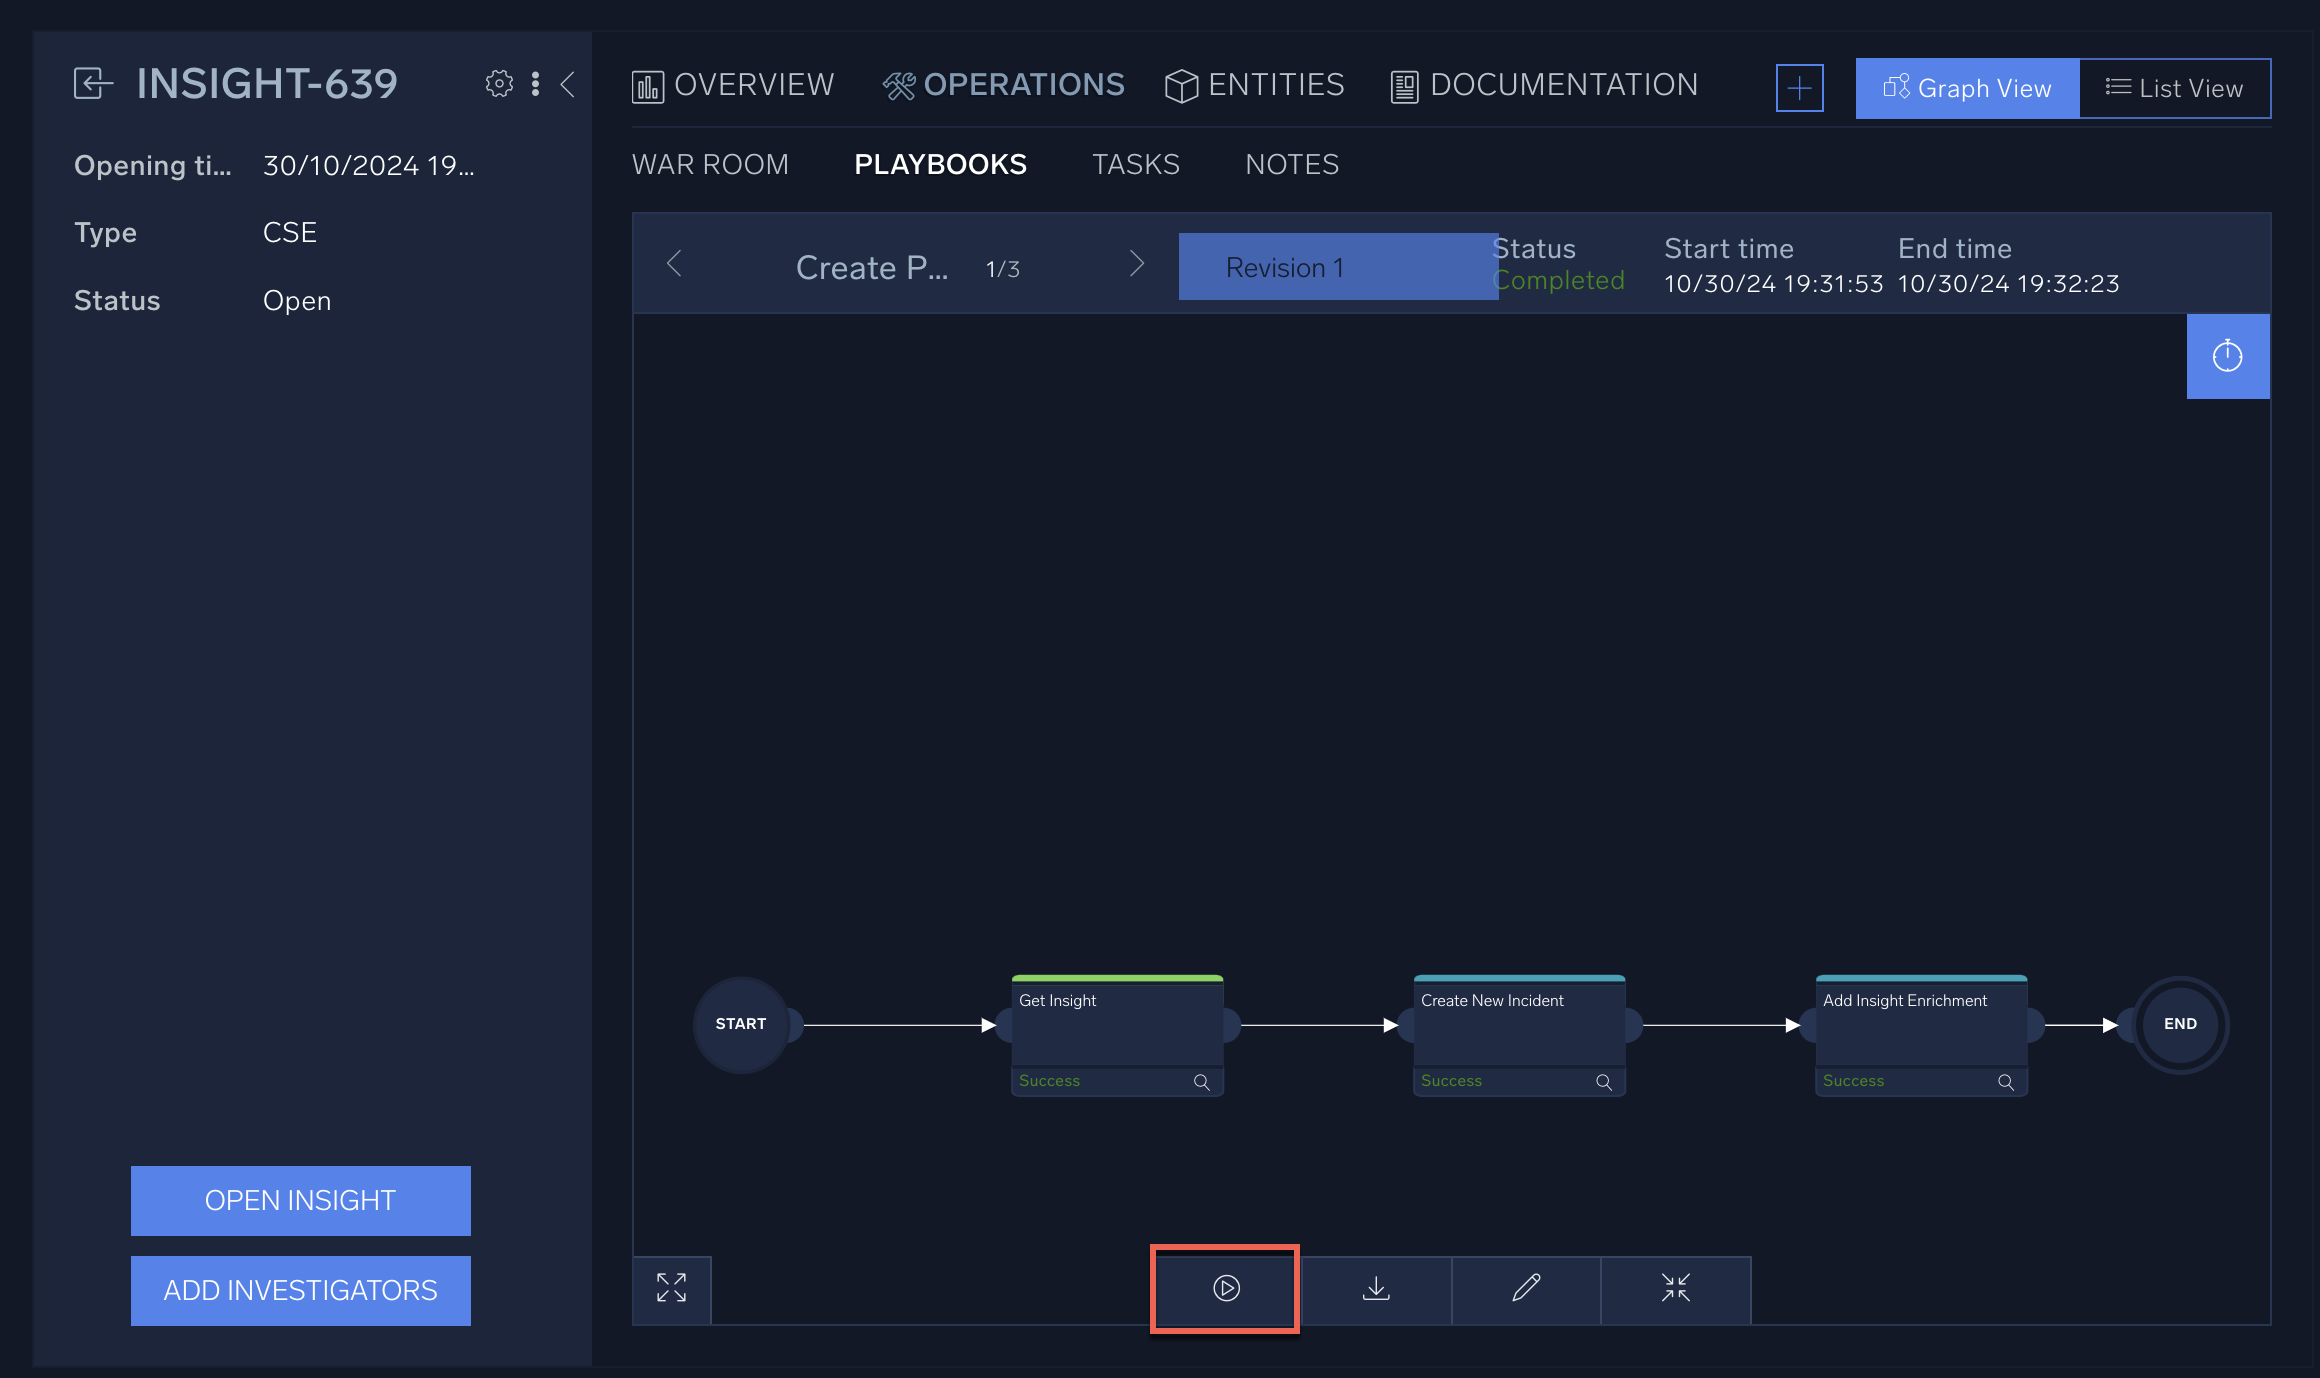
- Watch the playbook run.
The playbook may take several minutes to run. You can track its progress by looking for green Success messages at each step. You can cancel the playbook execution at any time by hitting the Kill button at the bottom. - Verify that the playbook ran successfully.
- Click the Notes tab and add a note about your response to the incident.
Recovery and lessons learned
Cloud SOAR playbooks orchestrate and automate many pieces of the incident response process. But, once you click Run, your job as a SOC analyst isn’t done. It’s important to take time to reflect on the incident and prepare for the next one.
A playbook can find that a threat was a false positive. However, it may have assigned an additional "Review Activity" task to the SOC analyst if a known threat was detected based on threat intelligence databases. This is your opportunity to do the tasks that humans do best. In the case of a phishing attempt, you might want to take the time to talk to the employees who clicked on the malicious links and teach them how to recognize phishing. Depending on the circumstances of the incident, you might need to deploy additional playbooks that can reset passwords or re-provision machines.
Dashboards and reports
In the previous sections, you identified and investigated an incident, executed a playbook, then analyzed the lessons learned before closing the incident.
Now, it’s time to start the incident response cycle over again with preparation and identification. Dashboards and reports help you visualize your environment’s status, prepare for potential threats, identify ongoing incidents, execute threat hunting and threat investigation, reflect on your lessons learned, and report back information to your teams
In order to prepare for the next potential threat, you’ll need to set up alerts and dashboards to monitor your environment. Cloud SOAR offers a number of widgets you can add to your dashboards. Each widget is a graph, chart, table, or other visual representation of your system. Widgets are customizable in their placement, size, and color, and you can create different dashboards for different use cases. For example, you might have one dashboard that shows quarterly, high-level metrics and another that shows daily alerts and triage.
Create a dashboard
In this section, you’ll create and customize a dashboard using widgets.
- Navigate to the Cloud SOAR SecOps page.
New UI. In the main Sumo Logic menu select Cloud SOAR > SecOps & Dashboard. You can also click the Go To... menu at the top of the screen and select SecOps & Dashboard.
Classic UI. In the main Sumo Logic menu select Cloud SOAR. - Near the top left corner, above your user name, click Dashboard.
- Click the + icon in the upper right to create a new dashboard.
- Click on the default dashboard name (Dashboard #) and change the name. Add a description if desired by clicking on the No description available field and adding some text.
- Click the Edit control in the top right corner to enter edit mode.
- Click Public in the sidebar and click on one or more widgets to add the widget to your dashboard. Note that you can drag and place the widget in different places and arrangements on the dashboard screen.
- Click My Widgets in the sidebar and click New to create a new widget.
- In the New Widget dialog, enter a query to find incidents, choose the display type (pie chart, flow chart, text, and so on), choose grouping, and name the widget.
- Click Save in the lower right corner.
- Back on the edit sidebar, click on your new widget to add it to your dashboard. You can rearrange the dashboard by dragging widgets to different locations.
- Click Edit in the upper right to turn off edit mode.
Creating and exporting reports
You can use Cloud SOAR to make Key Performance Indicators (KPI) reports, using the same information as in your dashboards. Like dashboards, you can use existing widgets to customize the content and structure of your report.
You can use KPI reports to aggregate incidents that satisfy certain conditions. For example, you could create reports like:
- Incidents from the last month
- Phishing incidents in the last year
- Incidents with severity "High"
- Open incidents assigned to a specific user
- Malware incidents from a specific month
You can get creative with filters and create any kind of report you like.
Best practices for dashboards and reports
There are several considerations when designing a dashboard or report. Here are a few best practices:
- Above the fold. In print newspapers, the most important articles are placed "above the fold," which means the top half of the front page. When designing a dashboard or report, place the most important information at the top, so people will see it right away without needing to scroll.
- Choose a theme. Organize your dashboards and reports around a theme, such as the role of the person viewing it or its place in your workflows. For example, a threat hunting dashboard would look very different from a quarterly summary dashboard. Likewise, the information that’s interesting to an analyst is likely different from what interests a CEO.
- Customize for ease of use. Using common color schemes, such as red for critical alerts and green for "all good", is generally a better idea than getting too creative. You can also use a combination of color and shape to represent an idea rather than just color alone. A "warning" shape like a triangle with an exclamation point is easy to see at a glance, and is still usable by people who are colorblind.
- Share cautiously. Be careful who has permission to view and edit your dashboards and reports. These dashboards and reports may have sensitive information.
Create and export a report
You can use Cloud SOAR to make downloadable reports, using the same information as in your dashboards. Like dashboards, you can use existing widgets to customize the content and structure of your report. In this section, you’ll create and export a report in this way.
- New UI. In the main Sumo Logic menu, select Cloud SOAR > Report. You can also click the Go To... menu at the top of the screen and select Report.
Classic UI. Click the gear icon in the top right and select Report.
 - In the report view, you'll have a blank page view and a sidebar on the right with the available widgets (similar to the dashboard edit view).
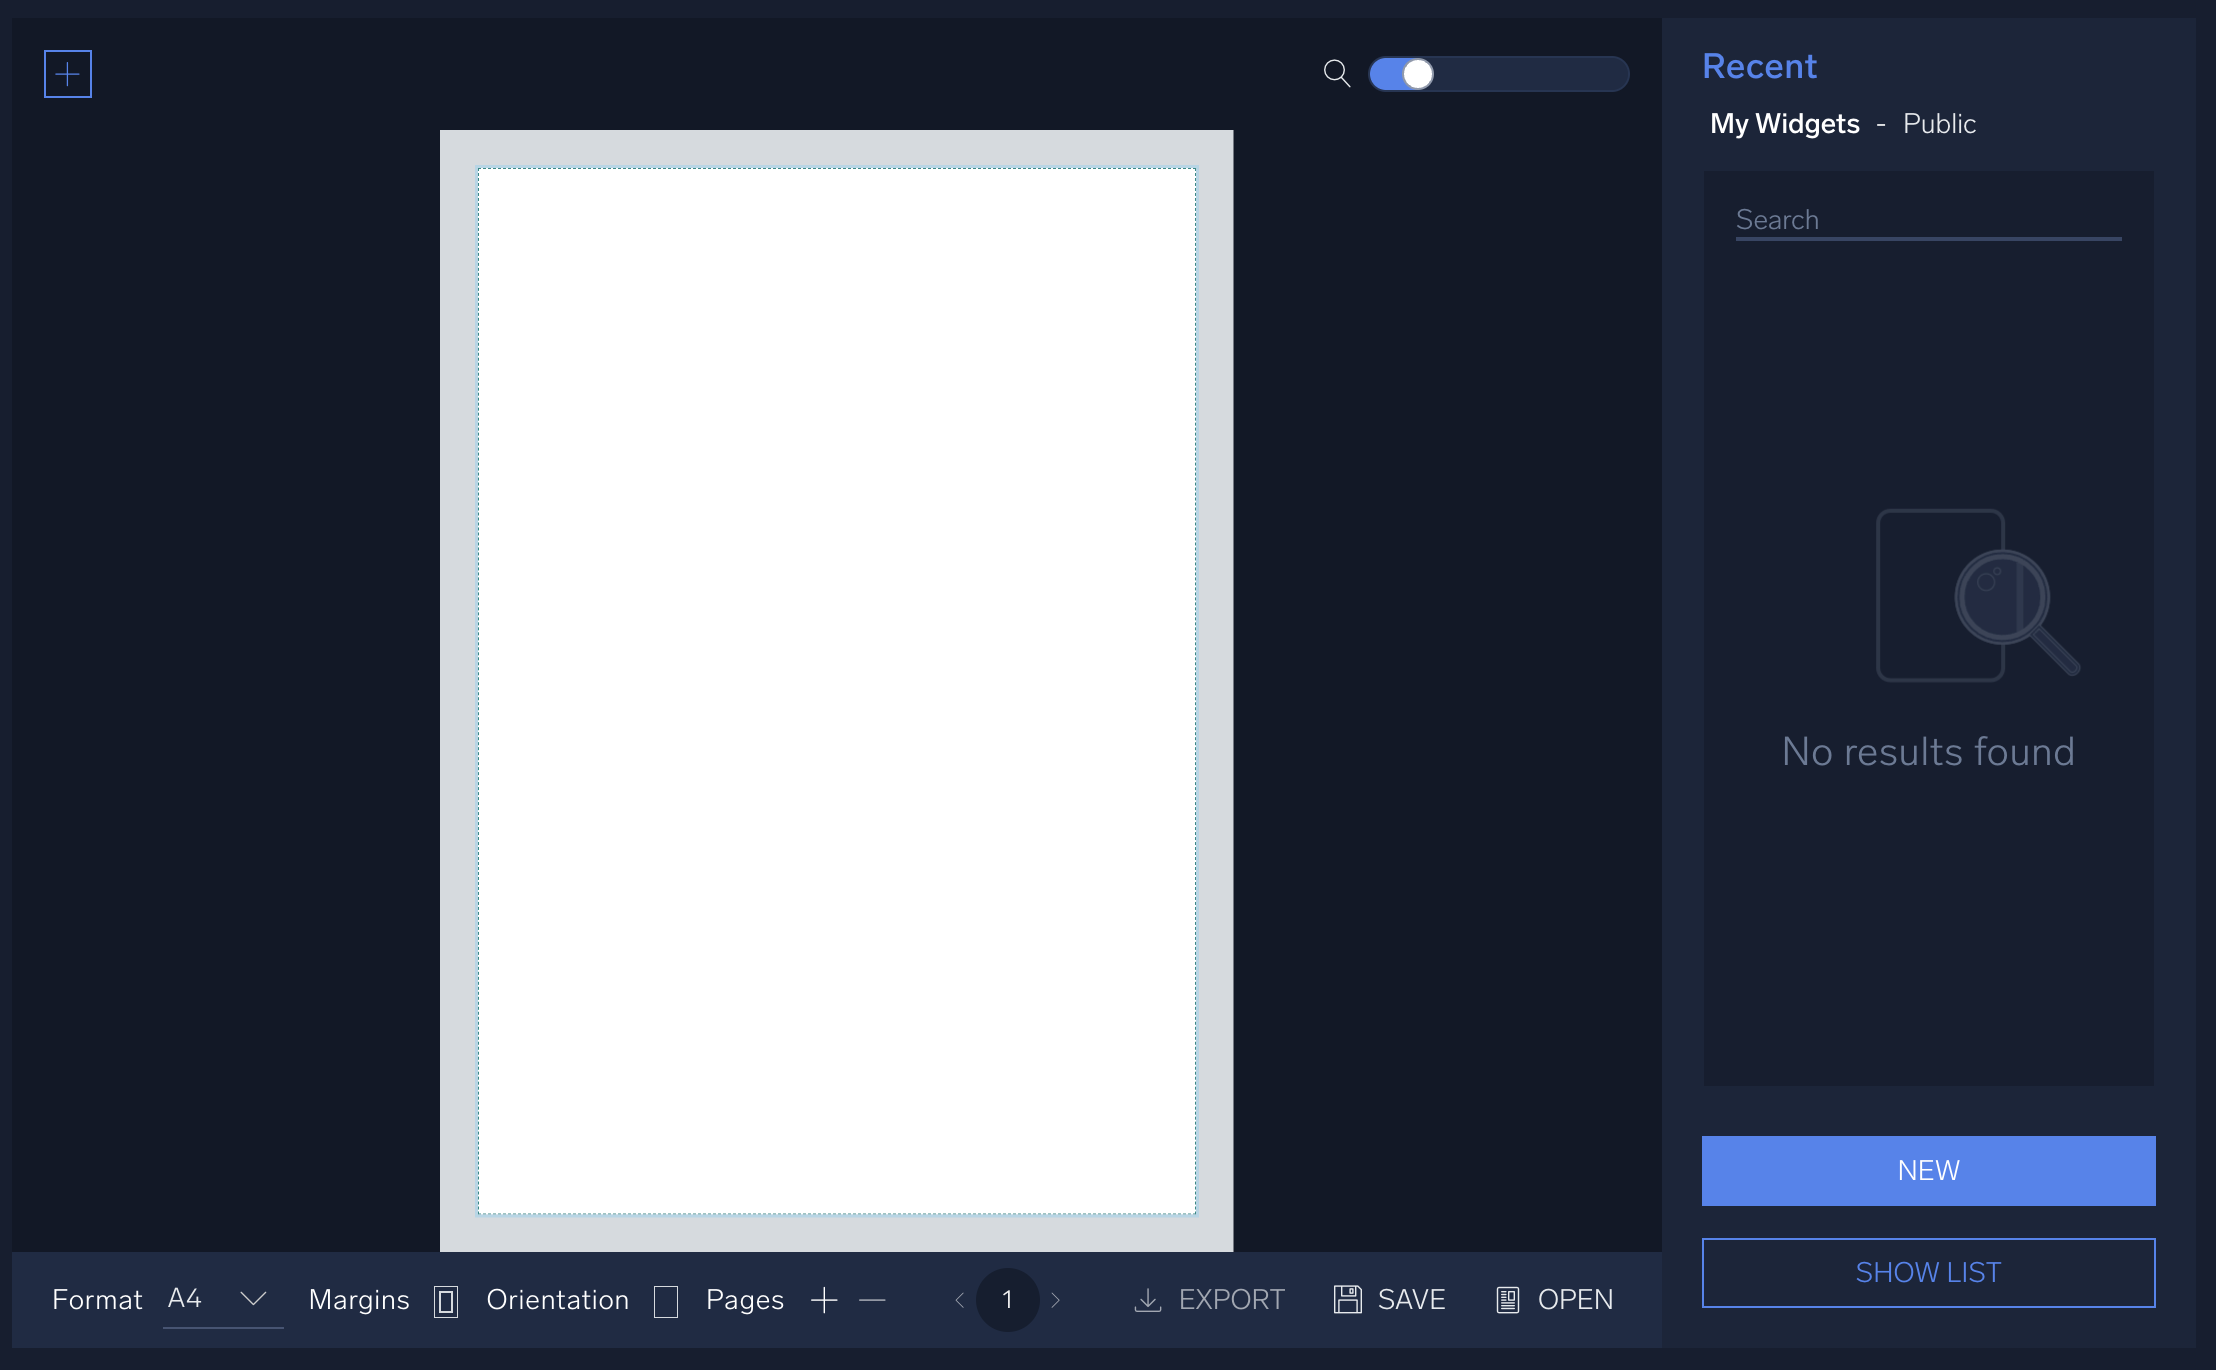
- Click on one or more of the available widgets to add them to the report. (You can create new widgets using the same process as in the previous section about creating a dashboard).
- Click Save when you've finished designing your report.
- After saving your report, click Export at the bottom of the page to download your report in PDF form.
Introduction to Cloud SOAR for administrators
What is Cloud SOAR administration?
Broadly speaking, Security Orchestration Automation and Response (SOAR) is a collection of scripts, APIs, playbooks, daemons, threat intelligence databases, dashboards, and other tools. As a Cloud SOAR administrator, you’ll be focusing on a few areas in particular:
- Role-based access controls. Admins can create different roles and user groups with different levels of edit and view access to various areas within Cloud SOAR.
- Dashboards and reports. Admins manage the default settings, create templates, and configure the look and feel of Cloud SOAR dashboards and reports for their organization.
- Playbooks and automations. Admins configure and manage the playbooks, automations, integrations, and tasks in Cloud SOAR. This requires access keys and knowledge of APIs.
Administrators configure these and other settings to help SOC analysts automate and orchestrate many processes that are a routine part of responding to security incidents. Playbook automation offloads many tedious and repetitive tasks from the SOC team, reducing response time and allowing SOC analysts to focus on other mission-critical tasks. Dashboards and reports help distribute knowledge to different teams to work together to orchestrate their response in a timely, synchronized manner. RBAC ensures that only authorized members of your SOC team can perform certain actions.
The incident response cycle
As a Cloud SOAR administrator, your task is to set up RBAC controls, configure settings, create templates, and use APIs. Your ultimate goal is to enable Cloud SOAR to automate and orchestrate many parts of the incident response cycle. The more tasks you can automate with Cloud SOAR, the more time the SOC analysts on your team can devote to other activities like threat hunting.
Let’s briefly review the incident response cycle:
- Preparation. Prepare your environment with firewalls, multi-factor authentication, compliant software, and other security measures to prevent attacks.
- Identification. Monitor your systems for indicators of compromise (IoCs) and get alerted when a potential threat happens. Investigate the potential threat and triage it.
- Containment. Isolate affected machines, files, and users, and block IoCs related to the incident to prevent problems from spreading.
- Eradication. Delete malware, phishing emails, or anything else related to the incident.
- Recovery. Use backup files, reinstall software, and get your environment up and running as it was before the incident.
- Lessons Learned. Discuss what worked and what went wrong. Use these findings to prepare better, then start at step 1 again.

How can Sumo Logic Cloud SOAR help?
Let’s say one of the employees at your company accidentally downloaded some malware onto their laptop, despite your preparation by installing VPNs and firewalls on all employee machines. Once you have identified the malware, you must investigate to verify that the threat isn’t a false positive, for example by checking the data against an external threat intelligence database like CrowdStrike or VirusTotal. You may want to quarantine the infected laptop by putting it behind a firewall to contain it. Containment might also include resetting passwords via an SSO service like Okta. You might also want to scan all the laptops in your company for that same malware, and block the IP address that’s the source of the malware download to eradicate the threat. Then, you can open a Jira ticket to assign the IT department to provision a new laptop to infected users to recover and restore. And finally, you need to open another Jira ticket for the HR department to assign cybersecurity training to the infected employees, as part of lessons learned.
Many of these tasks, from identifying malware to restoring the system, can be automated through APIs and other integrations. All of these steps can be bundled together in a playbook. We could create a playbook called “Malware Detected” in Cloud SOAR. Then, instead of remembering to do each of these tasks individually, we can simply click “Execute” on the playbook, and all the tasks will be done automatically. We can even use Cloud SOAR to export a report after the incident is closed, and use that report to jumpstart the lessons learned discussion.
Exploring Cloud SOAR settings for administrators
Cloud SOAR administrators have privileged access to the Settings and Automation sections of the Cloud SOAR UI.
General settings
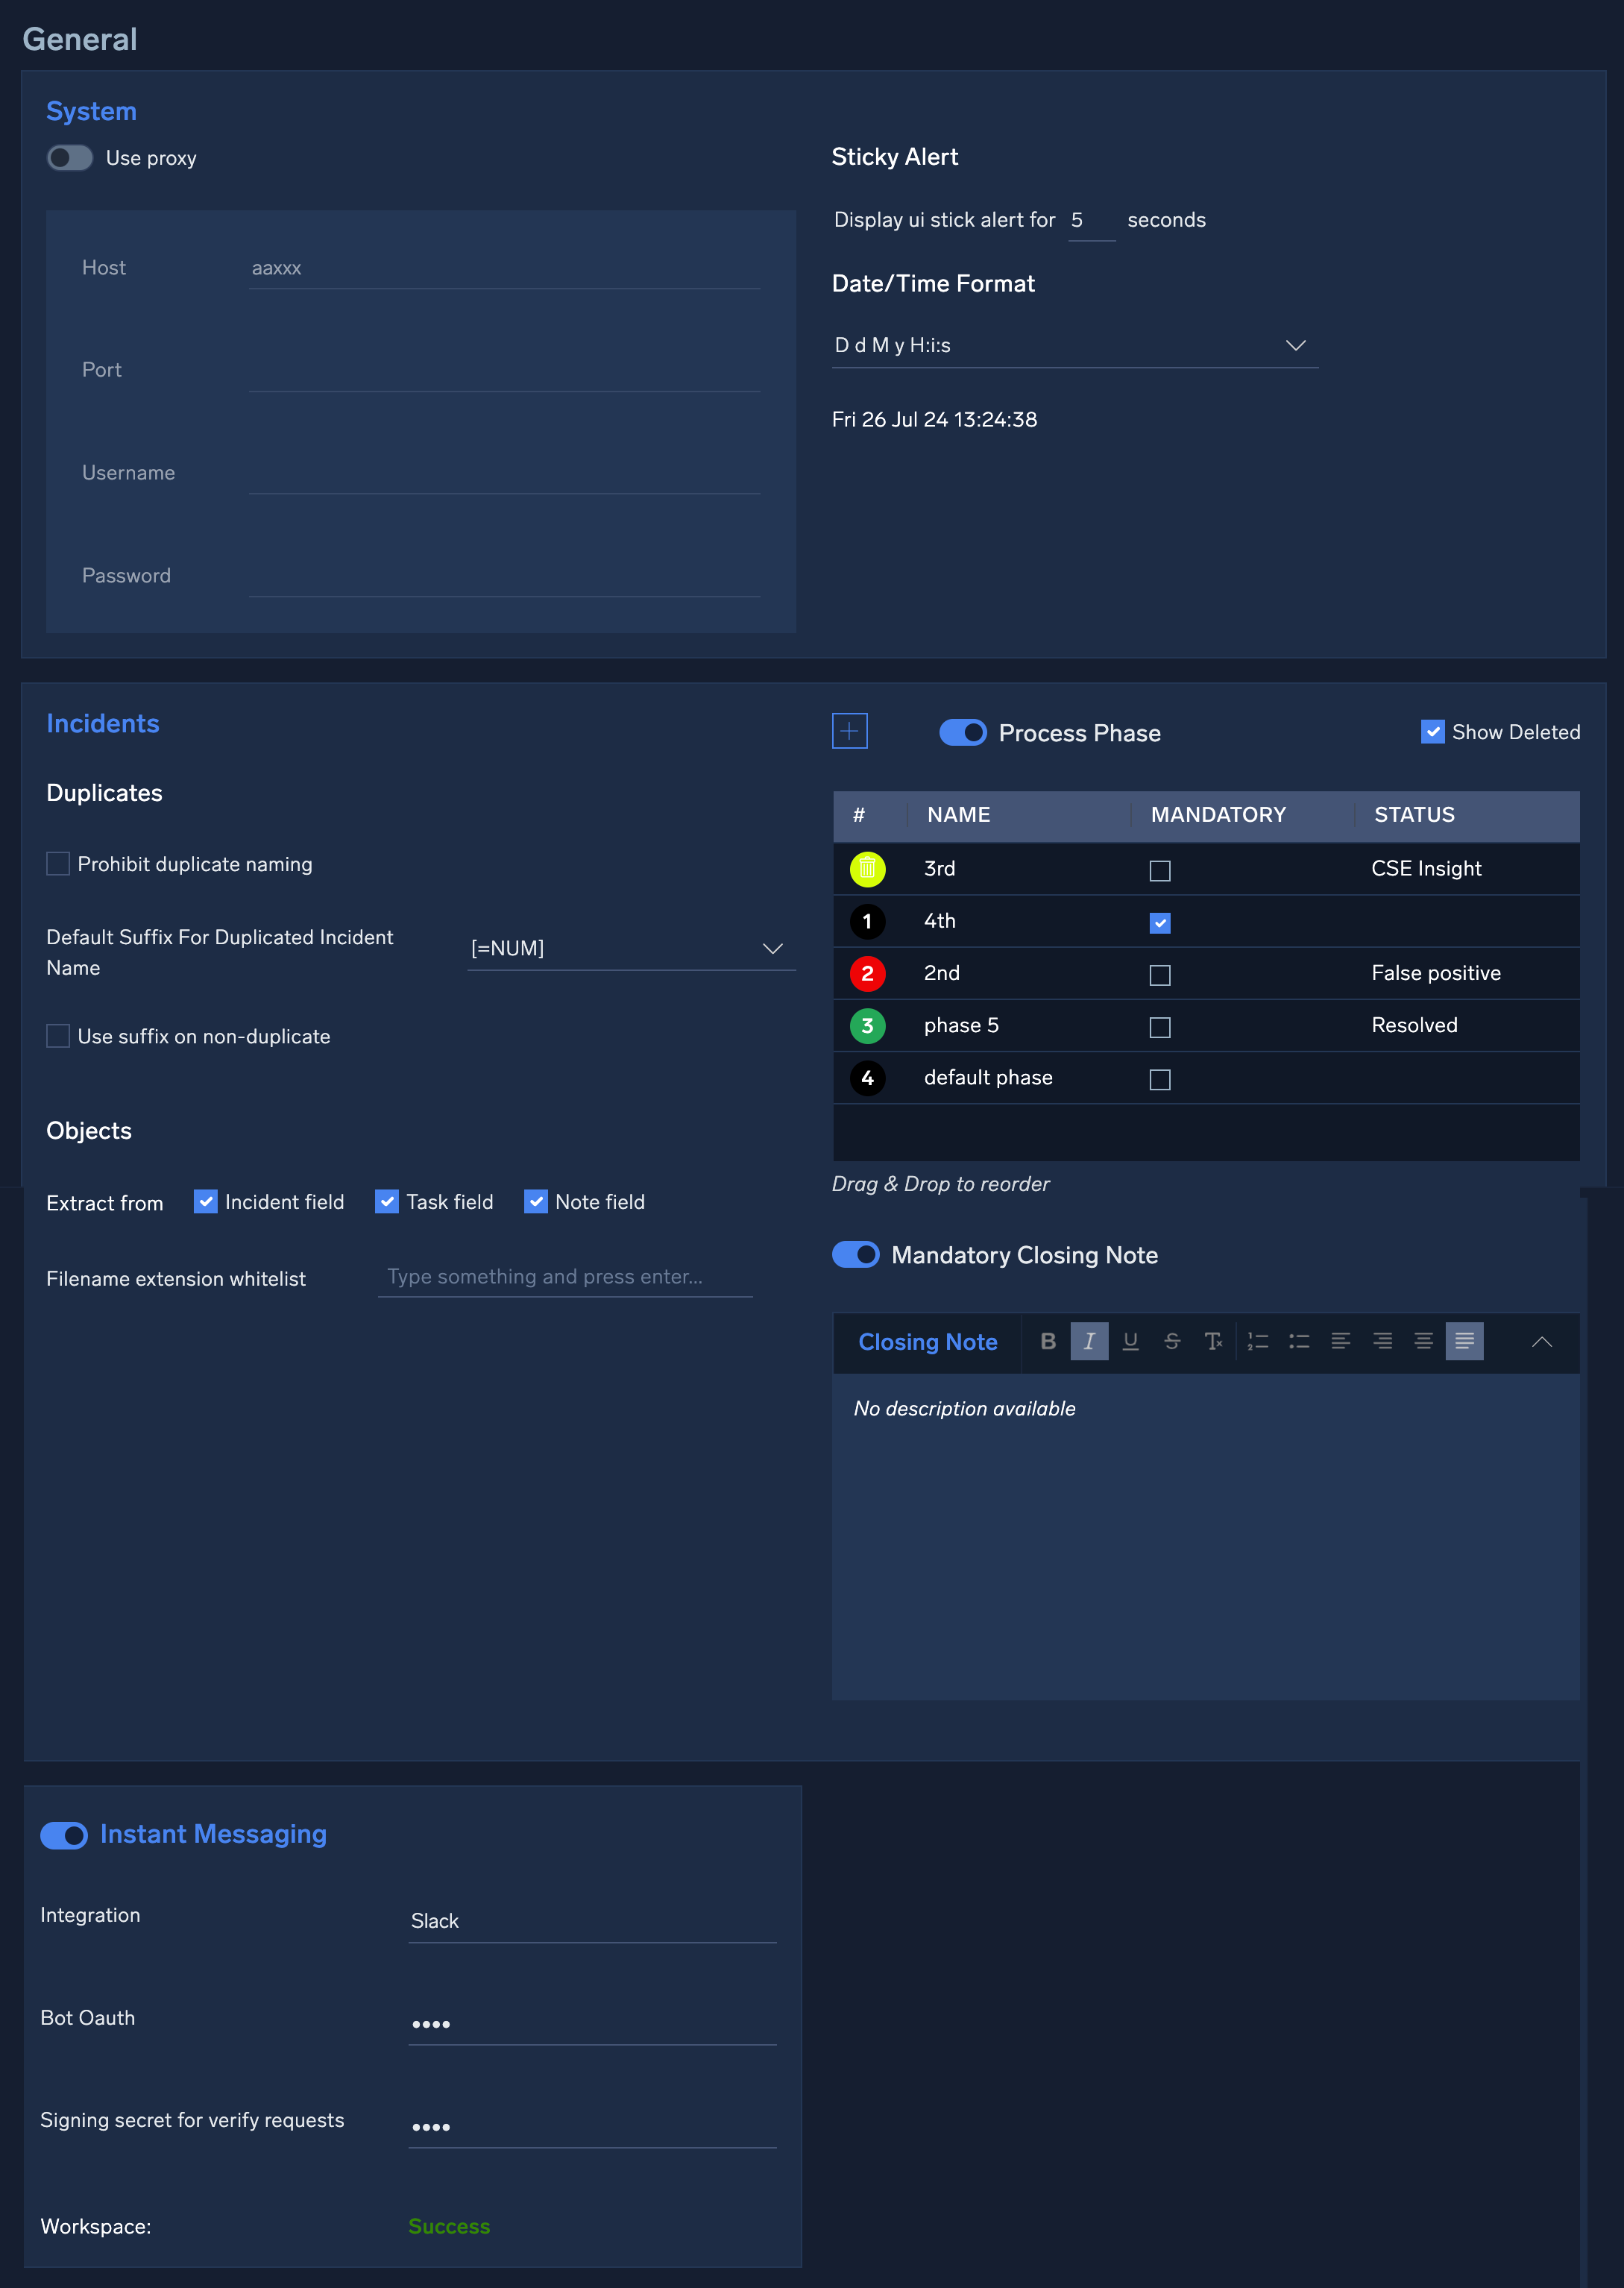
The General settings page includes sections for System, Incidents, and Instant Messaging. Administrators can set proxy settings and date/time formats in the System section. The Incidents section can control incident processing settings and file extension whitelisting. You can also configure integrations like Slack under Instant Messaging. For more information, see General.
New UI. To access general settings, in the main Sumo Logic menu select Cloud SOAR, and then under Cloud SOAR Settings select General. You can also click the Go To... menu at the top of the screen and select General.
Classic UI. To access general settings, click the gear icon ![]() in the top right and select Settings.
in the top right and select Settings.
Groups
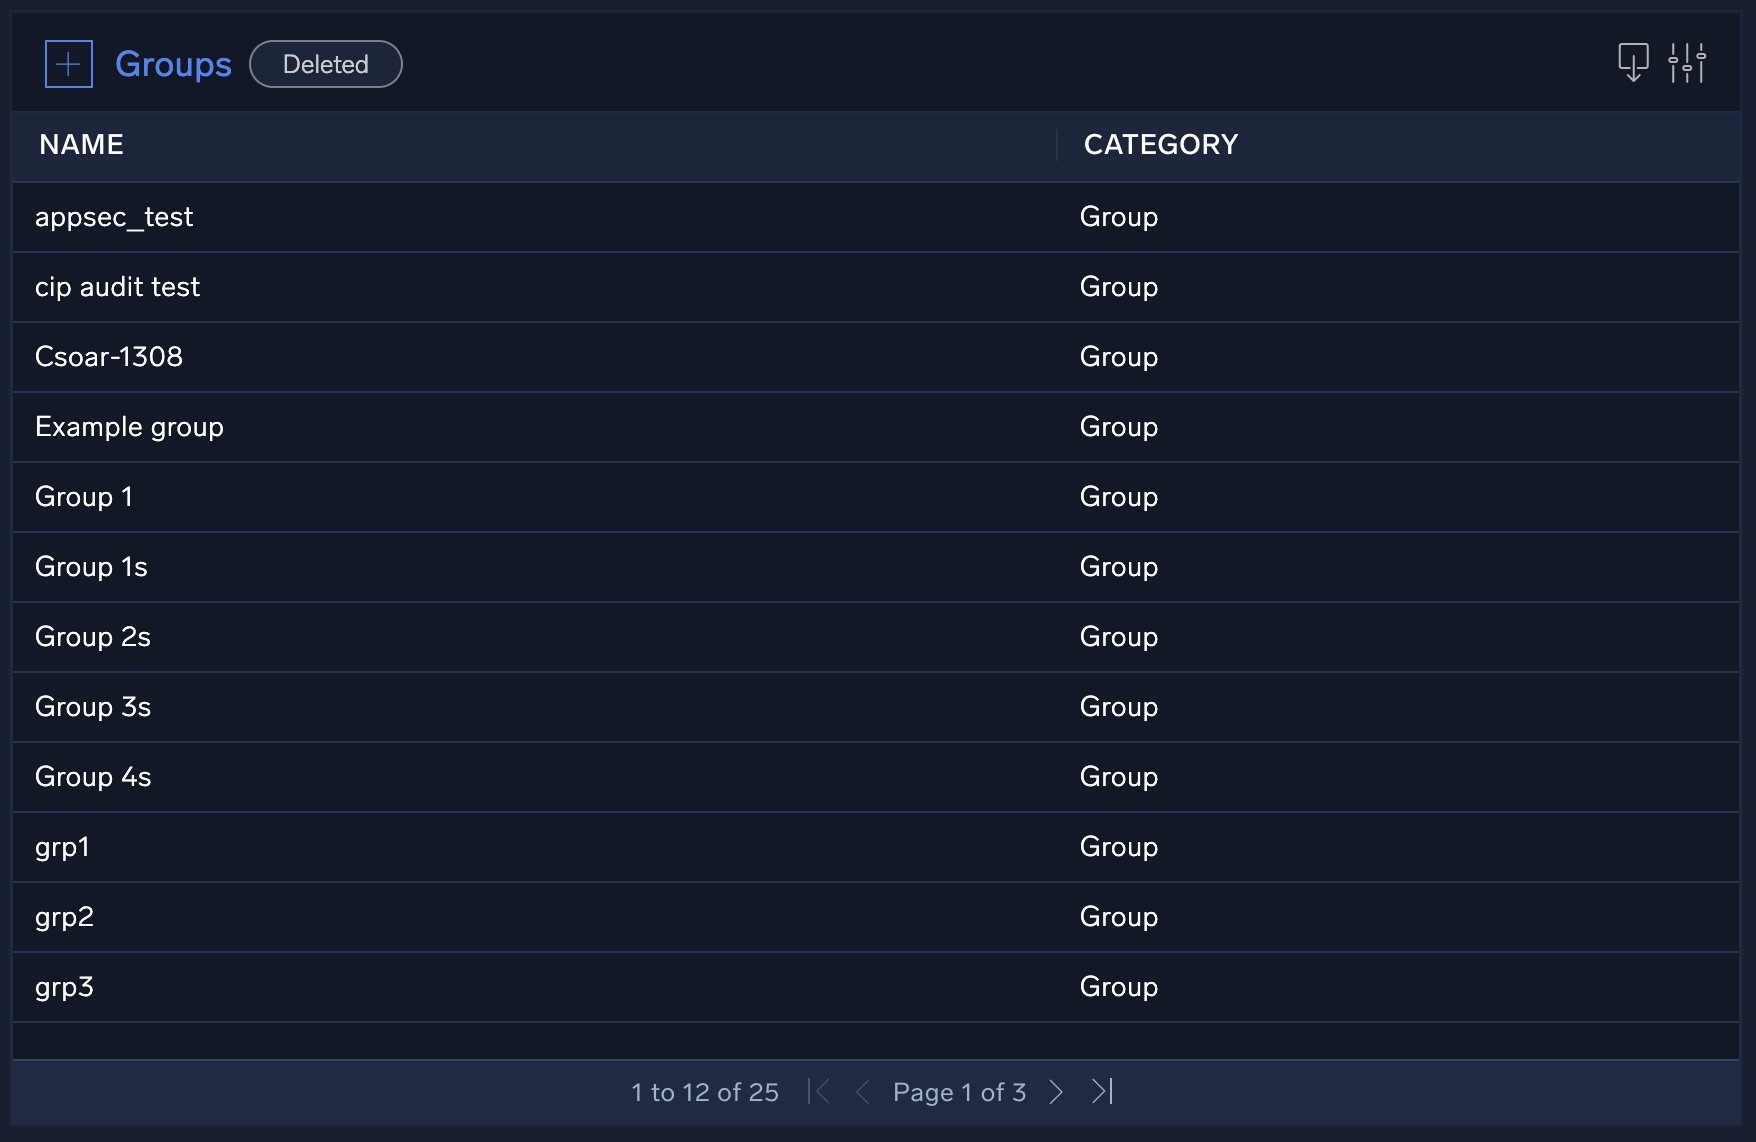
Basic user management and role-based access control (RBAC) is done through the main Sumo Logic interface; however, you can create user groups specific to Cloud SOAR through the Groups page. For more information, see Groups.
New UI. To access groups settings, in the main Sumo Logic menu select Cloud SOAR, and then under Cloud SOAR Settings select Groups. You can also click the Go To... menu at the top of the screen and select Groups.
Classic UI. To access groups settings, click the gear icon ![]() in the top right, select Settings, and on the left menu select User Management > Groups.
in the top right, select Settings, and on the left menu select User Management > Groups.
Event Triggers
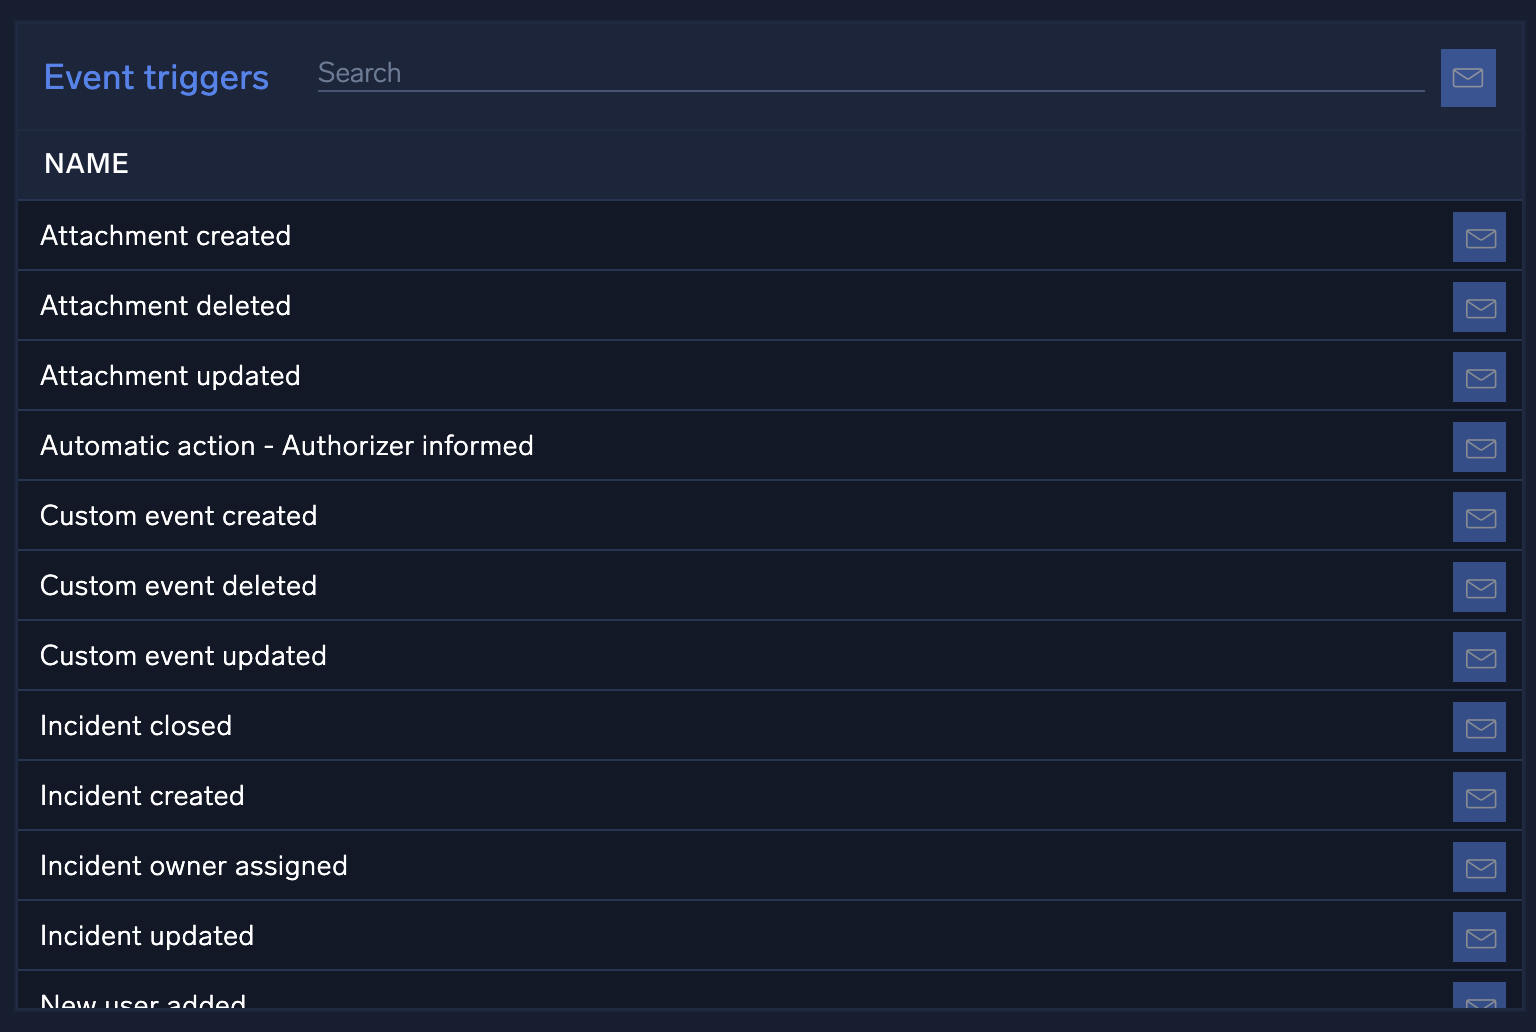
The Event Triggers page contains a list of triggers where you can configure default email notifications whenever key events happen. For more information, see Notifications.
New UI. To access event triggers settings, in the main Sumo Logic menu select Cloud SOAR, and then under Cloud SOAR Settings select Notifications. You can also click the Go To... menu at the top of the screen and select Notifications.
Classic UI. To access event triggers settings, click the gear icon ![]() in the top right, select Settings, and on the left menu select Notifications > Event Triggers.
in the top right, select Settings, and on the left menu select Notifications > Event Triggers.
Additional settings
You can use additional settings to customize fields, incident labels, and triage information. Use these settings to customize many of the templates, field names, and incident names used in the views and reports your analysts generate. You can also set the defaults for incident triage.
See:
Exploring Cloud SOAR Automations
In addition to settings, Cloud SOAR administrators have privileged access to the Automation section of the platform. For more information, see Cloud SOAR Automation.
New UI. To access Automation, in the main Sumo Logic menu select Automation.
Classic UI. To access Automation, click the gear icon ![]() in the top right and select Automation.
in the top right and select Automation.
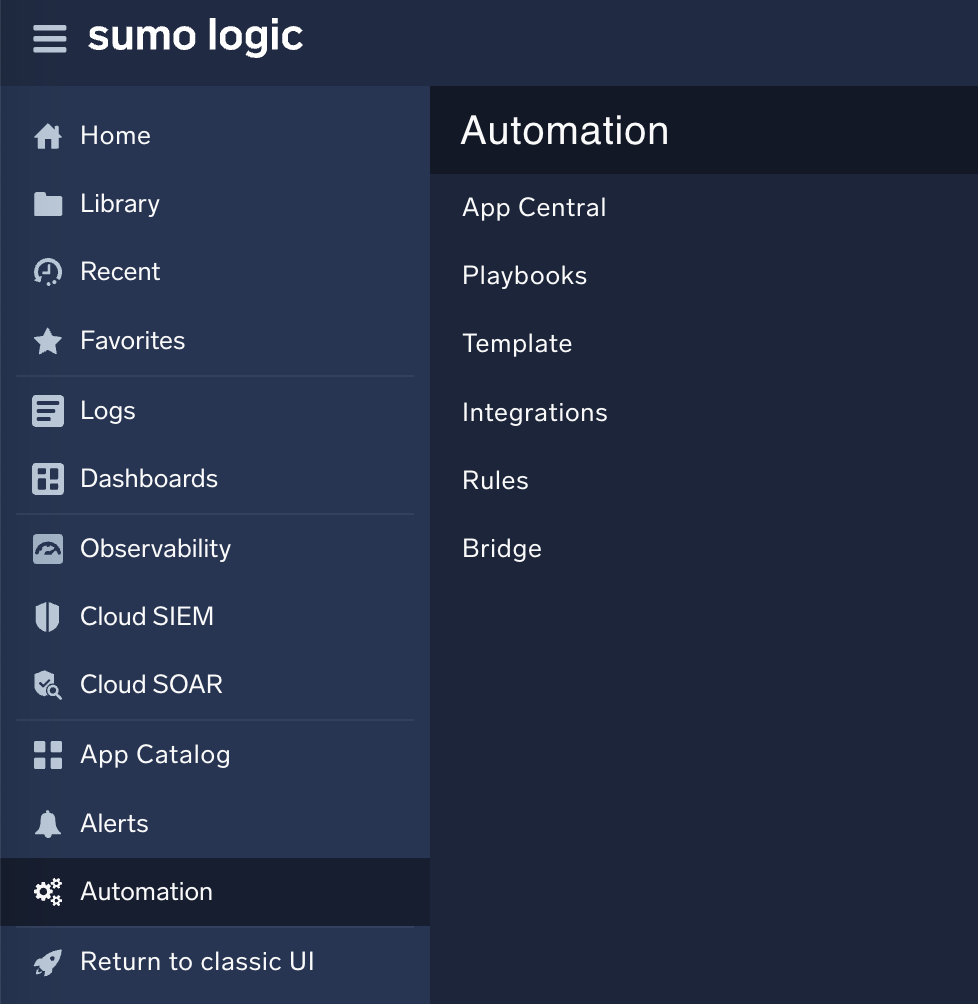
Within Automation, you’ll see subsections for:
- App Central. A large out-of-the-box library of playbooks, integrations, and use cases for different threats to get you started with orchestrating and automating your SOC.
- Playbooks. Allows you to create new playbooks and edit, delete, and manage existing ones.
- Template. Allows you to create new incident templates and edit, delete, and manage existing ones.
- Integrations. Lets you connect third party tools through APIs.
- Rules. Lets you create new automation rules.
- Bridge. Contains configuration details on any installed bridges.
Settings and configurations
Fields
Fields are used to map data that is imported into Cloud SOAR to various attributes used by Cloud SOAR. Fields are often pre-populated as data is imported into Cloud SOAR. However, there are some times you may wish to customize fields. For example, you can use a custom field to make sure the data you’re importing from Cloud SIEM, such as an entity, gets mapped properly to the equivalent entity field in Cloud SOAR. Or, you might want to create a custom field called Time to Manage that calculates the difference between incident Open Time and Close Time. You could then track Time to Manage across different incident types or different analysts to find pain points in your SOC.
Administrators can edit existing fields, delete fields, and add new fields for almost every section of Cloud SOAR. Fields can be customized one by one manually, or an administrator can import a CSV file to customize them in bulk. Any existing field can have its name or value edited, but its type cannot be changed. Field types include date, text, numeric, timezone, email address, IP address, and many others.
There are several categories of fields you can customize in Cloud SOAR: triage, incidents, tasks, notes, and attachments. Each section of Cloud SOAR supports different numbers of custom fields. The Incidents section, for example, supports up to 100 custom fields.
Custom fields are an essential component of Cloud SOAR. They are used to normalize data collected from the different platforms such as SIEMs, ticketing systems like Jira, or any kind of technology that sends data. The data ingested from all these sources can have different names but thanks to custom fields we can map the data to a unique field in Cloud SOAR.
Fields can be used to apply advanced filters or add them as a new column in the incident list view. For example, you might want to sort your incidents by the IP address field. You can also use fields to perform some calculations on other fields to create a new field.
Define and test a custom field
In this section, we’ll create a custom field to map data that’s ingested into Cloud SOAR. We'll create a standardized naming convention for source IP addresses to help organize our Cloud SOAR instance. For more information, see Custom fields.
- New UI. In the main Sumo Logic menu select Cloud SOAR, and then under Cloud SOAR Configurations select Fields.
Classic UI. Click the gear icon in the top right, select Settings, and on the left menu select Customization > Fields.
 - In the Custom Fields menu, select Incidents.
- Click the + icon.
- Give the field a name that designates what it is for. For example, to create a field for IPs originating from entities, enter Source IP.
- For Type select Text.
- Click Create.
Test your custom field
To test the new field, we'll create a new incident manually.
- New UI. In the main Sumo Logic menu select Cloud SOAR > Incidents. You can also click the Go To... menu at the top of the screen and select Incidents.
Classic UI. In the main Sumo Logic menu select Cloud SOAR, and then select Incidents at the top of the SecOps screen. - Click the + icon to create a new incident.
- Scroll down to the bottom to see your new field. Your field may appear in either the left or right column. It may be near the bottom or several rows up.
- Type a value in your new field. For example, if your new field is for a source IP, you could type in an IP address, such as 1.1.1.1.
- For Incident ID, enter a unique identifier.
- For for Type select General, for Purpose select Generic, and for Category select General.
- Leave other fields as their defaults, then click Create.
You will not be able to create the incident until there is a green No Issue Found in the top right corner. If you see the orange Warning icon, hover over it to learn what fields are missing or erroneous.
Incidents
Incidents are the main place where SOC analysts conduct their threat investigations and orchestrate their responses. There are several areas of the admin UI where you can customize the way incidents behave in Cloud SOAR:
- Incident templates. Incident templates control how incidents appear in the War Room and include fields like type, severity, and status. Incident Templates are also essential when creating automation rules that trigger incidents. When you first set up and automate your SOC, it will primarily be using incident templates.
- General settings Incidents section. Use this settings section for some configuration of the incidents in Cloud SOAR. You can allow or prohibit duplicate names, set whether closing notes are mandatory or not, and select which objects are extracted from incidents here.
- Reports. Use this feature to create and edit report templates. These templates are used when analysts export a report after closing an incident as part of the lessons learned stage of the incident response cycle.
- Incident Labels. Incident labels are used to organize the way incidents are displayed inside Cloud SOAR.
Work with the analysts on your team to customize reports, labels, and templates to suit their needs. As a best practice, create labels and templates that use standardized and unique naming conventions.
Customize incident labels
In this section, we’ll create a custom incident label. This new label will make it easier to sort and respond to incidents.
- New UI. In the main Sumo Logic menu select Cloud SOAR, and then under Cloud SOAR Configurations select Incident Labels.
Classic UI. Click the gear icon in the top right, select Settings, and on the left menu select Customization > Incident labels.
 - Click the + icon to create a new incident label.
- For Name, enter a name that designates what the incident is for. For example, to create a label for incidents originating in Cloud SIEM, you could enter Cloud SIEM Alert.
- Optionally, you can include a short Description.
- For Value, type the label as you want it to appear in the UI. For example, type Cloud SIEM Alert -.
- Double-click entries you want to add to the value. For example, double-click Counter. The fields inside the brackets will be replaced by the appropriate variable when this incident label is used. For example, if the incident is created in October, the
[=MONTH]field will be replaced by 10. - Click Save.
Now you can use this incident label the next time you manually create an incident. You can also use it when creating or configuring automation rules that create incidents.
Triage
Sometimes your system may record events that are unverified, or have a low confidence level such that you may want to triage them before reporting them as incidents. The triage features of Cloud SOAR allow users to view these events and their details, as well as assign up to 100 custom fields for triage use, allowing maximum flexibility over a variety of event use cases. For more information, see Triage.
New UI. To access the Triage screen, in the main Sumo Logic menu select Cloud SOAR > Triage.
Classic UI. To access the Triage screen, in the main Sumo Logic menu select Cloud SOAR. Then in the upper left of the SecOps screen click Incidents > Triage.
Any recorded events that have not been converted to an incident will be displayed in a sortable table. Click on any column to sort by that field. By default, you will see two fields, Status and Type.
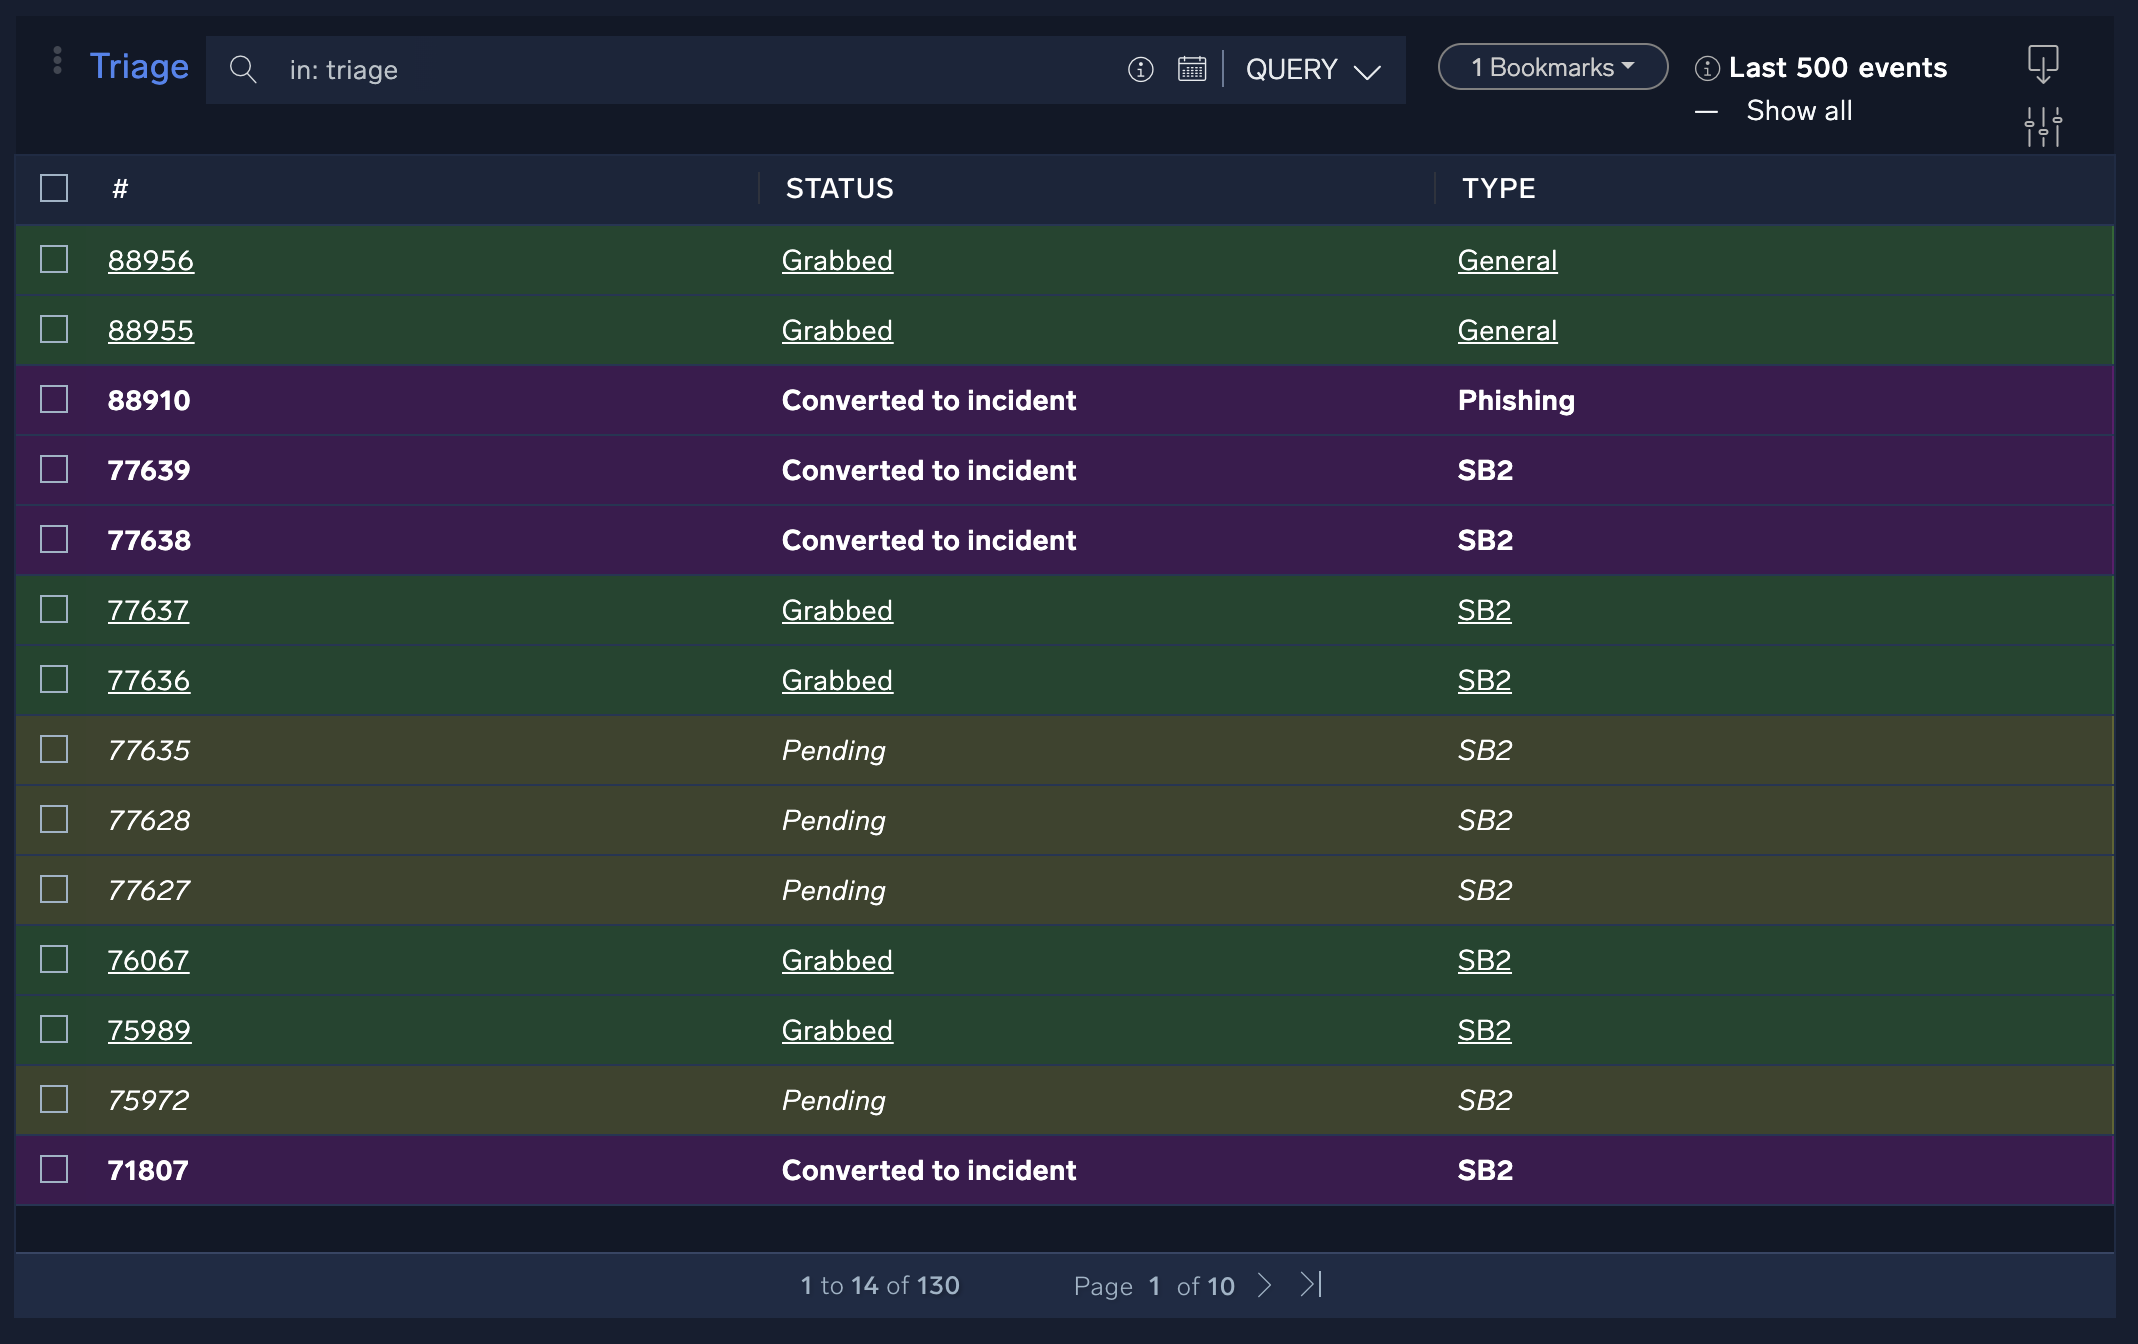
The Type field is directly linked to the incident type field (and can be added through the Triage section of the Custom Fields page).
To add additional custom fields (up to 100), select Triage from the Custom Fields list. To add a custom field, click the + button in the upper left of the display and set the field properties as desired. Make sure to check Use as filter if you want your new custom field to be filterable in the triage module.
Triaging an event
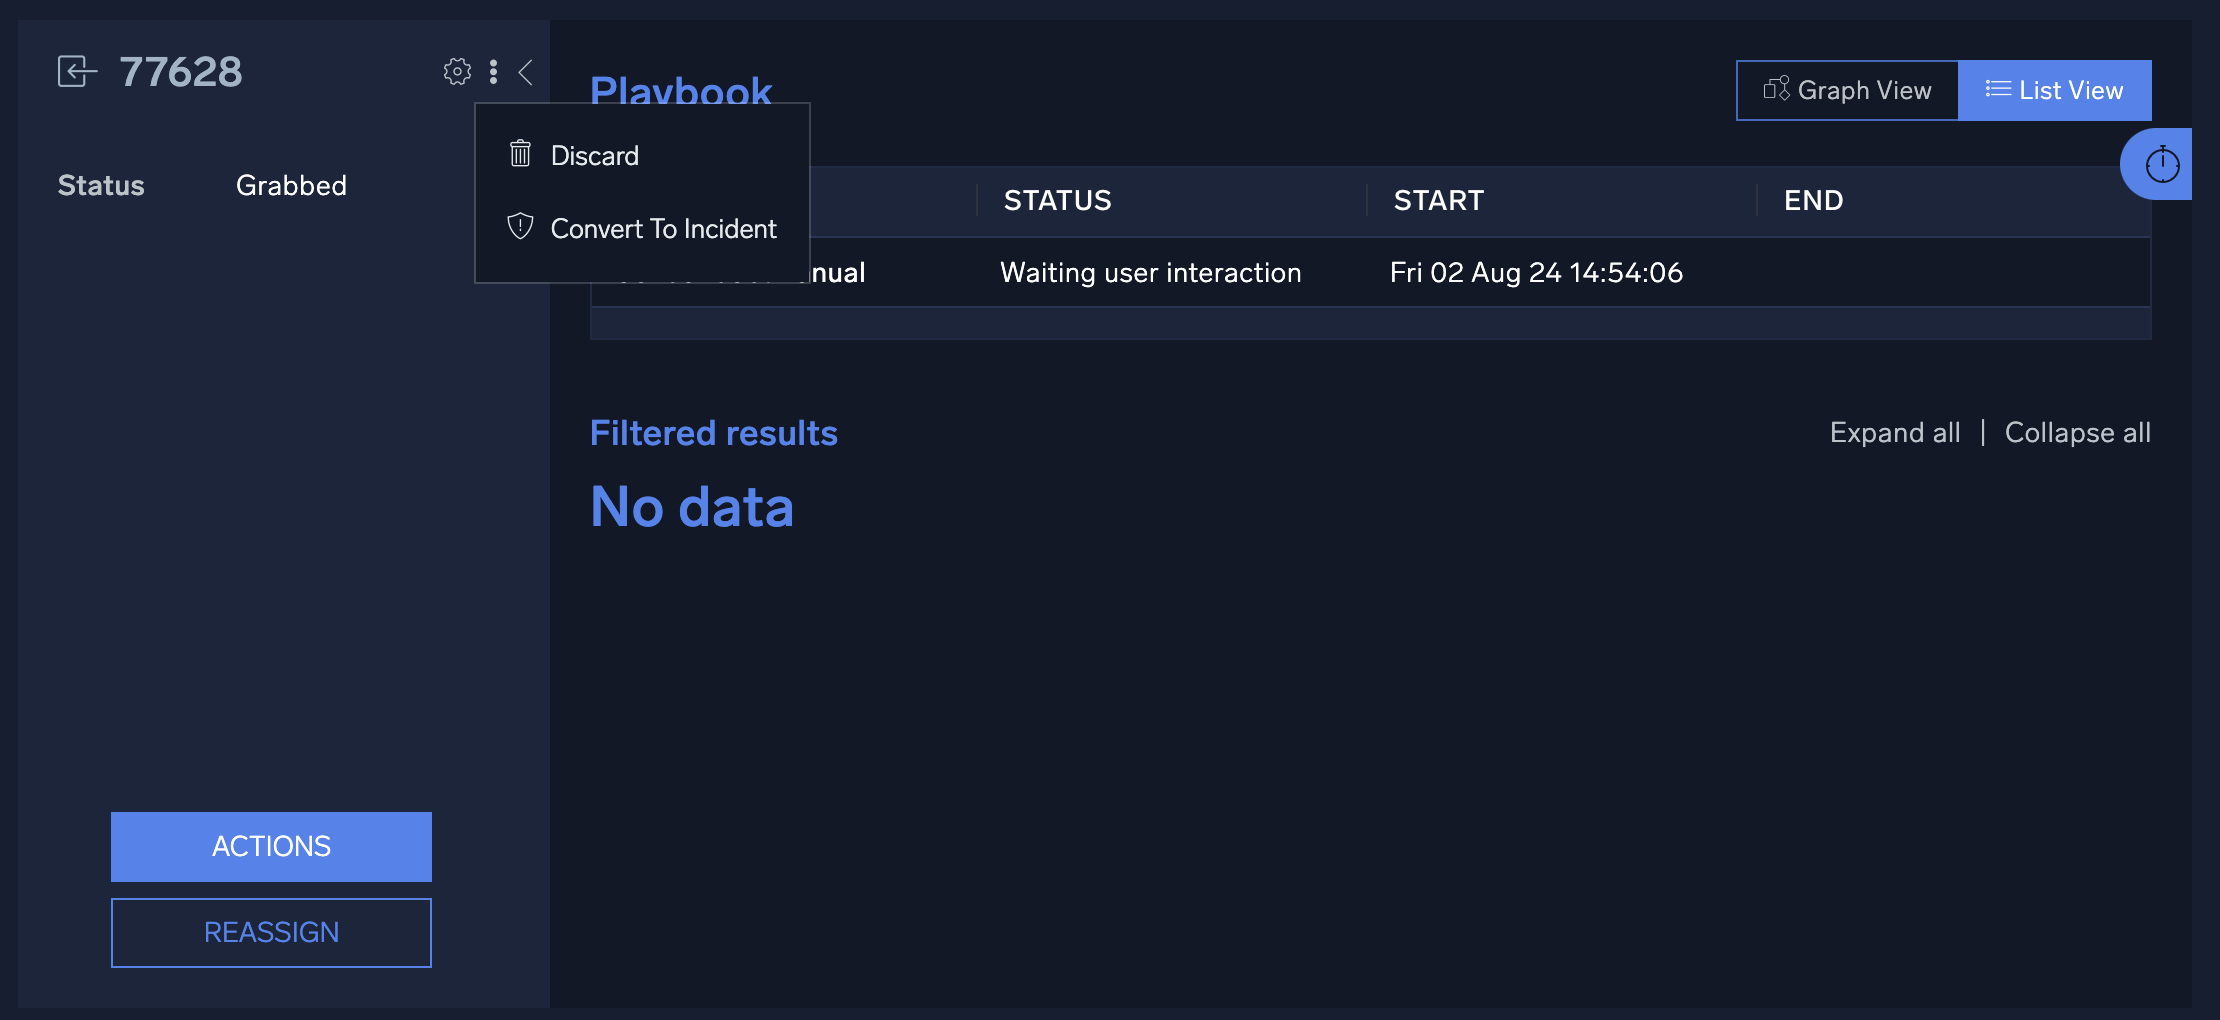
In the Triage page, you can begin triaging an event by assigning the event to a user. Hover over an event and click on the person icon to assign or "grab" that event.
Grabbing an event assigns that event to the selected analyst, and any playbooks defined for that incident type will be automatically executed, with the results displayed on the event details screen. Because all playbooks for the specified incident type are executed automatically, it is recommended to create separate incident types and playbooks for triage use.
To convert the event to an incident, click the three-dot kebab in the upper-right of the event and select Convert To Incident. Select the appropriate incident template, owner, and label, then click Save. The new incident will now be available in the Incidents screen along with any custom information gathered by playbooks run during triage.
Automations and integrations
Why automate?
Automations are at the heart of Cloud SOAR. Playbooks, rules, and integrations all help you automate various tasks in your security operations center.
There are several reasons you might want to automate some security tasks:
- Faster responses. Automating parts of your SOC can mean faster response times.
- Consolidate tools. Orchestrate all your security tools in one location with integrations and custom APIs.
- Close the skills gap. Analysts of all skill levels can deploy playbooks. Veteran analysts can spend more time on threat hunting.
Typically, each playbook in Sumo Logic Cloud SOAR will help automate or partially automate two or three of the steps of the incident response cycle.

Import and configure an integration through App Central
Cloud SOAR comes with hundreds of pre-built playbooks and integrations as part of App Central. For more information, see App Central.
As a Cloud SOAR administrator, you can explore App Central and install any integrations your team requests. You can also create custom integrations using APIs from the Integrations page. These integrations will connect Cloud SOAR to other tools like CrowdStrike, ServiceNow, or Jira. Once all your tools are integrated, Cloud SOAR can be a single, central location for orchestrating your security response.
Let's walk through how to install and configure useful integrations through App Central.
- New UI. In the main Sumo Logic menu select Automation > App Central. You can also click the Go To... menu at the top of the screen and select App Central.
Classic UI. In the main Sumo Logic menu select Automation and then and click App Central in the left navigation bar. - Click on the Integrations tab in the top tab row.
The App Central integrations page shows a long list of installed and available integrations to augment Cloud SOAR functionality with both Sumo Logic and third-party vendor functionality.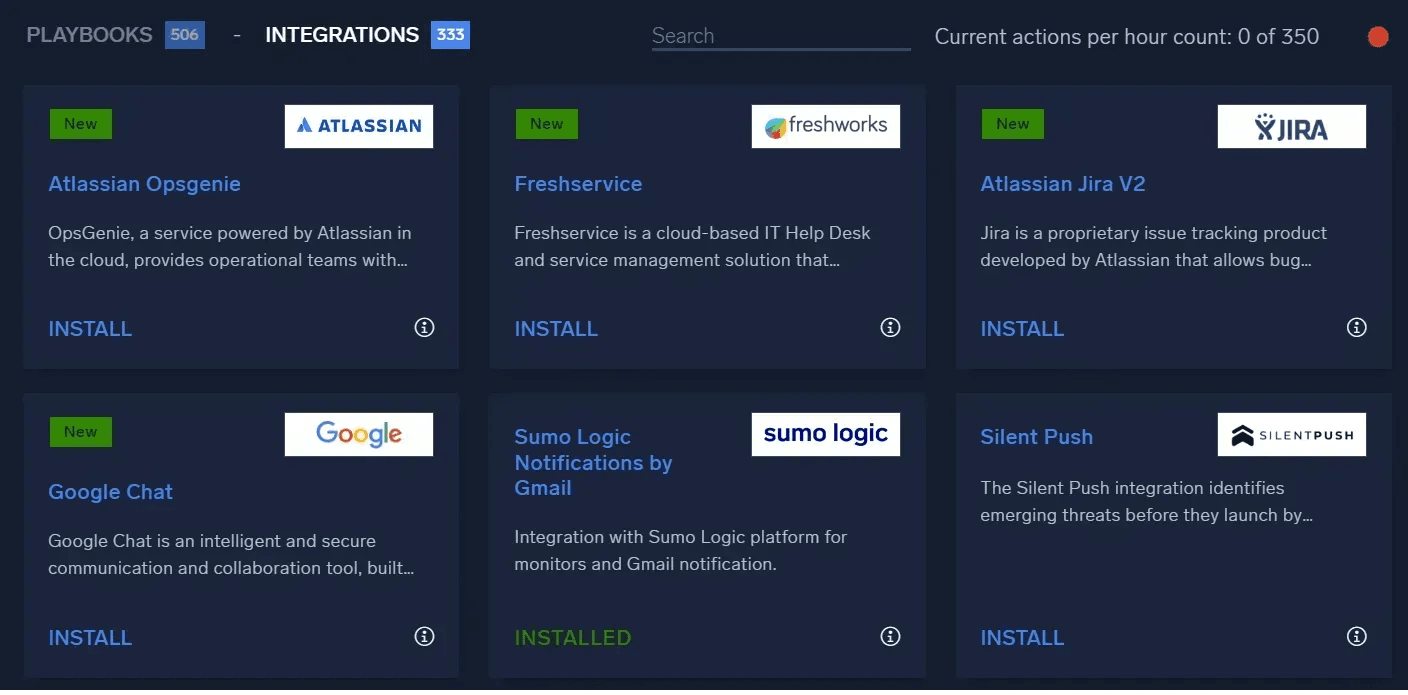
- Choose a sample integration from the list and click on it. A popup window will appear showing the details of the integration, including version, description, and a list of actions that are supported in automations.
- Navigate to the Integrations view to show installed integrations.
New UI. In the main Sumo Logic menu, select Automation > Integrations. You can also click the Go To... menu at the top of the screen and select Integrations.
Classic UI. In the main Sumo Logic menu, select Automation and then select Integrations in the left nav bar.
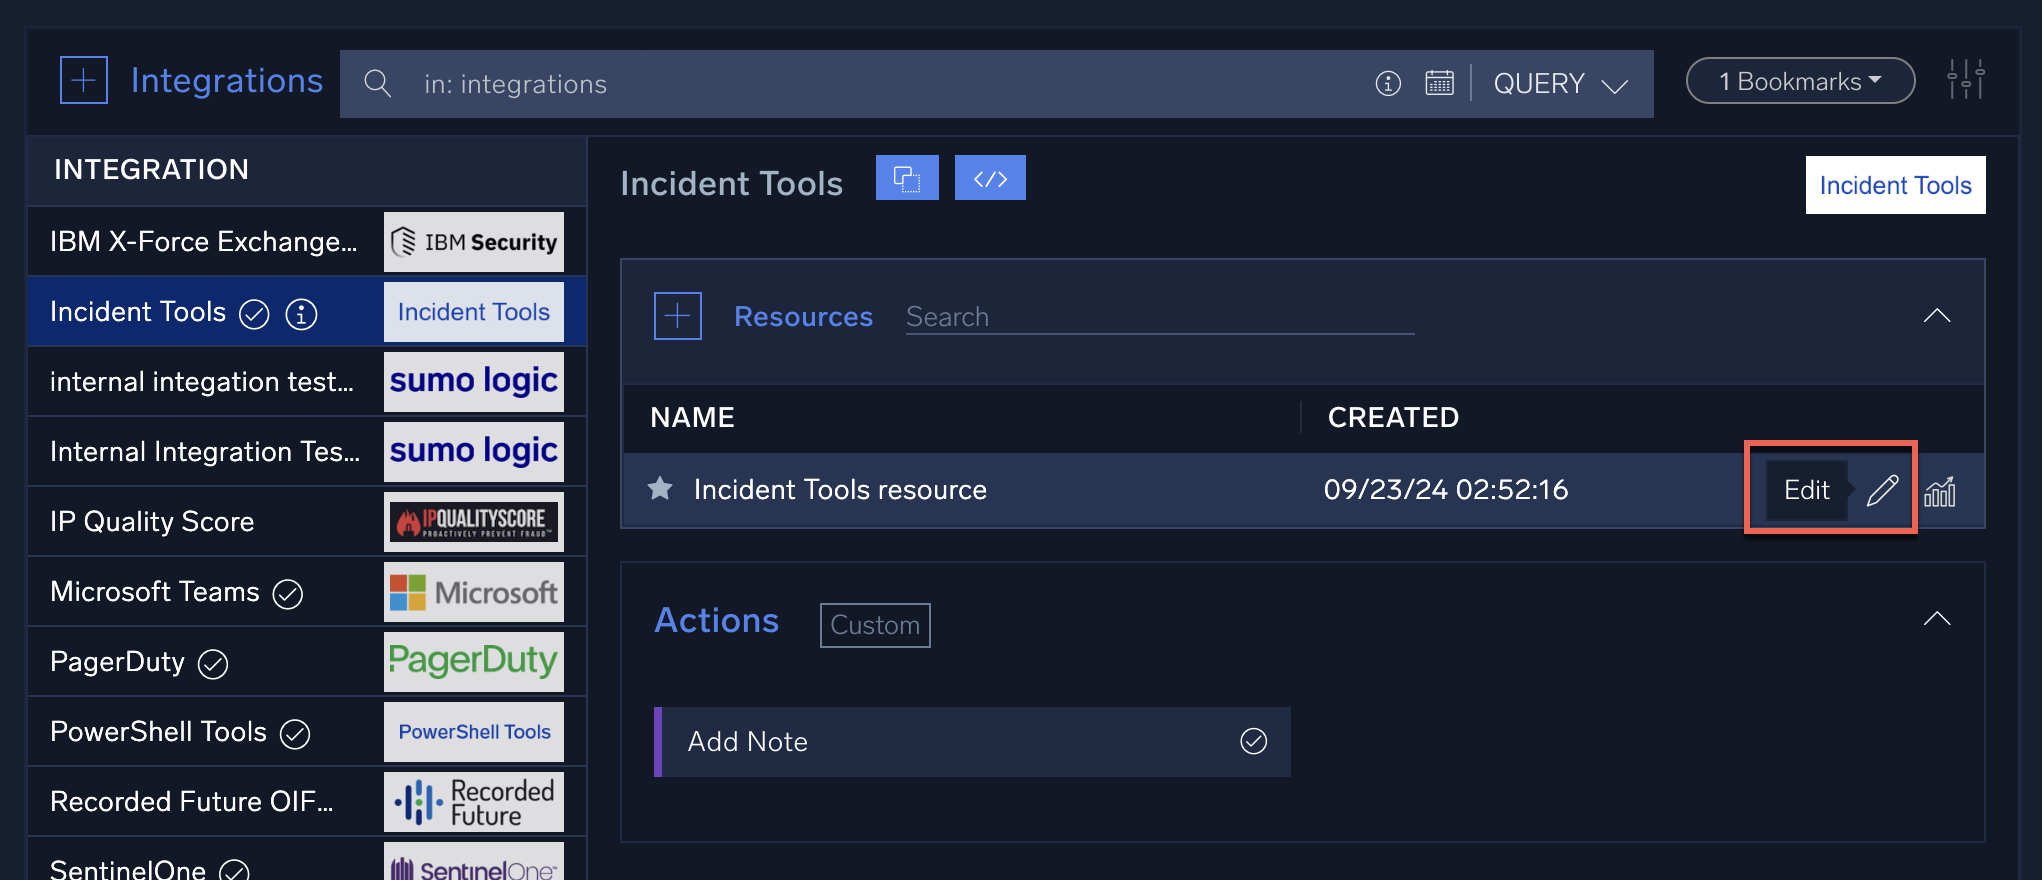
In this view, you can see the integrations that have already been installed and configured in the system. - Click an integration. The panel on the right will show the integration details, including available actions. Many integrations after install will require appropriate configuration using "resources".
- Move the mouse cursor over the resource, then click the Edit (pencil) icon.
- You will see a dialog showing the configuration fields for this resource.
When you create a resource or configure an existing one, you will need to enter the appropriate connection information such as the API web URL (for either Sumo Logic or a third-party service) and associated API keys. Many Sumo Logic integrations will require you to create an access key and supply an associated access ID and access key to use in configuring integrations. Some third party integrations may require you to visit their website and sign up for an account in order to obtain the appropriate URL and/or credentials for their API.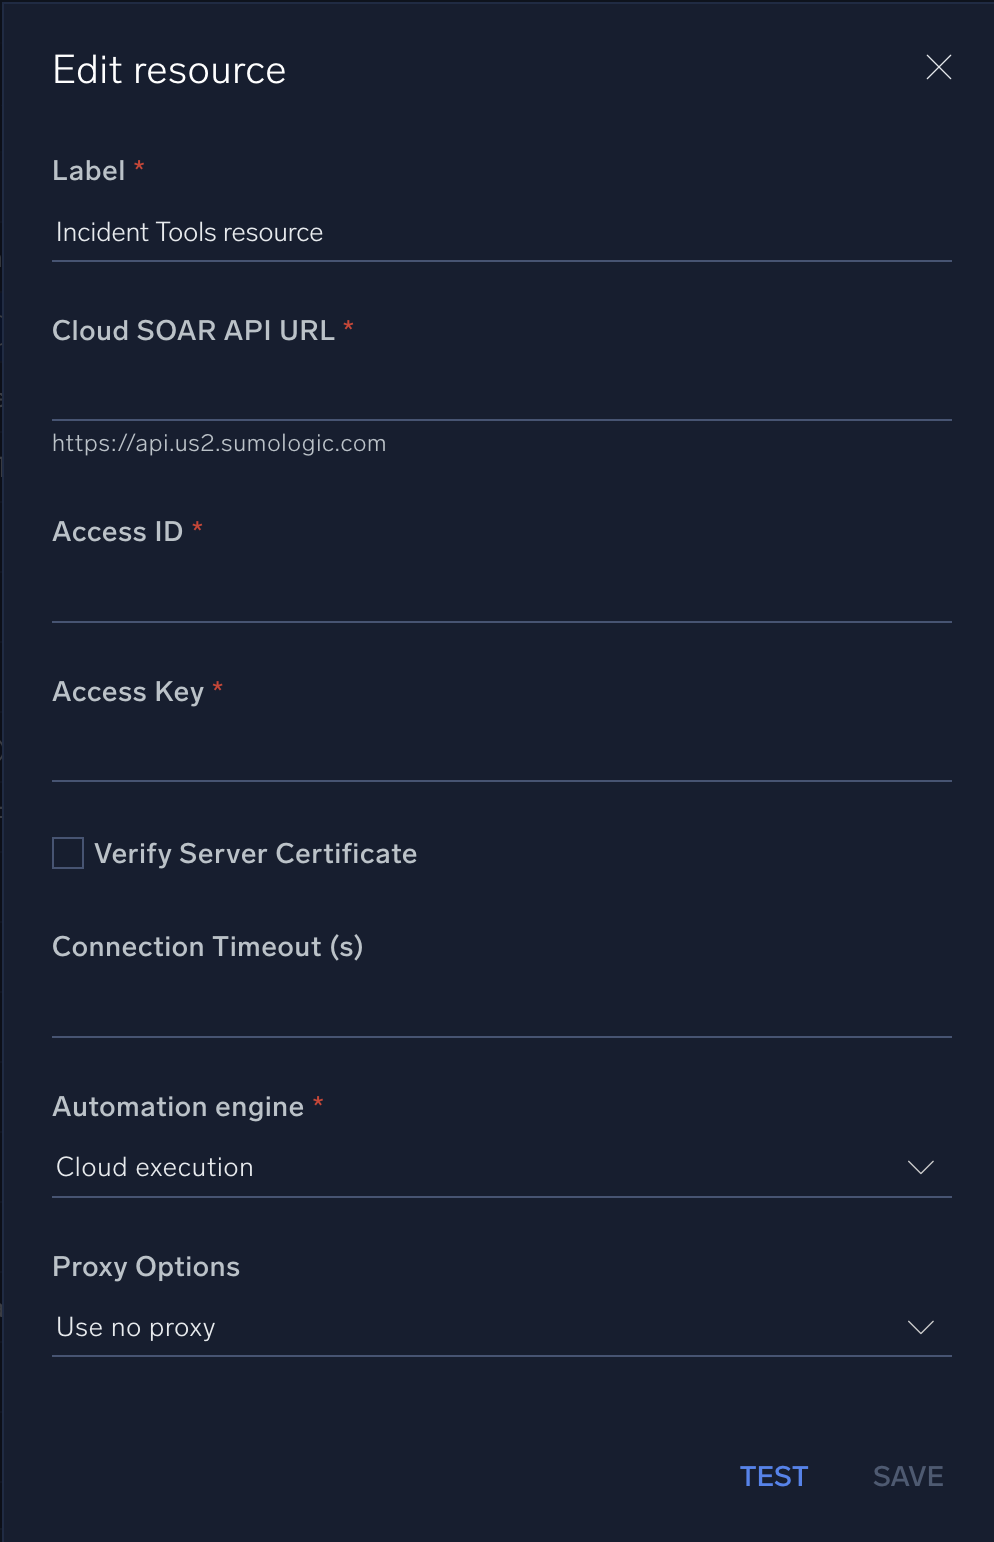
- Click the Test button after you have configured the resource to test the connection info. You will see a small popup that indicates whether the test was successful. (It may take a few seconds to execute depending on the integration.)
Playbooks
Once you’ve identified a potential security incident, you can respond to it in Cloud SOAR by executing a playbook. Playbooks are automated, or partially automated, workflows that act based on information from an incident. The playbook can enrich data, contain threats, notify teams, and other actions with custom APIs. These actions help automatically orchestrate many parts of the investigation, containment, eradication, and recovery processes. For more information, see Playbooks.
Custom playbooks allow you to automate any task that uses a custom API. You can also use them to automate tasks that aren’t part of the hundreds of default playbooks included in Cloud SOAR.
Playbooks are made up of nodes which are connected together in a flowchart. Whether you’re customizing a playbook or creating one from scratch, you have several node options:
- Actions. Enrich data, execute APIs, send notifications, or use other integrations.
- Tasks. Assign a task to an analyst or another human for later review.
- Conditions. If-then statements that allow playbooks to branch in different directions.
- User choice. Pause the playbook and wait for a human’s decision.
- Embedded playbooks. Run another playbook.
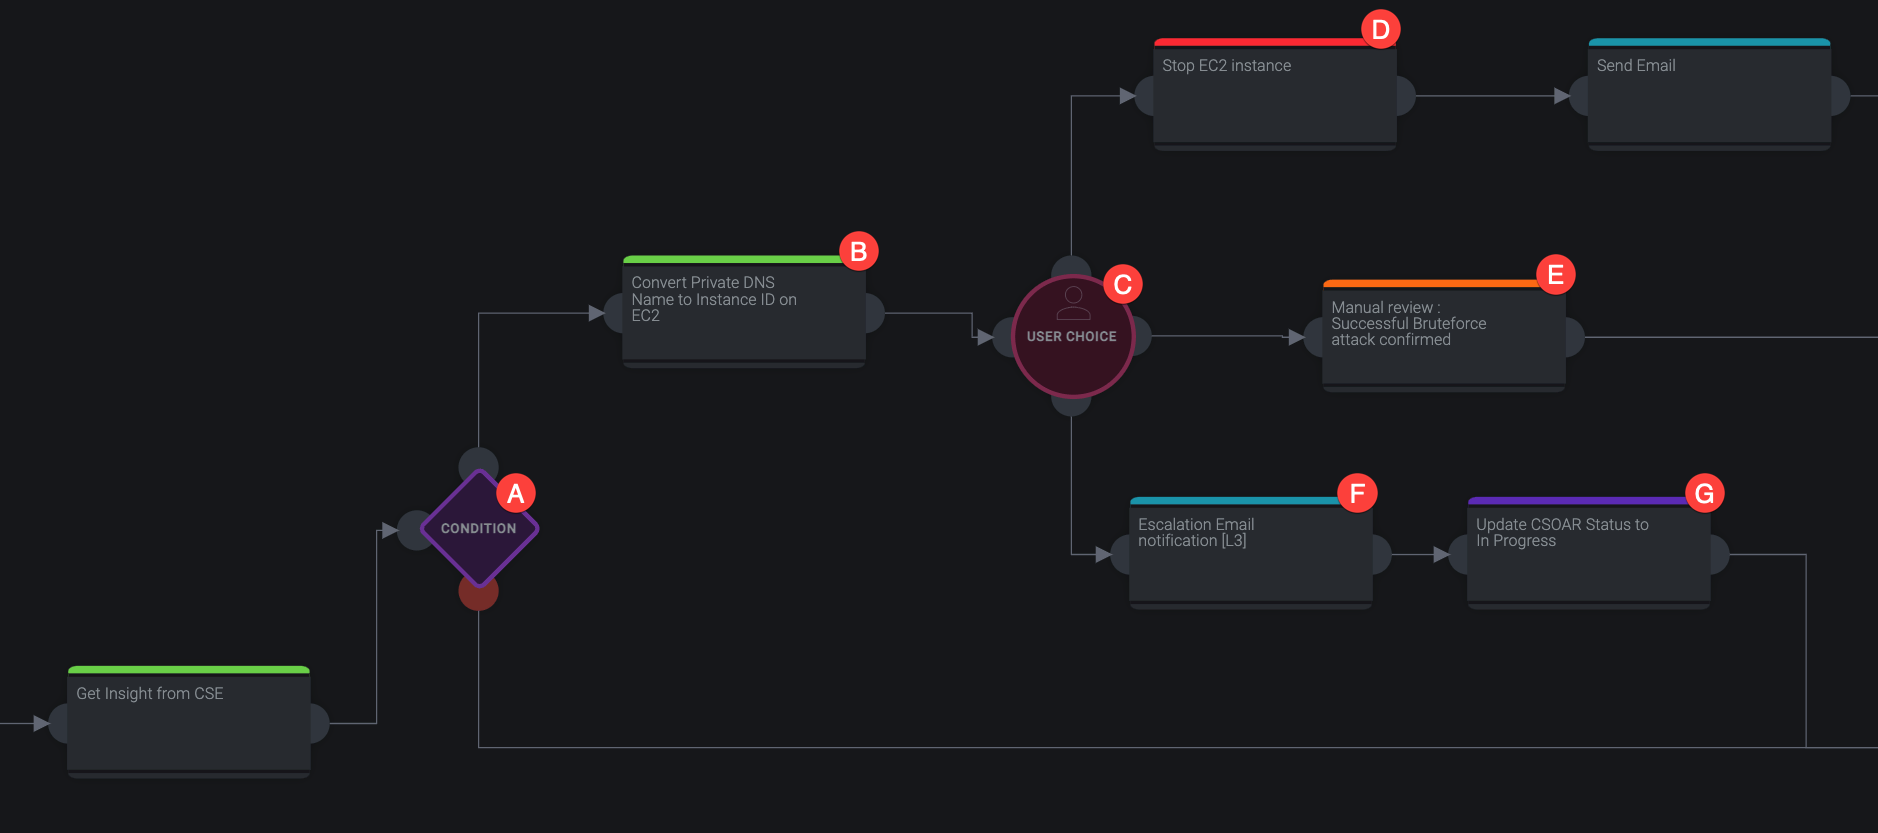
Each of these nodes are color-coded in a playbook:
- A. Conditions. Conditions are represented by a purple diamond, allow your playbook to branch in different directions based on an if-then statement.
- B. Enrichments. Green nodes are enrichments. These might add additional information from a threat intel database or convert data from one type to another.
- C. User Choice. User choices, represented by a red circle, pause a playbook and wait for a human's decision. After the choice is made, the playbook can continue branching in different directions.
- D. Containments. Red nodes are containments. These can stop the spread of viruses and keep your data safe.
- E. Tasks. Orange nodes assign tasks to a teammate in Cloud SOAR, such as manually reviewing data.
- F. Notifications. Blue nodes are notification actions, such as a Slack or email alert.
- G. Custom. Purple nodes are custom actions, such as APIs.
Action nodes use integrations. These integrations broadly fall into several types:
- Enrichments. Add information, metadata, or context, such as from a threat intelligence database.
- Containment. Reduces further damage by isolating files or machines related to a threat.
- Notifications. Alerts sent via email, Slack, PagerDuty, or most other services you can connect with an API.
- Custom. Scripts and any other automations you can create using YAML, Perl, Python, PowerShell, or Bash.
- Daemons. Background processes that can ingest data.
Custom actions can also include trigger actions, which run based on an event type until certain criteria are met. For example, if malware is detected, a trigger action could run an anti-malware cleanup software until no malware is detected. Similarly, you can create scheduled actions that run at certain intervals. For example, you could create a scheduled action that checks for malicious IP addresses every 5 minutes until no more malicious IP addresses are found.
Best practices
Before you begin creating or customizing a playbook, decide what you’d like to automate. Think about what conditions you want met, and what actions or integrations you want to accomplish based on different flows. Once you have a design in mind for the flow of your playbook, you can create or customize a new one. Search App Central to see if an out-of-the-box playbook that does what you want already exists, or if you can modify a existing playbook that’s similar to what you have in mind.
Create a custom playbook for Cloud SIEM Insights
Cloud SOAR allows us to create automations that will run whenever Cloud SIEM Insights are created or closed. These automations are powered through playbooks, predefined actions run in an automated workflow to respond to an incident.
Let’s create a playbook for use in Cloud SIEM.
- New UI. In the main Sumo Logic menu, select Automation > Playbooks. You can also click the Go To... menu at the top of the screen and select Playbooks.
Classic UI. In the main Sumo Logic menu, select Automation > Playbooks. - To explore an existing playbook, click on it to open the playbook diagram in the right sidebar. Here, you can view the individual nodes and sequences, providing insight into the types of actions and structures you can create with custom playbooks. Playbooks can include multiple actions and branching conditions to handle different action sequences based on specific criteria. Click any playbook component to see detailed information about each node.
- Click the + icon near the top to create a new playbook.
- Enter a name, for example, Test Playbook. You can optionally enter a description. Select Cloud SIEM as the Type for the playbook.
- Click Create when finished.
On the following screen you will see the starting template for your new (empty) playbook, with "Start" and "End" nodes.
- Switch to edit mode by clicking on the Edit (pencil) icon in the bottom toolbar.
- Before we start adding actions to our playbook, we’ll want to set up the initial configuration of the playbook so we get the proper inputs from the Cloud SIEM Insight.
- Mouse over the Start node, and click on the Edit (pencil) icon.
- In the Edit Node popup, select Insight from the playbook input parameters dropdown. Choosing Insight will automatically populate the popup view with a number of input parameters that will be added to the playbook from the corresponding Insight.
- Click Update to save and close the input parameters.
- Add an action node:
- Click the + button on the Start node.
- Select Action from the node type options.
- Fill in a node name, for example, “Get Insight Details”.
- From the Integration options, select Sumo Logic Cloud SIEM.
- For Type, ensure Enrichment is selected.
- As the Action, select Get Insight V2.
- As the Insight ID, select Insight ID.
- Click Create.
- Add another action to the playbook by clicking the + icon on the Get Insight Details node you just created and selecting Action. Use the parameters outlined below:
- Name: “Get VirusTotal Info”.
- Integration: VirusTotal.
- Type: Enrichment.
- Action: IP Reputation.
- For the IP field, click the cog icon on the right, and select the Get Insight Details action. Then find the output.entity.ip.address field and select it.
- Click Create to save the new action.
- Add another action to the playbook by clicking the + icon on the Get VirusTotal Info node you just created and selecting Action. Use the parameters outlined below:
- Name: "Add Entity Enrichment".
- Integration: Sumo Logic Cloud SIEM Internal.
- Type: Notification.
- Action: Add Entity Enrichment.
- Entity ID: Click the cog icon on the right, and select the Get Insight Details action. Then find the output.entity.id field and select it.
- Enrichment Name: "VirusTotal IP Reputation".
- Raw JSON: Click the cog icon, select Get VirusTotal Info, then select output.raw.
- You can leave the other fields blank. Click Create to save the action.
- Playbooks also allow condition nodes that can switch execution branches depending on the true/false results of a given expression. Let’s add a condition node to our playbook that will differentiate the execution branch depending on the severity of the insight.
- Click the + icon under our last action (the blue Add Entity Enrichment action). Choose the Condition node type.
- For the top select a value, select Get Insight Details, and then output.severity option. Make sure == is selected in the middle row.
- For the bottom select a value field, add a manual value: High.
- Click Create to save the Condition node.
- Click the + icon under the Condition node to create a new node. Select Action for this new node. Use the parameters outlined below:
- Name: "Send Notification Email".
- Integration: Basic Tools.
- Type: Notification.
- Action: Send Email.
- For Recipients, enter an email address (real or fake). Make sure you press Enter after typing the email address to signal the Recipients field to parse and accept the email address.
- Type in a subject into the Subject field: “High Severity Insight detected”.
- In HTML Content (Body), click on the
{ }icon to add a parameter field to your text. When composing content for an email notification, you have the option of using input parameters from earlier nodes in the playbook in addition to any desired custom text. - Click on the red parameter box that appears and select a source for the desired input parameter (for instance, Get Insight Details.output.name). The parameter box will turn green once you have selected a valid source parameter. You can add custom text before or after the source parameter.
- Add one or more source parameters and accompanying custom text to outline what you want the email to say (for instance, explain that a high severity insight has been detected with the following details: name, timestamp, and so on).
- Click Create when finished with this action.
- When you’ve created your final node(s) for your playbook, manually drag the mouse cursor from the gray connection circle on the right side of the Email Notification node to the left connection area of the End node. Drag and connect the “failure” end of the condition node to the End node as well.
- Verify that the Start > End node sequence for all branches have been completed. (Note that you can always drag playbook elements anywhere in the playbook canvas for clarity or organization.)
- Click Save (disk) icon at the bottom to save your playbook.
- You can test your playbook before publishing by going to the “triple dot” icon in the upper-right corner and selecting Run Test.
- After testing and troubleshooting playbook details (if needed), click the Publish (clipboard) icon next to the edit/pencil icon to publish your playbook. You can add a description here if you wish.
Create a custom incident template
Incident templates define which attributes will be automatically set each time an incident is generated. These attributes include incident type, classification, assignment, playbooks, and many others. For example, you may want to automatically assign certain incoming incidents to a certain analyst based on their timezone or area of expertise. Or, you might want to automatically run a playbook on all incoming incidents. For more information, see Incident templates.
In this section, we’ll create a custom incident template. This template will automatically assign the playbook you created earlier to certain new incidents, and then automatically run it.
- New UI. In the main Sumo Logic menu select Automation > Template. You can also click the Go To... menu at the top of the screen and select Template.
Classic UI. Click the gear icon in the top right, select Automation, and then select Incident templates in the left nav bar.
 - Near the top, click the + icon to create a new template.
- In the Name field, provide a name for the template.
- In the Category field, enter a category (for example, Test).
- Click the Incident tab.
- Leave the fields as their defaults, and select General for Type.
- Click Apply to create the template. The template is displayed.
- Click the + icon next to Playbook to add a new playbook.
- Select the check mark next to the playbook you created in the previous section.
- Click Add.
- Toggle the Autorun switch to the Enabled (blue) position.
Create a custom automation rule
Automation rules define what happens when data is received from a source. These rules allow specific data to be parsed from the incoming data sources and then acted upon automatically. For more information, see Automation rules.
Automation rules can automatically pull information from sources. They can also execute playbooks based on certain criteria. For example, you might want to pull Insights from Cloud SIEM once an hour and create incidents from them. Then, you could configure a rule that runs a playbook based on the tags in the incident. This way, the entire incident response cycle is automated: Cloud SIEM identifies a threat, and playbooks in Cloud SOAR are automatically deployed to contain and eradicate the threats, restore systems, and email a final report for an analyst to review.
Let's create a custom automation rule. This rule will pull information from Cloud SIEM every 5 hours.
- New UI. In the main Sumo Logic menu select Automation > Rules.
Classic UI. Click the gear icon in the top right, select Automation, and then select Rules in the left nav bar.
 - Near the top, click the + icon to create a new rule.
- Enter a Name for the rule.
- For Integration daemon, select Sumo Logic Insights Daemon Extended.
- For Integration resource, select Sumo Logic CSE Resource.
- For Search performed every, type 5 then select Hours.
- Leave the other fields as their defaults, then click Save.
- As a best practice, you can enable and test the new rule, but then disable it, since it can disrupt your environment. Continue testing your rule until their behavior is expected before deciding to enable it.
Additional resources
- Blogs:
- Why you need both SIEM and SOAR to improve SOC efficiencies and increase effectiveness
- Cloud-native SOAR and SIEM solutions pave the road to the modern SOC
- SIEM vs SOAR: Evaluating security tools for the modern SOC
- Overwhelmed: Why SOAR solutions are a game changer
- How to improve MTTD and MTTR with SOAR
- How to implement cybersecurity automation in SecOps with SOAR (7 simple steps)
- Briefs