Partner App Template
Copy this file and edit it for your App integration.
(Introduction about the app)
\Add the description from the app description above\
Log types and metrics
The {AppName} App uses...
\Enter a list of log types, usually hyperlinked to vendor docs.\
Sample log and metrics messages
Log message
\<add your log message here\>
Metric message
\<add your log message here\>
Sample queries
Log query
\<add your query here\>
Metric query
\<add your query here\>
Prerequisites (Optional)
\Any steps like permissions or roles that the user should have for configuring the collection steps.\
Collection configuration and app installation
\This section instructions for collecting logs, metrics, or logs and metrics. You can also give link to collection docs if they are hosted publicly. Include a diagram, as appropriate. For an example, see Collection process for GCP services.\
Step 1.
\step description\
Step 2.
\step description\
Step n.
\step description\
Install the {AppName} app
To install the app:
- Select App Catalog.
- In the 🔎 Search Apps field, run a search for your desired app, then select it.
- Click Install App.
note
Sometimes this button says Add Integration.
- On the next configuration page, under Select Data Source for your App, complete the following fields:
- Data Source. Select one of the following options:
- Choose Source Category and select a source category from the list; or
- Choose Enter a Custom Data Filter, and enter a custom source category beginning with an underscore. For example,
_sourceCategory=MyCategory.
- Folder Name. You can retain the existing name or enter a custom name of your choice for the app.
- All Folders (optional). The default location is the Personal folder in your Library. If desired, you can choose a different location and/or click New Folder to add it to a new folder.
- Data Source. Select one of the following options:
- Click Next.
- Look for the dialog confirming that your app was installed successfully.
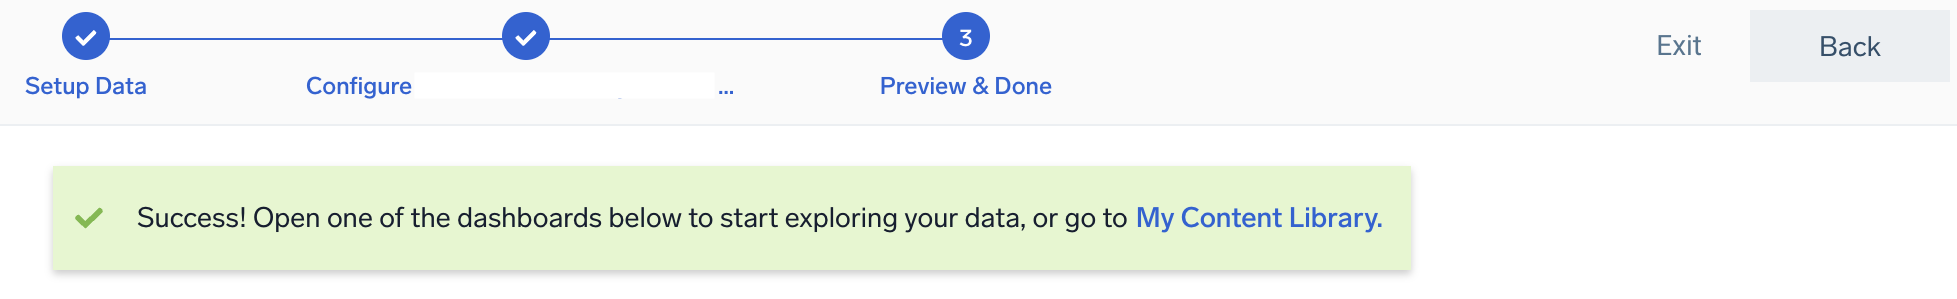
Post-installation
Once your app is installed, it will appear in your Personal folder or the folder that you specified. From here, you can share it with other users in your organization. Dashboard panels will automatically start to fill with data matching the time range query received since you created the panel. Results won't be available immediately, but within about 20 minutes, you'll see completed graphs and maps.
Viewing the {AppName} dashboards
All dashboards have a set of filters that you can apply to the entire dashboard. Use these filters to drill down and examine the data to a granular level.
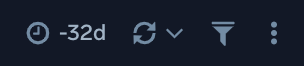
- You can change the time range for a dashboard or panel by selecting a predefined interval from a drop-down list, choosing a recently used time range, or specifying custom dates and times. Learn more.
- If required, configure the refresh interval rate for a dashboard or panel by clicking the drop-down arrow next to the refresh icon.
- Click the funnel icon in the dashboard top menu bar to filter dashboard with Template Variables.
Dashboard 1
\Descriptions of each app dashboard.
\This section has dashboard description, use cases, and screenshot for each dashboard.\
The Overview Dashboard provides a quick snapshot of ....
Use this dashboard to:
- \use-case-1\
- \use-case-2\
Dashboard 2
View stats and metrics related to ...
Use this dashboard to:
- \use-case-1\
- \use-case-2\
Support
This application has been developed and is supported by {app-owner-name}. In case of any technical queries, contact support at support contact.