Introduction to Cloud SIEM for Analysts
This article provides an introduction to Cloud SIEM for analysts.
If you are unsure whether you are an analyst or administrator, you can view your role in Preferences (see Onboarding Checklists). To use Cloud SIEM as an analyst, you must be assigned Cloud SIEM role capabilities that allow you to view Cloud SIEM elements and perform analyst tasks.
From logs to security insights
What is Cloud SIEM?
Cloud SIEM is a security information and event management (SIEM) system. Cloud SIEM leverages Sumo Logic's core functionality, including data collection, ingestion, storage, and threat intelligence.
The following images show Sumo Logic's Cloud SIEM home page.
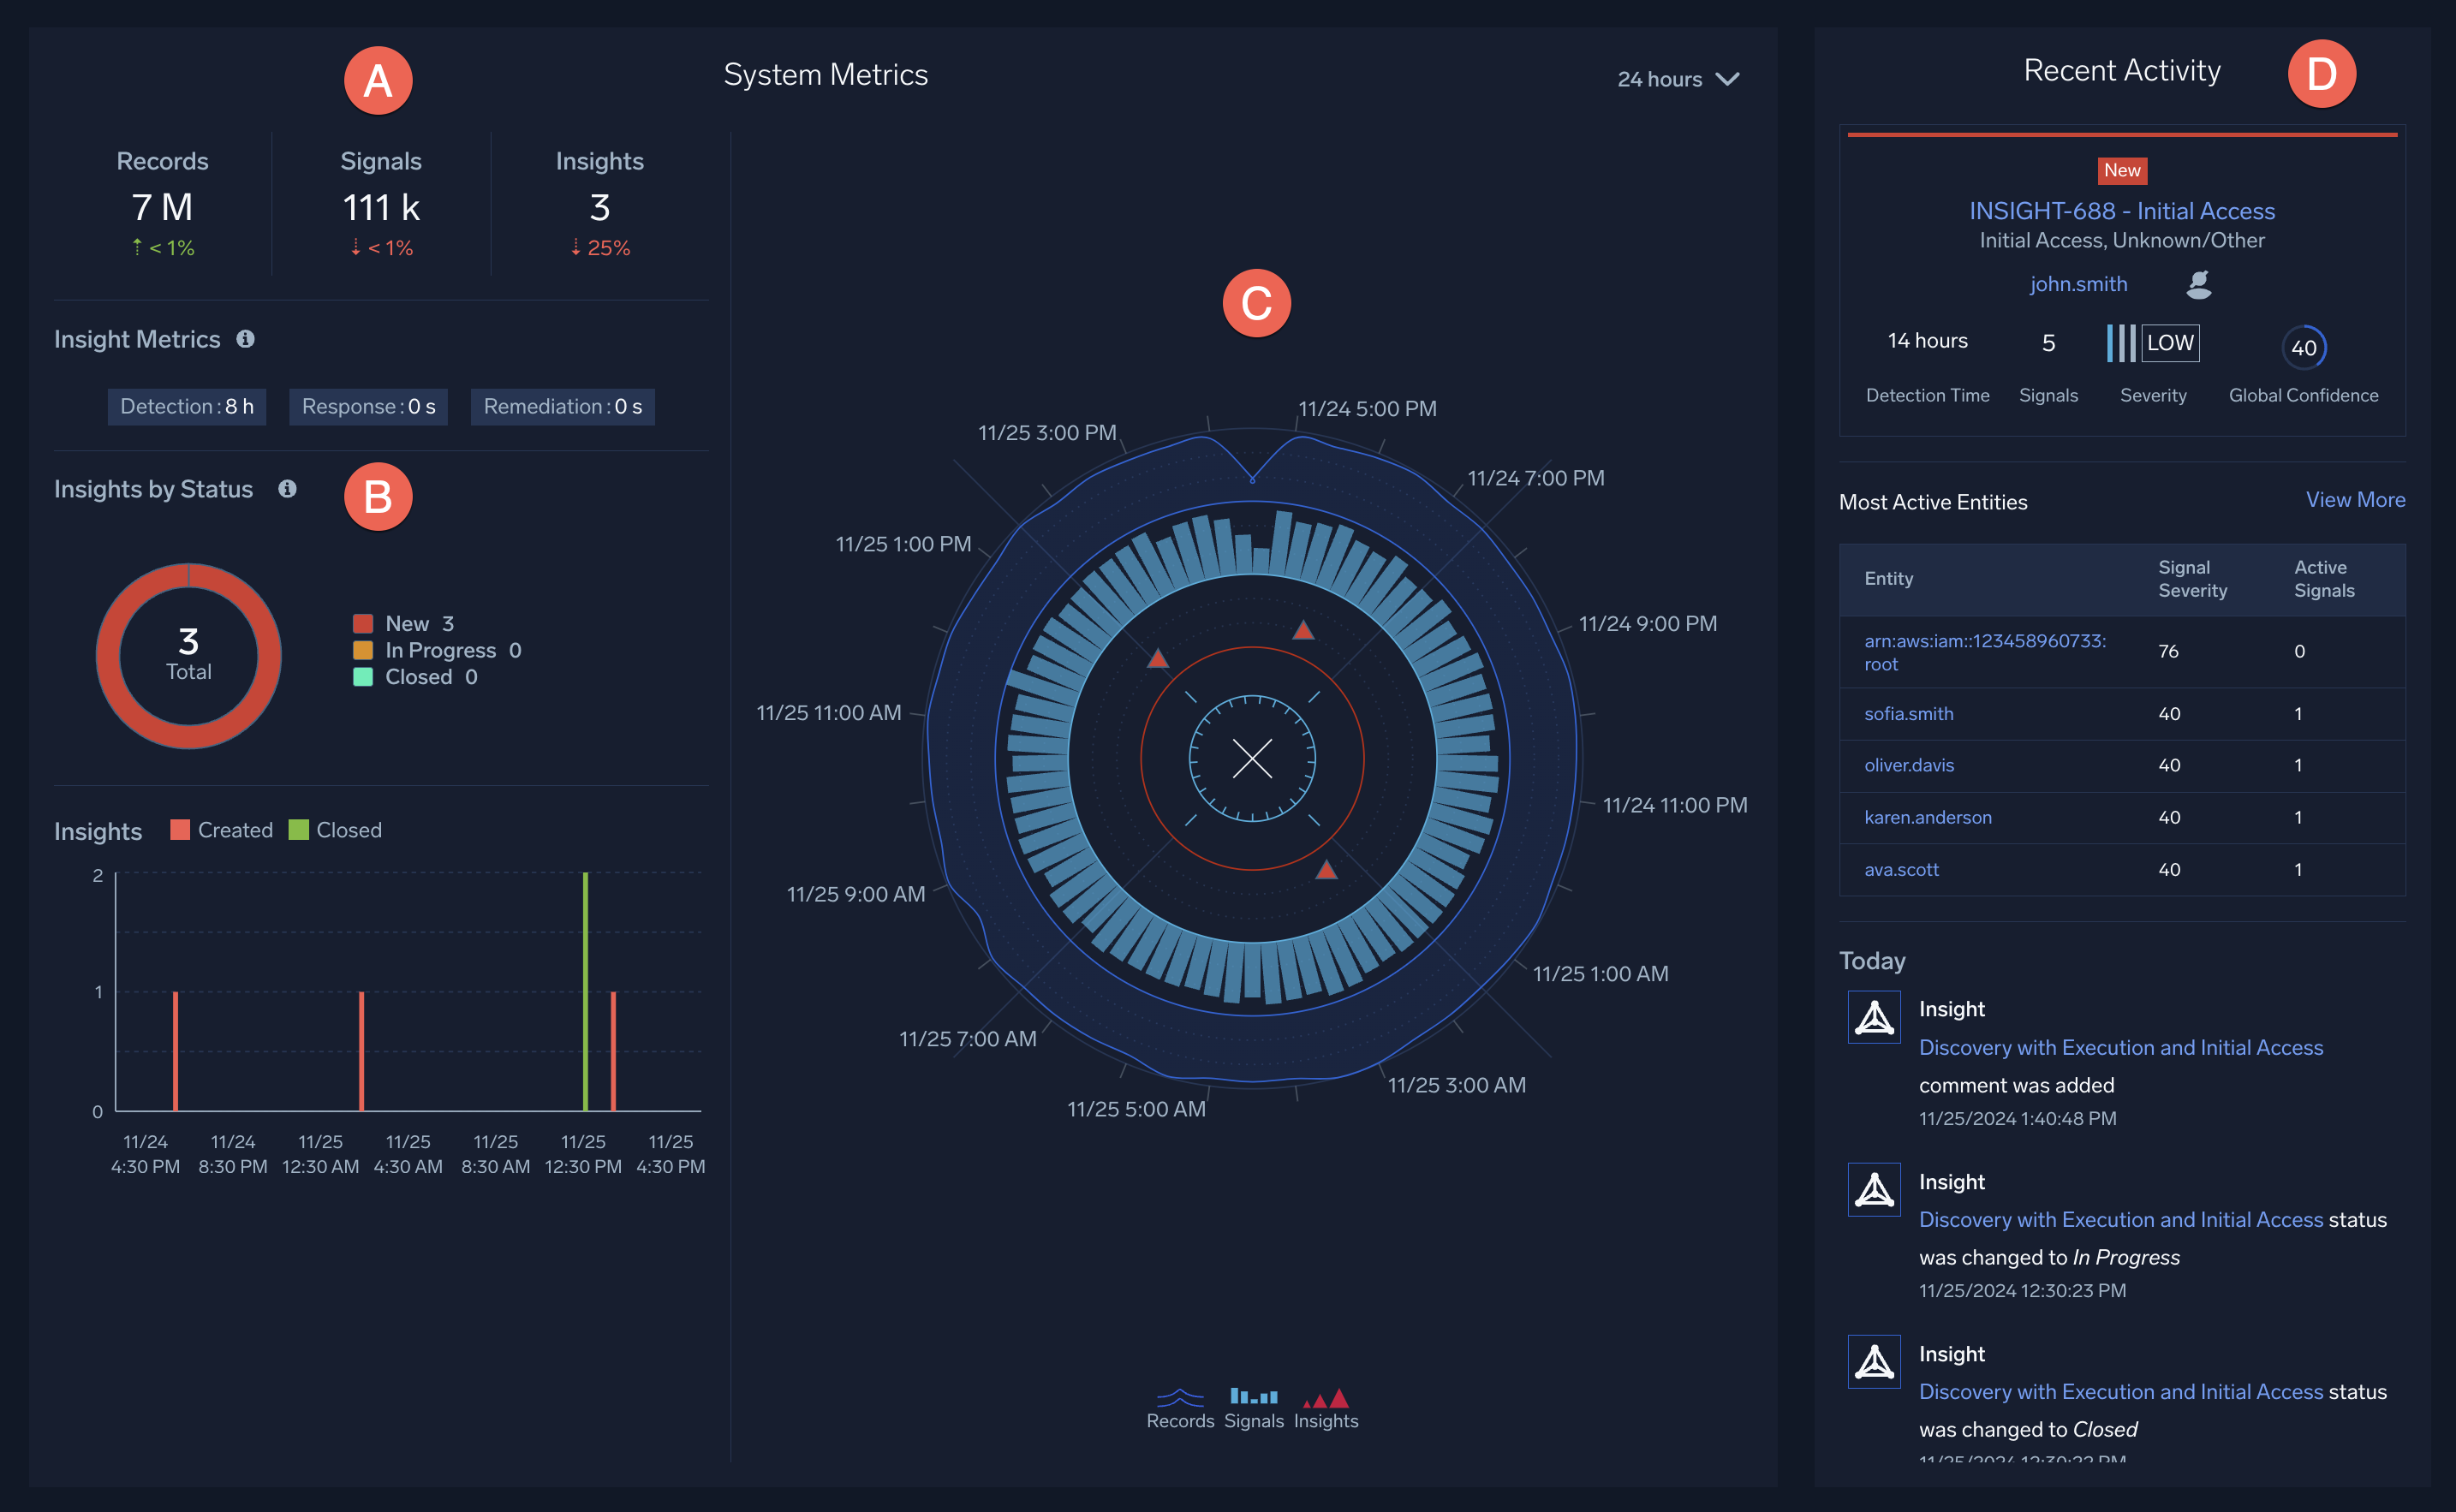
- A. Count. A count of the records created from incoming messages, and the signals and insights that have been generated.
- B. Insights by Status. An overview of recent insights and their statuses: New, In Progress, Closed, or Other.
- C. Radar. Visualizes the last 24 hours of security activity. Dark blue lines represent records, light blue bars represent signals, and red triangles represent insights.
- D. Recent Activity. Displays a feed of the latest insights that have been generated.
Cloud SIEM is a purchased add-on with an ever-expanding library of content designed for security operations. Cloud SIEM automatically normalizes, enriches, and correlates all your data across multiple data sources into actionable security insights. Because it's designed for larger data volumes, most organizations need to ingest a large amount of data each day for insights to surface in Cloud SIEM. For smaller organizations, additional security features may be a better fit for your data ingest volume.
Getting your data into Cloud SIEM
If you already use Sumo Logic, you're probably familiar with the data pipeline:

- Data collection. To use Sumo Logic, first you must set up either an installed collector or a hosted collector and add a source. You can also set up source categories and other metadata, which helps you search and analyze the data you collect.
- Search and analyze. Once data is in Sumo Logic, you can write queries to search and correlate events in real-time from the analytics platform UI. Or, you might configure the collector to forward data to Cloud SIEM, and let it do all the correlation work for you.
- Visualize and monitor. Once you've found and analyzed data that's interesting, you can create dashboards to visualize it and set up alerts to monitor your data in real-time.
- Share the findings. Export your dashboards or share with others on your team. You can control who can view and edit your dashboards to keep your data secure.
Throughout this section, you'll learn more about the security data pipeline. Then, you'll be better prepared to discuss these things with your admin, or to set them up yourself if you need to.
Data collection
Before you can start investigating threats, you need data. As a data analyst, this step may have been done by your administrator.
Your company collects and ingests millions of log messages into Sumo Logic. Typically, you can use these messages right away in many Sumo Logic apps. To use them in Cloud SIEM, however, your admin must enable data forwarding. Your admin may also need to create log mappings, field extraction rules, or complete other preprocessing steps to extract the right data.

As a data analyst, you should periodically examine the data that's being ingested into Sumo Logic and Cloud SIEM. After you've been using Cloud SIEM for a while, you may want to fine-tune it to fit your organization's needs. If you discover that you're ingesting too much or too little data to do threat hunting, you can work with your admin to find that balance.
So, what's the balance between too much and too little data? It depends. Work with your admin to answer these questions:
- Are you ingesting enough data? Cloud SIEM takes thousands or millions of records and boils them down into just a handful of insights. Most organizations ingest more than 50GB of data every day to start finding any insights. If your ingest volume is smaller than this, consider sending more data to Cloud SIEM.
- Are you ingesting too much data? More data doesn't always mean more insights. The threat detection logic built into Cloud SIEM generally prevents false positives. However, some organizations choose to ingest or store less data as a way to cut costs. One solution is partitioning your data into different tiers, and only sending some of that data along to Cloud SIEM.
- Are you ingesting the right data? Cloud SIEM doesn't just work on quantity alone. Quality data will affect your performance as well. As a best practice, you'll need to bring in quality data sources that are supported by Cloud SIEM. High-value data sources include CloudTrail logs, Windows event logs, AWS logs, and GuardDuty logs.
Processing your data for Cloud SIEM
Before Cloud SIEM can generate security insights, your log messages must go through a little processing first. First, Cloud SIEM processes the messages into records. Each record contains the information from a message, which is parsed into key-value pairs, mapped to a Cloud SIEM schema, and enriched with other data.

Let's follow a simple log message down this pipeline:
sso : ip-192-0-2-0 : alex@travellogic.com :
"Successful Login" : "2024-05-25T22:11:42"
First, the message is parsed into a set of key-value pairs. This process also fixes basic formatting. This step creates semi-structured data. For example, instead of ip-192-0-2-0, the parsing step extracts the IP address into a key-value pair, where the key is something like srcDeviceIP and the value is 192.0.2.0, with the hyphens normalized to dots. Then, this information is mapped onto the Cloud SIEM schema. Finally, the record is enriched with information from match lists or Sumo Logic threat intelligence. These normalized records are then sent down the Cloud SIEM pipeline and compared to rules.
Extracting security insights from Cloud SIEM
Each record ingested into Cloud SIEM is compared to hundreds of built-in and custom rules. If a record matches the criteria specified in a rule, then Cloud SIEM creates a signal. When a signal is created, it contains a name, entity, severity, stage, and description. A signal always contains, at minimum, an entity and a severity. This data is later used by Cloud SIEM's insight engine algorithm.
A signal is an individual security event. The entity in a signal is something like an IP address, MAC address, or hostname. The entity tells us who or what was involved in the event that the record described. The stage or tags are assigned based on where the event fits in the MITRE ATT&CK framework. This can tell us a bit about how or why the event occurred. The severity is a number between 0 and 10 that tells Cloud SIEM how serious the potential threat is.
Let's look at the details of one signal:
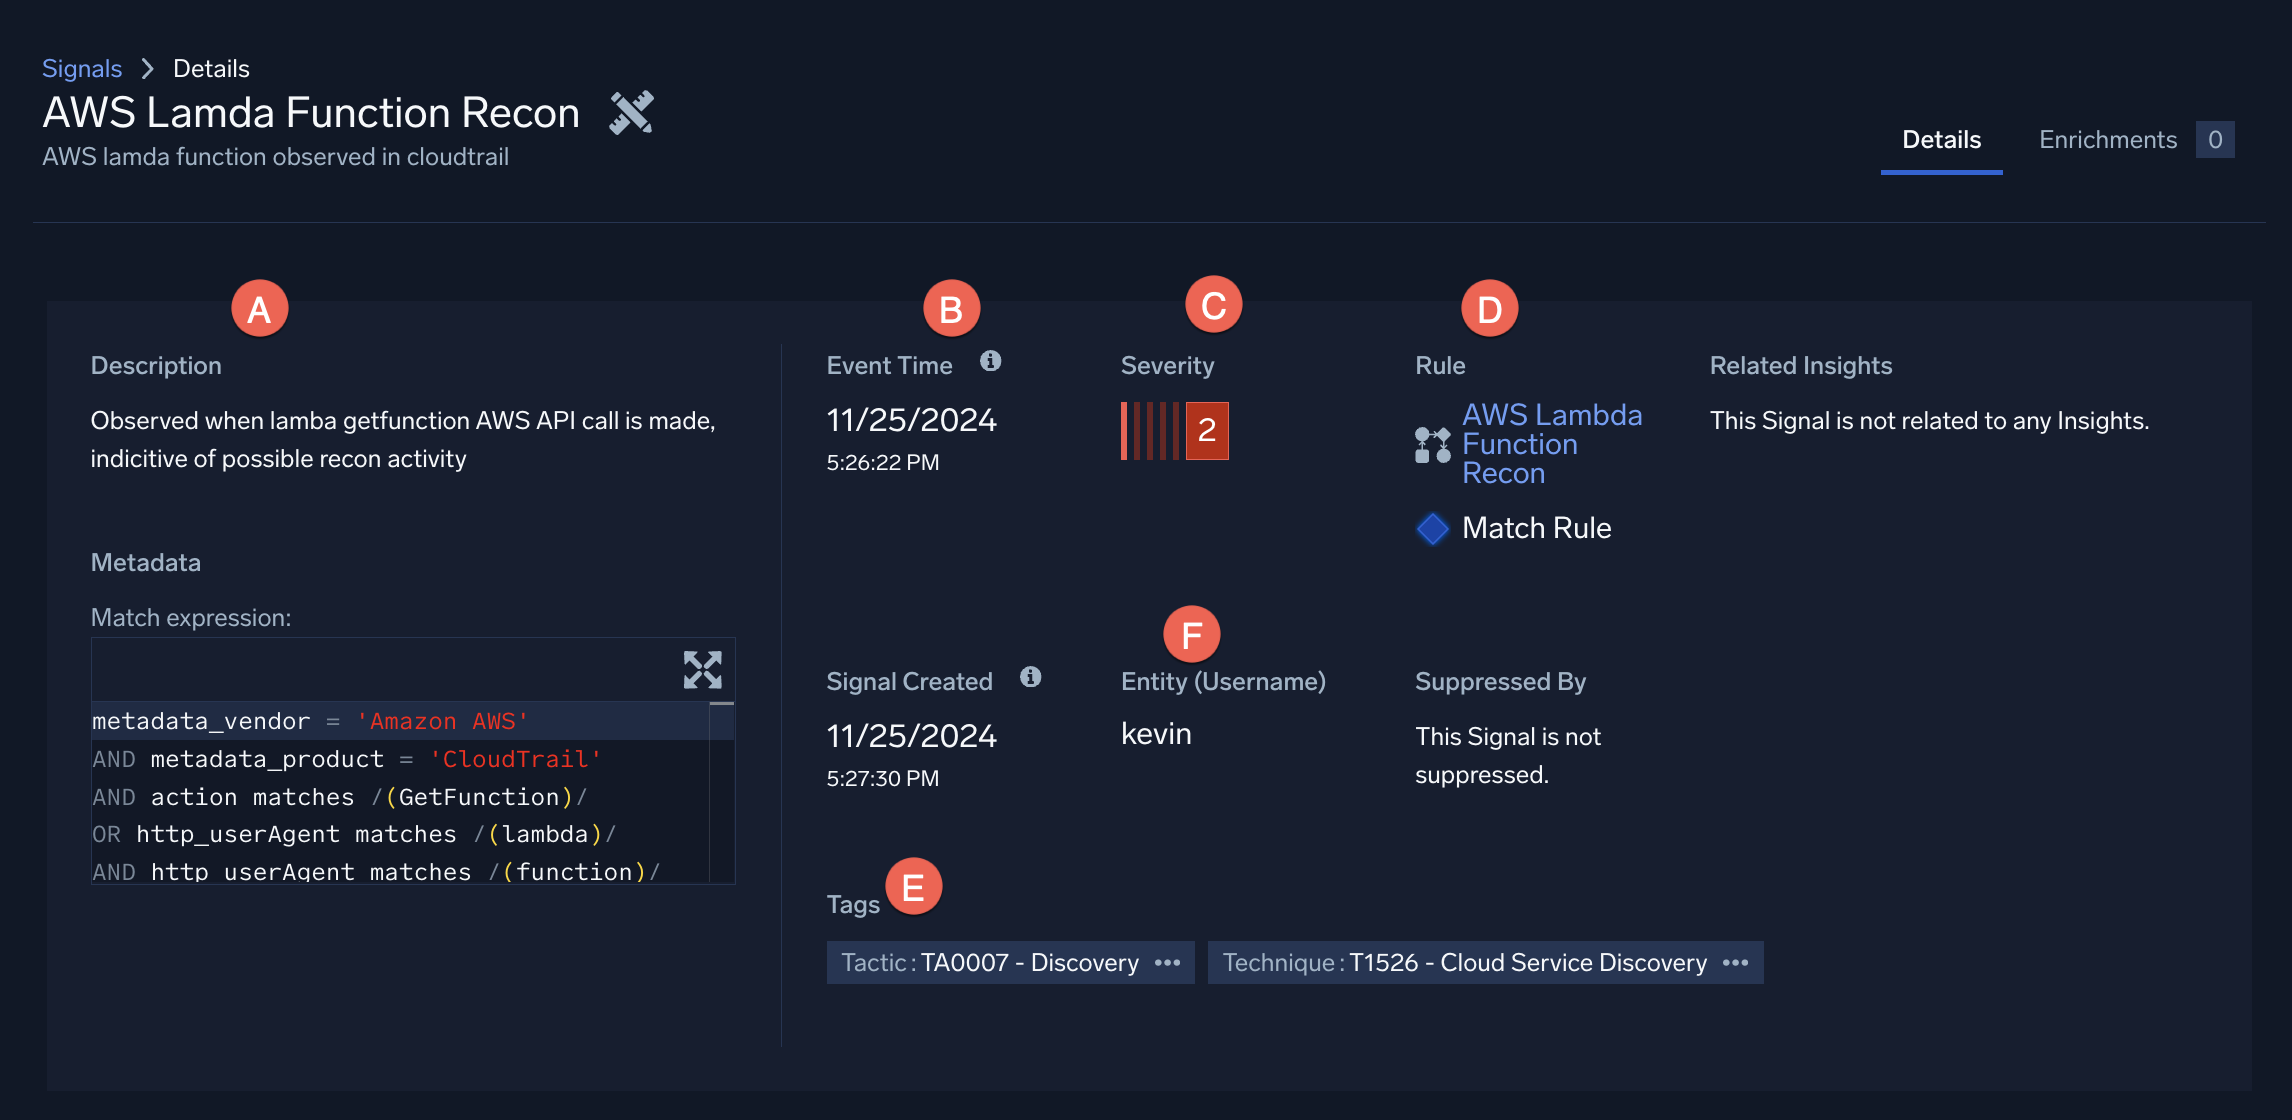
- A. Description. Every signal's details page includes a description, detailed metadata, and other information to help your threat investigation.
- B. Event Time. The event time tells you when the event occurred.
- C. Severity. A signal's severity score is a number between 0 and 10. This score is used to track the entity's activity score.
- D. Rule. Signals are created when the conditions of a rule are met. You can click on the rule from the signal's details page to learn more.
- E. Tags. Tags or stages use the MITRE ATT&CK framework to point you toward how or why an event occurred.
- F. Entity. The entity can be any unique identifier like an IP address. In this case, it's a username.
Cloud SIEM typically processes thousands or millions of records and boils them down into hundreds of signals.

On the Cloud SIEM main page, you'll see a panel similar to this one. In this case, 52 thousand records have been ingested and processed into 4 thousand signals. Some signals could be false alarms, but many could be worth investigating anyway. But, 4 thousand is still way too many for the average SOC analyst to sift through every day. So, how do you know which signals to pay attention to first?
Cloud SIEM takes everything one step further and correlates those signals into a manageable number of insights. Here, just 1 insight was created out of 4 thousand signals.
An insight is a group of signals clustered around a single entity. An insight is created when the sum of the severity scores of signals with the same entity goes above a certain activity score within a certain timeframe. By default, this is an activity score of 12 within the last 14 days. For example, if a rule was triggered with a severity of 5, and then ten days later another rule with the same entity and a severity of 5 was triggered, the total activity score would only be 10 in the last 14 days, so an insight would not be created. However, if those same two rules each had a severity score of 7, an insight would be created.
Explore the Cloud SIEM UI
- New UI. In the main Sumo Logic menu select Cloud SIEM > SIEM Overview. You can also click Go To... at the top of the screen and select SIEM Overview.
Classic UI. In the main Sumo Logic menu select Cloud SIEM. - Near the top of the left pane of the Cloud SIEM UI, you'll see summary statistics. In the upper right corner of this pane, a dropdown menu lets you select the timeframe for the summary statistics. Use the summary panel and the dropdown to answer these questions:
- How many records have been ingested in the last 8 Hours?
- How many signals have been created in the last 7 Days?
- How many insights have been created in the last 24 Hours?

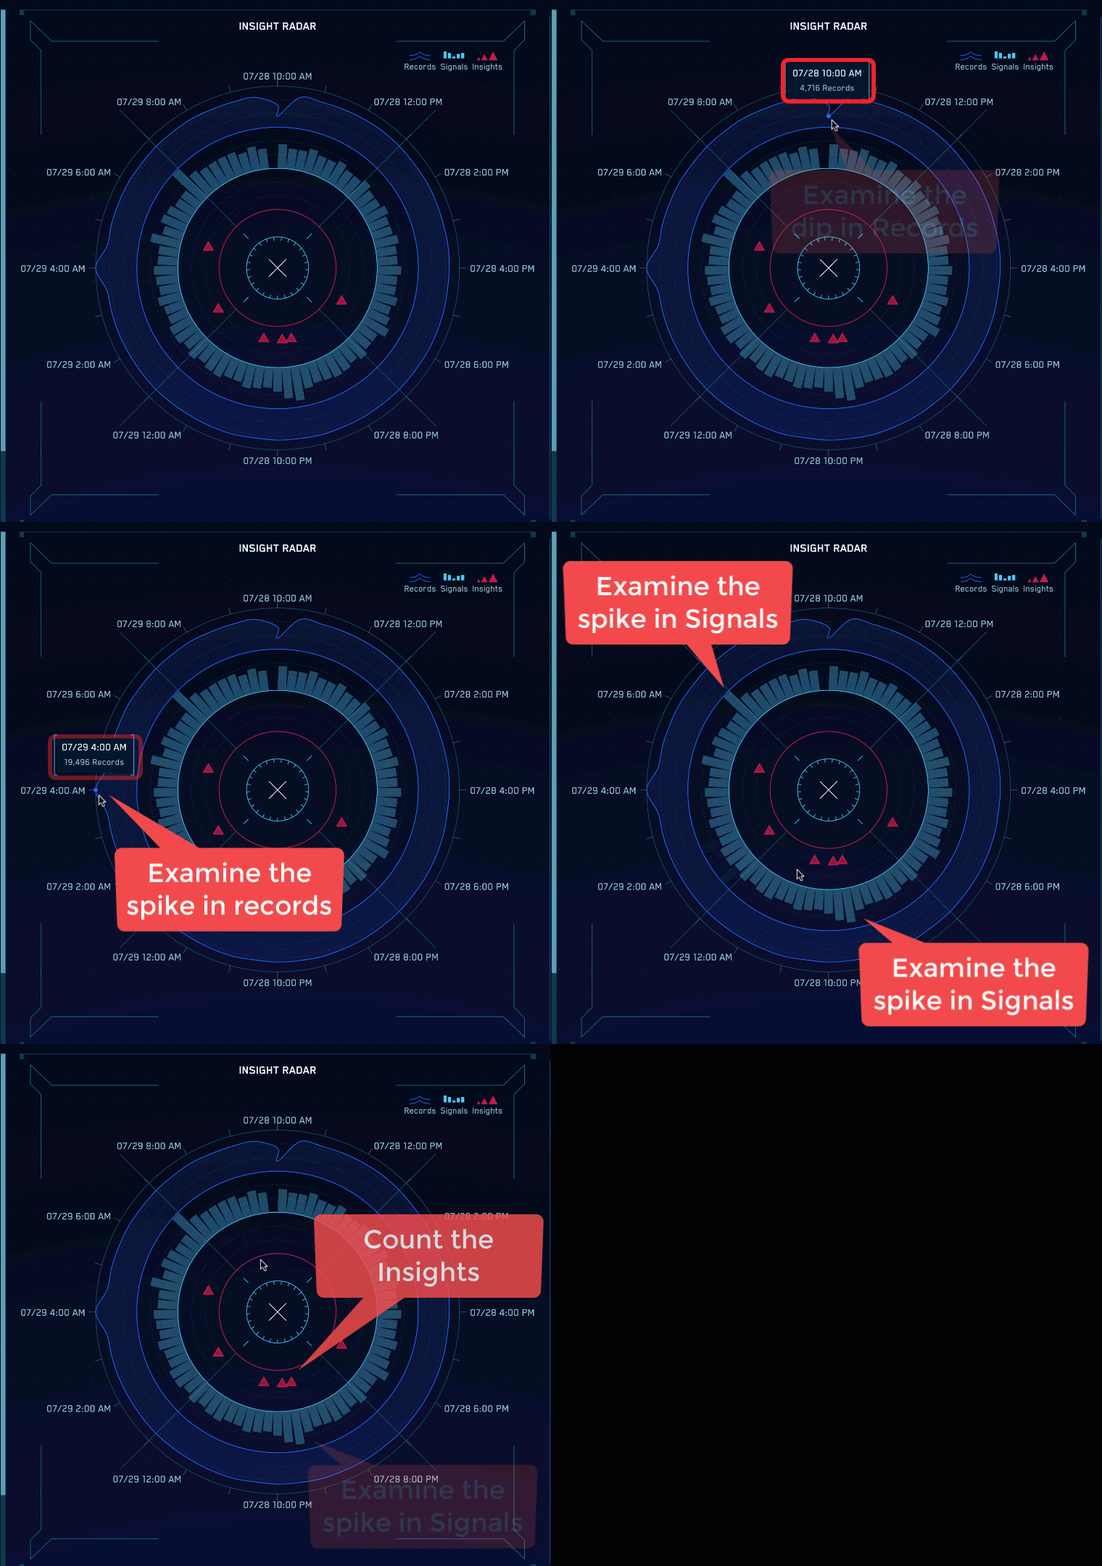
- In the center of the Cloud SIEM HUD is the insight radar. Hover over each piece of the radar to answer these questions:
- What time were the most records ingested in the last 24 hours? When were the fewest records ingested? Hint: Hover over the blue line to find out how many records were ingested at each time increment.
- What time were the most signals created in the last 24 hours? When were the fewest signals created? Hint: Hover over each bar to find out how many signals were generated at each time increment.
- How many insights have been generated in the last 24 hours? Hint: Each triangle represents one or more insights, so hover over each to find the number of insights each represents.
- New UI. In the main Sumo Logic menu, select Cloud SIEM > Rules. You can also click the Go To... menu at the top of the screen and select Rules.
Classic UI. In the top menu select Content > Rules. - Use the Filters bar in the Rules page to answer these questions:
- How many rules have a name that contains "firewall"? Hint: Use the autocomplete suggestions and dropdown menus to enter
Name contains firewallin the Filters bar. - How many rules have a severity score greater than 8?
- How many rules detect the "persistence" tactic"?
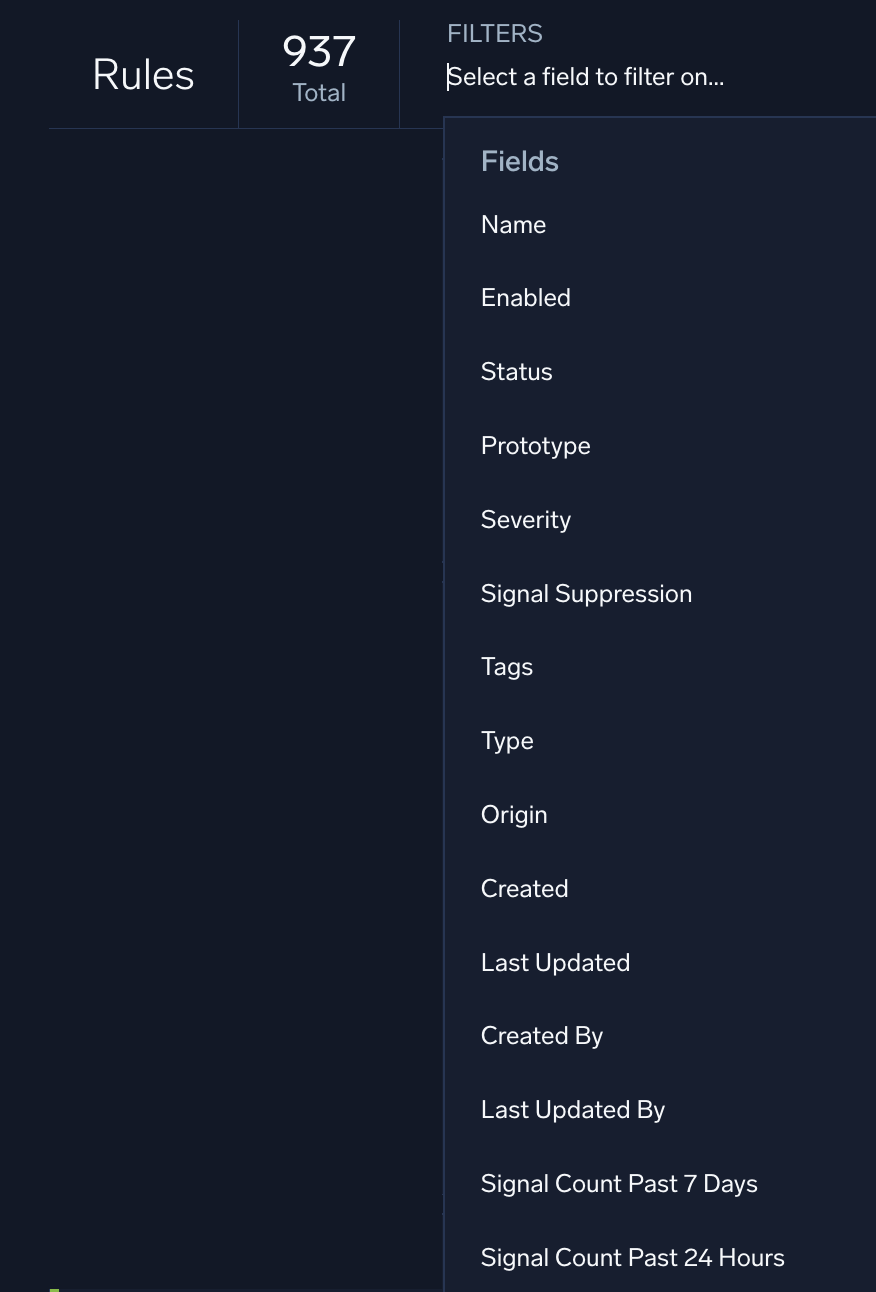
- How many rules have a name that contains "firewall"? Hint: Use the autocomplete suggestions and dropdown menus to enter
- New UI. In the main Sumo Logic menu, select Cloud SIEM > Entities. You can also click the Go To... menu at the top of the screen and select Entities.
Classic UI. Click Entities at the top of the screen. - Use the Filters bar in the Entities page to answer these questions:
- How many entities have an activity score of 5 or greater? Hint: Use the autocomplete suggestions and dropdown menus to enter
Activity Score greater than5 in the Filters bar. - How many entities have an activity score of 0?
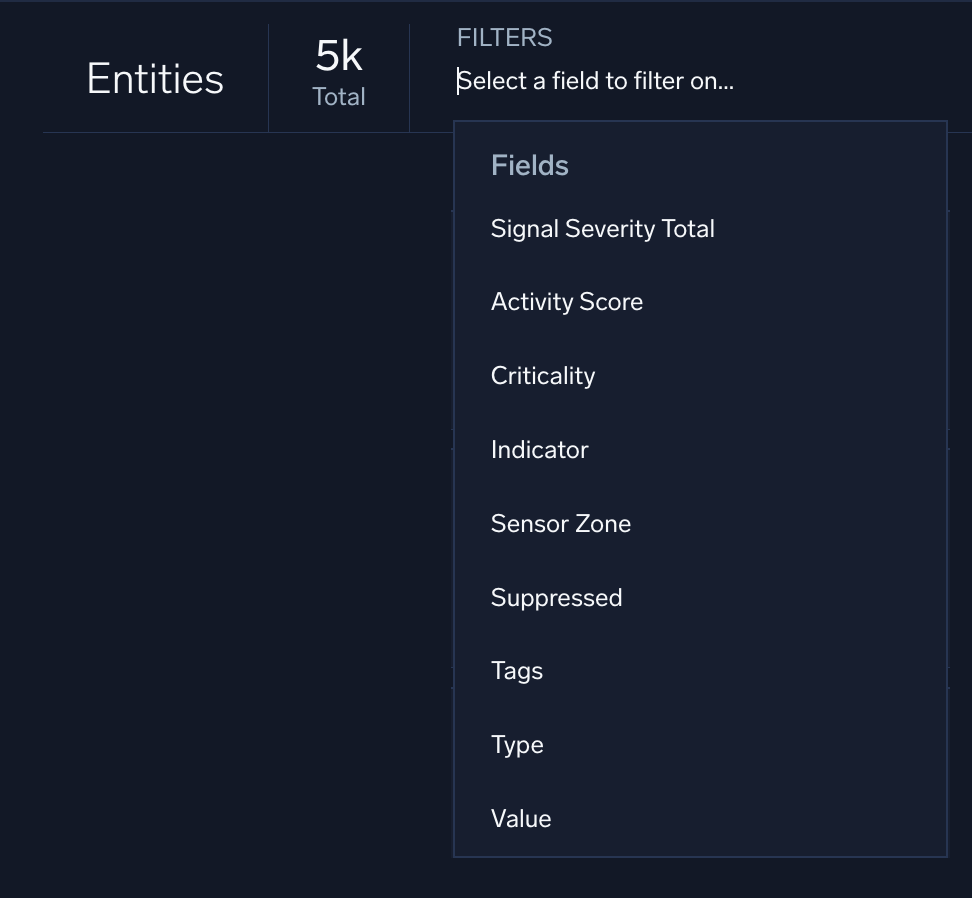
- How many entities have an activity score of 5 or greater? Hint: Use the autocomplete suggestions and dropdown menus to enter
Your answer to all these questions may vary. Make sure you feel confident navigating the Cloud SIEM UI to find all this information.
- Filters persist each time you search. This is great if you want to drill down into subsets of data.
- Depending on your monitor size and the zoom settings of your browser, you may see two panes instead of three on the Cloud SIEM HUD. Try resizing your browser and adjusting your zoom settings to suit your needs.
- Depending on your monitor size and the zoom settings of your browser, you may only see the icons, and not the words, in the top navigation bar. Try resizing your browser and adjusting your zoom settings to suit your needs.
Introduction to threat investigation
Different threats but one platform
In this section, we'll help three fictional companies investigate their threats. Each company has their own unique security and compliance concerns.
- Company 1 is a small retail business with a big tech idea: automate the entire coffee business from bean to cup. In addition to consumer protections like PCI DSS, their main concerns include keeping compute costs down while their startup grows.
- Company 2 is a healthcare company that ships prescription meds to patients. While they meet all HIPAA standards and guidelines, they're still concerned about data privacy. They want to monitor all their data to make sure their patients are safe and healthy in the digital world, too.
- Company 3 is a major player in the banking industry. They meet all the GDPR and other international compliance standards but worry their big investors are still targets for hackers.
Sumo Logic can help all of these companies meet their different security and compliance goals. Moreover, Cloud SIEM can help them identify potential threats before they become a problem.
Think about it: What security and compliance issues are you most concerned about in your company today? How has that changed over the years? How were security concerns different at other companies you've worked for in the past?
Using the MITRE ATT&CK matrix
The MITRE ATT&CK matrix is published by MITRE, a non-profit research organization. ATT&CK stands for Adversarial Tactics, Techniques, and Common Knowledge.
The framework organizes and categorizes the tactics and techniques that hactivists, cyber criminals, nation states, scripters, and other adversaries use. This includes attacks like exfiltrating databases, installing malware, stealing credentials, and all the other nefarious activities you and your SOC team are trying to stop.
Cloud SIEM uses these same tactic names for the stages of signals and the names of insights. Once you're familiar with ATT&CK, navigating Cloud SIEM's insights page becomes easier.
Let's return to our fictional companies, and which MITRE ATT&CK tactics and techniques they might prioritize:
- Company 1 monitors their infrastructure to make sure their apps are as efficient as possible. Execution is a particular concern, since many executable files use precious compute resources.
- Company 2 is concerned about their patients' privacy and compliance with standards like HIPAA. Exfiltration of private data is a major concern.
- Company 3 needs to keep their client's data secure. Credential access is a concern, since all customers have user credentials tied to their financial accounts.
If you read the news, or are familiar with other cybersecurity frameworks like the Pyramid of Pain, you know there are many kinds of threats out there. It's easy to become overwhelmed. However, Cloud SIEM helps organize all the potential threats in your system into one manageable dashboard, leveraging the knowledge found in the MITRE ATT&CK matrix along with the insights algorithm.
Get started with threat investigation
Threat investigation is reactive while threat hunting is proactive. Typically, threat investigation happens in response to an alert. Once you've investigated a threat, you can hunt for similar threats and take precautionary steps to prevent attacks from happening again.
Threat investigation is an iterative process, much like troubleshooting. In both threat investigation and troubleshooting, you first monitor your systems. Once an anomaly is detected, you can make a hypothesis about how it happened and diagnose the problem. As you dig deeper, you may revise this initial hypothesis and find more clues about why or how the attack or error happened. You can then take action to resolve the issue.
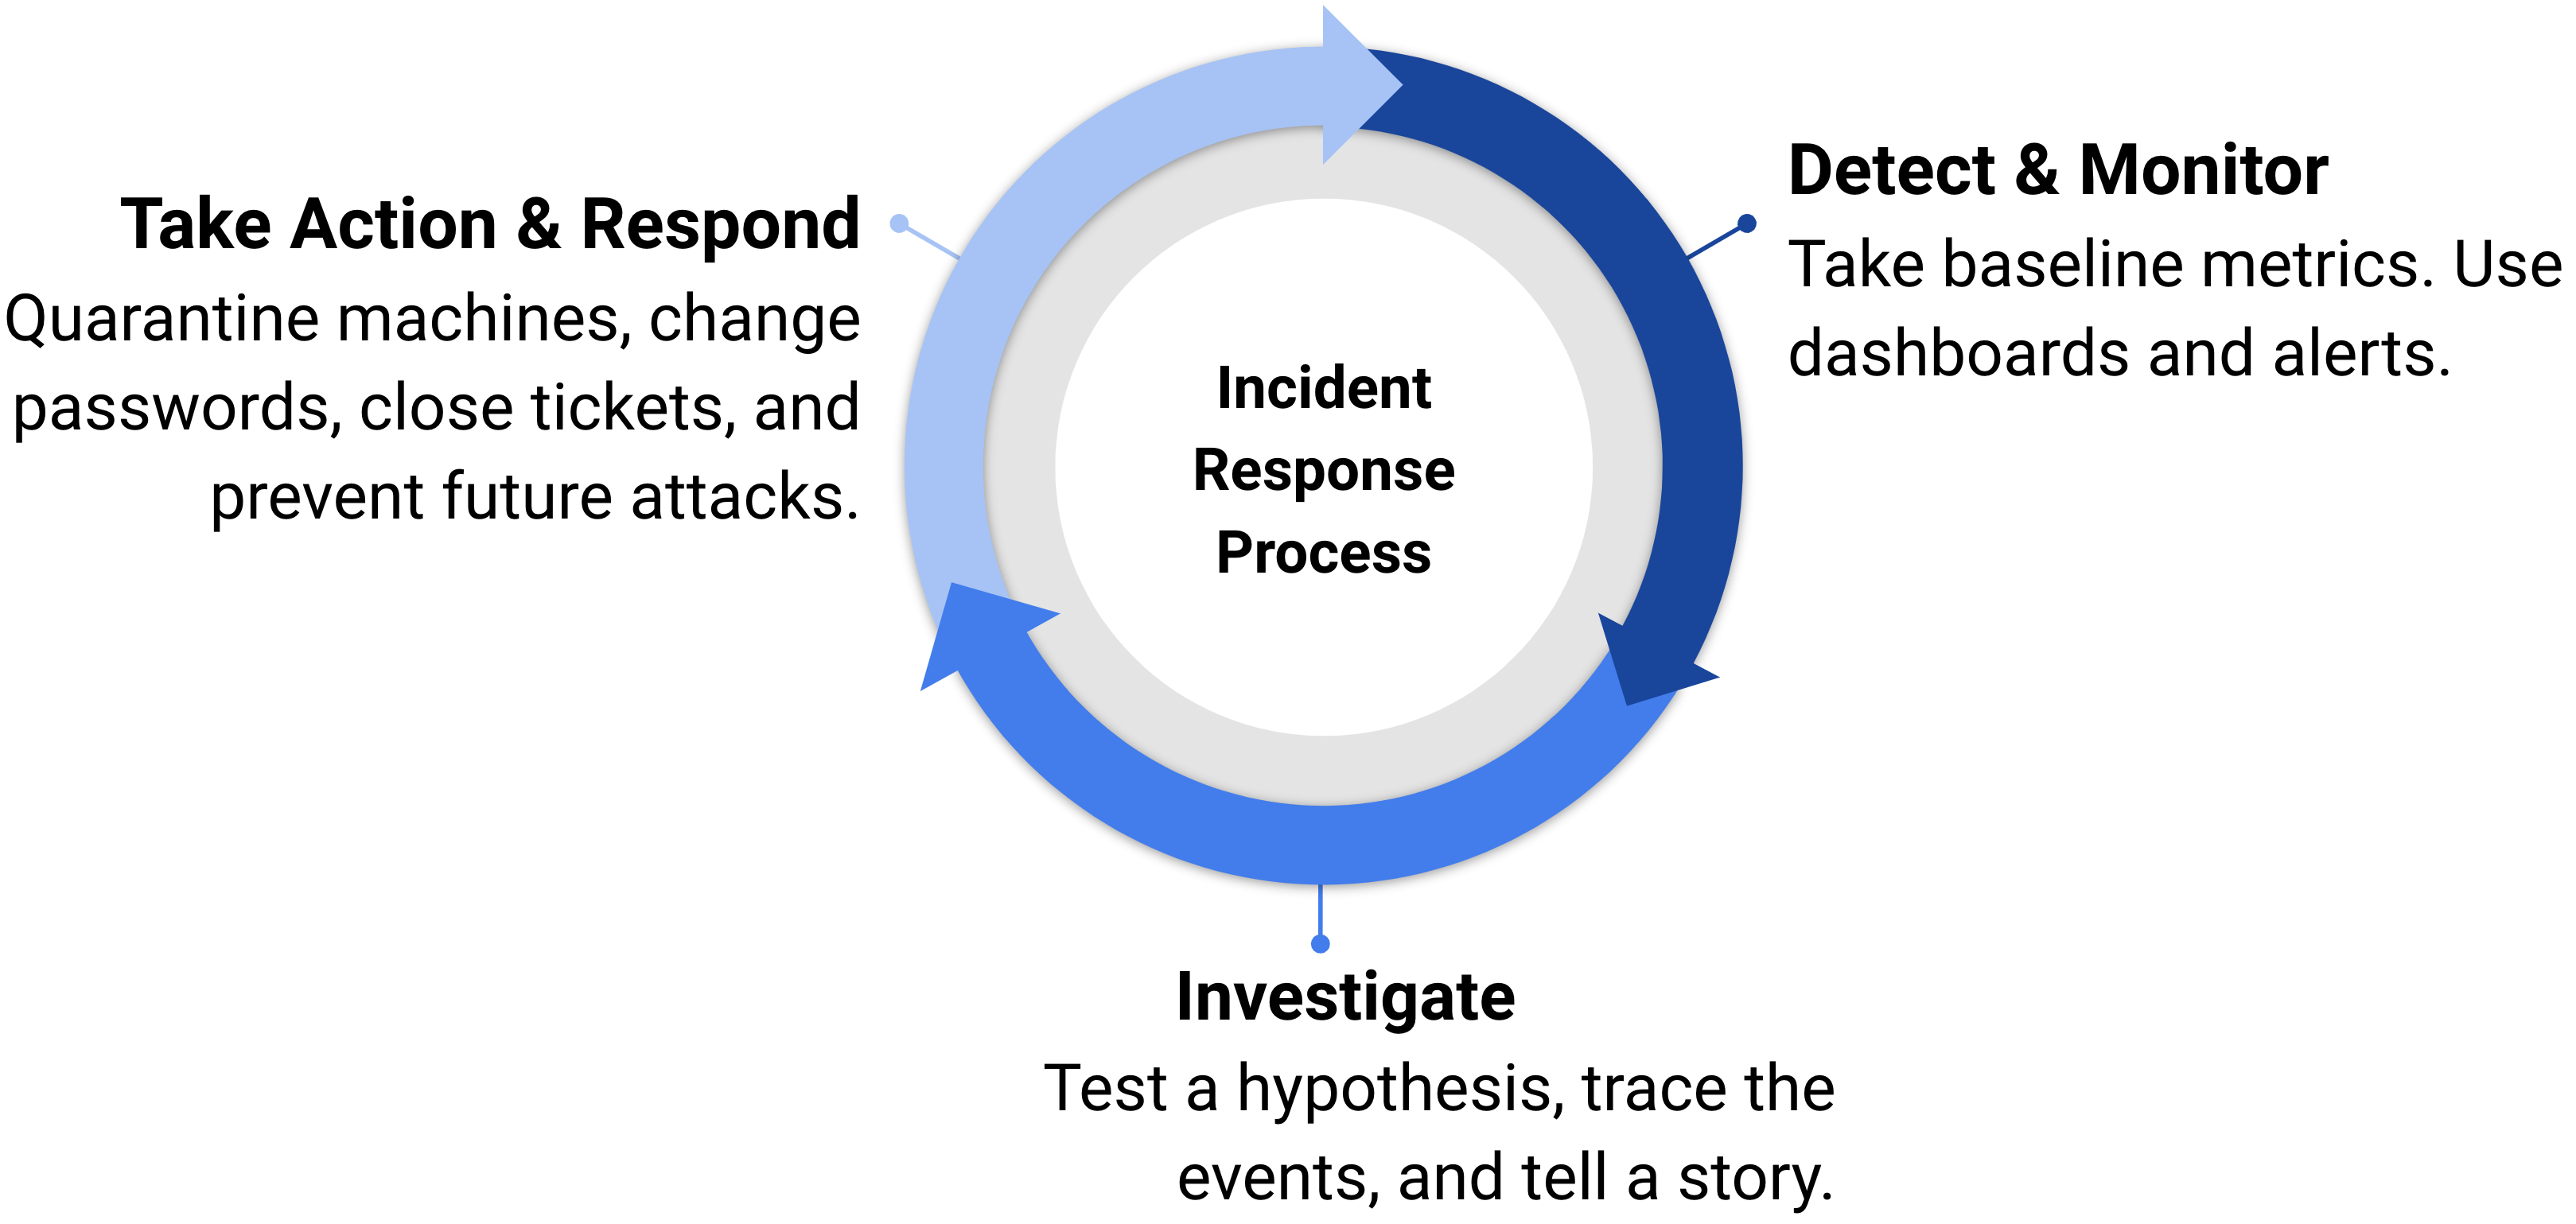
Cloud SIEM acts as your first line of defense, monitoring your system. Cloud SIEM's threat intelligence and correlation algorithms organize related potential security events into insights. When you get alerted to an insight, it's up to you to diagnose the problem and take action.
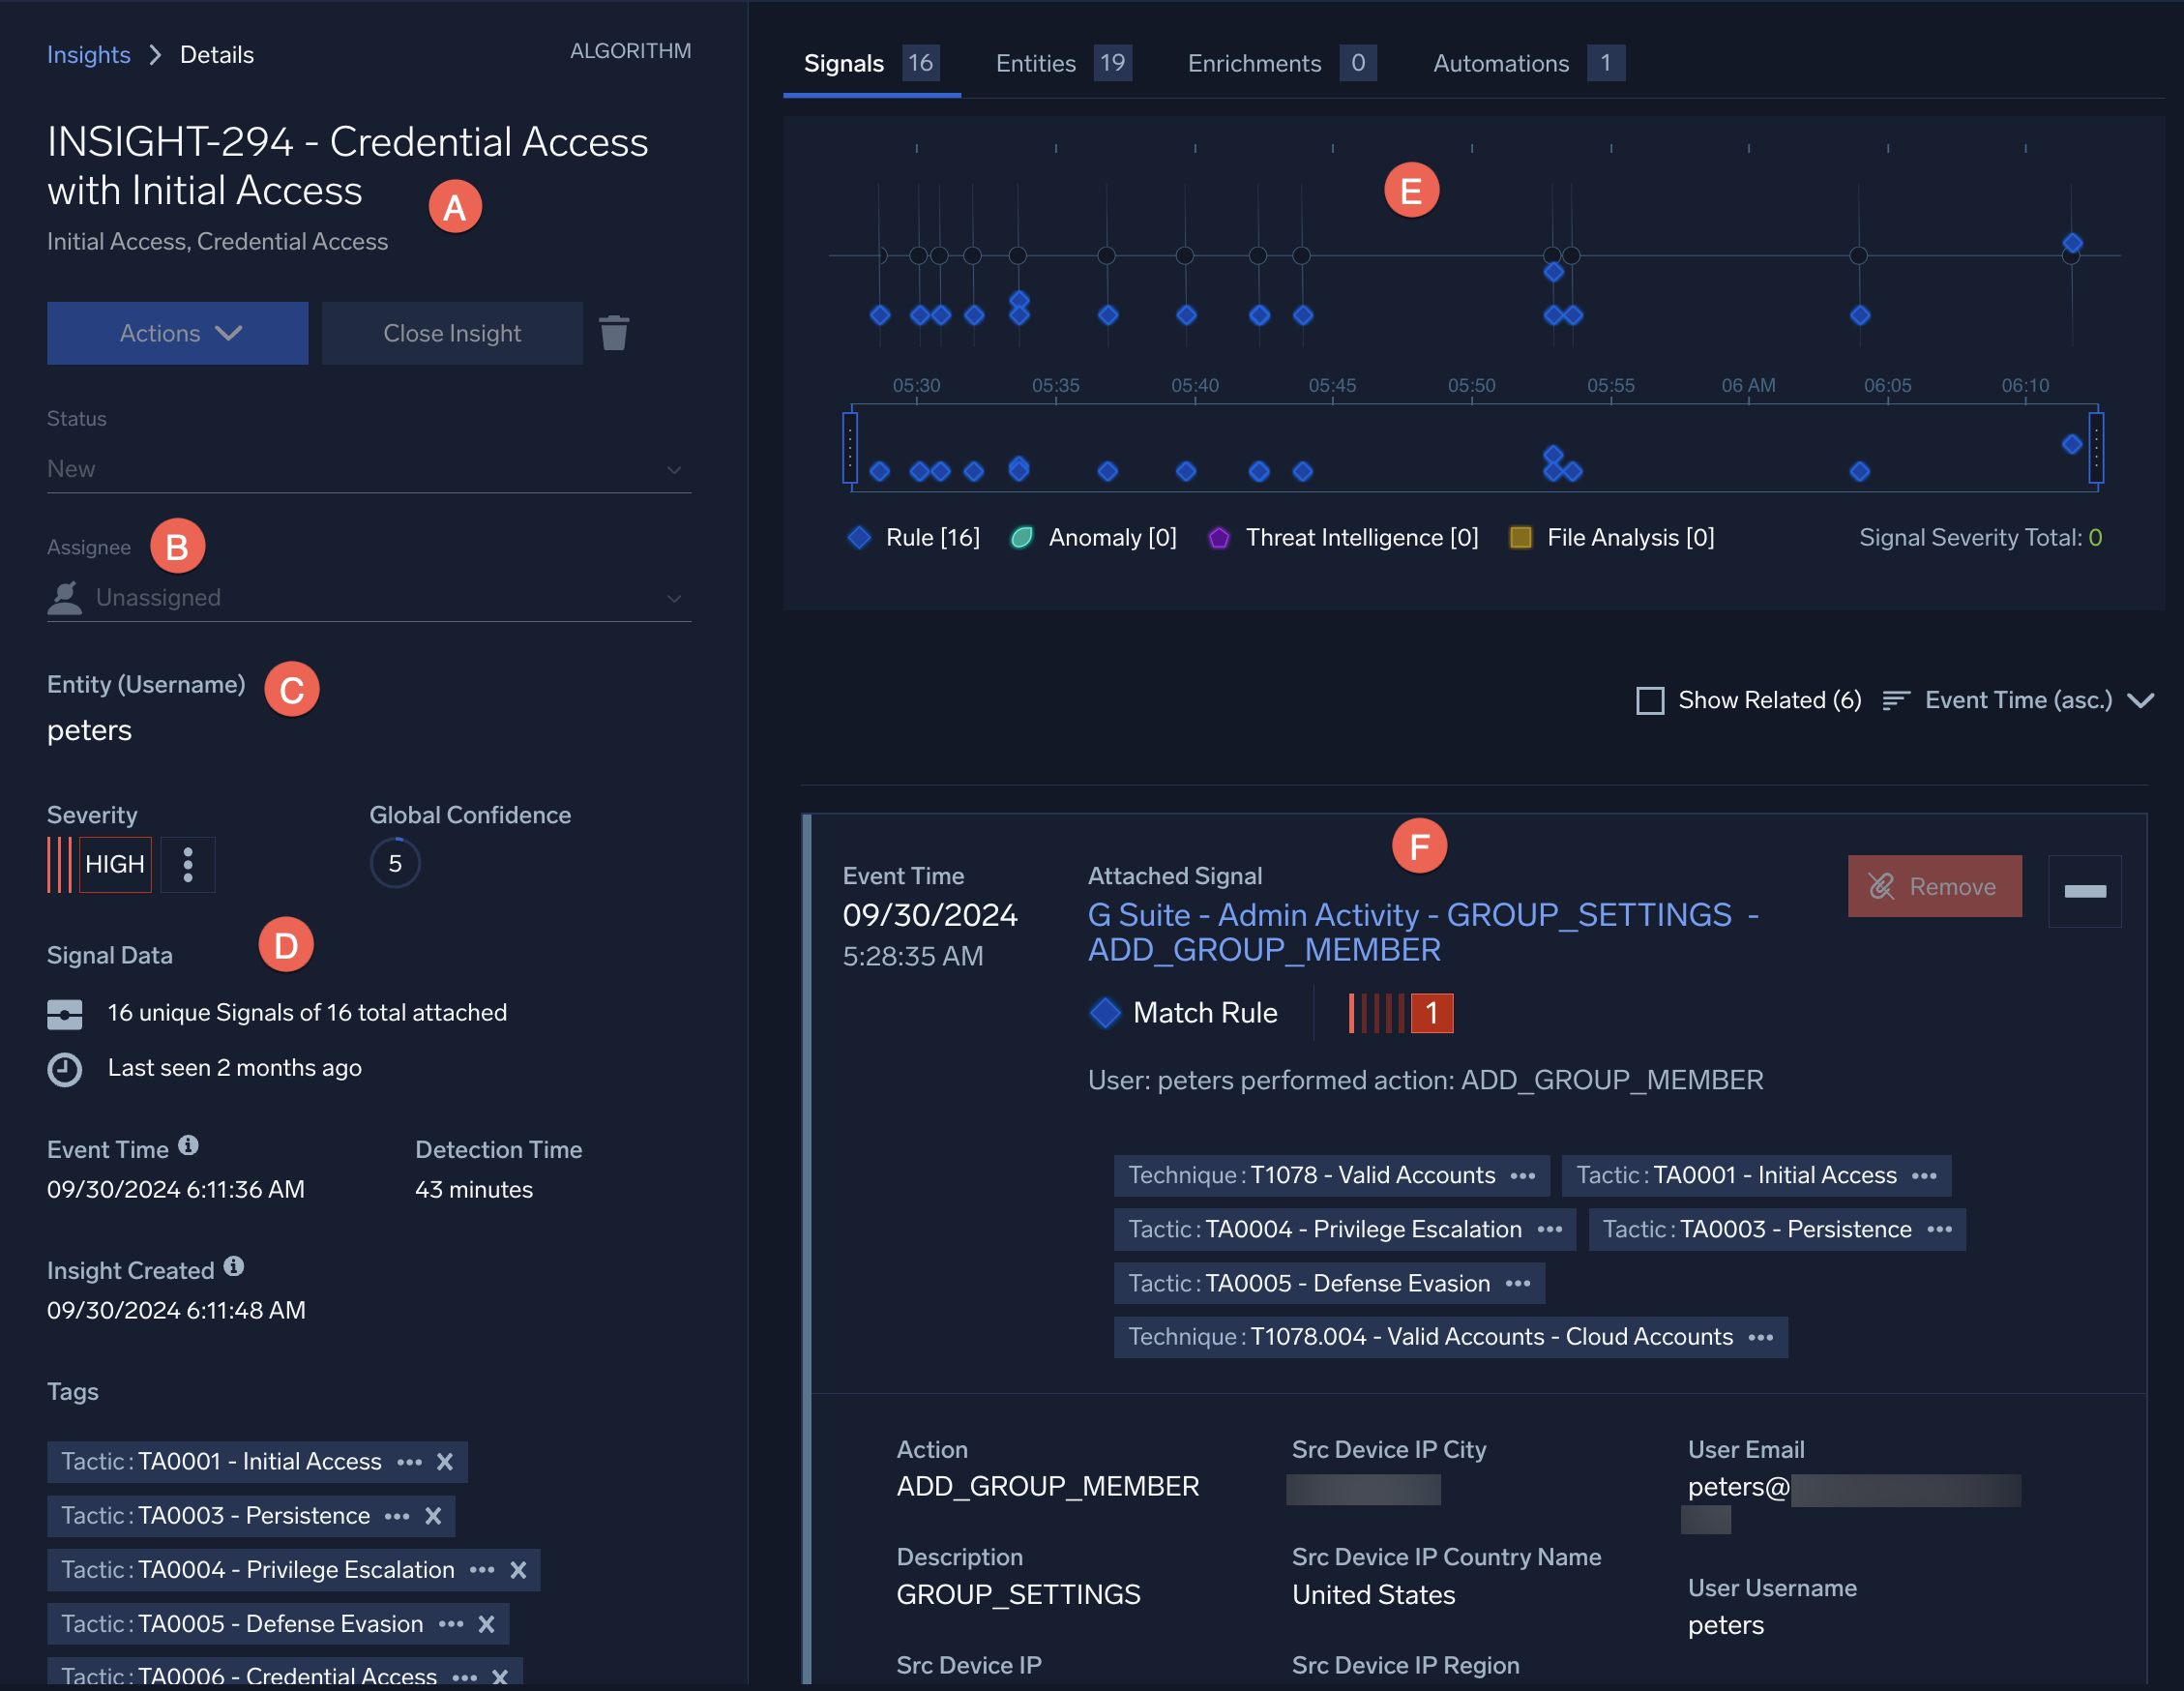
- A. Name. The insight's name can point you to how the event occurred, or why the adversaries did it. In this case, the adversaries wanted to gain credential access.
- B. Assignee. You can assign the insight to a coworker, update the insight's status, send alerts, close the insight, and perform other actions here.
- C. Entity. The entity can point to who, where, or what was affected. In this case, the insight is clustered around a username.
- D. Left pane. A summary of the insight's key features, like its severity, can be found in the left pane.
- E. Timeline. The timeline can show you when the events occurred. Each event represents a signal.
- F. Signals. The signals below the timeline contain details of each event.
The insight page shows everything you need to start unravelling the security event. As you start investigating, try to answer as many wh- questions as you can about the event:
- Who is behind the event?
- What assets did the event affect?
- Where did the event occur?
- When did the event occur?
- Why did the event occur?
- How did the event occur?
When signals cluster together, Cloud SIEM uses their tactics and techniques to name the insights they generate. The insight's name can point you to how the event occurred, or why the adversary is behaving that way. For example, a tactic name like discovery or persistence shows the reasons the adversary has. Similarly, tactic names like initial access or execution can tell you a little about the methods the adversary used. These names are just starting points, however, and you may need to revise your hypotheses as you continue your investigations.
Example: An insight is named "Discovery with Execution". Why did the event occur? Probably so the adversary could discover your information. How did the event occur? By using an executable file or a similar technique.
The timeline can tell you when the event occurred. You can see whether each signal was triggered at the same time, or sequentially, as well as whether everything happened over minutes, hours, or days. By default, insights are related signals that cluster together within the last 14 days.
The entities within each signal can help point to who, what, or where the event occurred. An entity might point to the IP address of a hacked device, the location of the adversary, the location of the database that leaked, the owner of a website or domain, or some other piece of the puzzle.
A day in the life of a SOC analyst can be summarized as follows:

Cloud SIEM can help with every step of the threat investigation process:
- Monitor. Cloud SIEM automatically detects and monitors potential threats by analyzing millions of records and distilling them into a handful of insights with a low false positive rate. You can choose insights from the home page of Cloud SIEM in the insight radar, under the Insight Activity pane, or from the Insights panel.
- Investigate. Once you choose an insight, you can dig through all the raw logs and signals to conduct deep-dive investigations and even proactive threat hunts.
- Hypothesize. You can organize your thoughts, make hypotheses, and take notes about your investigation in the comments of each insight. This will share your ideas with your SOC teammates and help you keep track of your investigation.
- Take action. You can also take certain actions directly from the insight. You can email teammates, create JIRA tickets, execute playbooks, and many other custom actions with the Actions button.
- Update. Finally, you can update the insight. You can mark it as "in progress" or "closed". When you close it, you can mark it as "resolved," "false positive", "duplicate", or "no action". Updating the status correctly will help the Cloud SIEM insight engine produce more accurate insights for your organization in the future.
Of course, this process will repeat each day as new insights are generated for you to investigate.
Investigating an insight
In this section, you'll be investigating an insight for your organization that was detected through Cloud SIEM. Our goal is to analyze the insight details and complete the narrative of what happened.
- New UI. In the main Sumo Logic menu select Cloud SIEM > Insights. You can also click Go To... at the top of the screen and select Insights.
Classic UI. Click Insights at the top of the screen. - Find an insight to investigate.
- Click the insight's name to investigate it. For our example, we found one named Discovery with Execution and Initial Access.
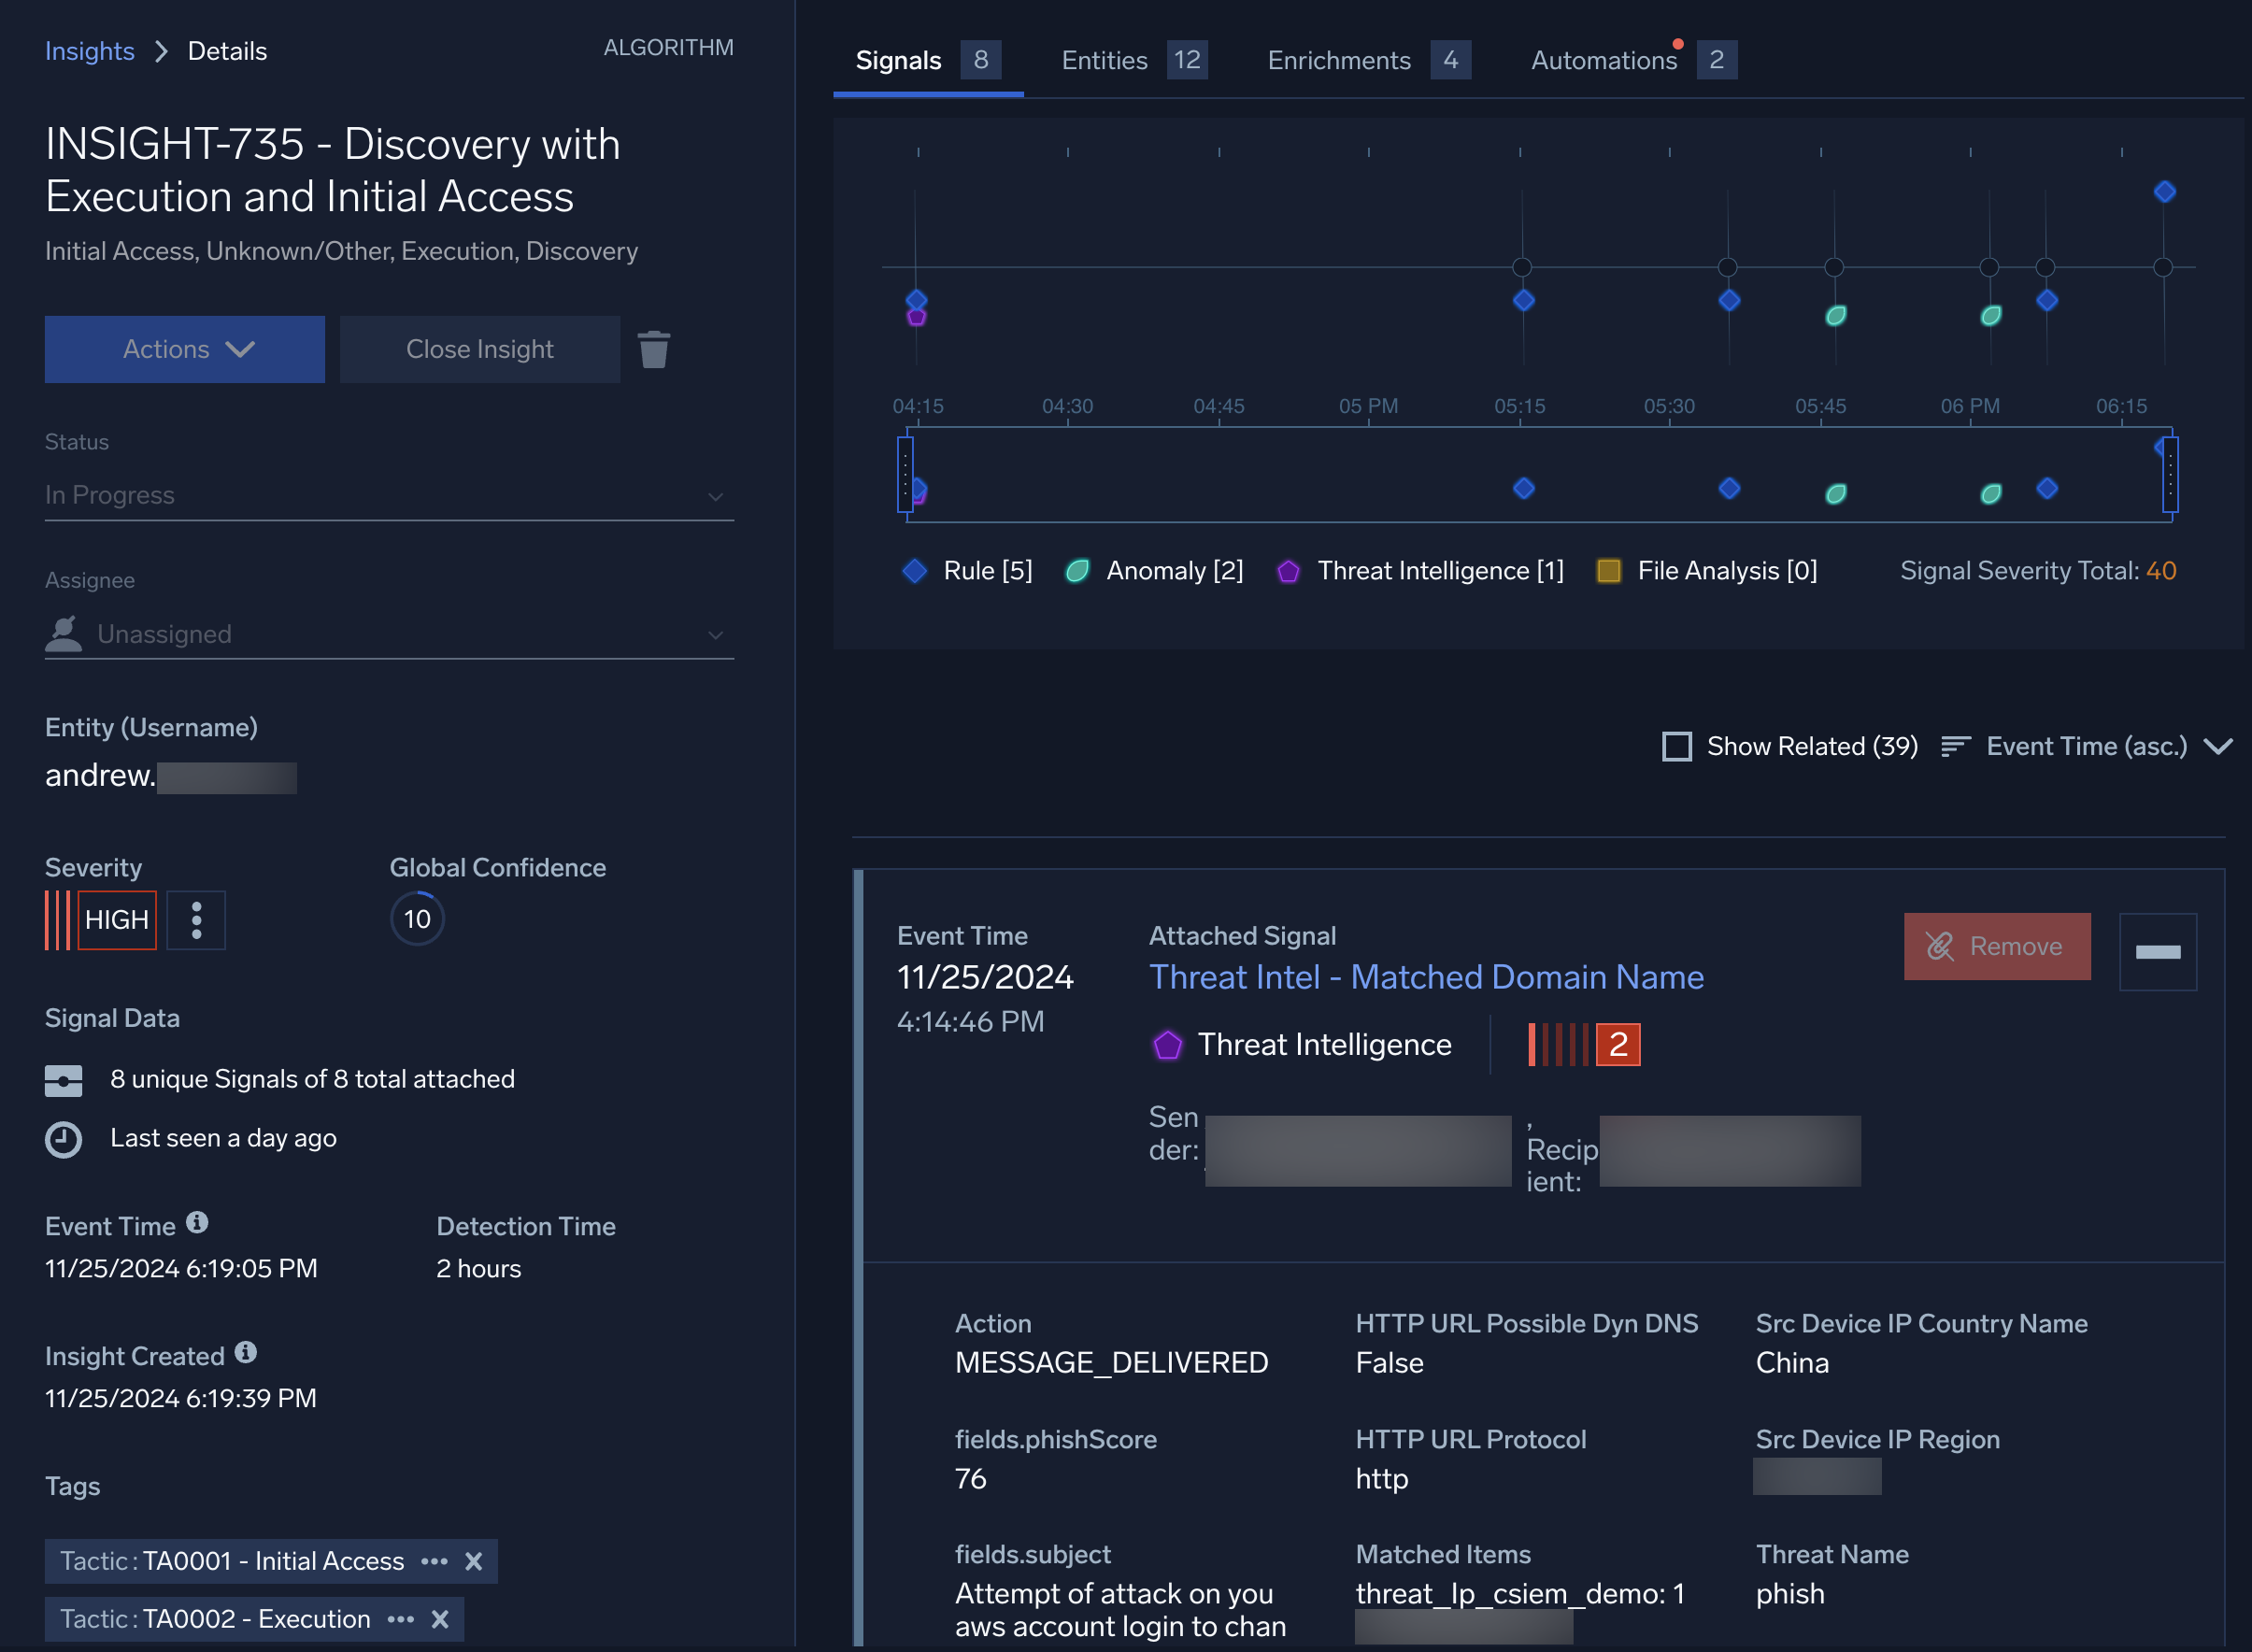
- Use the insight's name (and the MITRE ATT&CK matrix), timeline, signals, and entities to answer these questions:
- What events (signals) were detected and correlated together?
- What is the total of all the severity scores of the signals in this insight?
- What order did the events happen in?
- What hypotheses do you have about how and why the event happened?
- What other information can you find by exploring this insight?
- Scroll to the bottom of the left navigation pane of the insight. Write a short summary of your answers from from the previous step in the Comments section. Here is a summary that we could have written for our example: "First, a known phishing link was received in a user's email. A few minutes later, a malicious file was allowed. It seems the user clicked a phishing link and downloaded the file. Then, threat intelligence detected a ZIP file with a known malicious file hash, coming from a domain that has also been recognized as suspicious by external threat monitoring services. Follow-up activity accessing the AWS APIs and Lambda service was detected, the first time that this user has been recorded using those services. This unusual activity also triggered Amazon's GuardDuty service, recognizing unusual network activity. All of these individual signals were correlated together into this insight. Given the likelihood of active malware in the network, the user's machine and credentials should be locked down immediately. Further investigation is needed to determine the total impact of the malicious file."
Dive into signals and entities
Insights provide a great, high-level summary of potential security events. Because of Cloud SIEM's threat intelligence and sophisticated correlation engine, very few insights are false positives, so they're all worth investigating.
However, sometimes you may want to investigate deeper, to really understand what happened. Or, you may want to do proactive threat hunting work, to find potential problems before they begin impacting your system, even if some of what you're looking at are false alarms.
The Signals tab lists all the signals created by rules that have been triggered in your system in the last 14 days, by default. Signals provide summaries of potential security threats. Remember, not all signals are security incidents. After all, there are legitimate reasons why someone might be logged in to two different devices at the same time, or why there have been several failed password attempts on an account.
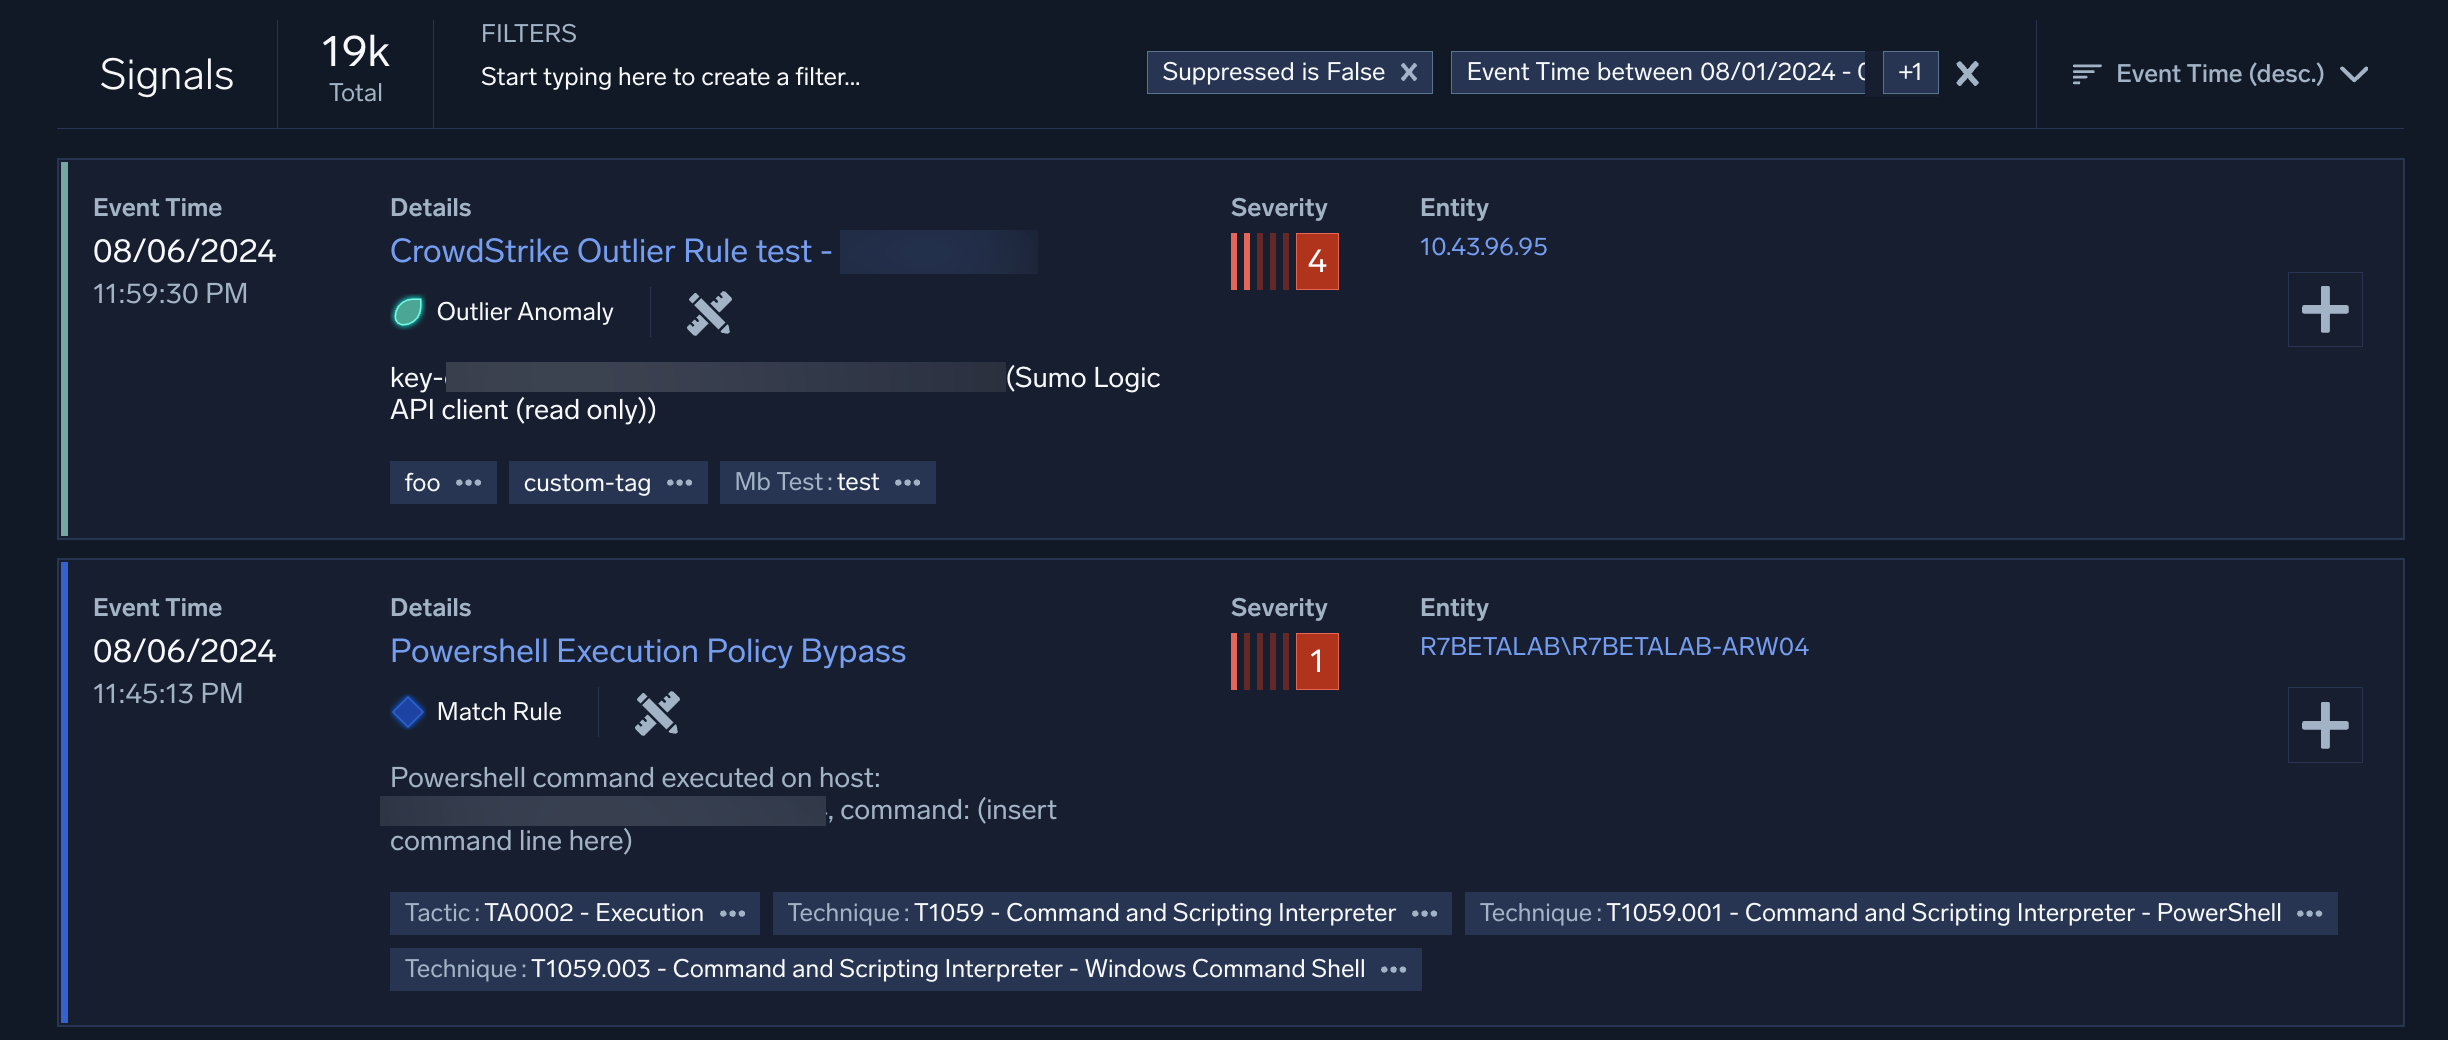
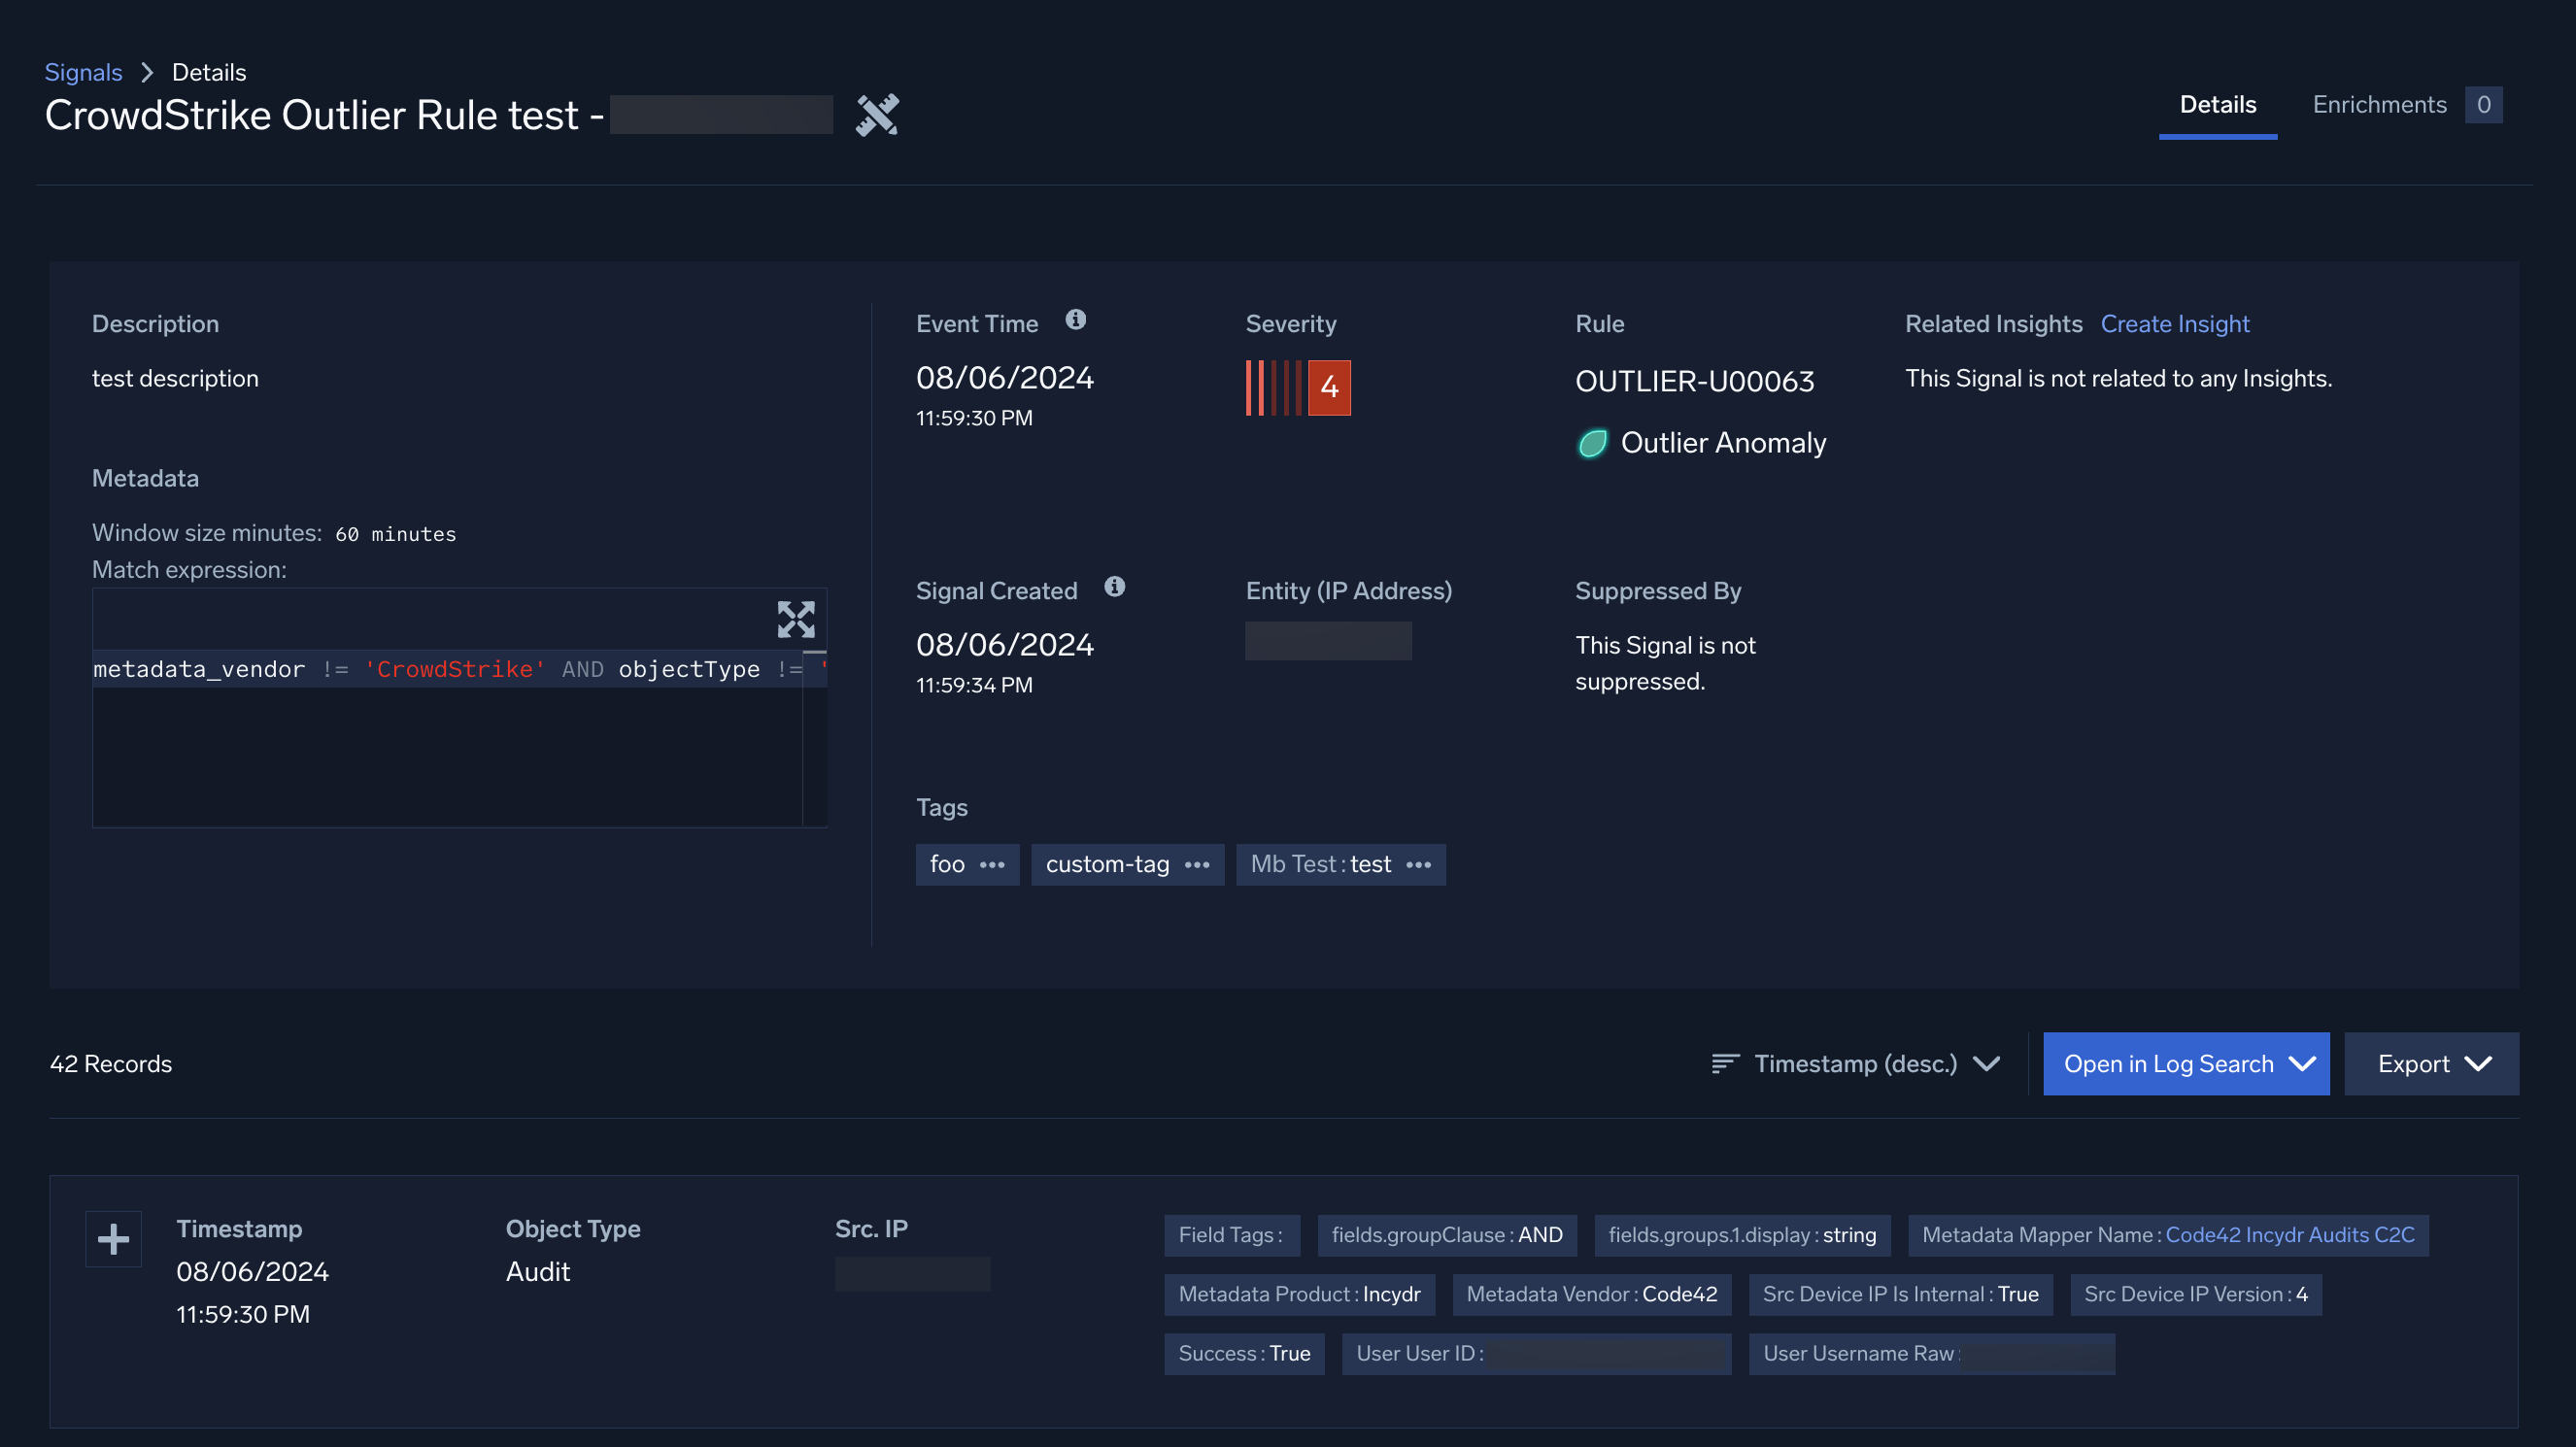
When you click into a signal, you'll have the option to see the full details of the record that triggered it. This includes information like the IP address, geolocation, threat level, and other information that can aid you in your investigation.
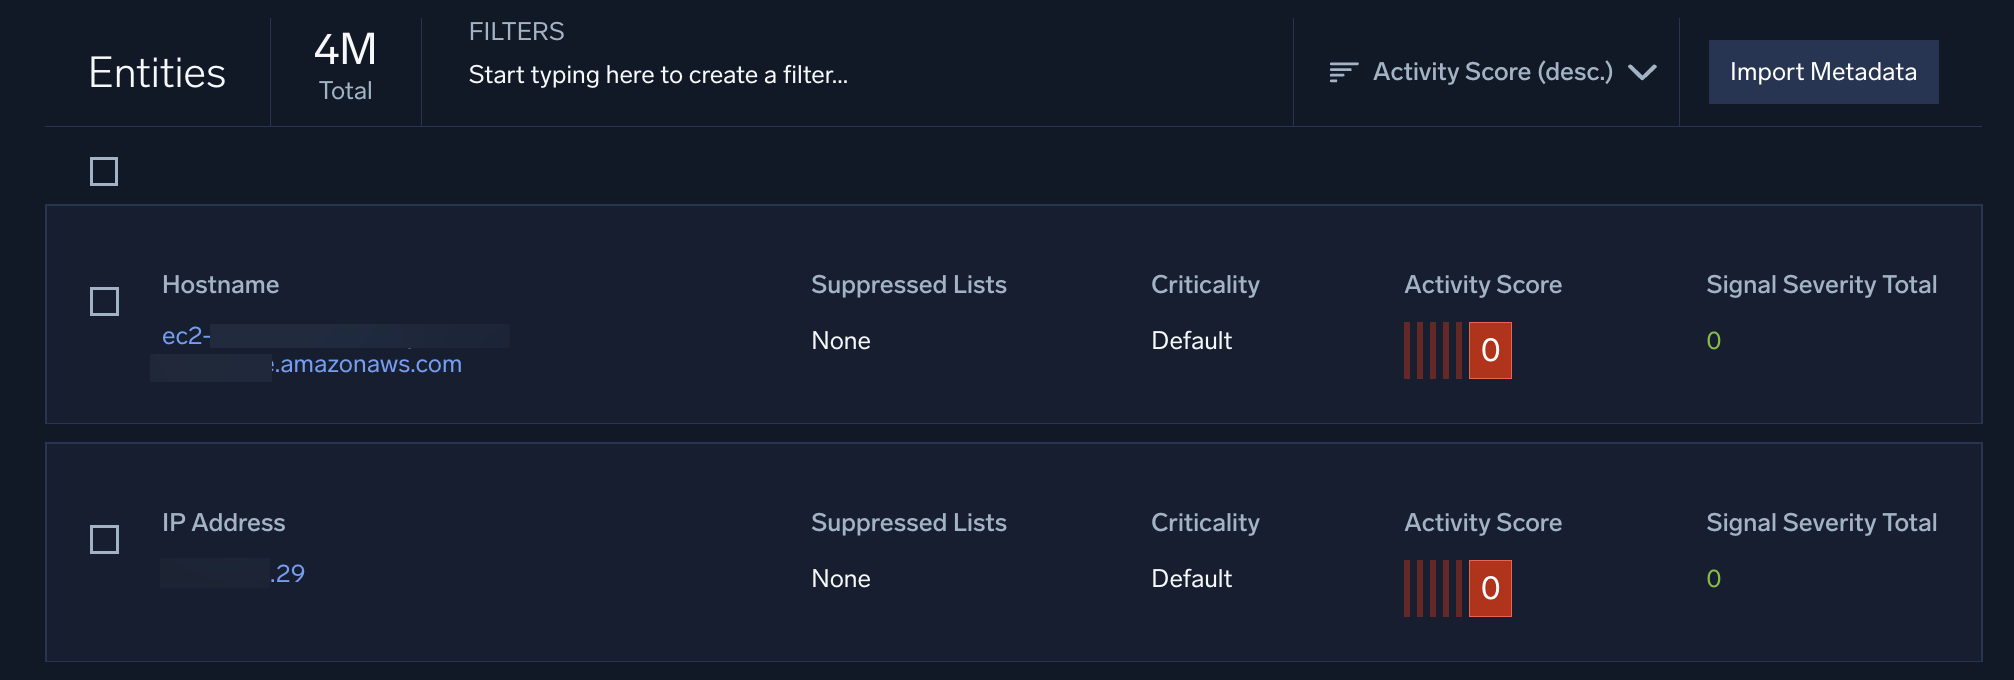
The Entities tab lists all the entities that your rules have detected in the last 14 days, by default. Each entity has an activity score associated with it. The activity score is the sum of all the severity scores of all the unique signals associated with that entity. When an entity's activity score reaches at least 12, an insight is created. If you have several entities with relatively high activity scores, they might be a good starting point for a threat hunt.
Bring it back to Sumo Logic search
Sometimes you want to take your investigation even further. An in-depth threat investigation will use the most of both Cloud SIEM and Sumo Logic's core search functionality.
There are several ways to bring the information you find in Cloud SIEM back to the Sumo Logic platform. One context action is Sumo Logic Search. Selecting this action will create a log search in Sumo Logic. This way, you can find all log messages with that entity, even if it wasn't detected by a rule in Cloud SIEM. Hover your mouse over the entity name, click the ![]() button that appears, and select Sumo Logic Search from the list.
button that appears, and select Sumo Logic Search from the list.
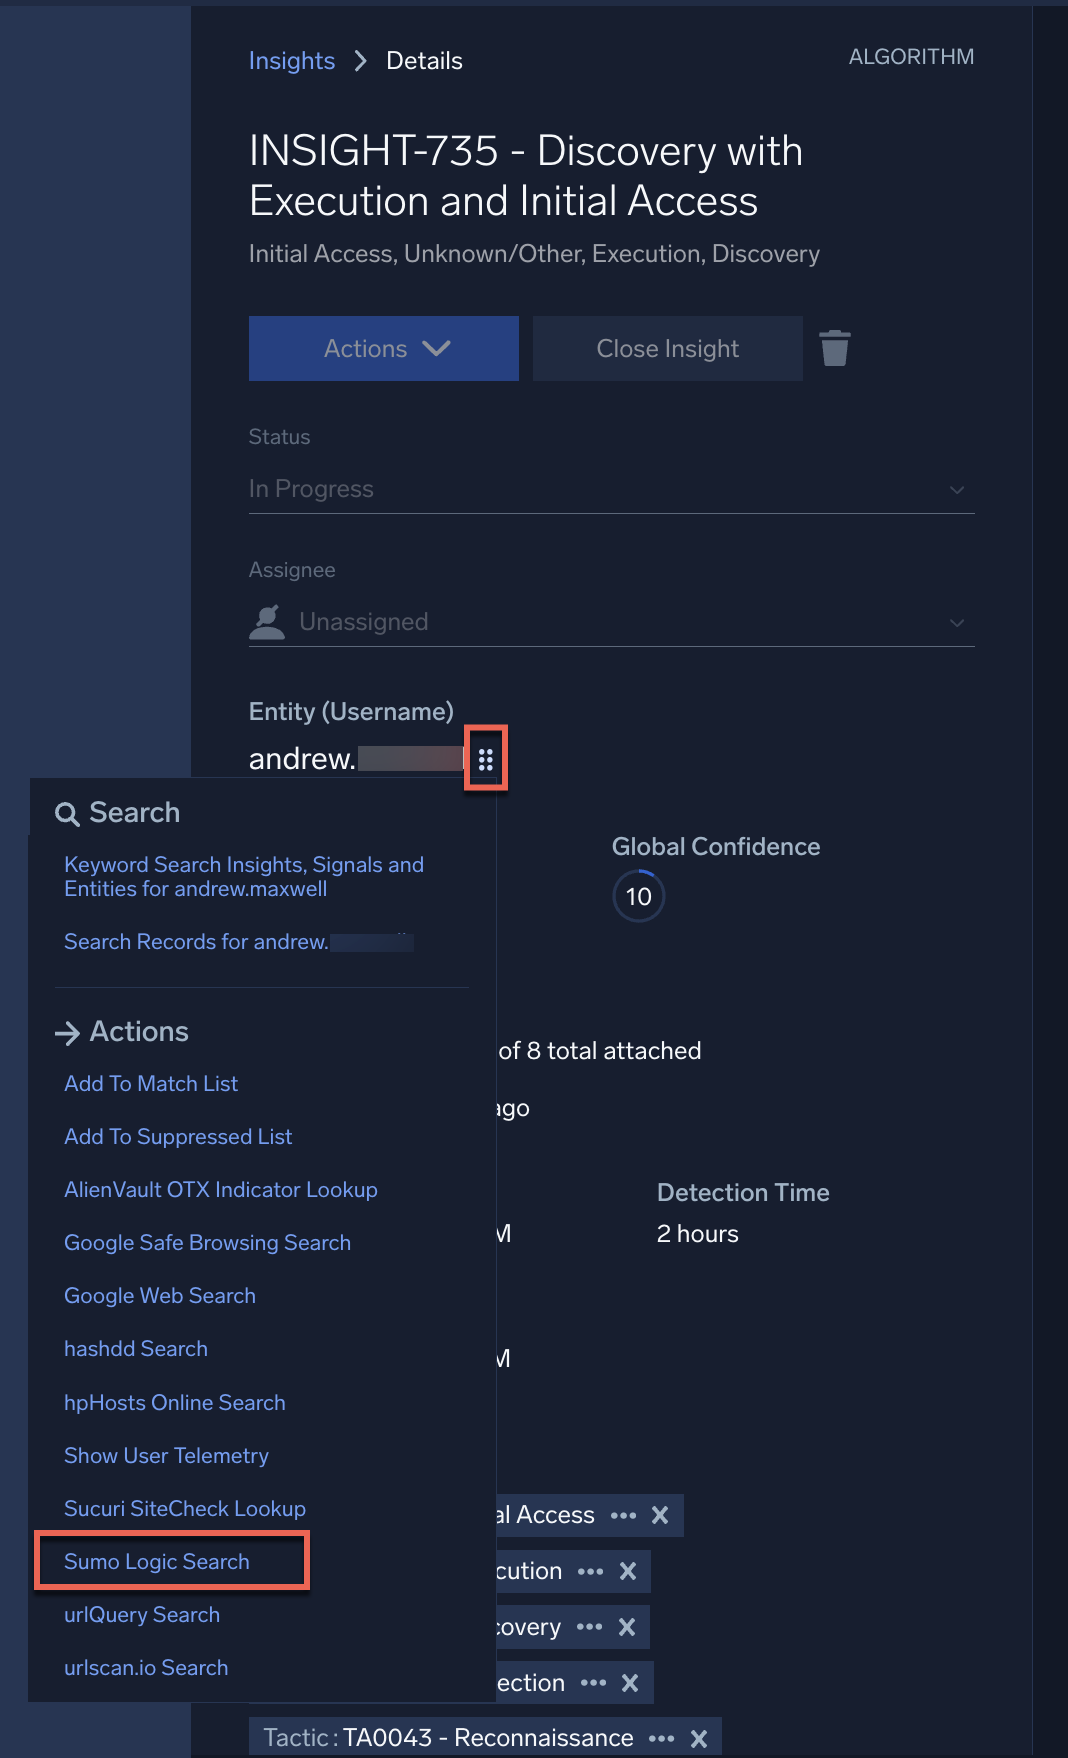
Many entities in the insights, signals, and entities pages have context actions (six dots icon). Hover next to certain entities and the six dot icon may appear, if context actions are available for that object. Use the context actions to insert the entity into an API call, do a DNS lookup, or many other tasks. Your admin can add custom context actions too.
You can also work with your admin to set up dashboards in Sumo Logic that track insights and other activity in Cloud SIEM. This allows you to monitor what's going on in Cloud SIEM without ever leaving Sumo Logic's core platform.
Continue the investigation
In a previous section, we looked at an insight. In this section, we will use Sumo Logic search to continue the investigation. Then, we will update the status of your investigation in Cloud SIEM.
- Return to the insight you looked at in the previous section Investigating an insight.
- In the left pane, hover your mouse cursor over the Entity field (this is randomly generated and can be a user name or an IP address). Click the context actions (six dots) icon that appears next to the entity name.
- From the dropdown (under Actions), select Sumo Logic Search as described in Bring it back to Sumo Logic search. You may need to scroll to find it. You'll be redirected to Sumo Logic search.
- Make a note of the entity name that's pre-populated in the query builder.
- Open another log search in Sumo Logic:
New UI. In the main Sumo Logic menu, select Logs > Log Search. You can also click the Go To... menu at the top of the screen and select Log Search.
Classic UI. Go to the Home screen and select Log Search. - Find the top 10 records by threat type for that entity. For example, if the entity is a username, in the search bar type:
Replace
_index=sec_record_*
 | where !isEmpty(threat_name) and user_username="<entity name>"
 | count by threat_name
| topk(10, _count)<entity name>with the entity name from the previous step. - Click Start to run the log search.
- Make sure your quotes are straight. Copying and pasting the command sometimes changes the formatting of these quote marks to curly quotes. Manually typing the quote marks fixes this.
- You may need to increase the time of the search to the Last 24 hours to see results. The default is the Last 15 minutes.
- Make sure you're viewing the Messages tab when the results load.
- Explore the raw logs. The
_index=sec_record_*query searches all the records that have been ingested by Cloud SIEM. This particular query excludes those records with nothing in thethreat_namevalue. Additionally, it sorts it by threat name, and shows the most frequent threats. This will help you identify everything this user was doing around this timeframe, to see if anything not caught by the Cloud SIEM rules sticks out. - When you're done exploring the raw logs, return to the insight.
- If you think there's still more work to do, use the Status dropdown to set the insight as In Progress. You can also use the Assignee field to reassign it.
- If you've finished your investigation, use the Close Insight button or use the Status dropdown to set the status to Closed.
Take action on insights
In addition to the context actions available in the Cloud SIEM UI, there are many other actions you might take in response to an insight. For example, you might work with your IT team to isolate and wipe laptops infected with malware to prevent spread of malicious code. Or, you might work with your HR team to enforce mandatory anti-phishing training among all employees to prevent future attacks.
In Cloud SIEM, there are several different actions you can take on each insight. You can comment on the insight, or close it or assign a status to it. When you close an insight, Cloud SIEM uses the resolution information to reduce false positives and duplicates further. Assigning a status to the insight lets you keep working on it, and keep track of your progress.
You can also assign the insight to yourself or to a colleague, and use the Actions button to alert colleagues, create JIRA tickets, send Slack messages, execute playbooks, or use other APIs. This Actions button is customizable, but can only be configured by admins. If you need a custom Action, ask your Admin or Sumo account rep for help creating one.
Tune your environment
Why tune?
Once you've completed a few investigations, you may want to add or modify the rules, data sources, match lists, and other pieces of the Cloud SIEM puzzle. These modifications can help further reduce false positives or alert you even faster. The most common things to customize are rules and insights.
Rules are one of the most important pieces of Cloud SIEM's threat detection engine. All the records that are ingested in Cloud SIEM are compared to every rule in Cloud SIEM. If there's a match, an entity is extracted and a signal is created. Those entities are tracked and may correlate with other signals to create an insight, which is where most threat investigations begin.

You don't have to write rules from scratch. The Sumo Logic content team creates and maintains hundreds of out-of-the box rules, to get you started. These rules are updated frequently, often every few days. You can check out the most recent updates in the Cloud SIEM release notes page.
If you do decide to write a custom rule, insight, or rule tuning expression, these aren't updated or deleted by Sumo Logic during the regular updates. They're independent from the default rules.
Write a rule tuning expression
You're updating some of the firewalls in your system, and you don't want to trigger unnecessary alerts. Write a rule tuning expression that will allow yourself to bypass firewall-related rules.
- New UI. In the main Sumo Logic menu, select Cloud SIEM > Rule Tuning. You can also click the Go To... menu at the top of the screen and select Rule Tuning.
Classic UI. In the main Sumo Logic menu, select Cloud SIEM. Then in the top menu, select Content > Rule Tuning. - On the Rule Tuning page, click Add Rule Tuning Expression.
- Name your rule tuning expression.
- Tune selected Rules should be selected by default.
- Use the Type to add a Rule search bar to find rules to add your expression to.
- Type "firewall" into the search bar to find all firewall-related rules.
- Select a firewall rule, such as Azure Firewall Rule Modified. Under to include Records that also match the expression, write the logic for the rule tuning expression. For help, see Rule Tuning Expressions.
- Click Submit to save your rule tuning expression.
- Verify your tuning expression exists by going back to the rule tuning page (step 1 above). You should see it there. You may need to refresh the page to find it.
Tips and tricks
- When a rule tuning expression is added to a rule, it's appended with an AND statement. Rule tuning expressions are usually exceptions to the rule. Keep this in mind when writing the logic. It's common to use the is not (!=) operator to make exceptions.
- The autocomplete feature can help you write the logic. For example, typing "ip" will bring up a dropdown showing all available fields related to IP addresses.
- The syntax coloring can help you write the logic. For example, try using single quotes ('...') instead of double quotes ("..."). Notice that the syntax coloring lights up correctly when you use double quotes, which is the best practice.
- Check for an orange triangle icon next to the Submit button before you submit. This will notify you of any errors or warnings.
Custom rules
Adding a rule tuning expression to an existing rule is one of the easiest and most common ways to customize your rules. But sometimes you need to write a new rule from scratch. You might do this if your system has a source that isn't covered by the default rules, or if you're looking for a threat that isn't covered by the default rules.
See Rule types for the types of rules you can create:
- Match rules take a simple boolean statement, and check if it's true or false. If it's true, then an entity is extracted and a signal is created. Match rules are the simplest and most common type of rule.
- Threshold rules are triggered when a match is found a certain number of times. So, for example, if one failed login attempt is acceptable, but five failed login attempts would be suspicious, then a threshold rule would be set to fire after the fifth failed login attempt.
- Chain rules fire when different events happen together within a certain time window. So, for example, if you want to look for five failed login attempts followed by one successful log in within one hour, you'd use a chain rule.
- Aggregation rules are triggered when up to six different events accumulate over time. For example, if you want a rule that looks for a large number of event types from a single device IP, you'd use aggregation rules.
- First Seen rules generate a signal when behavior by an entity (such as a user) is encountered that hasn't been seen before, such as logging in from a distant location.
- Outlier rules generate a signal when behavior by an entity (such as a user) is encountered that deviates from its "normal" baseline activity, for instance, a sudden spike in failed login attempts or abnormally large downloads.
The below image shows a blank rule template.
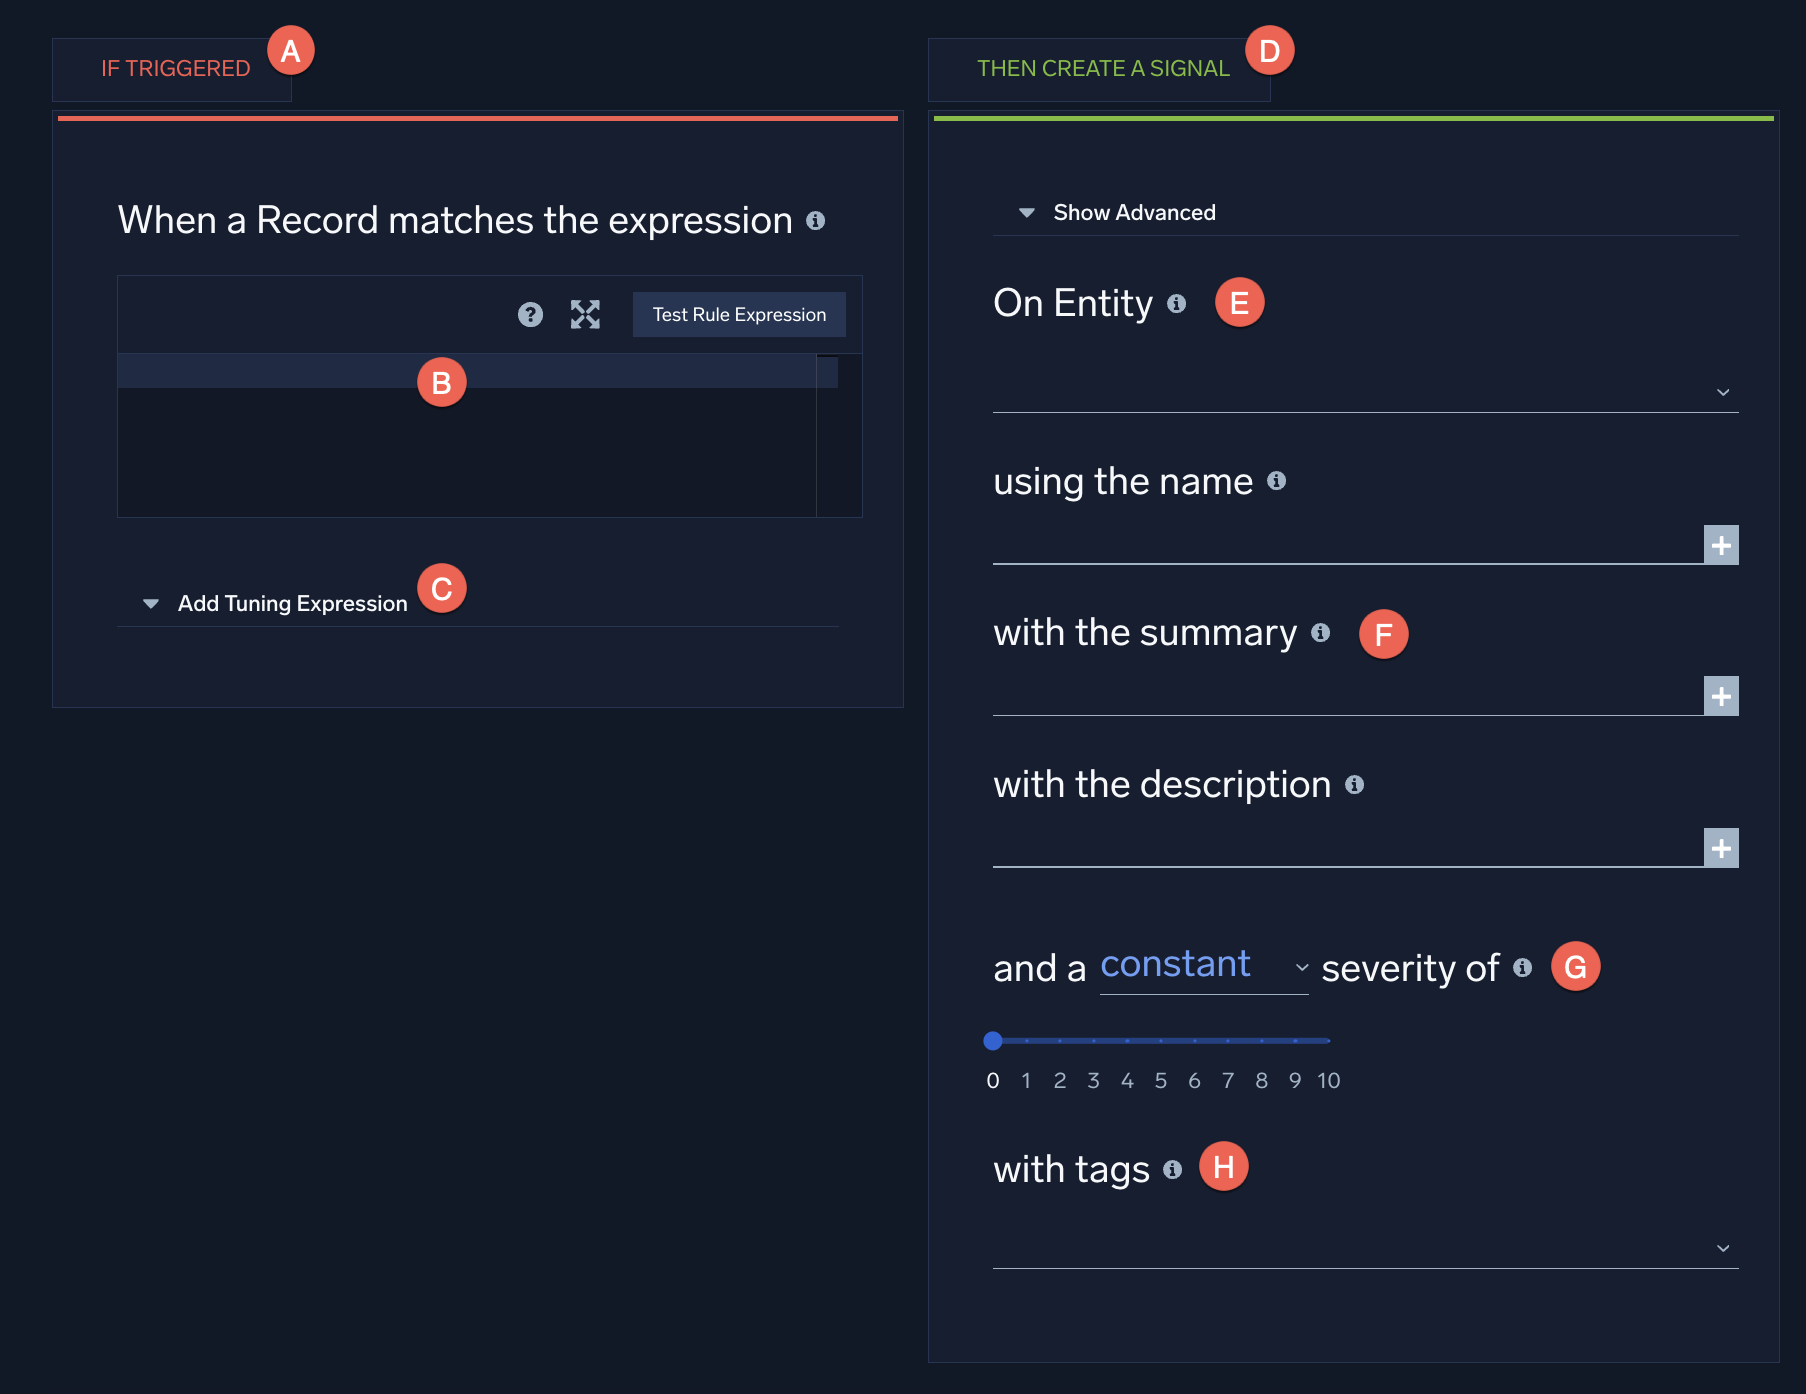
- A. If Triggered. Configure the IF statement to decide what records will cause the rule to trigger.
- B. Rule logic. The rule's logic is a short piece of code. For match rules, it's usually simple boolean logic.
- C. Add Tuning Expression. You can optionally add rule tuning expressions when you create new rules.
- D. Then Create a Signal. The THEN statement of a rule configures the signal that will be created if there's a match with the IF statement.
- E. On Entity. The entity for a rule is usually something that is found in the IF statement. For example, if your boolean logic looks for matches on IP addresses, then the entity would be an IP address.
- F. with the Summary. The name, summary, and description are required fields. As a best practice, fill these out with details that will help other SOC analysts understand why you wrote this rule.
- G. and a __ severity of. You can configure the rule's severity score. This is on a scale from 0 to 10, with 10 being the most severe. Higher severity scores are more likely to trigger insights.
- H. with tags. The tags let you choose which tactics and techniques from the MITRE ATT&CK framework your rule is looking for.
Write a match rule
You're concerned about traffic coming from a particular IP address that isn't covered by any of the default rules in Cloud SIEM. Write a match rule that looks for this IP address.
- New UI. In the main Sumo Logic menu, select Cloud SIEM > Rules. You can also click the Go To... menu at the top of the screen and select Rules.
Classic UI. In the top menu select Content > Rules. - Click Create.
- On the Match tile click Create.
- Provide a name for your rule.
- Under When a Record matches the expression, write the logic for the rule. For example, if you want the rule to fire when it encounters an entity for a specific IP address, enter it here. For example,
device_ip='192.0.2.0'. - Click Add Tuning Expression. Add the tuning expression you created in Write a rule tuning expression.
- Configure the signal that will be created once the rule is triggered by filling out all the fields under Then Create Signal.
- On Entity should use an entity that's also used in your rule's logic. In this example, select device_ip.
- In using the name define the name for signals fired by the rule.
- Fill out the with the summary and with the description fields.
- Select constant from the and a ___ severity of dropdown.
- Drag the severity meter to select a severity for your rule. In this example, a low severity like 1 would be appropriate.
- Under tags, select some tactics and techniques from the MITRE ATT&CK framework. For this example, you could select Tactic and then TA0001 - Initial Access.
- Select the Save this rule as a prototype checkbox. As a best practice, whenever you create a new rule, save it as a prototype so you can monitor its behavior for a few weeks before pushing it to your system live.
- Click Submit to save your rule.
- Verify your rule exists by going back to the rules page (step 1). You should see it there. You may need to refresh the page to find it.
Tips and tricks
- The logic under When a Record matches the expression can be anything you like, but is typically a simple boolean statement for match rules.
- The autocomplete feature can help you write the logic. For example, typing "ip" will bring up a dropdown showing all available fields related to IP addresses.
- The syntax coloring can help you write the logic. For example, try using single quotes ('...') instead of double quotes ("..."). Notice that the syntax coloring lights up correctly when you use double quotes, which is the best practice.
- Insights are named based on the tactics and techniques tagged in the signals. Consider which tactic or technique from the MITRE ATT&CK framework your rule is looking for when selecting tags.
- Check for an orange triangle icon next to the Submit button before you submit. This will notify you of any errors or warnings.
Custom insights
Once a rule is in your system, whether it's a custom rule you created or one created by the Sumo Logic team, Cloud SIEM will use it to create signals. When a rule is created, you configure its severity score. This is on a scale from 0 to 10, with 10 being the most severe.
If a record matches a rule, an entity is extracted from the record. The entity might be something like an IP address, a user name, a domain name. It tells you who the potential threat is.

Once an entity is in Cloud SIEM's system, Cloud SIEM tracks the total severity score of signals associated with each entity as an activity score. Once that activity score gets high enough, usually over 12 by default, then an insight is created.
So, if you want an insight to be created with the default settings, you'd have to have rules with a severity score of 1 trigger 13 different times, or rules with higher severity scores trigger enough times to add up to 13. This is why insights typically have several signals associated with them.
You can have a large number of low-severity score signals that won't create an insight. Or, you can have a small number of high-severity score signals that will create an insight. Keep this in mind when you're configuring the severity scores of your custom rules.

But what if you want to be alerted right away when a certain rule is triggered?
Custom insights let you create insights based on one specific signal, or a chain of signals. This is great for known threats specific to your system. You won't need to change any of your existing rules and insights. They'll keep working normally.
Create a custom insight
You want to be alerted right away when your new custom match rule is triggered. Create a custom insight that looks for only this rule.
- New UI. In the main Sumo Logic menu, select Cloud SIEM > Custom Insights. You can also click the Go To... menu at the top of the screen and select Custom Insights.
Classic UI. In the top menu, select Content > Custom Insights. - Click Add Custom Insight.
- Give your custom insight a name.
- Under When Signals are created from the following select rules.
- In Type to add a rule, search for the rule you created in Write a match rule and add it to your custom insight.
- Choose any from the in ___ order dropdown.
- Under Then Create an Insight, configure the insight.
- Fill out Create an Insight with name.
- You must fill out all the fields. For this exercise, you can add placeholder text like “This is a test” to the and description field.
- Select constant for with a ___ severity.
- Select low from the that is dropdown.
- Under and tags, select some tactics and techniques from the MITRE ATT&CK framework. For this example, you can select Tactic and then TA0001 - Initial Access.
- Click Submit to save your custom insight configuration.
- Verify your custom insight configuration exists by going back to the custom insights page (step 1). You should see it there. You may need to refresh the page.
Tips and tricks
- Insights are named based on the tactics and techniques tagged in the signals. Consider which tactic or technique from the MITRE ATT&CK framework your rule is looking for when selecting tags.
- Check for an orange triangle icon next to the Submit button before you submit. This will notify you of any errors or warnings.
Other customizations and best practices
Remember, Cloud SIEM's out-of-the-box rules and insights are great. But we want you to have the flexibility to customize your environment. There are three simple three ways to customize Cloud SIEM's rules and insights.
- Rule tuning expressions are simple ways to add small exceptions and other clauses to existing rules.
- Custom rules let you write logic that's unique to your system, to cover threats or data sources that aren't covered by built-in rules.
- Custom insights allow you to get alerts based on just one rule or a chain of rules.
Before you create custom rules from scratch, there are some best practices you'll want to follow.
- Check existing rules. Sumo Logic already has hundreds of built-in rules, so you might not need to write a new one. Or, you may only need to make small changes to existing rules, like adding a rule tuning expression or adjusting a severity score.
- Know your system. You'll need to understand the schema and log mappings of all the records ingested into Cloud SIEM to write effective rules. You might want to work with an administrator on your team who knows this to write better rules.
- Know your risk appetite. In addition to your system's details about log mappings and other metadata, you need to understand your company's risk appetite and risk tolerance. For example, some companies might want to monitor a large amount of outbound traffic, but not consider this a threat. So, they'd assign this rule a severity of zero. However, other companies might be alarmed by outbound traffic and consider it data exfiltration, assigning the same rule a severity of five.
- Know the rule types. You also need to understand all the types of rules. If your use case requires a chain rule, but you try writing a threshold rule, the rule might not be as efficient or effective.
- Make small changes. As a best practice, when you do write a new rule or edit an existing one, make small changes. For example, instead of decreasing a severity score from 8 to 2, try decreasing it from 8 to 7 and monitoring the change for a while.
- Save as a prototype. Another best practice is to save all new rules as a prototype. This allows you to monitor the rule's behavior, without creating new insights and alerts.
Rule tuning, custom rules, and custom insights are just a taste of what you can customize in Cloud SIEM. However, some customizations, like configuring the Actions button, need admin privileges. You can work with your admin or your Sumo Logic account rep to customize:
- Log mappings
- Match lists
- APIs and other plugins
- How much data Cloud SIEM ingests
Additional resources
- Blogs:
- Protecting identities with the Sumo Logic platform
- Hunt for cloud session anomalies with Cloud SIEM
- Why your security analytics needs proactive threat hunting
- Threat hunting with Sumo Logic: The Command Line
- Responding to remote service appliance vulnerabilities with Sumo Logic
- Cloudy with a chance of breach: advanced threat hunting strategies for a hyperconnected and SaaSy world
- Demos: