Network Sensor Troubleshooting
This article describes using the Cloud SIEM Network Sensor. The Network Sensor has reached its end of life. Instead, use Zeek. For more information, see Ingest Zeek Logs.
The Cloud SIEM Network Sensor is a flexible network security monitor that monitors IP networks and collects flow and protocol session data, building audit records of network communications. As with all Network Sensors, performance is a key consideration for proper operation and comprehensive data collection. The installation of the Cloud SIEM Network Sensor configures the sensor with reasonable defaults for many environments. For other environments, such as high throughput deployments, Sumo Logic advises the use of a supported 3rd party Bro/Zeek sensor offering or a custom Zeek cluster deployment.
General Troubleshooting
Interface Errors
Various conditions may cause a network interface to drop frames. Interface counters should be monitored to identify faults.
Errors may be monitored using ip-link(8): ip -s link show
Confirm that the RX line shows incrementing bytes/packets but that the errors, dropped and overrun fields do not increment. It is useful to run the command several times with some delay in between.
The following example shows an interface where errors and drops are occurring:
Interface errors
$ ip -s link show dev eno1
2: eno1: <BROADCAST,MULTICAST,PROMISC,UP,LOWER_UP> mtu 1500 qdisc pfifo_fast state UP mode DEFAULT group default qlen 1000
    link/ether 94:c6:91:1f:60:30 brd ff:ff:ff:ff:ff:ff
    RX: bytes  packets  errors  dropped overrun mcast
    447245477940 794895966 382828  2308804 0       7956512
    TX: bytes  packets  errors  dropped carrier collsns
    0          0        0       0       0       0
Additional detailed NIC and driver statistics are available using ethtool(8):
ethtool -S eno1
A number of statistics named with “errors” are available. All of them ideally show 0 count and should not be incrementing. Incrementing error counters may be caused by faults discussed (and corrected) below.
PF_RING
PF_RING enables accelerated network packet capture under Linux and is included in the default Cloud SIEM Network Sensor installation.
PF_RING configuration information is available in /proc/net/pf_ring/info. Information on interfaces may be found in /proc/net/pf_ring/dev/<interface>/info.
PF_RING also keeps statistics and information in files such as /proc/net/pf_ring/27240-ens192.9, where the leading part of the filename is a PF_RING enabled capture program PID on the system. Among other information in these files are various packet counters.
Further system tuning related to ring buffer parameters and queues may be possible (refer to PF_RING and Bro/Zeek documentation).
It can be helpful to verify that Bro is linked against the PF_RING enabled libpcap library. The following command pipeline will output "PF_RING enabled" if Bro/Zeek is linked against PF_RING enabled drivers, otherwise there will be no output (indicating acceleration is not enabled).
$(ldd /opt/trident/sensor/bro/bin/zeek | awk '{print $3}' | grep libpcap) >/dev/null && echo "PF_RING enabled"
Network sensor stops capturing traffic
Zeek can get into a state where it runs out of memory and stops processing traffic but does not crash. This has been observed on RHEL 7.9. To automatically restart the sensor when consecutive status reports with low records per second is observed use no_data_restart_threshold (recommended value 3), and no_data_cutoff to tune the record threshold if needed.
Monitoring Capture Performance
Security monitoring can be complex. Network data capture is a system with many layers, and degradation or faults at one layer can affect the whole. Performance starts at the initial traffic acquisition source (i.e. TAPs, SPANs/port mirrors) and ends with the monitoring software itself (Bro/Zeek). Along the way a number of hardware and software components are involved, such as cabling, capture network interface cards, CPU, memory, drivers, OS kernel, memory buffers, and numerous settings. Some work fine as defaults and others must be tuned correctly. All components must be monitored and validated for proper operation. This document provides an overview of how to properly configure and monitor some of the important components in a Network Sensor deployment.
Sumo Logic recommends that Network Sensor admins monitor and collect performance statistics from deployed sensors. Doing so can help with tracking and spotting faults when they occur and help plan for adequate system resources.
In the examples below, we use eno1 as the example interface name. Substitute the proper interface name(s) on your sensor as needed.
Capture Interfaces
Several considerations apply for passive network capture interfaces on an IDS sensor. Capture interfaces are those that are connected to a system supplying a copy of network traffic for monitoring. Network sensors typically have a standard management network interface and one or more additional capture interfaces receiving traffic.
IP Configuration
Passive capture interfaces should be receive only and need not have an IP configuration. ARP may be disabled and no IP address should be configured on the interface. The monitoring software (i.e. Bro/Zeek in this case) will set the interface to the promiscuous mode when it initializes capture on the interface; this does not have to be done in the interface configuration. To operate correctly, the interface should be in an up/active/enabled state.
A recommended capture interface configuration is provided later in this document.
Link Negotiation and MTU
Sumo Logic recommends the use of network TAPs where possible over port mirrors/SPANs on switches. Port mirrors operate in software, do not reliably copy all traffic to analyzers, and may be temporarily disabled by the switch when system load increases. Port mirrors are best suited for temporary or short term troubleshooting. TAPs are purpose-built for permanent monitoring applications and deliver a reliable copy of traffic to analyzers. Most TAPs are also designed to fail open, ensuring that they do not impact network functionality even when faulting.
Verify that the link speed and duplex settings between the sensor's capture interface(s) and any connected network devices match and are negotiated correctly on both ends. Modern devices should auto-negotiate link settings correctly in all cases and it is recommended to allow devices to negotiate speed and duplex. Avoid scenarios where one device is set to auto-negotiate but the neighbor is forced to a certain speed/duplex; this results in a mismatch and can result in packet loss or completely dropped frames. Related devices may include any that are supplying traffic to the sensor, including switches, TAPs, link aggregators and flow-based load balancers. It's possible that devices such as splitters and couplers may cause faults with link negotiation. High-quality TAPs or other link aggregators or flow-based load balancers should work reliably.
To check interface link negotiation use ethtool:
ethtool eno1
The Speed and Duplex fields indicate the active link settings. For a gigabit ethernet link, those are expected to show 1000Mb/s and Full.
MTU (maximum transmission units) is another setting that should match up between connected devices. If all devices use the standard Ethernet MTU size of 1500 bytes, issues are unlikely. If jumbo frames are in use on the network and an upstream device is using a large MTU (e.g. 9000, 9216, etc.), the capture interface MTU should also be adjusted to match.
To check the interface MTU:
ip link show dev eno1
Bro/Zeek
Having verified performance of the data delivery path, the next focus area is Bro/Zeek. As with any network intrusion detection system, the primary concern is ensuring that the software is able to keep up with the traffic rate being monitored without dropping packets. One thing to be aware of is that Zeek is capable of reporting on its performance and logs notices relating to observed capture loss rates over a certain threshold.
CaptureLoss
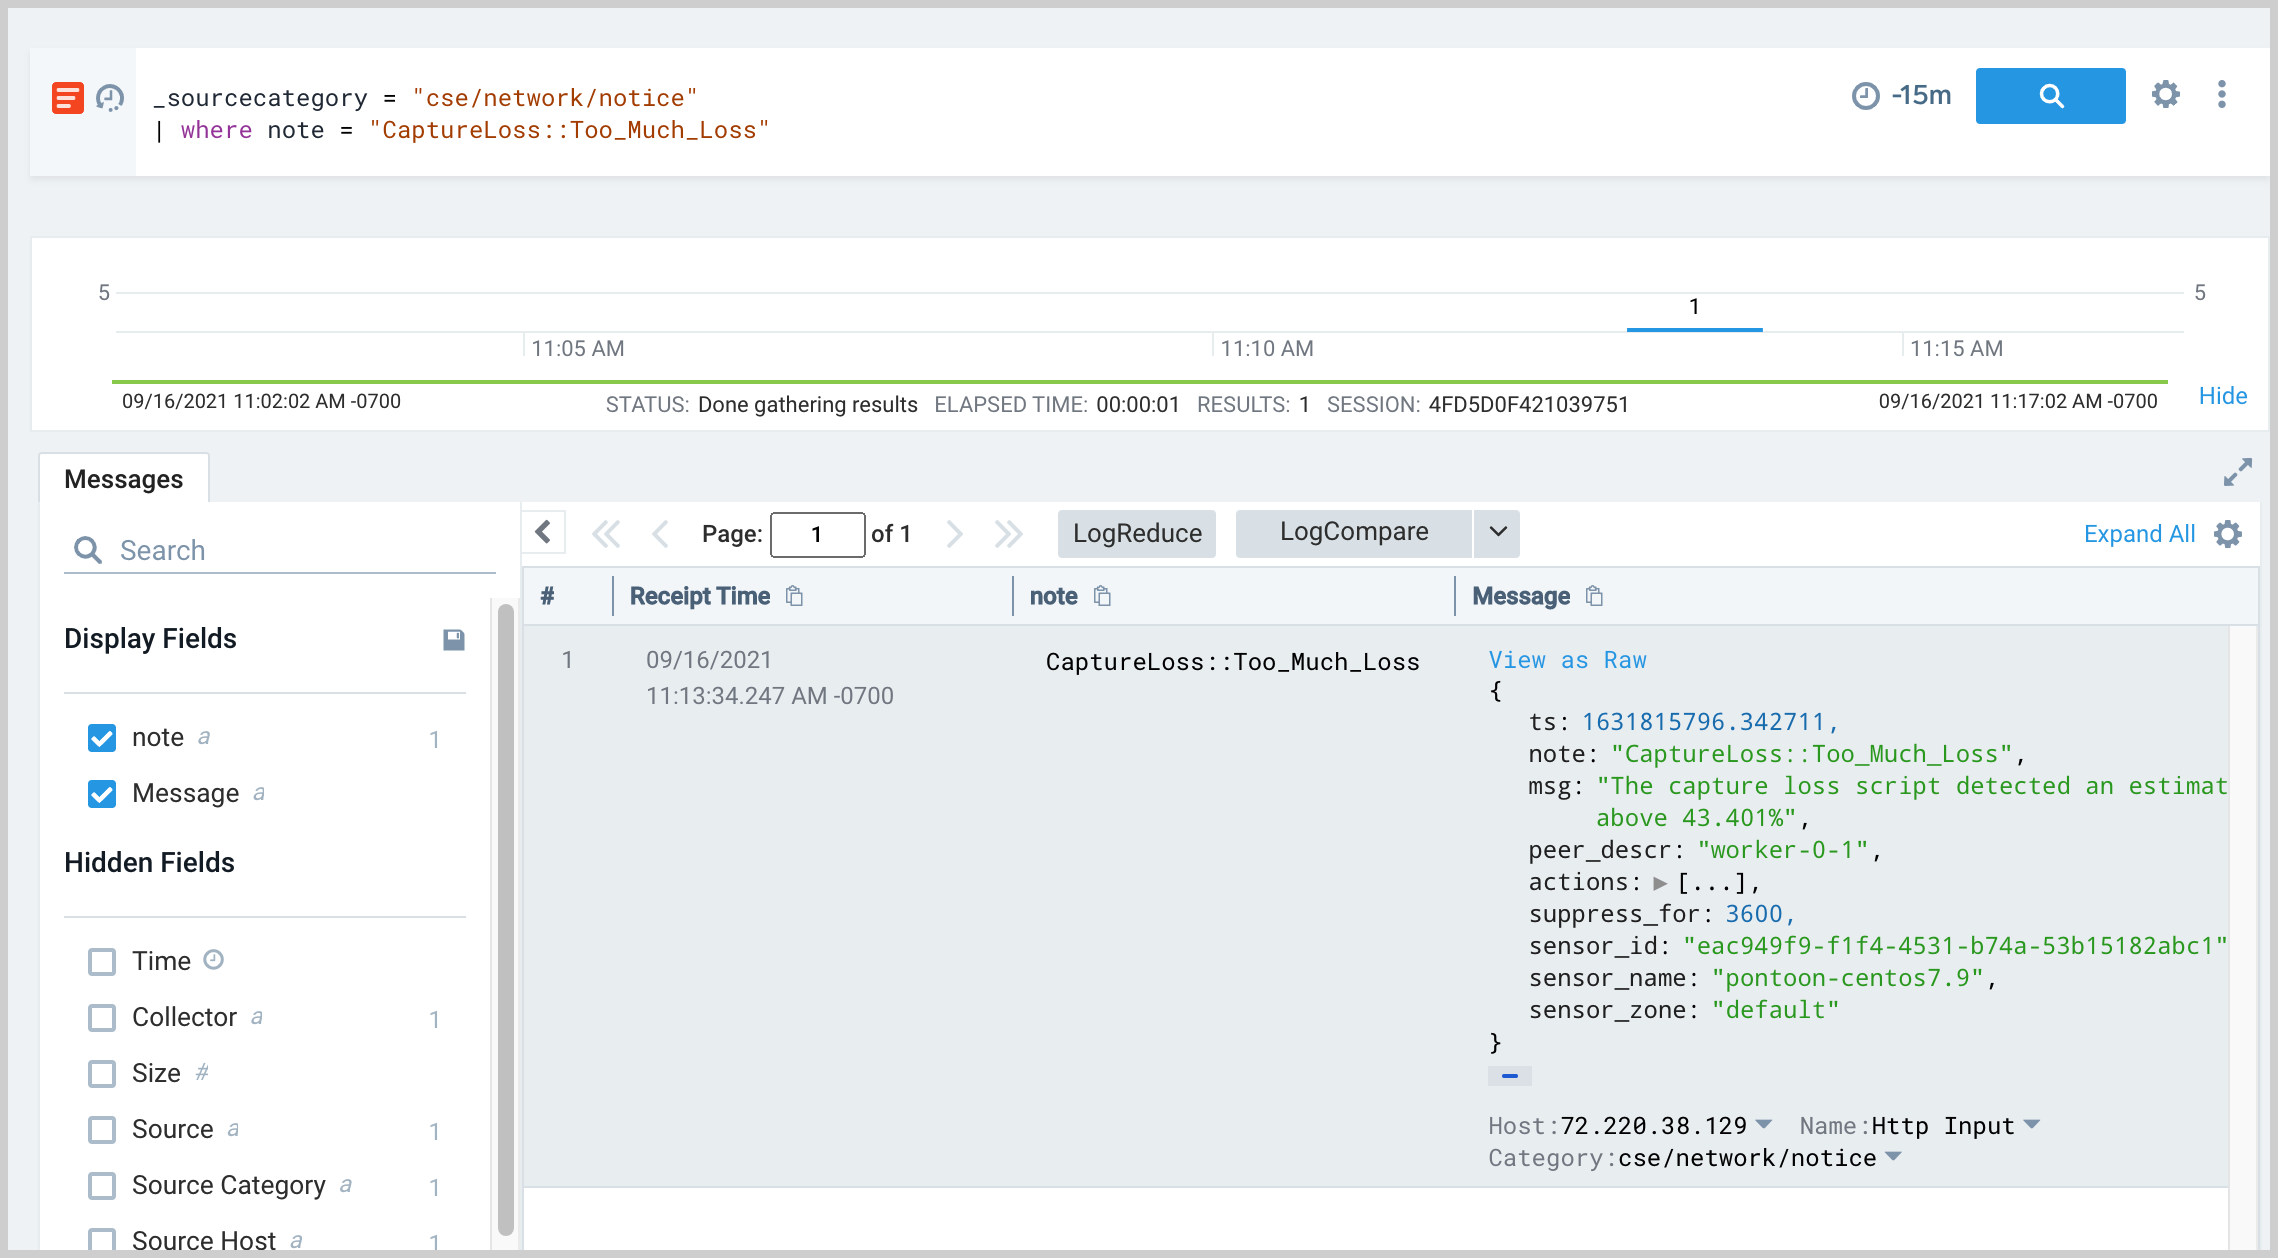
An important metric Zeek log that is collected from the Cloud SIEM Network Sensor is the notice CaptureLoss::Too_Much_Loss. Zeek internally tracks loss rates by observing when streams arrive with gaps indicating missing segments in the stream. Because this metric relates directly to traffic monitored by Zeek, it may either indicate packet loss in Zeek itself, or a loss condition happening elsewhere upstream from Zeek (anywhere along the line). This notice is logged on a periodic basis when a configured threshold is exceeded and is the topic of a key FAQ. https://www.zeek.org/documentation/faq.html#how-can-i-reduce-the-amount-of-captureloss-or-dropped-packets-notice It is possible to analyze occurrences of CaptureLoss notices in Cloud SIEM using the following query in an Sumo Logic log search tab.
_sourceCategory = "cse/network/notice" | where note = "CaptureLoss::Too_Much_Loss"
Capstats
Capstats is a utility that can be used to monitor in real-time the capture statistics from a NIC, reporting on throughput rates and NIC drop rates most importantly. For example:
/opt/trident/sensor/bro/bin/capstats -i eno1 -I 1 -n 10
Bro/Zeek
A number of diagnostic commands are implemented in ZeekControl (zeekctl), a utility to control Zeek cluster installations.
Snaplen
Report on the configured value of the Pcap::Snaplen variable on all workers:
/opt/trident/sensor/bro/bin/zeekctl print Pcap::snaplen
Status
Report on the overall cluster status:
/opt/trident/sensor/bro/bin/zeekctl status
Node Report
Report on the status of nodes in the cluster:
/opt/trident/sensor/bro/bin/zeekctl nodes
Process Overview
Report on Zeek cluster processes:
/opt/trident/sensor/bro/bin/zeekctl ps.bro
Process Runtime State
Show a real-time running task view of the cluster:
/opt/trident/sensor/bro/bin/zeekctl top
Cluster Disk Utilization
Report on disk utilization for the cluster:
/opt/trident/sensor/bro/bin/zeekctl df
Capture Stats
Run capstats on the cluster:
/opt/trident/sensor/bro/bin/zeekctl capstats
Netstats Report
/opt/trident/sensor/bro/bin/zeekctl netstats
Sample output:
BroControl Netstats Output
worker-0-1: 1554221834.239908 recvd=16074588 dropped=0 link=16074588
worker-0-2: 1554221834.439788 recvd=16074086 dropped=0 link=16074086
worker-0-3: 1554221834.643677 recvd=16075191 dropped=0 link=16075191
worker-0-4: 1554221834.843662 recvd=16074657 dropped=0 link=16074657
The netstats command may require the installation of the Broccoli module. In Ubuntu Linux, this can be installed as follows:
apt-get install libbroccoli5 libbroccoli-dev python-broccoli
Zeek Diagnostics
Several diagnostic outputs may be collected.
/opt/trident/sensor/bro/bin/zeekctl diag