Create a Dashboard for Child Orgs (MSSPs)
The Dashboard page allows you to view log data on the same dashboard in an integrated and seamless view. This article demonstrates on how to create a dashboard, a panel query, and then add a panel to the dashboard at the child orgs level.
Create a dashboard
There are two ways to create a dashboard, either by using the following method or by creating it directly from the Log Search page. Follow the steps below to create a dashboard under a selected child org:
- Classic UI. Go to the Home screen and select Dashboard.
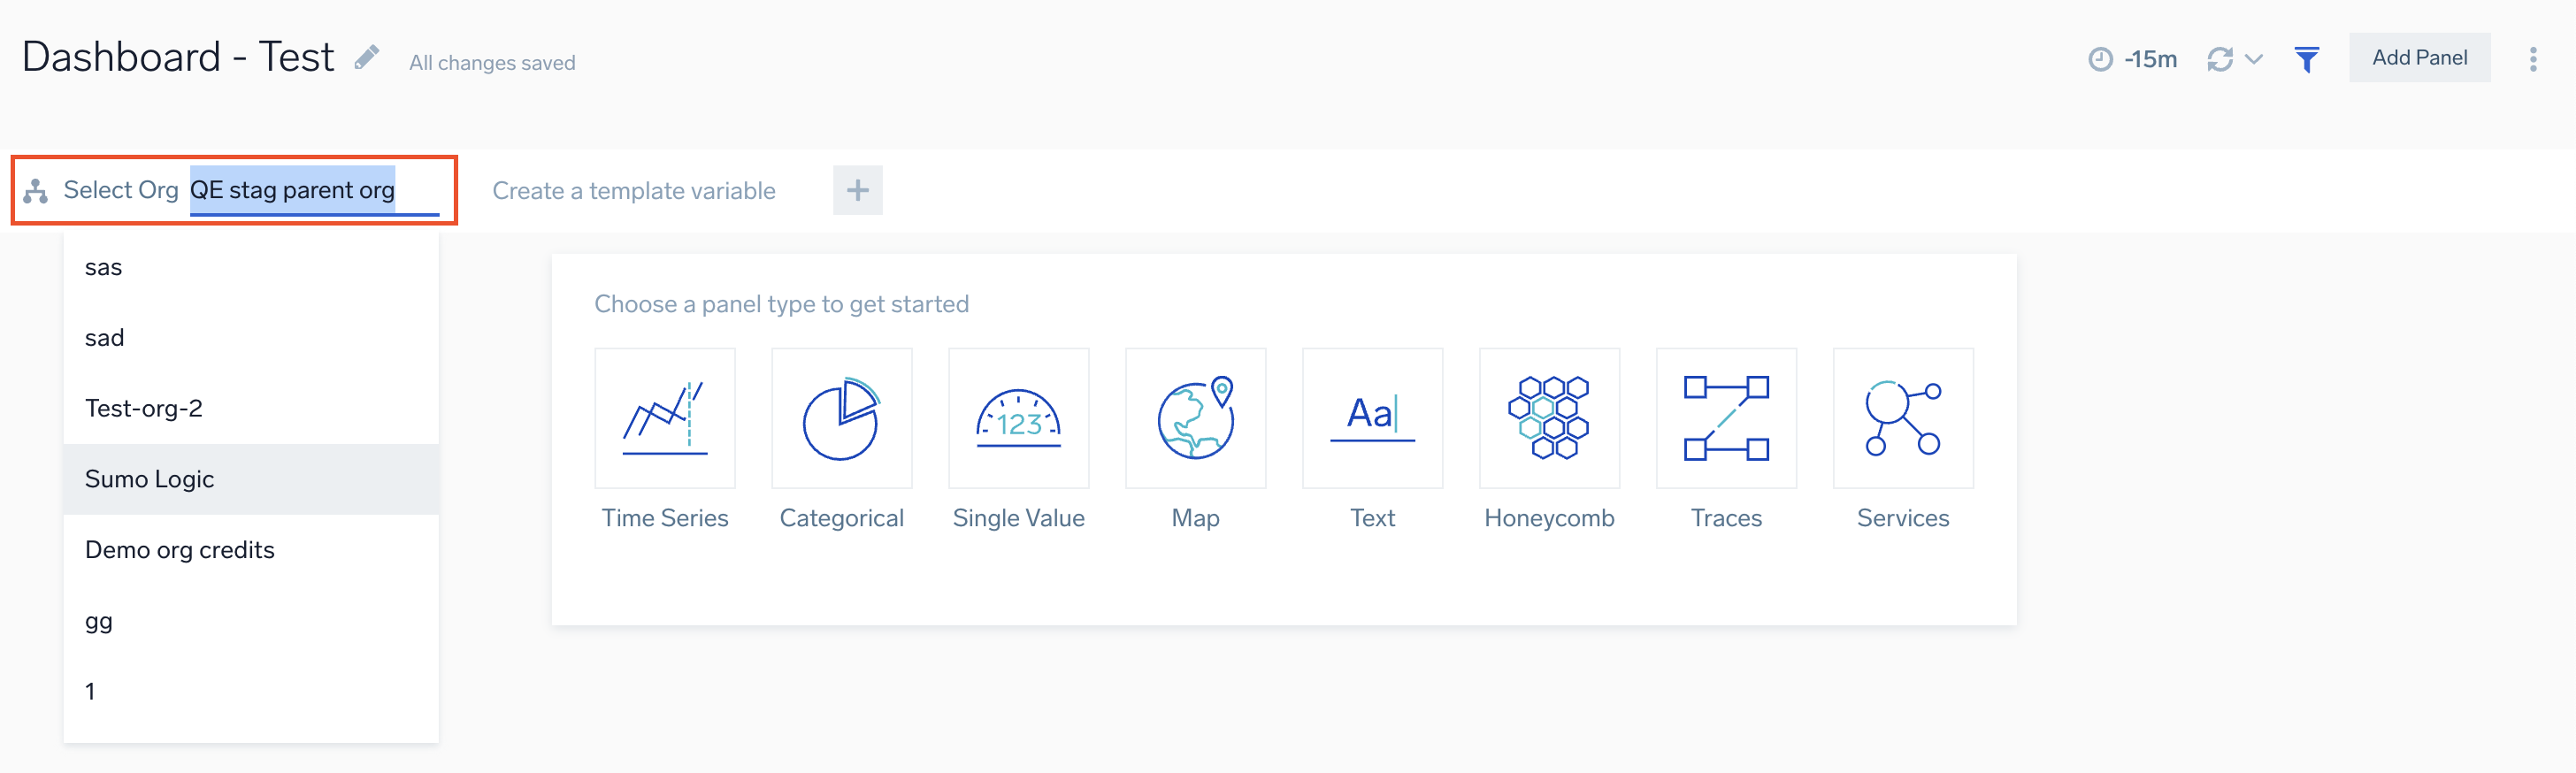
New UI. In the main Sumo Logic menu, select Dashboards > New Dashboard. You can also click the Go To... menu at the top of the screen and select New Dashboard. - Select the Dashboard text field at the top of the window and enter a unique name for your new dashboard.
- From the Select Org dropdown, select the child org under which you need to create the dashboard.
Add a panel
Now that you have created a new dashboard, you can populate it with panels that visually display your data. This task shows you how to add a panel to your new dashboard and customize the display.
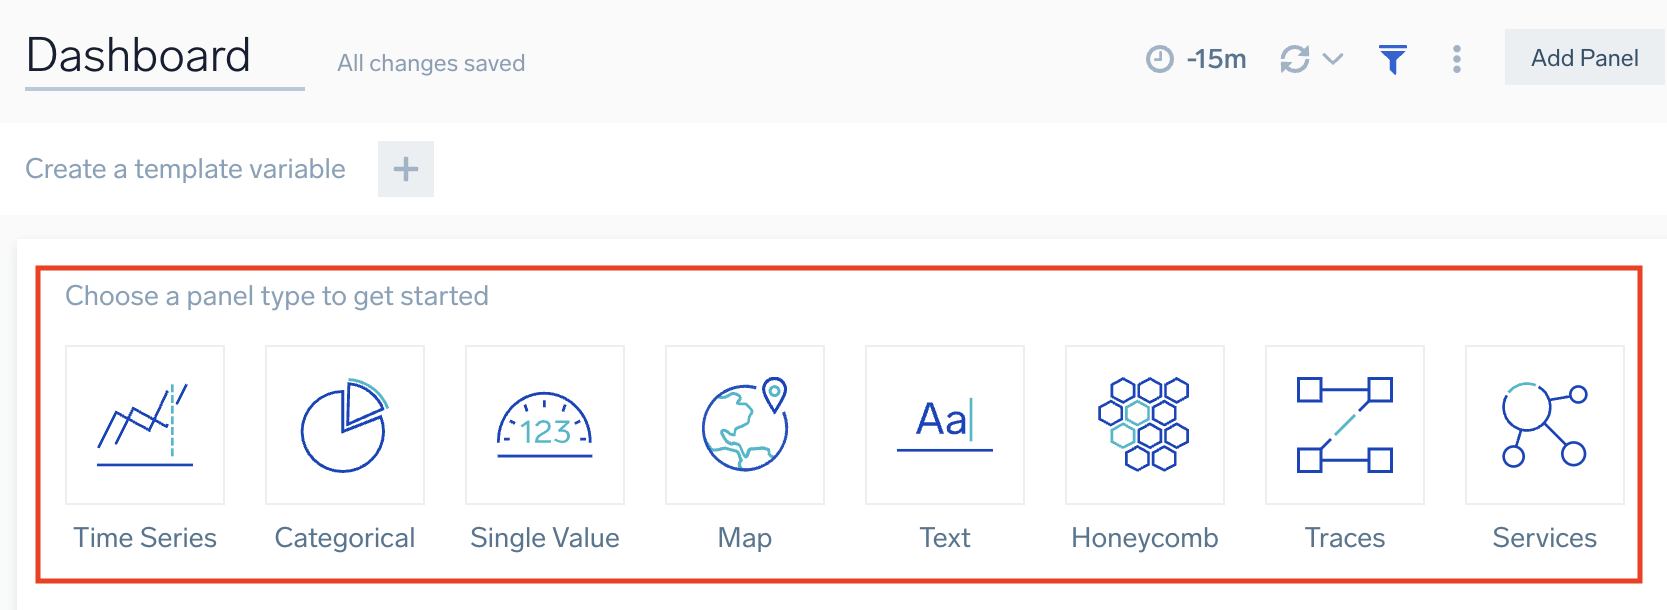
To add a panel to a new dashboard, do the following:
- Select a panel type by clicking the corresponding icon. To learn more about panels, refer to Dashboard types.
- You are prompted to provide a query.
- If you have selected the parent org while creating the dashboard, you will be able to select the child org under which the panel query needs to run.
note
The autocomplete feature while writing the query will run with respect to the selected child org.
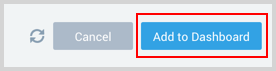
- Click the Add to Dashboard button on the top right of the window to add the panel to your dashboard.
- Once the panel is added the the dashboard, the panel query will display the results based on the default org set for the dashboard.
You can customize a chart on a dashboard panel in a variety of ways. To include changing the chart type to analyze the data in another format. See Modify a Chart for details on all the available options.
- Currently, this capability is limited only to log data.
- We only support selecting one child org to perform the log search.
Add a log query
Enter your aggregate search query in the input field and press enter. A few important things to note are:
- Only search results that have been aggregated using a group or aggregate operator can be charted. See Group or Aggregate Operators for a list.
- By default, the query builder is set to Logs.
- Joining log queries in a separate query is not supported.

Set a default org
Follow the below steps to change the default child org:
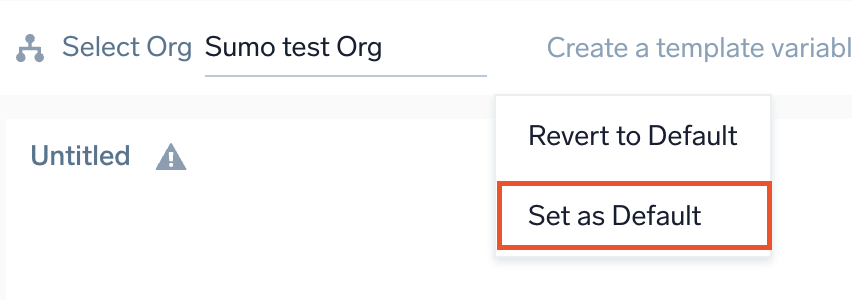
- In the Select Org dropdown, select the org of your choice.
- Click the kebab icon on the Select Org option, and select Set as Default.
Log Search page
To create a Dashboard from the Log Search page:
- Classic UI. Go to the Log Search page.
New UI. In the main Sumo Logic menu, select Logs > Log Search. You can also click the Go To... menu at the top of the screen and select Log Search. - Click the
 button to select the child org where you want to query.
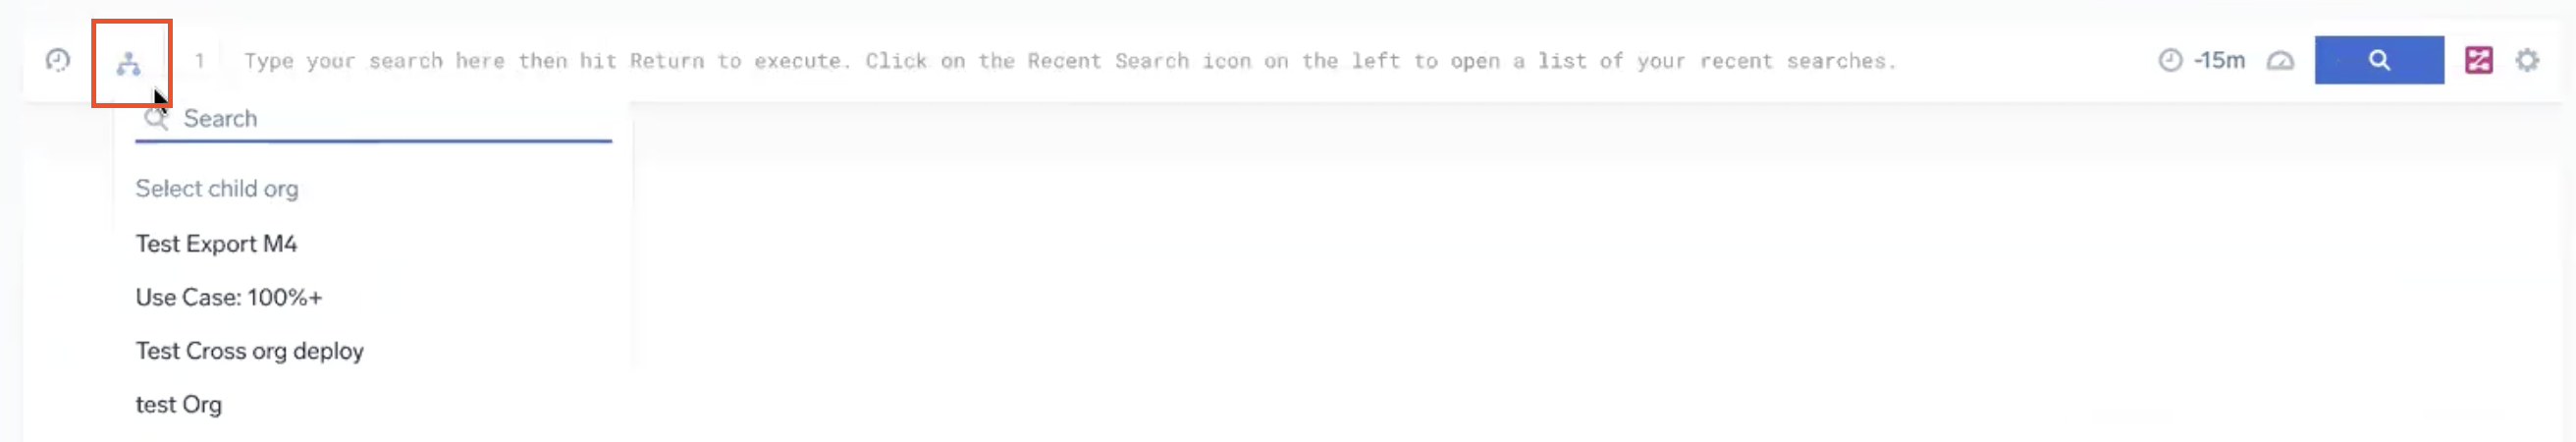
- Enter the required query and click the search button to obtain the search results.
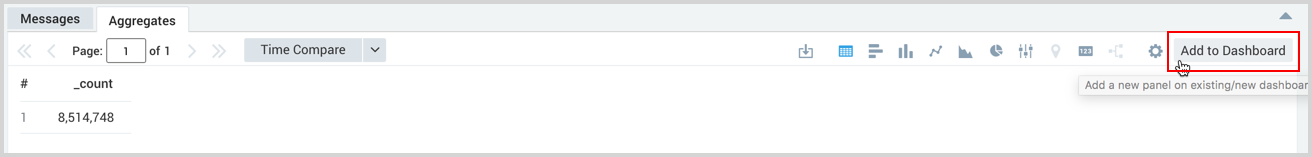
- From the Log Search page click the Add to Dashboard button on the Aggregates tab after running your aggregate query.
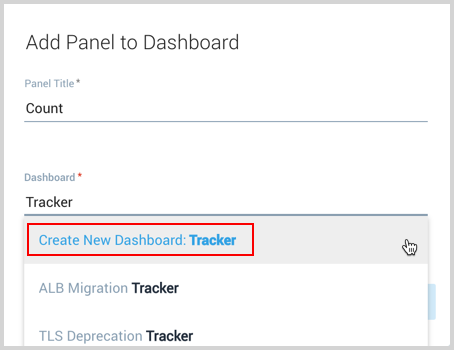
- In the Add Panel to Dashboard window provide a Panel Title and a name for the Dashboard. Once the name is entered you will have an option to select Create New Dashboard with your name. Select that option.
- In the updated window toggle the Create as Dashboard option.
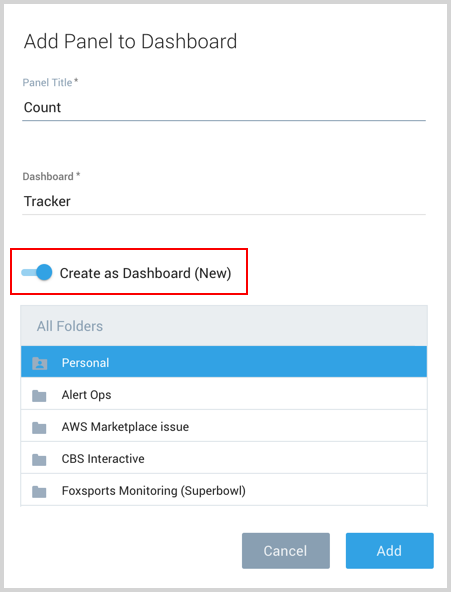
- Click Add and your new dashboard is created.
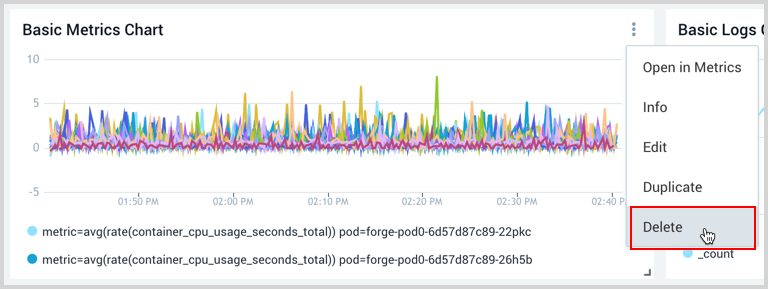
Delete a panel
You can delete a panel that you no longer need.
- Go to the dashboard in Sumo Logic that has the panel you want to delete.
- Hover the cursor over the Details icon to display the pop-up menu.
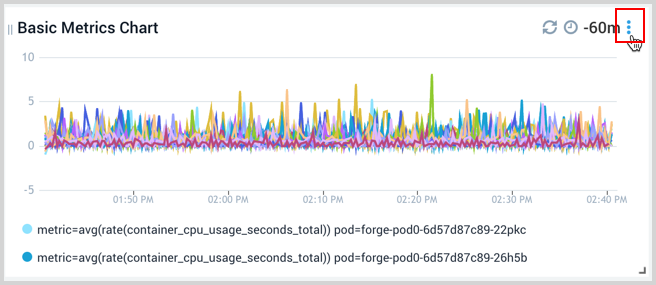
- Select Delete.
Share a dashboard
If required, toggle off the Include current variable values in the URL option to hide the variables and organiation details from the URL when you share the dashboard.
Limitations
- Public dashboards are not supported in MSSP environments.
- Scheduled reports are only supported at the parent organization level, not for child orgs.
- Metrics and span queries are supported only at the parent organization level, not for child organizations.
- Panels containing metrics or span queries will display no data if you switch from the parent organization to any child organization.
- When exporting a dashboard at the child organization level, panels with metrics or span queries will also show no data.