Supported Features
List of features
This table shows the complete list of features that are changed after the implementation of the Migrate to Dashboards feature.
| Features | Supported | Not Supported |
|---|---|---|
| Theme | No effect; migrated as-is | N/A |
| Dashboard Layout | Panel position in the grid stays the same Panel heights might slightly differ | N/A |
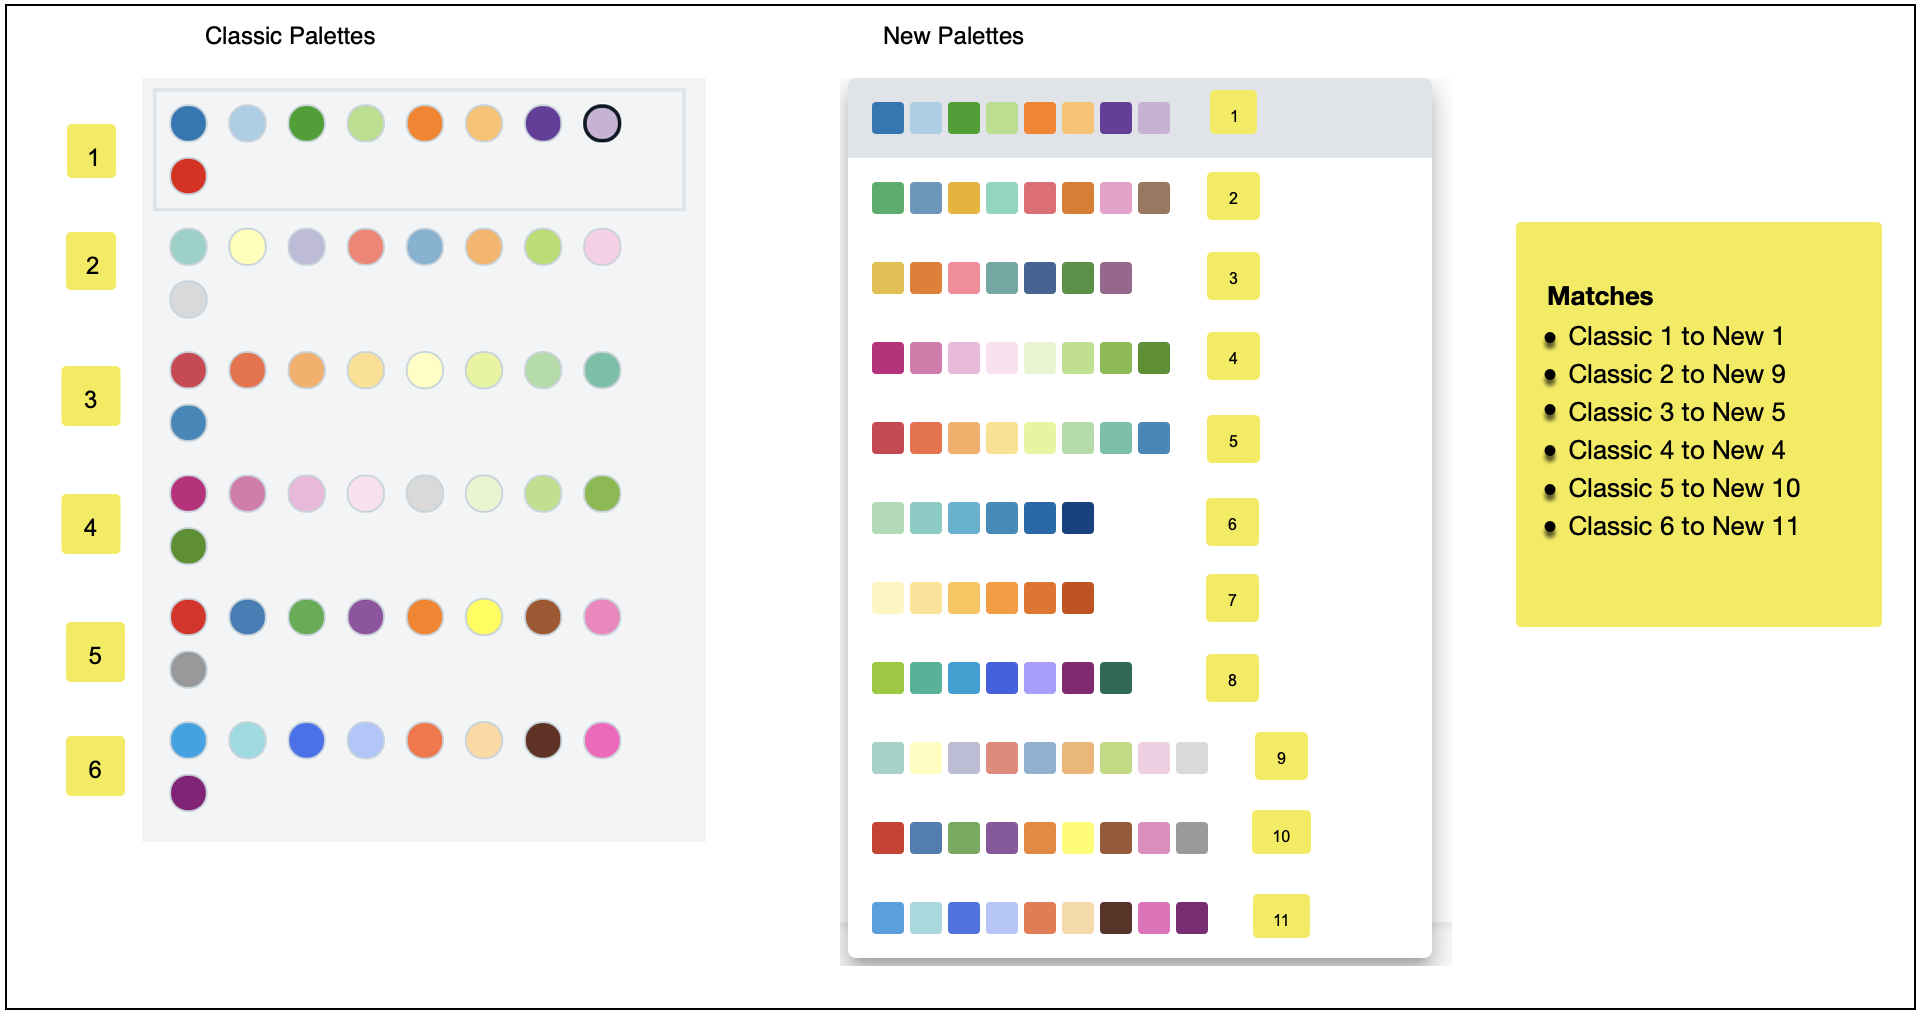
| Chart colors | Exact colors won’t be preserved, however, color families will be preserved. Learn more. | N/A |
| Table Panels |
| Text Truncation |
| Bar/Column panel |
|
|
| Line/Area panel |
|
|
| Pie/Donut panel |
|
|
| SVP panel |
|
|
| Map panel | Migrated as-is | N/A |
| Text/Title panel | Migrated as-is | N/A |
| Panel time ranges | Migrated as-is | N/A |
| Metrics query data interpolation | N/A | N/A |
| Metrics series |
| |
| Metrics panel (Line) |
|
|
| Metrics panel (Area) |
| |
| Metrics panel (Single Value) |
|
|
| Metrics panel (Single Value (Gauge)) |
| |
| Metrics panel (Single Value (Sparkline) |
|
|
Color mapping
Dashboards (Classic) had 6 color schemes, while Dashboards have 11 color schemes. The color mapping from the Classic to the dashboard is shown in the image below.
With Dashboards (Classic), you could choose chart colors while setting it up. With Dashboards, you cannot choose your colors upfront, but you can modify your color palette afterwards.