Table Charts
Table charts are the default chart type in the Aggregates tab. They are useful for listing the type and number of events that have occurred, such as the type of error that occurs the most in your system. To create a table chart, use a search query that provides at least a few data points in the Aggregates tab.
For example, you'd use the following query to create a simple table chart:
(error OR fail*) AND exception | count by _sourceCategory | sort by _count
which would produce results such as: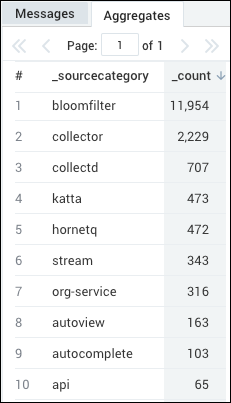
Create a table chart
To add a panel with a table chart:
-
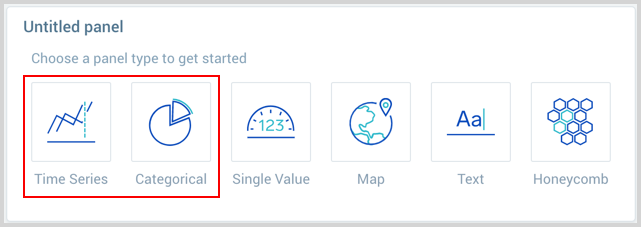
Create or open a Dashboard and click on Add Panel > Time Series or Add Panel > Categorical.
-
Provide a Metric or Log query and press Enter for it to run. You can create Log and Metric queries on the same panel.
Log query:
Enter your aggregate search query in the input field and press enter. Only search results that have been aggregated using a group or aggregate operator can be charted. See Group or Aggregate Operators for a list.

Metrics query:
Click the left-most dropdown option and select Metrics. You should be familiar with the basics of creating metrics queries to ensure successful results. By default, the query builder is set to Logs.
To create a metrics query utilize the Metrics Explorer.
-
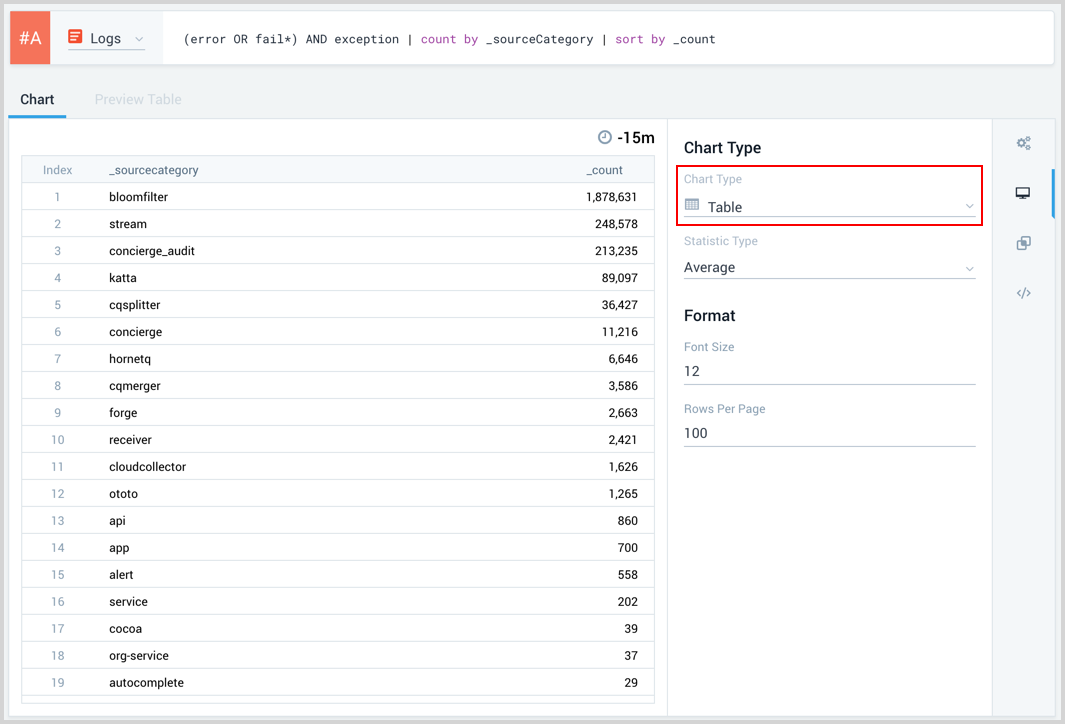
Once the query runs you will need to flip the chart type to Table.
-
Modify the chart as desired.
-
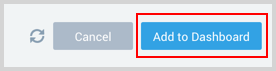
Click the Add to Dashboard button on the top right of the window to add the panel to your dashboard.
URL Links in table chart panels
When you create a table chart panel, and if your query looks for URLs, then use the tourl operator to display the URL in the table as working links.
For example, if you used this query to search for hits to the Sumo Logic Help system:
_sourceCategory=aws/cloudtrail
| keyvalue "LoginTo"
| count loginto
| sort - _count
You would see results such as the following in the Aggregates tab.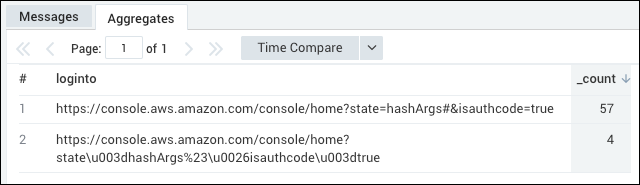
Then, follow the steps in the previous section to create a table chart panel.