Amazon OpenSearch
Amazon OpenSearch Service is a managed service that makes it easy to deploy, operate, and scale OpenSearch clusters in the AWS Cloud. An OpenSearch Service domain is synonymous with an OpenSearch cluster. Domains are clusters with the settings, instance types, instance counts, and storage resources that you specify.
The Sumo Logic app for Amazon OpenSearch collects CloudWatch logs, CloudWatch metrics, and CloudTrail logs, providing a unified logs and metrics app that provides insights into the operations and utilization of your OpenSearch service. The preconfigured dashboards help you monitor the key metrics by domain names and nodes, view the OpenSearch events for activities, and help you plan the capacity of your OpenSearch service.
Log and metrics types
The Sumo Logic app for Amazon OpenSearch uses:
Sample CloudWatch log messages
Click to expand
{
  "audit_cluster_name":"123456789012:domain",
  "audit_node_name":"52f5539f7ec0ff32d343cf6ccfe",
  "audit_rest_request_method":"GET",
  "audit_category":"FAILED_LOGIN",
  "audit_request_origin":"REST",
  "audit_node_id":"sSem4l5mS62GrF_16hJG",
  "audit_request_layer":"REST",
  "audit_rest_request_path":"/_plugins/_security/authinfo",
  "@timestamp":"2024-09-20T16:31:50.748+00:00",
  "audit_request_effective_user_is_admin":false,
  "audit_format_version":4,
  "audit_request_remote_address":"123.123.123.123",
  "audit_rest_request_headers":
  {
    "x-opensearch-product-origin":["opensearch-dashboards"],
    "Connection":["keep-alive"],
    "x-opaque-id":["034d8a88-ec0b-4b89-acbb-62ceb6cb53d9"],
    "Host":["localhost:9200"],
    "Content-Length":["0"],
    "NO_REDACT":["false"]
  },
  "audit_request_effective_user":"golfer"
    }
{
   "timestamp":1682935339000,
   "message":"[2024-09-21T18:28:01,096][WARN ][o.o.m.j.JvmGcMonitorService] [0cd02afc6f6d01969107ab4daab135b5] [gc][young][552854][3753] duration [1s], collections [1]__PATH__[1.8s], total [1s]__PATH__[21.3m], memory [758.4mb]->[331.7mb]__PATH__[1gb], all_pools {[young] [427mb]->[0b]__PATH__[0b]}{[old] [328.8mb]->[328.8mb]__PATH__[1gb]}{[survivor] [2.6mb]->[2.8mb]__PATH__[0b]}",
   "logStream":"flights",
   "logGroup":"/aws/OpenSearchService/domains/flights/application-logs"
}
{
  "timestamp":1716444593813,
  "message":"[2024-09-20T17:12:48,050][WARN ][index.search.slowlog.query] [0cd02afc6f6d01969107ab4daab135b5] [opensearch_dashboards_sample_data_ecommerce][0] took[208.8micros], took_millis[0], total_hits[0 hits], stats[], search_type[QUERY_THEN_FETCH], total_shards[1], source[{"size":0,"timeout":"60000ms","query":{"match_none":{"boost":1.0}},"_source":{"includes":[],"excludes":[]},"stored_fields":"*","docvalue_fields":[{"field":"customer_birth_date","format":"date_time"},{"field":"order_date","format":"date_time"},{"field":"products.created_on","format":"date_time"}],"script_fields":{},"track_total_hits":2147483647,"aggregations":{"2":{"date_histogram":{"field":"order_date","time_zone":"Asia/Calcutta","fixed_interval":"3h","offset":0,"order":{"_key":"asc"},"keyed":false,"min_doc_count":1},"aggregations":{"3":{"terms":{"field":"category.keyword","size":5,"min_doc_count":1,"shard_min_doc_count":0,"show_term_doc_count_error":false,"order":[{"1":"desc"},{"_key":"asc"}]},"aggregations":{"1":{"sum":{"field":"total_quantity"}}}}}}}}], id[1eb71e9e-8cb5-4fcd-a96f-7bd063e92068],",
  "logStream":"flights",
  "logGroup":"/aws/OpenSearchService/domains/flights/search-logs"
}
Sample CloudTrail logs message
Click to expand
{
  "eventVersion": "1.05",
  "userIdentity": {...},
  "eventTime": "2018-08-21T22:00:05Z",
  "eventSource": "es.amazonaws.com",
  "eventName": "CreateDomain",
  "awsRegion": "us-west-1",
  "sourceIPAddress": "123.123.123.123",
  "userAgent": "signin.amazonaws.com",
  "requestParameters": {
    "engineVersion": "OpenSearch_1.0",
    "clusterConfig": {
      "instanceType": "m4.large.search",
      "instanceCount": 1
    },
    "snapshotOptions": {
      "automatedSnapshotStartHour": 0
    },
    "domainName": "flights",
    "encryptionAtRestOptions": {},
    "eBSOptions": {
      "eBSEnabled": true,
      "volumeSize": 10,
      "volumeType": "gp2"
    },
    "accessPolicies": {...},
  "responseElements": {
    "domainStatus": {
      "created": true,
      "clusterConfig": {
        "zoneAwarenessEnabled": false,
        "instanceType": "m4.large.search",
        "dedicatedMasterEnabled": false,
        "instanceCount": 1
      },
      "cognitoOptions": {
        "enabled": false
      },
      "encryptionAtRestOptions": {
        "enabled": false
      },
      "advancedOptions": {
        "rest.action.multi.allow_explicit_index": "true"
      },
      "upgradeProcessing": false,
      "snapshotOptions": {
        "automatedSnapshotStartHour": 0
      },
      "eBSOptions": {
        "eBSEnabled": true,
        "volumeSize": 10,
        "volumeType": "gp2"
      },
      "engineVersion": "OpenSearch_1.0",
      "processing": true,
      "aRN": "arn:aws:es:us-west-1:123456789012:domain/domainName",
      "domainId": "123456789012/flights",
      "deleted": false,
      "domainName": "flights",
      "accessPolicies": {...},
  "requestID": "12345678-1234-1234-1234-987654321098",
  "eventID": "87654321-4321-4321-4321-987654321098",
  "eventType": "AwsApiCall",
  "recipientAccountId": "123456789012"
}
Sample queries
account=* region=* namespace=aws/es domainname=* "[WARN ][o.o.m.j.JvmGcMonitorService]"
| parse "[*][WARN ][o.o.m.j.JvmGcMonitorService] [*] [gc][young][*][*] duration [*s], collections [*]__PATH__[*], total [*]__PATH__[*], memory [*mb]->[*mb]__PATH__[*], all_pools {*}" as timestamp, node_id, gc_event, gc_event_id, duration, collections, total_duration, total_duration1, total_duration2, memory_before_gc, memory_after_gc, memory_total, pool_details
| parse field=pool_details "[*] [*]->[*]__PATH__[*]" as pool_name, pool_memory_before, pool_memory_after, pool_memory_total
| num(duration)
| sum(duration) as Total_Time, avg(duration) as Avg_Time, max(duration) as Max_Time
| fields Avg_Time
account=* region=* namespace=aws/es domainname=* "[index.search.slowlog.query]"
| parse "[*][*][*] [*] [*][*] took[*], took_millis[*], total_hits[*], stats[], search_type[*], total_shards[*], source[*], id[*]" as timestamp,log_level,log_type, node_id, index_name, shard_number, execution_time, execution_time_millis, total_hits, search_type, total_shards, source, id
| where log_type = "index.search.slowlog.query"
| num(execution_time_millis) as execution_time_millis
| count as frequency by domainname, index_name, node_id, execution_time_millis , source
| topk(5, execution_time_millis) by index_name
account=* region=* namespace=aws/es domainname=* FAILED_LOGIN
| json "audit_cluster_name", "audit_node_id","audit_category","audit_request_origin", "audit_request_remote_address", "audit_request_layer","audit_request_effective_user", "audit_rest_request_path"
| parse field= audit_cluster_name "*:*" as account_id, domain_name
| where (tolowercase(domain_name) matches tolowercase("*"))
| where audit_category = "FAILED_LOGIN" and audit_rest_request_path matches "*plugins/_security/authinfo"
| count as freq by domainname, audit_request_effective_user
| sort by freq, domainname asc, audit_request_effective_user asc
account=* region=* namespace=aws/es "\"eventsource\":\"es.amazonaws.com\""
| json "userIdentity", "eventSource", "eventName", "awsRegion", "sourceIPAddress", "userAgent", "eventType", "recipientAccountId", "requestParameters", "responseElements", "requestID", "errorCode", "errorMessage" as userIdentity, event_source, event_name, region, src_ip, user_agent, event_type, recipient_account_id, requestParameters, responseElements, request_id, error_code, error_message nodrop
| where event_source = "es.amazonaws.com"
| json field=userIdentity "accountId", "type", "arn", "userName"  as accountid, type, arn, username nodrop
| parse field=arn ":assumed-role/*" as user nodrop
| parse field=arn "arn:aws:iam::*:*" as accountid, user nodrop
| json field=requestParameters "domainName" as domainname nodrop
| if (isBlank(accountid), recipient_account_id, accountid) as accountid
| if (isEmpty(error_code), "Success", "Failure") as event_status
| if (isEmpty(username), user, username) as user
| count as event_count by event_name
| sort by event_count, event_name asc
account=* region=* namespace=aws/es domainname=* !nodeid=* metric=WriteLatency statistic = average | avg by domainname
Collecting logs and metrics for the Amazon OpenSearch app
This section has instructions for collecting logs and metrics for the Amazon OpenSearch Service app.
Collecting CloudWatch logs
To enable Amazon OpenSearch CloudWatch Logs, follow the steps mentioned in AWS Documentation
Ensure that when configuring CloudWatch Logs, the log group name follows the pattern /aws/OpenSearchService/domains/DOMAIN_NAME/LOG_TYPE.
Sumo Logic supports several methods for collecting logs from Amazon CloudWatch. You can choose either of them to collect logs:
-
AWS Kinesis Firehose for Logs. Configure an AWS Kinesis Firehose for Logs (Recommended); or
-
Lambda Log Forwarder. Configure a collection of Amazon CloudWatch Logs using our AWS Lambda function using a Sumo Logic provided CloudFormation template, as described in Amazon CloudWatch Logs or configure collection without using CloudFormation, see Collect Amazon CloudWatch Logs using a Lambda Function.
-
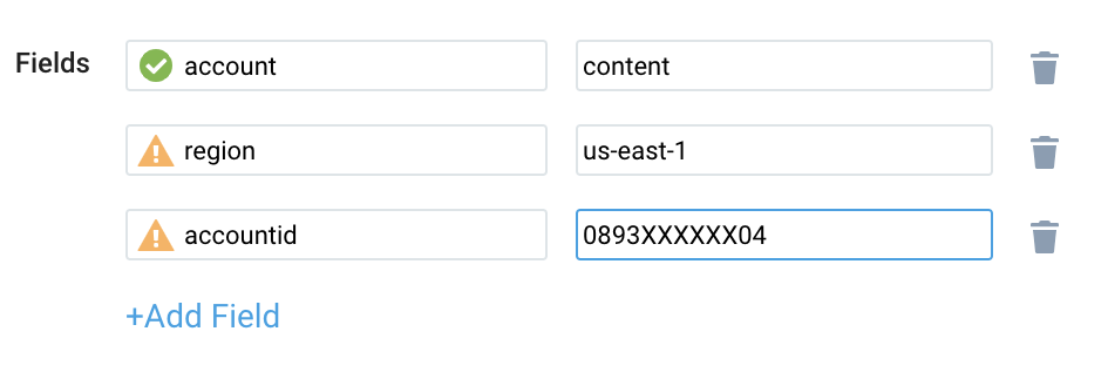
While configuring the CloudWatch log source, the following fields can be added to the source:
- Add an account field and assign it a value which is a friendly name/alias to your AWS account from which you are collecting logs. Logs can be queried via the account field.
- Add a region field and assign it the value of the respective AWS region where the OpenSearch domain exists.
- Add an accountId field and assign it the value of the respective AWS account ID that is being used.
Collecting CloudTrail logs
- Add an AWS CloudTrail Source to your Hosted Collector.
- Name. Enter a name to display for the new Source.
- Description. Enter an optional description.
- S3 Region. Select the Amazon Region for your CloudTrail S3 bucket.
- Bucket Name. Enter the exact name of your CloudTrail S3 bucket.
- Path Expression. Enter the string that matches the S3 objects you'd like to collect. You can use a wildcard (*) in this string. (DO NOT use a leading forward slash. See Amazon Path Expressions). The S3 bucket name is not part of the path. Don’t include the bucket name when you are setting the Path Expression.
- Source Category. Enter a source category. For example, enter
aws/observability/CloudTrail/logs. - Fields. Add an account field and assign it a value that is a friendly name/alias to your AWS account from which you are collecting logs. Logs can be queried using the account field.
- Access Key ID and Secret Access Key. Enter your Amazon Access Key ID and Secret Access Key. Learn how to use Role-based access to AWS here.
- Log File Discovery > Scan Interval. Use the default of 5 minutes. Alternatively, enter the frequency. Sumo Logic will scan your S3 bucket for new data. Learn how to configure Log File Discovery here.
- Enable Timestamp Parsing. Select the Extract timestamp information from log file entries check box.
- Time Zone. Select Ignore time zone from the log file and instead use, and select UTC from the dropdown.
- Timestamp Format. Select Automatically detect the format.
- Enable Multiline Processing. Select the Detect messages spanning multiple lines check box, and select Infer Boundaries.
- Click Save.
Collecting CloudWatch metrics
- Configure a Hosted Collector.
- Configure an Amazon CloudWatch Source for Metrics or AWS Kinesis Firehose for Metrics Source (Recommended).
- Namespaces. Select aws/es.
- Metadata. Add an account field to the source and assign it a value that is a friendly name/alias to your AWS account from which you are collecting metrics. The account field allows you to query metrics.
- Click Save.
Configure field in Field Schema
- New UI. In the main Sumo Logic menu, select Data Management, and then under Logs select Fields. You can also click the Go To... menu at the top of the screen and select Fields.
Classic UI. In the main Sumo Logic menu, select Manage Data > Logs > Fields. - Search for the
domainnamefield. - If not present, create it. Learn how to create and manage fields here.
Configure Field Extraction Rule(s)
Create a Field Extraction Rule for CloudTrail Logs. Learn how to create a Field Extraction Rule here.
Rule Name: AwsObservabilityOpenSearchCloudTrailLogsFER
Applied at: Ingest Time
Scope (Specific Data): account=* eventName eventSource "es.amazonaws.com"
| json "eventSource", "awsRegion", "recipientAccountId", "requestParameters.domainName" as event_source, region, accountid, domainname nodrop
| where event_source = "es.amazonaws.com"
| toLowerCase(domainname) as domainname
| "aws/es" as namespace
| fields region, namespace, domainname, accountid
Create/Update Field Extraction Rule(s) for OpenSearch CloudWatch logs
Rule Name: AwsObservabilityOpenSearchCloudWatchLogsFER
Applied at: Ingest Time
Scope (Specific Data):
account=* region=* _sourceHost=/aws/OpenSearchService/*
| if (isEmpty(namespace),"unknown",namespace) as namespace
| if (_sourceHost matches "/aws/OpenSearchService/*", "aws/es", namespace) as namespace
| parse field=_sourceHost "/aws/OpenSearchService/domains/*/*" as domainname,logType nodrop
| tolowercase(domainname) as domainname
| fields namespace, domainname
Collecting Centralized AWS CloudTrail logs
In case you have a centralized collection of CloudTrail logs and are ingesting them from all accounts into a single Sumo Logic CloudTrail log source, create the following Field Extraction Rule to map a proper AWS account(s) friendly name/alias. Create it if not already present or update it as required.
- Rule Name: AWS Accounts
- Applied at: Ingest Time
- Scope (Specific Data):
_sourceCategory=aws/observability/cloudtrail/logs - Parse Expression: Enter a parse expression to create an “account” field that maps to the alias you set for each sub-account. For example, if you used the “dev” alias for an AWS account with ID "528560886094" and the “prod” alias for an AWS account with ID "567680881046", your parse expression would look like:
| json "recipientAccountId"
// Manually map your AWS account ID with the AWS account alias you set up earlier for the individual child account
| "" as account
| if (recipientAccountId = "528560886094",  "dev", account) as account
| if (recipientAccountId = "567680881046",  "prod", account) as account
| fields account
Installing the Amazon OpenSearch app
Now that you have set up a collection for Amazon OpenSearch, install the Sumo Logic app to use the pre-configured dashboards that provide visibility into your environment for real-time analysis of overall usage.
To install the app, do the following:
Next-Gen App: To install or update the app, you must be an account administrator or a user with Manage Apps, Manage Monitors, Manage Fields, Manage Metric Rules, and Manage Collectors capabilities depending upon the different content types part of the app.
- Select App Catalog.
- In the 🔎 Search Apps field, run a search for your desired app, then select it.
- Click Install App.
note
Sometimes this button says Add Integration.
- Click Next in the Setup Data section.
- In the Configure section of your respective app, complete the following fields.
- Field Name. If you already have collectors and sources set up, select the configured metadata field name (eg _sourcecategory) or specify other custom metadata (eg: _collector) along with its metadata Field Value.
- Click Next. You will be redirected to the Preview & Done section.
Post-installation
Once your app is installed, it will appear in your Installed Apps folder, and dashboard panels will start to fill automatically.
Each panel slowly fills with data matching the time range query received since the panel was created. Results will not immediately be available but will be updated with full graphs and charts over time.
As part of the app installation process, the following fields will be created by default:
account: The friendly name or alias assigned to the AWS account.region: The geographical region where the AWS resource is located (for example, us-east-1 or eu-west-2).accountid: The unique 12-digit identifier for the AWS account where the resource is present.namespace: The AWS service namespace that the resource or metric belongs to (for example, AWS/ES or AWS/OpenSearch).domainname: A specific identifier for the OpenSearch domain within AWS OpenSearch Service.
Viewing Amazon OpenSearch dashboards
Overview
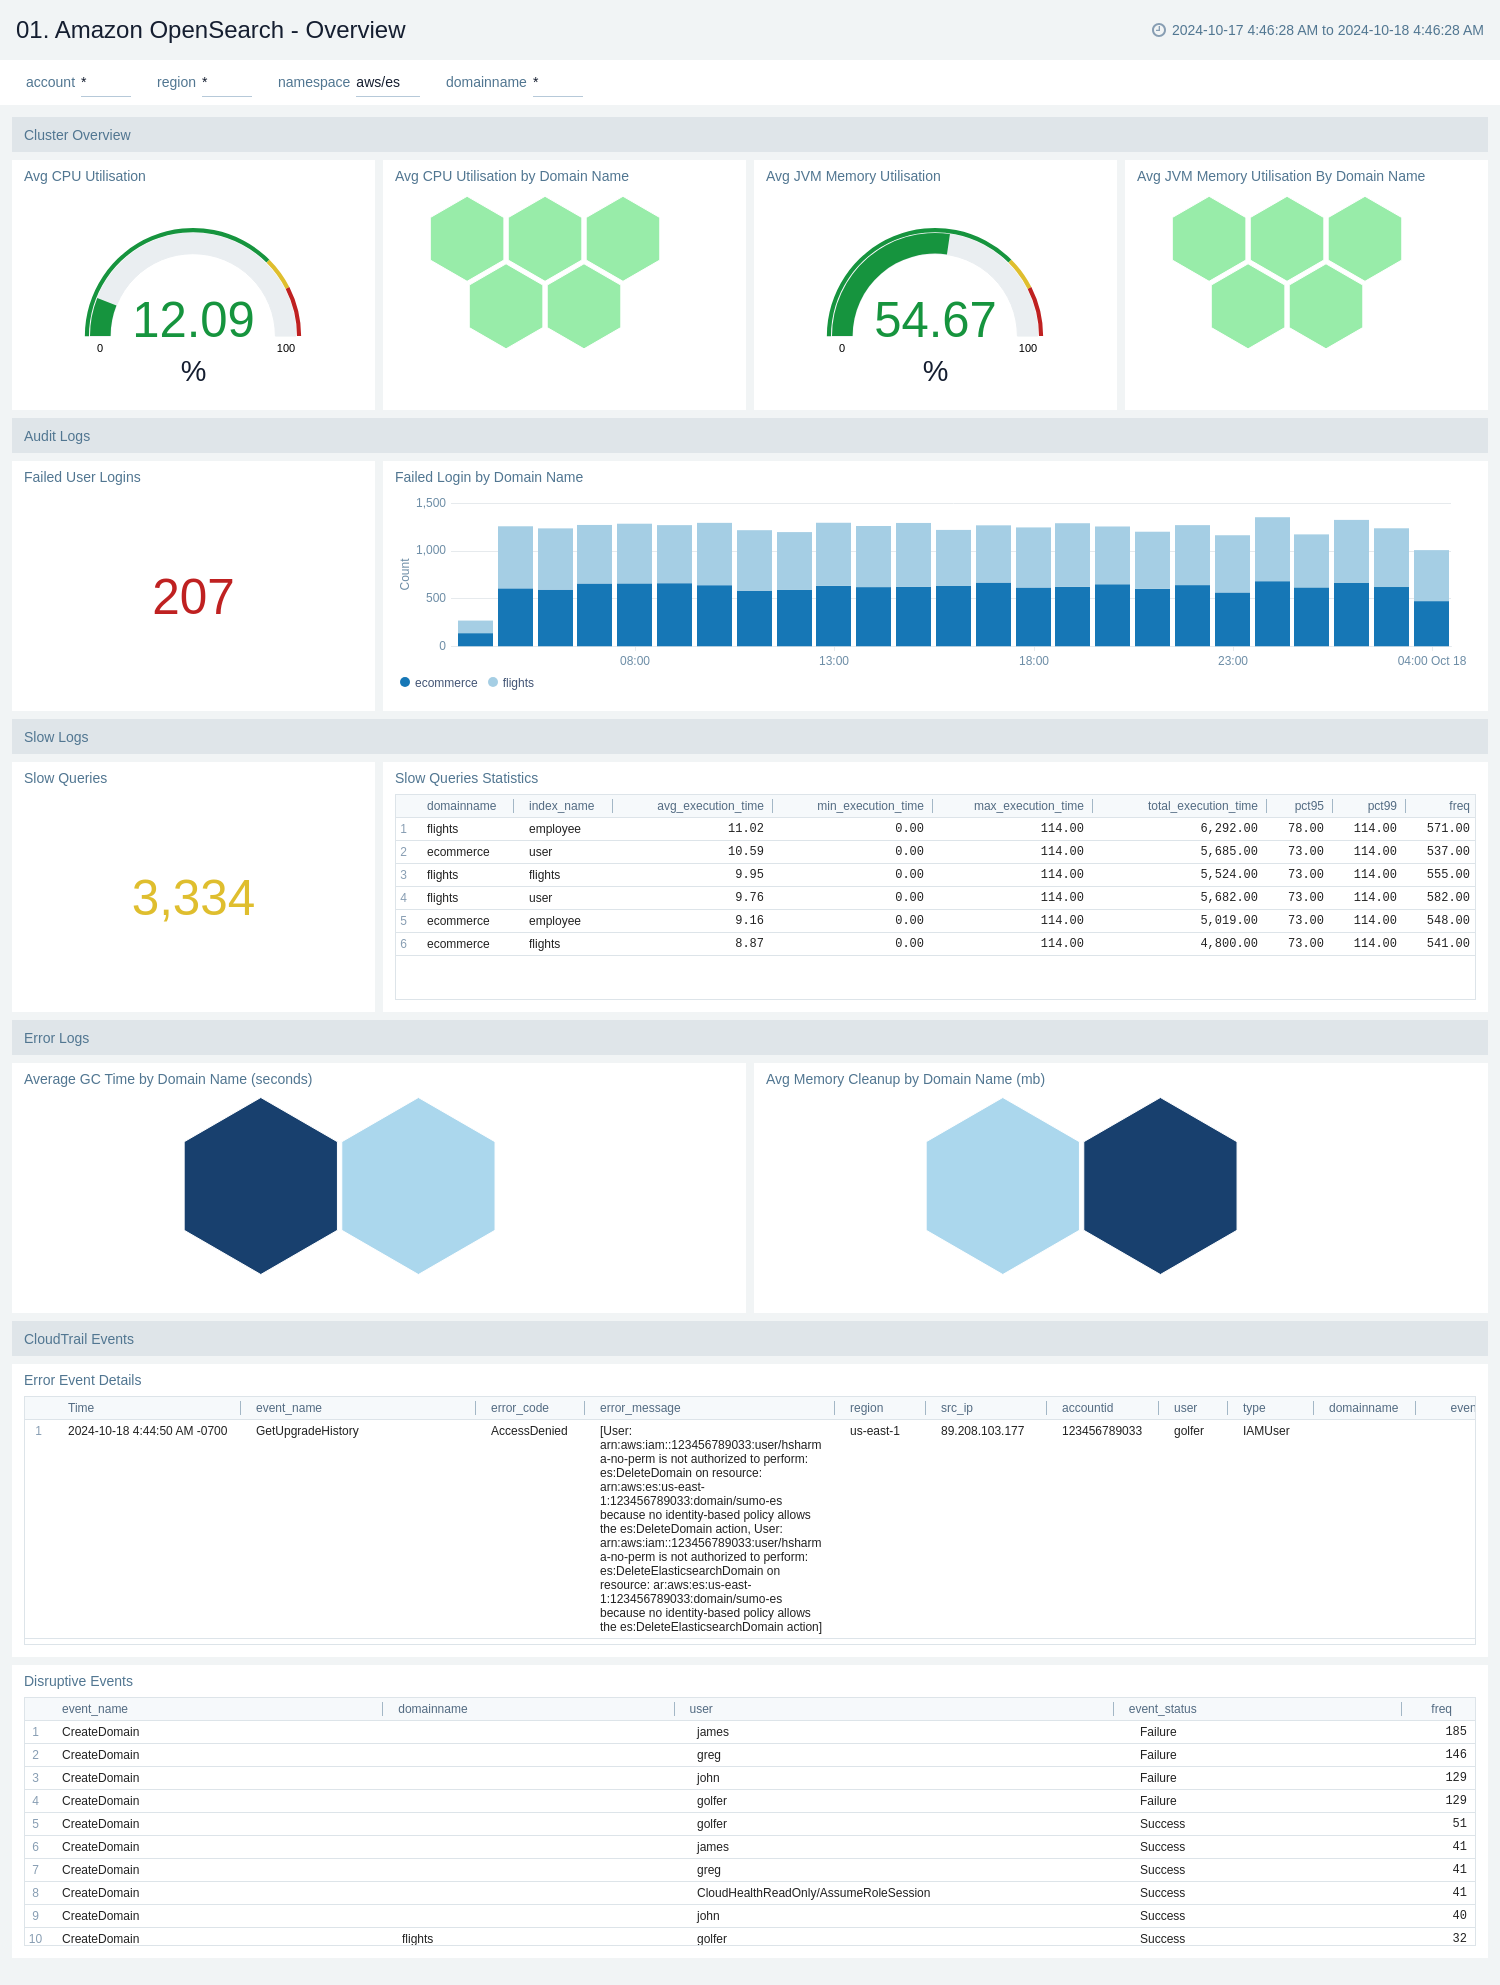
The Amazon OpenSearch - Overview dashboard provides a comprehensive overview of Amazon OpenSearch performance and operational metrics. It displays key information about cluster utilization, user activity, query performance, error logs, and system events. This dashboard is designed to help administrators monitor and optimize their OpenSearch deployment across different domains and regions.
Use this dashboard to:
- Monitor cluster health and resource utilization by tracking CPU and memory usage across different domain names.
- Identify security issues by analyzing failed user logins and their distribution across domains.
- Optimize query performance by examining slow query statistics and execution times for different index types and domains.
Performance Overview
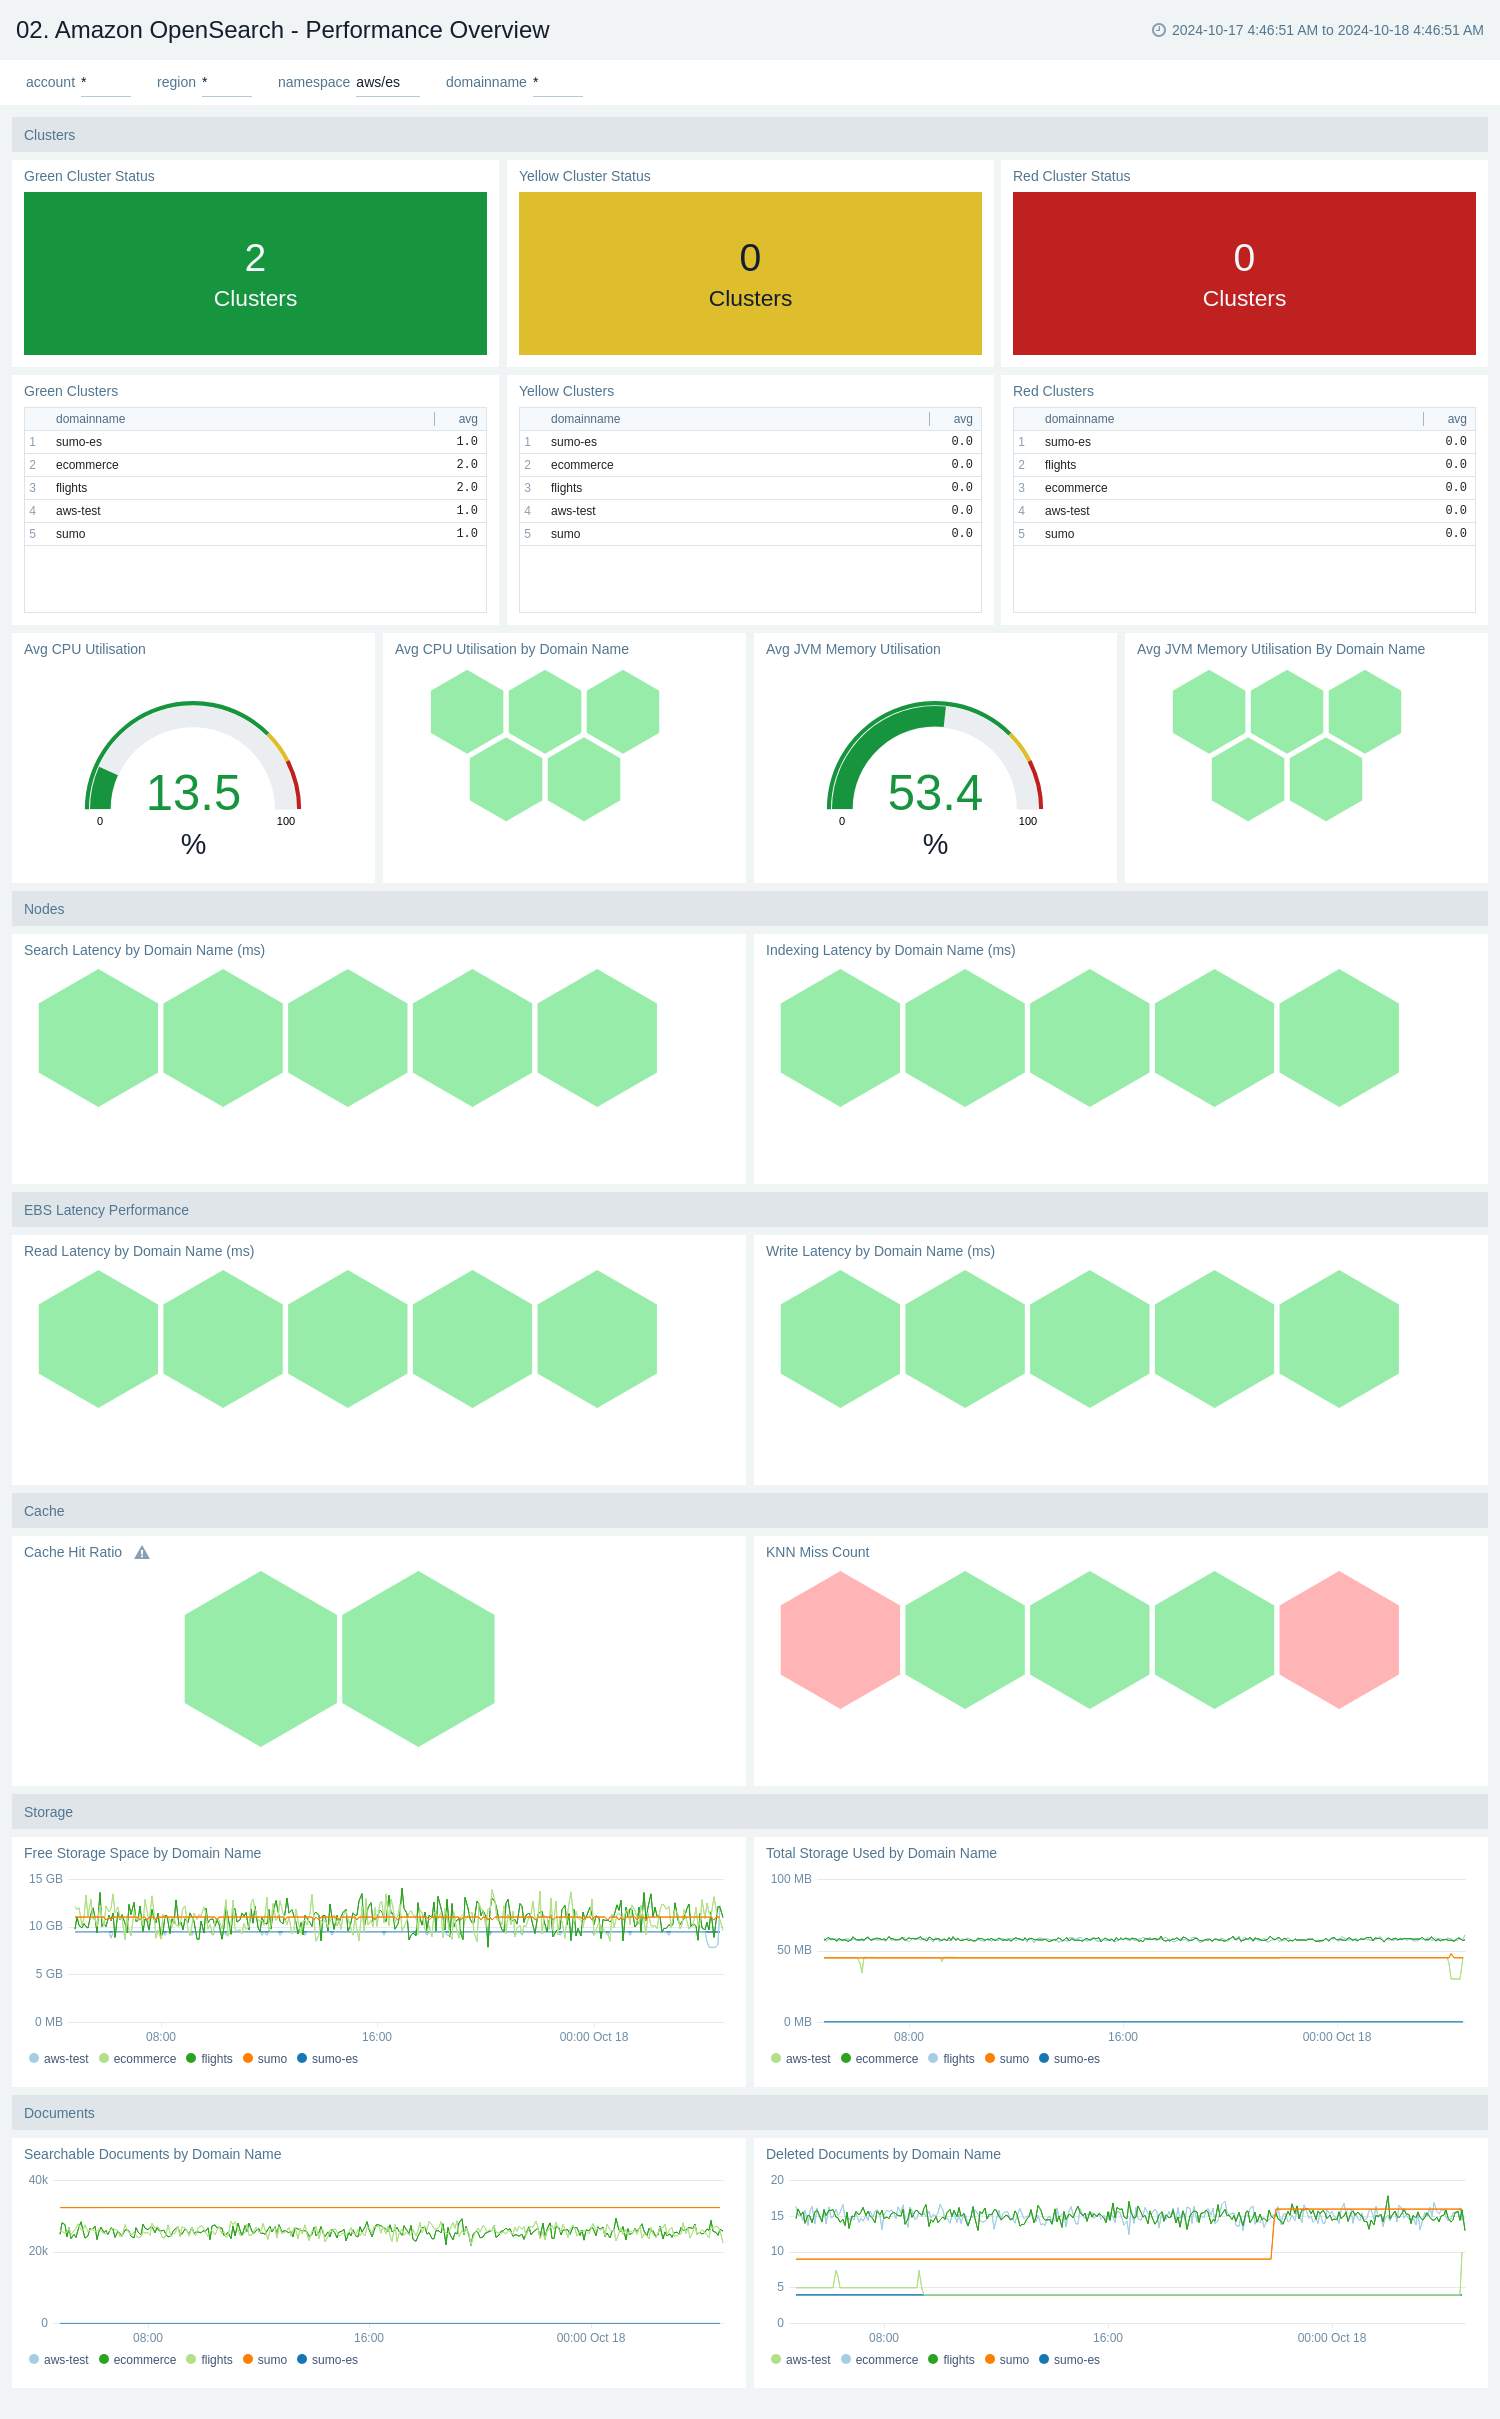
The Amazon OpenSearch - Performance Overview dashboard provides a comprehensive view of the OpenSearch cluster's health, performance, and resource utilization. It offers real-time insights into cluster status, CPU and memory usage, storage metrics, document management, and read/write latencies across multiple domains.
Use this dashboard to:
- Monitor the overall health of OpenSearch clusters with color-coded status indicators (green, yellow, or red) and quickly identify the number of clusters in each state.
- Track resource utilization, including average CPU and JVM memory usage, both by overall and individual domain names.
- Analyze storage trends and capacity, with graphs showing free storage space and total storage used over time for different domains.
- Keep tabs on document management activities, including the number of searchable and deleted documents per domain.
- Assess system performance by observing read and write latencies across various domain names, helping you to identify potential bottlenecks or areas for optimization.
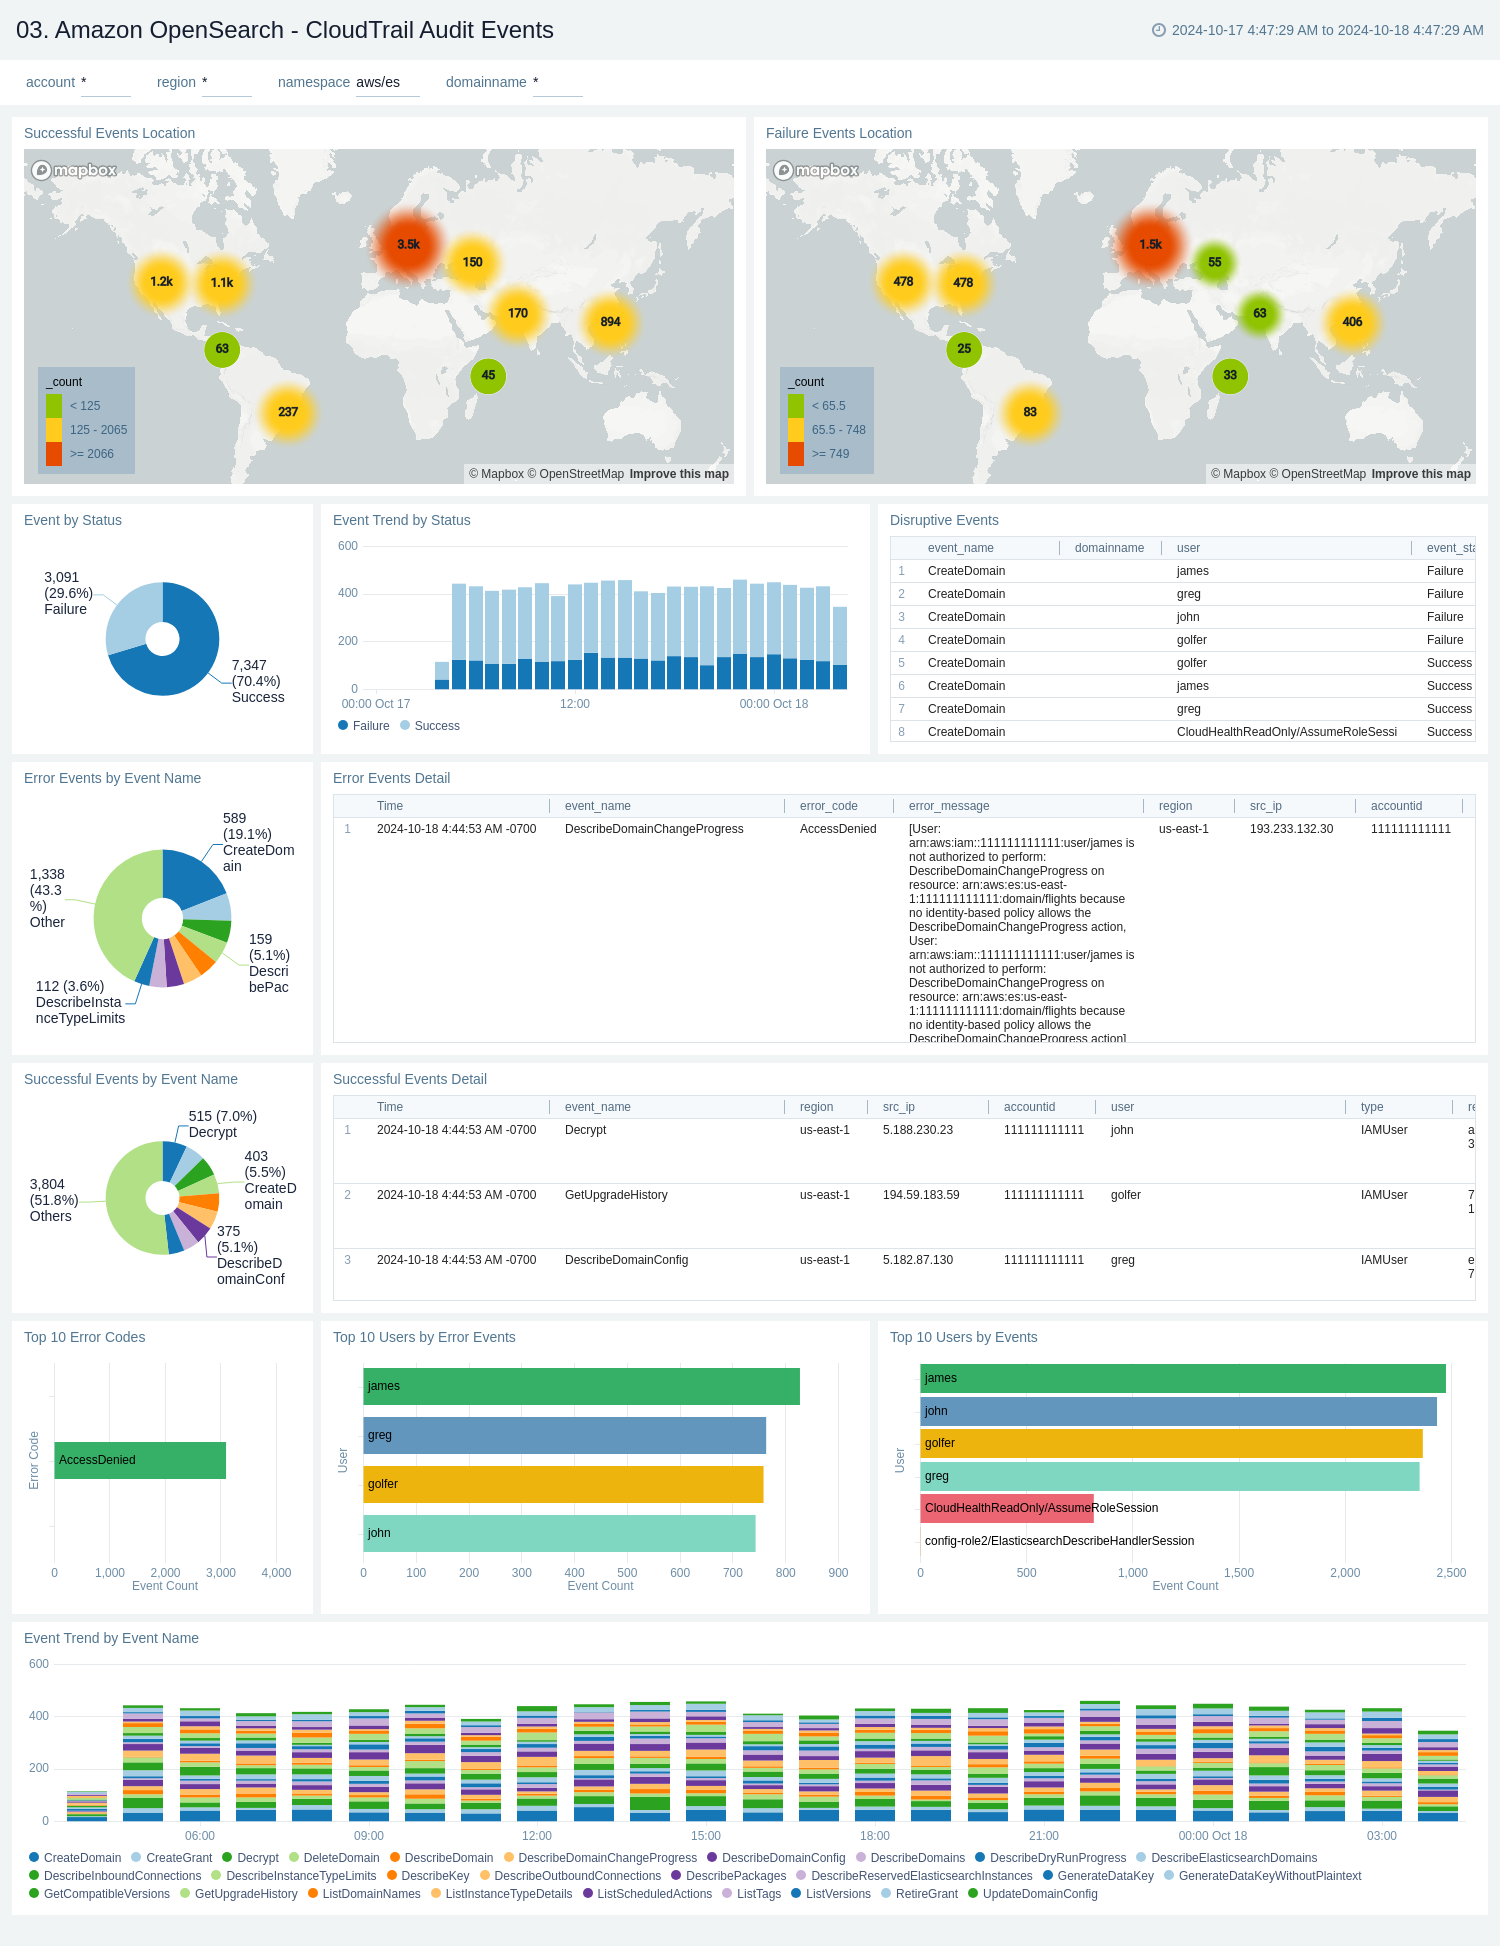
CloudTrail Audit Events
The Amazon Opensearch - CloudTrail Audit Events dashboard provides insights across CloudTrail events across location, status, and topic names.
Use this dashboard to:
- Monitor successful and failed events by location.
- Get trends of events by status and type.
- Monitor successful and error events with error codes in detail.
- Get details of domain names and users of both successful and error events.
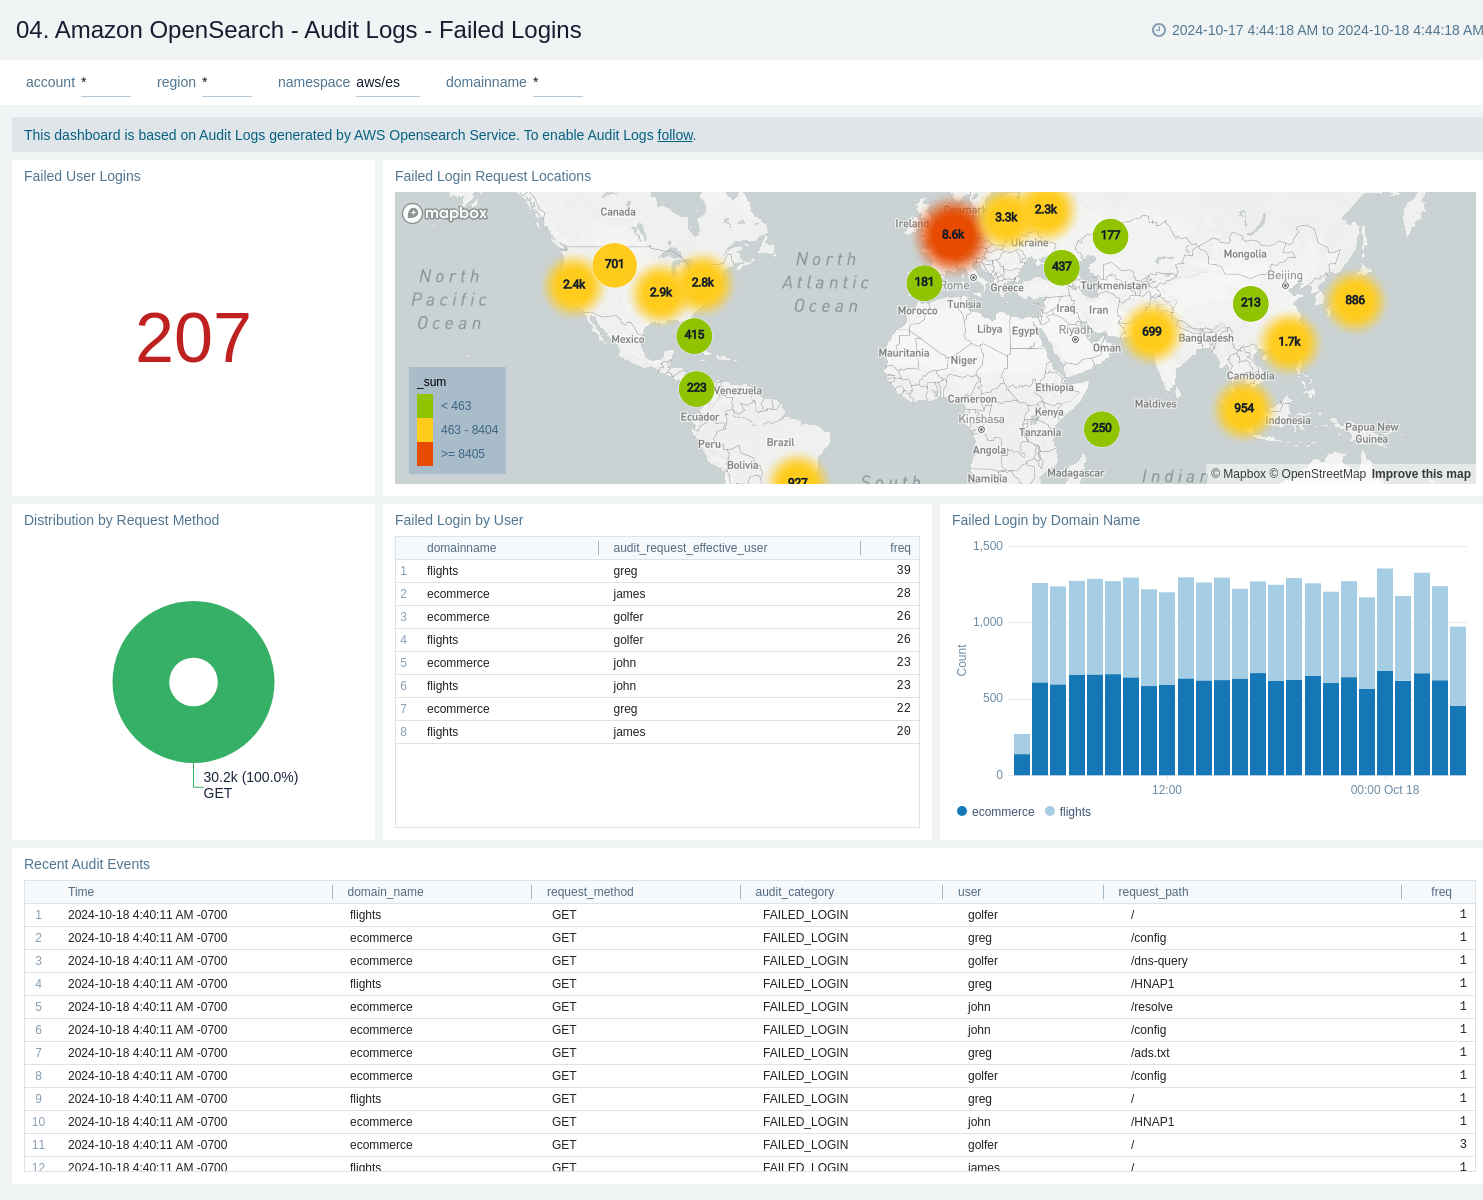
Audit Logs - Failed Logins
The Amazon OpenSearch - Audit Logs - Failed Logins dashboard provides a comprehensive view of login activities, focusing on failed login attempts and authentication errors. It offers insights into the geographical distribution of failed logins, user-specific login failures, cluster-based login issues, and detailed authentication error logs.
Use this dashboard to:
- Monitor the total number of failed user logins at a glance, with a prominent display of the count.
- Visualize the geographical distribution of failed login attempts on the map, helping identify potential security threats or unusual activity patterns from specific regions.
- Analyze the distribution of login request methods.
- Track failed logins by specific users and clusters, allowing for quick identification of problematic accounts or system components.
- Review detailed authentication error logs.
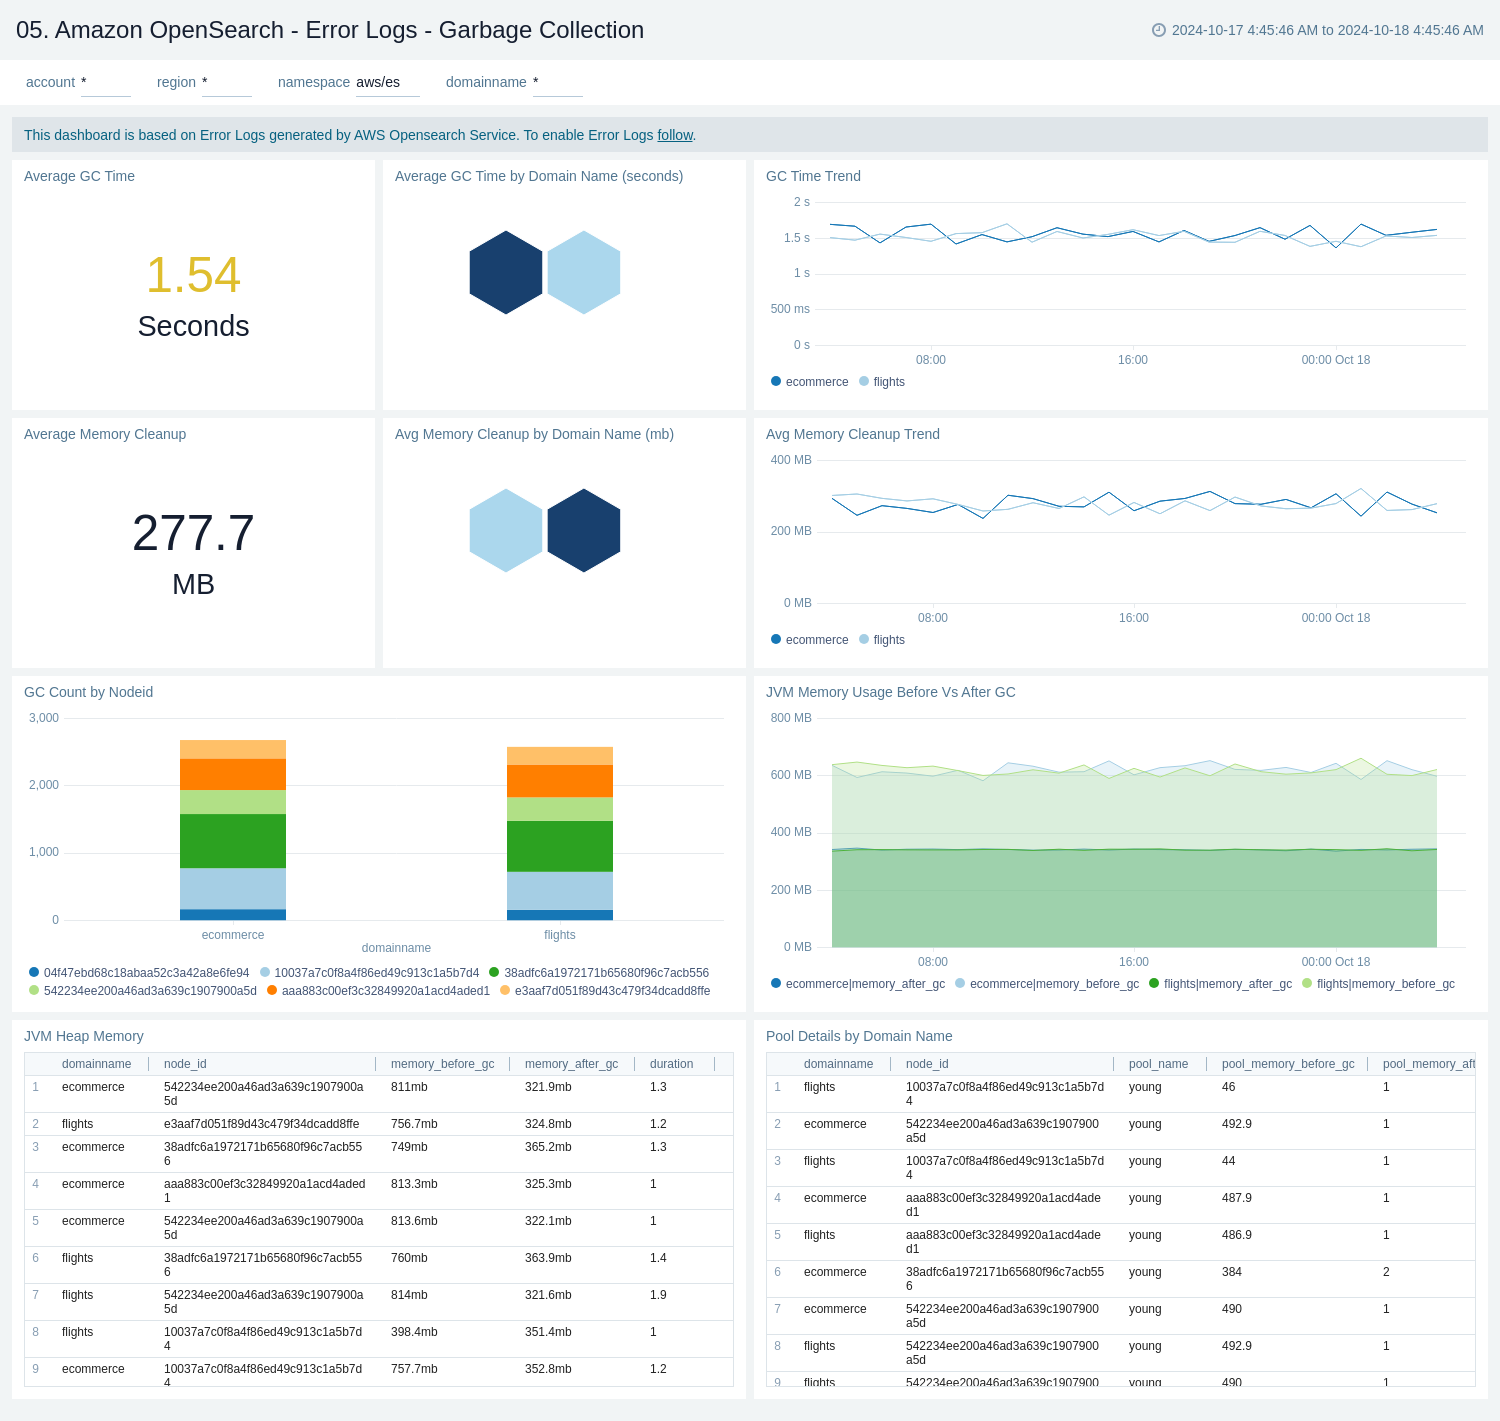
Error Logs - Garbage Collection
The Amazon OpenSearch - Error Logs - Garbage Collection dashboard provides a comprehensive view of Garbage Collection (GC) activities in AWS OpenSearch Service. It offers insights into GC performance, memory cleanup, and JVM memory usage across different domains. The dashboard helps monitor and optimize the garbage collection process, which is crucial for maintaining the performance and stability of OpenSearch clusters.
Use this dashboard to:
- Monitor the average garbage collection time, by overall and domain name, with a trend graph to track changes over time.
- Analyze average cleanup size and trends to understand the efficiency of the garbage collection process across different domains.
- Compare garbage collection counts across different nodes and domains, helping to identify any imbalances or potential issues in specific parts of the cluster.
- Visualize JVM memory usage before and after garbage collection, providing insights into the effectiveness of memory management and potential memory leaks.
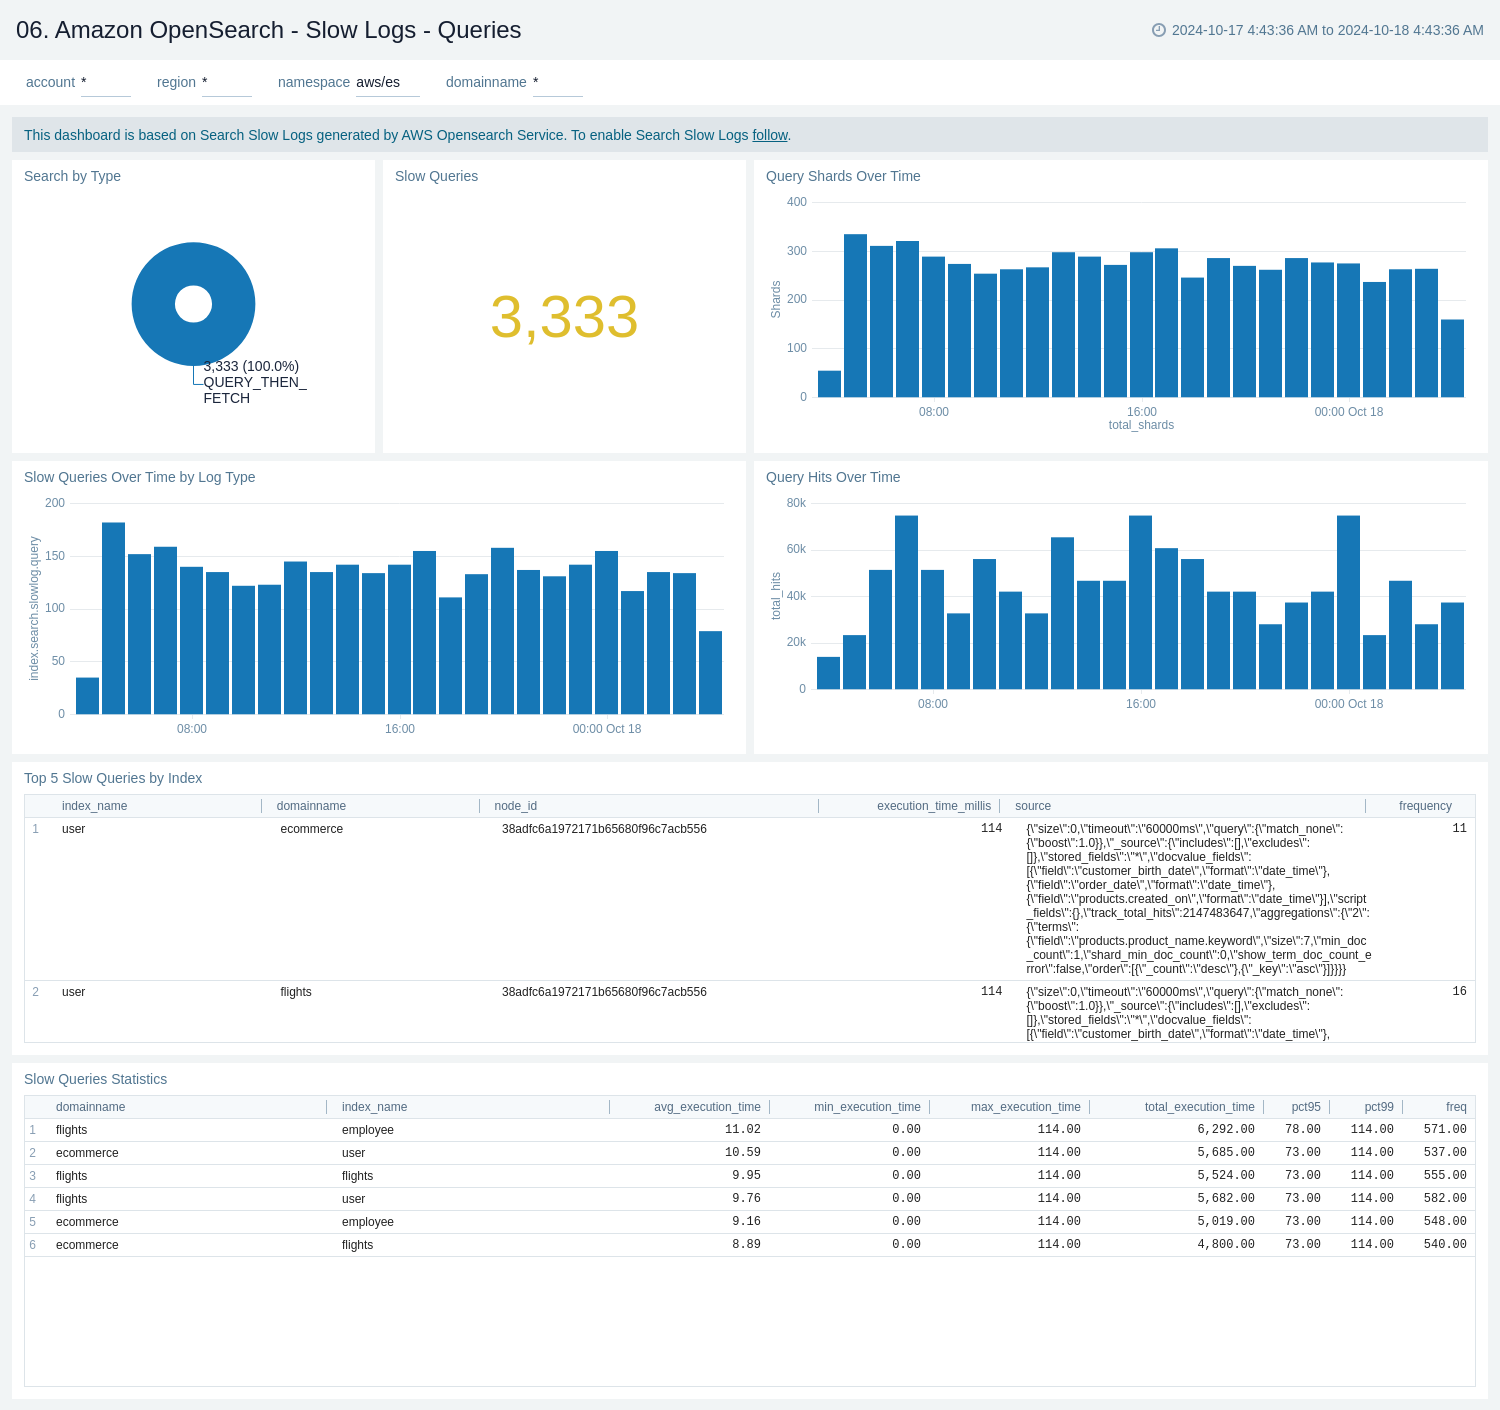
Slow Logs - Queries
The Amazon Opensearch - Slow Logs - Queries dashboard provides a comprehensive view of query performance and behavior within an OpenSearch environment.
Use this dashboard to:
- Monitor and analyze slow query performance in OpenSearch.
- Visualize the distribution of queries over time by log type, helping to identify patterns or spikes in slow query occurrences.
- Track query hits and shard usage over time, providing insights into overall system load and resource utilization.
- Identify the top 10 slowest queries, including details such as index name, node ID, execution time, and query source for targeted optimization.
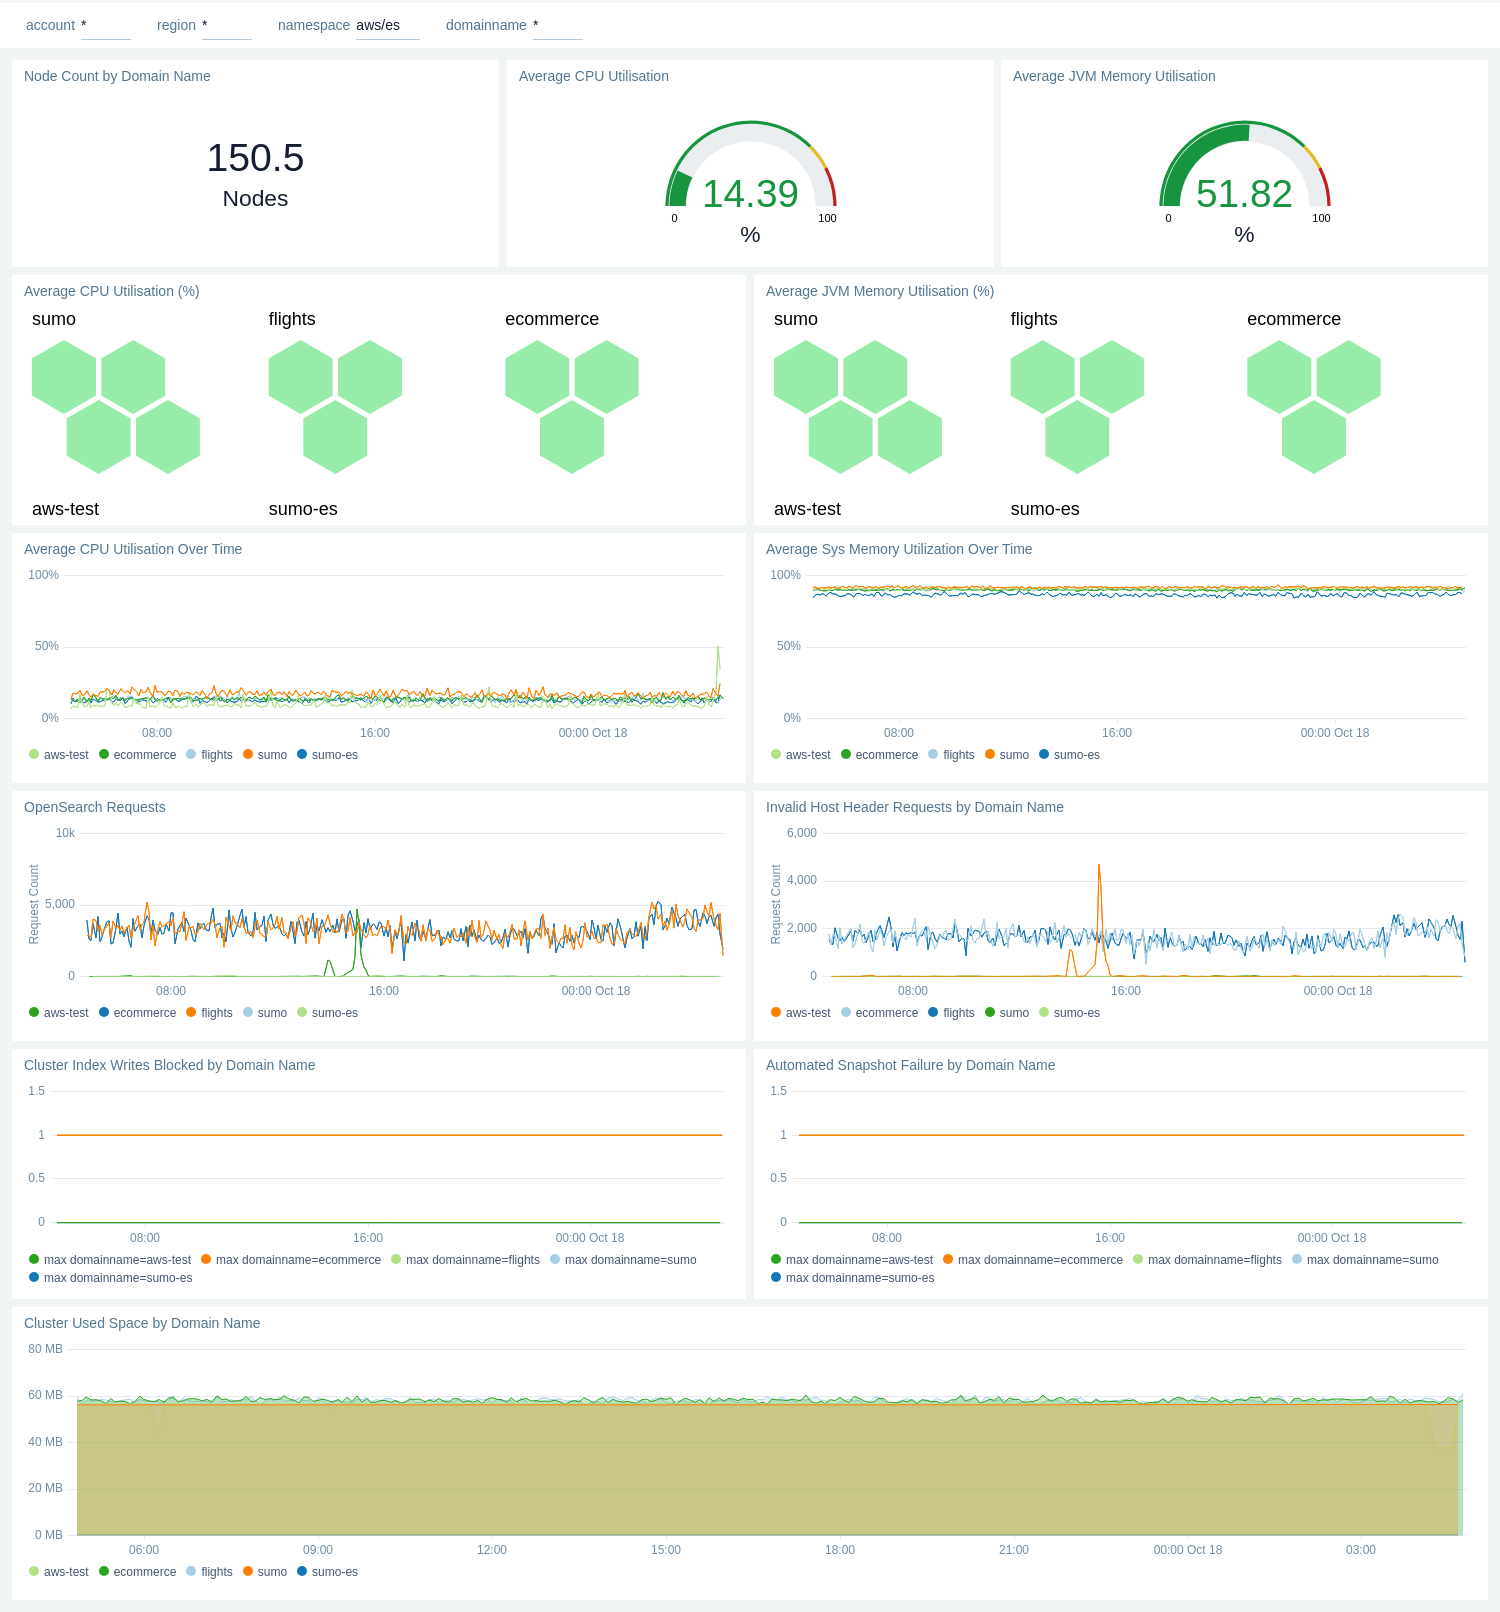
Domain Name (Cluster) Performance
The Amazon OpenSearch - Domain Name (Cluster) Performance dashboard provides a comprehensive view of cluster performance and resource utilization across different domains. It offers insights into node count, CPU and memory usage, request patterns, and storage metrics for OpenSearch clusters.
Use this dashboard to:
- Monitor the total node count and assess resource utilization with average CPU and JVM memory usage gauges, providing a quick overview of cluster health.
- Compare CPU and JVM memory utilization across different domains (sumo, sumo-es, aws-test) using hexagon visualizations, helping to identify potential resource imbalances.
- Track CPU and system memory utilization trends over time for each domain, allowing for the detection of performance anomalies or resource constraints.
- Analyze OpenSearch request patterns and invalid host header requests by domain, which can help in identifying potential security issues or misconfigurations.
- Keep an eye on cluster health indicators such as index write blocks and automated snapshot failures, ensuring data integrity and backup processes are functioning correctly.
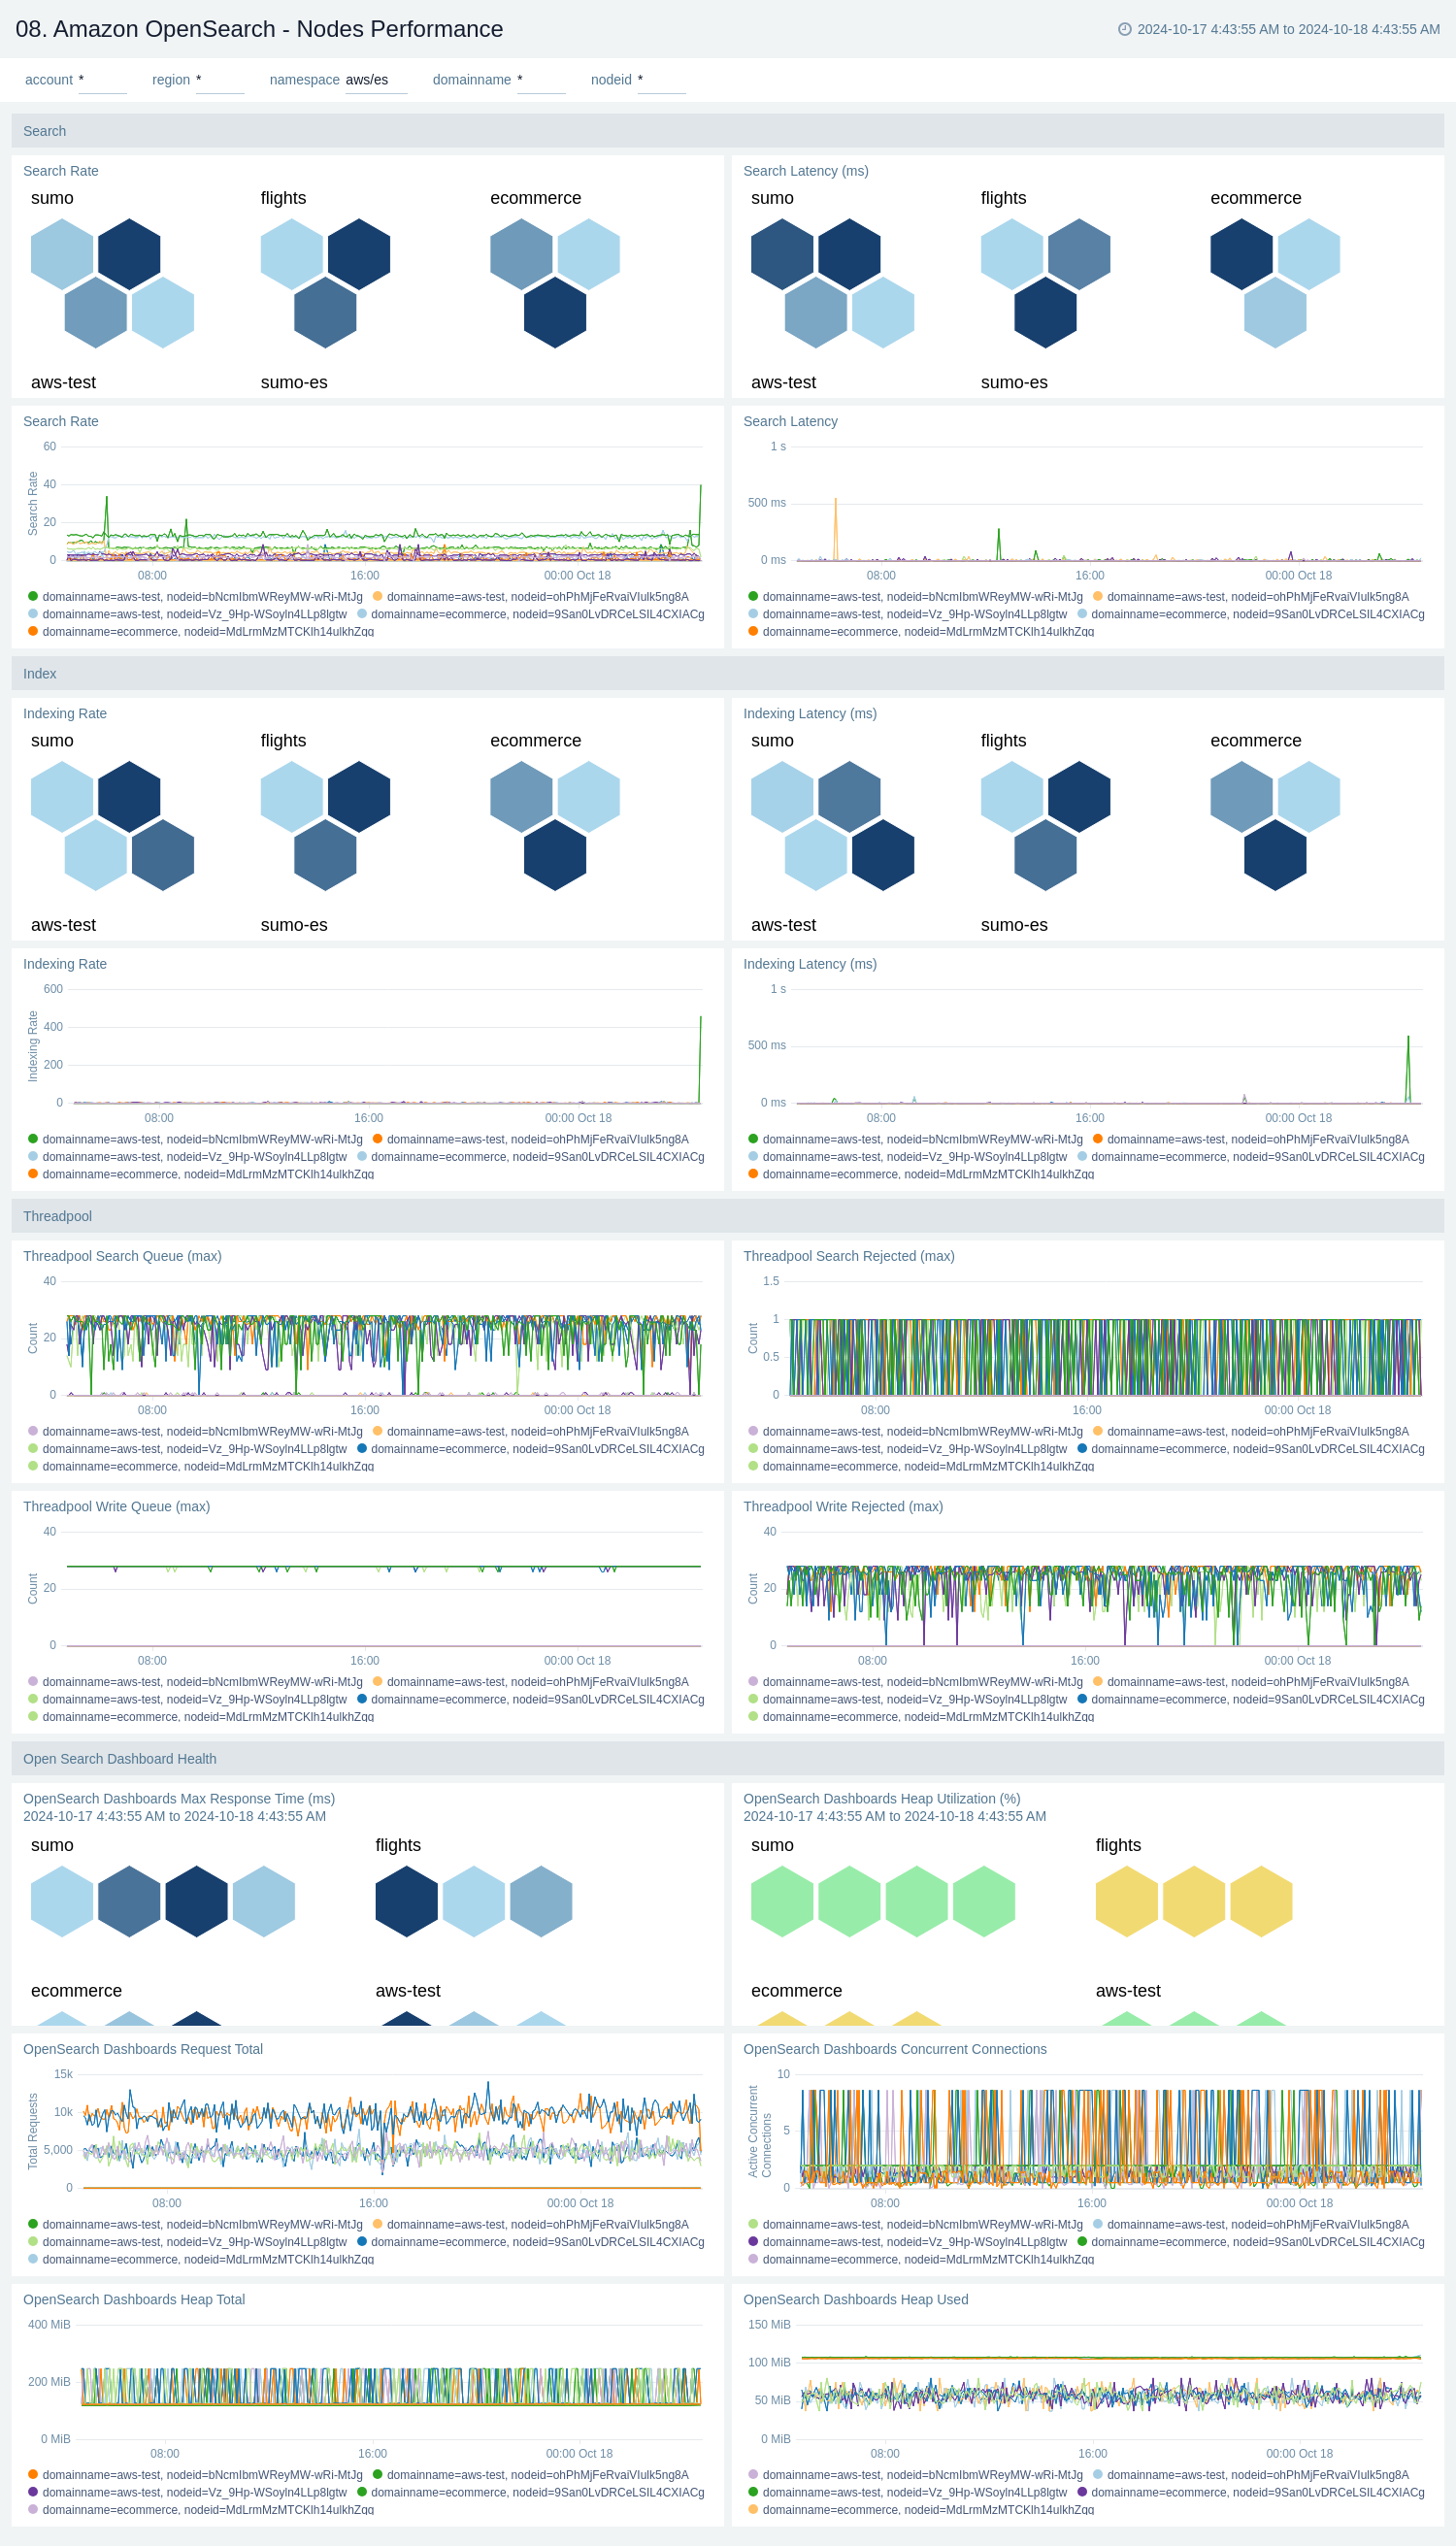
Nodes Performance
The Amazon OpenSearch - Nodes Performance dashboard provides a detailed view of node-level performance metrics for OpenSearch clusters across different domains. It offers insights into search and indexing operations, threadpool activities, and overall cluster health, allowing for granular monitoring and troubleshooting of OpenSearch nodes.
Use this dashboard to:
- Compare search and indexing performance across different nodes and domains, with visualizations for search/indexing rates and latencies, helping identify potential bottlenecks or underperforming nodes.
- Monitor thread pool activities, including search queue times, rejected requests, and write queue metrics, which are crucial for understanding cluster load and capacity issues.
- Track OpenSearch dashboard health metrics, such as maximum response time, heap utilization, request totals, and concurrent connections, to ensure optimal performance of the user interface.
- Analyze trends in search and indexing rates over time, allowing for the detection of patterns or anomalies that may impact cluster performance.
- Assess overall cluster health by comparing metrics across different domains, enabling quick identification of domain-specific issues or imbalances.
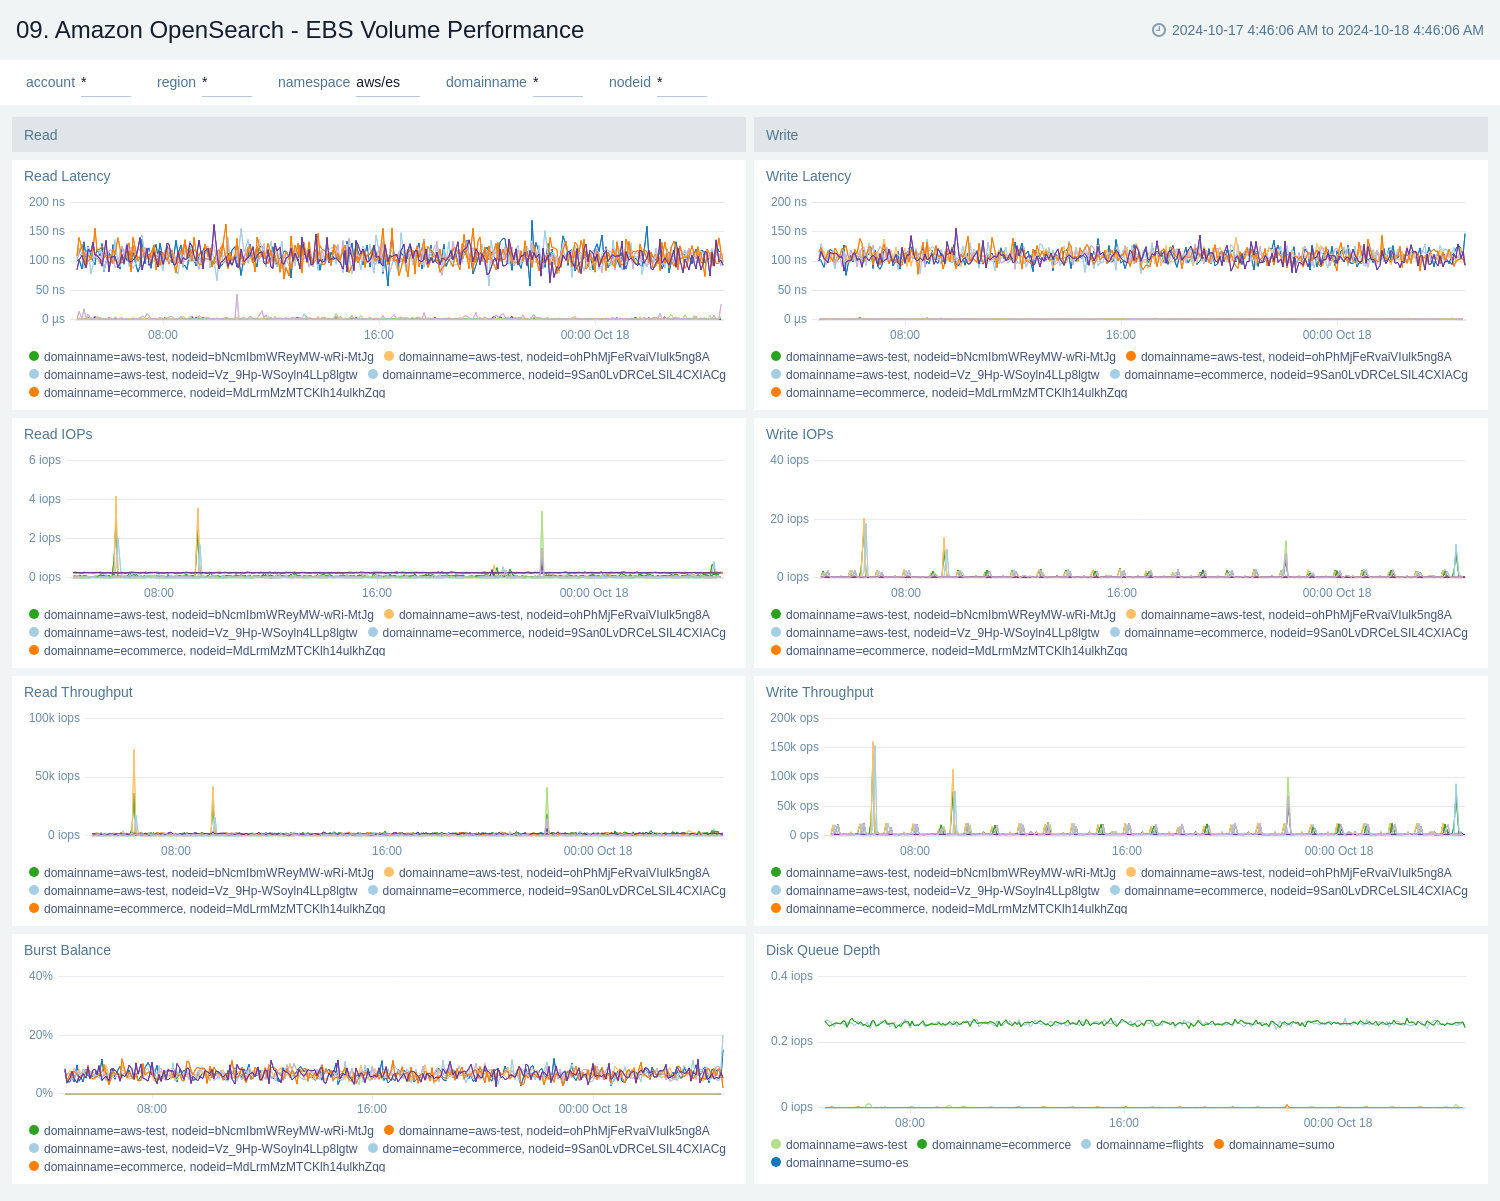
EBS Volume Performance
The Amazon OpenSearch - EBS Volume Performance dashboard provides a comprehensive view of the performance metrics for Amazon Elastic Block Store (EBS) volumes associated with OpenSearch clusters. It displays various key performance indicators such as read and write latency, I/O operations per second (IOPS), throughput, burst balance, and disk queue depth.
Use this dashboard to:
- Monitor read and write latency of EBS volumes to ensure optimal response times for OpenSearch operations.
- Track read and write IOPS to understand the I/O demand on your EBS volumes and identify any performance constraints.
- Analyze read and write throughput to assess the data transfer rates and capacity utilization of your EBS volumes.
- Keep an eye on the burst balance to ensure your EBS volumes have sufficient performance credits for handling sudden spikes in workload.
- Observe the disk queue depth to identify potential I/O congestion and optimize your storage configuration for better performance.
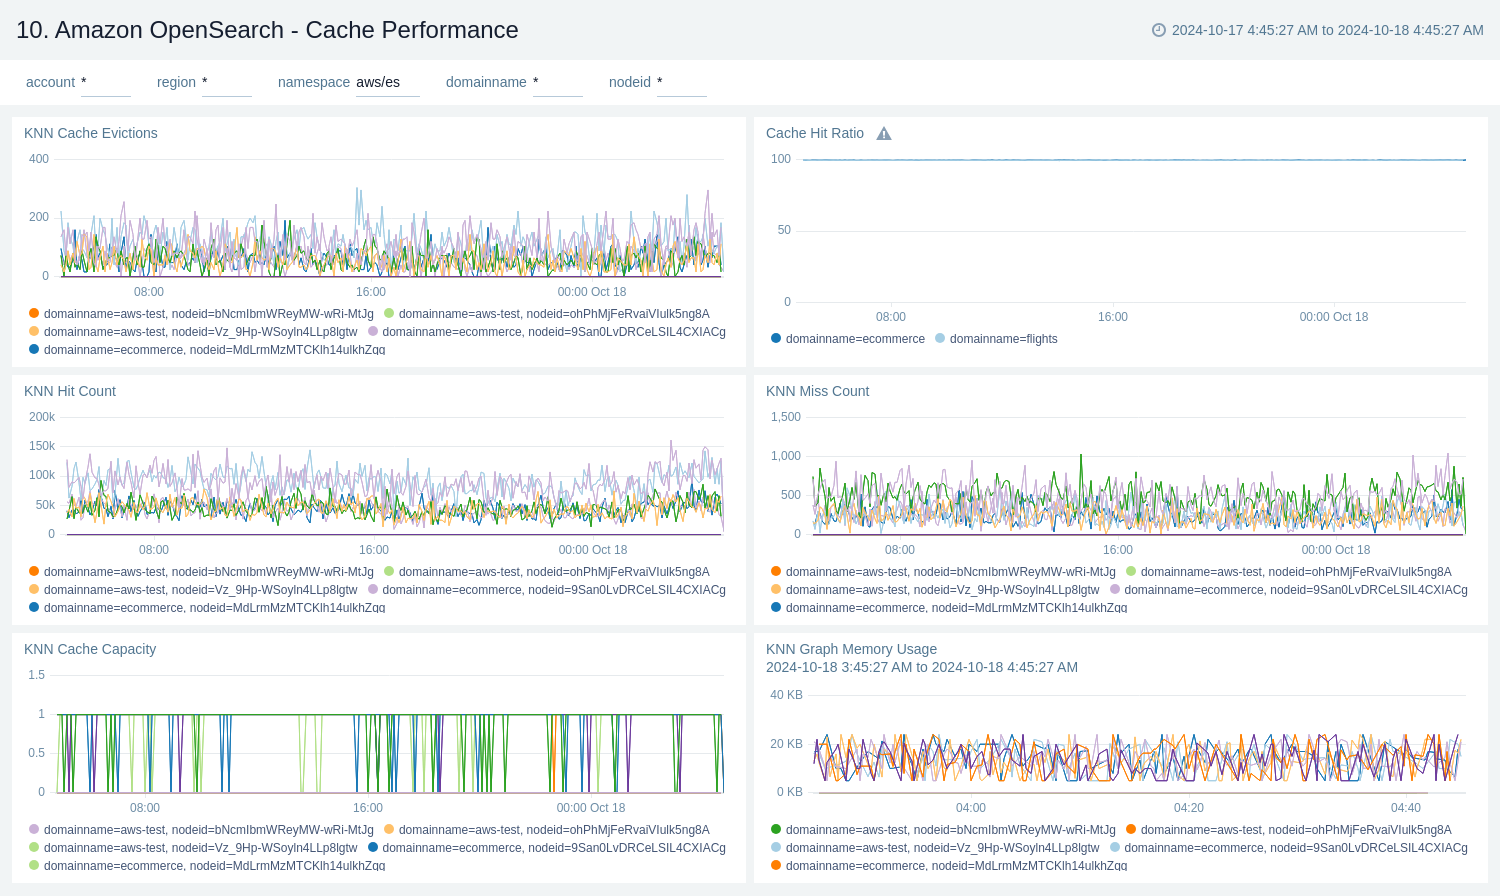
Cache Performance
The Amazon OpenSearch - Cache Performance dashboard provides insights into cache performance, evictions, capacity, and memory usage, which are crucial for maintaining the optimal performance of OpenSearch clusters.
Use this dashboard to:
- Performance tuning of OpenSearch clusters.
- Capacity planning for cache and memory resources.
- Troubleshooting cache-related issues.
- Ability to correlate cache metrics with overall system performance.
Create monitors for Amazon OpenSearch app
From your App Catalog:
- From the Sumo Logic navigation, select App Catalog.
- In the Search Apps field, search for and then select your app.
- Make sure the app is installed.
- Navigate to What's Included tab and scroll down to the Monitors section.
- Click Create next to the pre-configured monitors. In the create monitors window, adjust the trigger conditions and notifications settings based on your requirements.
- Scroll down to Monitor Details.
- Under Location click on New Folder.
note
By default, monitor will be saved in the root folder. So to make the maintenance easier, create a new folder in the location of your choice.
- Enter Folder Name. Folder Description is optional.
tip
Using app version in the folder name will be helpful to determine the versioning for future updates.
- Click Create. Once the folder is created, click on Save.
Amazon OpenSearch alerts
| Name | Description | Alert Condition | Recover Condition |
|---|---|---|---|
Amazon OpenSearch - Cluster Write Operations Blocked | This alert is triggered when the cluster is actively blocking write requests. This is a severe state that means applications cannot write new data to the cluster. | Count > = 1 | Count < 1 |
Amazon OpenSearch - High Indexing Latency | This alert is triggered when the average indexing latency exceeds 1000ms, indicating a potential bottleneck in data ingestion pipelines. | Count > 1000 | Count < = 1000 |
Amazon OpenSearch - High JVM Memory Pressure | This alert is triggered when JVM Memory Pressure is consistently high, which can lead to long garbage collection pauses, slow performance, and potential out-of-memory errors. | Count > = 95 | Count < 95 |
Amazon OpenSearch - Sustained High CPU Utilization | This alert is triggered when CPU utilization is consistently high (>= 80%) for 15 minutes, indicating an overloaded cluster that may lead to performance degradation. | Count > = 80 | Count < 80 |
Amazon OpenSearch - Unassigned Primary Shards Detected | This alert is triggered when the cluster status is critical, indicating that at least one primary shard and its replicas are not allocated. This signifies a non-functional cluster and potential data loss. | Count > = 1 | Count < 1 |
Amazon OpenSearch - Unassigned Replica Shards Detected | This alert is triggered when all primary shards are active but one or more replica shards are not allocated to a node. This compromises high availability. | Count > = 1 | Count < 1 |
Upgrade/Downgrade the Amazon OpenSearch app (Optional)
To update the app, do the following:
Next-Gen App: To install or update the app, you must be an account administrator or a user with Manage Apps, Manage Monitors, Manage Fields, Manage Metric Rules, and Manage Collectors capabilities depending upon the different content types part of the app.
- Select App Catalog.
- In the Search Apps field, search for and then select your app.
Optionally, you can identify apps that can be upgraded in the Upgrade available section. - To upgrade the app, select Upgrade from the Manage dropdown.
- If the upgrade does not have any configuration or property changes, you will be redirected to the Preview & Done section.
- If the upgrade has any configuration or property changes, you will be redirected to the Setup Data page.
- In the Configure section of your respective app, complete the following fields.
- Field Name. If you already have collectors and sources set up, select the configured metadata field name (eg _sourcecategory) or specify other custom metadata (eg: _collector) along with its metadata Field Value.
- Click Next. You will be redirected to the Preview & Done section.
Post-update
Your upgraded app will be installed in the Installed Apps folder and dashboard panels will start to fill automatically.
See our Release Notes changelog for new updates in the app.
To revert the app to a previous version, do the following:
- Select App Catalog.
- In the Search Apps field, search for and then select your app.
- To version down the app, select Revert to < previous version of your app > from the Manage dropdown.
Uninstalling the Amazon OpenSearch app (Optional)
To uninstall the app, do the following:
- Select App Catalog.
- In the 🔎 Search Apps field, run a search for your desired app, then select it.
- Click Uninstall.