Amazon DynamoDB
Amazon DynamoDB is a fast and flexible NoSQL database service that provides consistent, single-digit millisecond latency at any scale. For more details see here.
The Sumo app for Amazon DynamoDB uses both logs and metrics to is a unified logs and metrics app that provides operational insights into your DynamoDB. The app includes Dashboards that allow you to monitor key metrics, view the throttle events, errors, and latency, and also help you plan the capacity of your DynamoDB instances.
Collect Logs and Metrics for the Amazon DynamoDB app
Log and metric types
The AWS DynamoDB app uses the following logs and metrics:
Sample CloudTrail log message
{
  "eventVersion":"1.05",
  "userIdentity":{
     "type":"IAMUser",
     "principalId":"AIDAIBF5TU7HNYUE7V676",
     "arn":"arn:aws:iam::568388783903:user/ankit",
     "accountId":"568388783903",
     "accessKeyId":"ASIAI3Q5RU4FIZFHFJZA",
     "userName":"ankit",
     "sessionContext":{
        "attributes":{
           "mfaAuthenticated":"false",
           "creationDate":"2017-10-10T23:01:45+0000"
        }
     },
     "invokedBy":"signin.amazonaws.com"
  },
  "eventTime":"2017-10-10T23:01:45+0000",
  "eventSource":"dynamodb.amazonaws.com",
  "eventName":"DescribeTable",
  "awsRegion":"us-east-1",
  "sourceIPAddress":"38.99.50.98",
  "userAgent":"signin.amazonaws.com",
  "requestParameters":{
     "tableName":"users3"
  },
  "responseElements":null,
  "requestID":"AIFQQ1I27ASKDSAQ4L9L4DTQPVVV4KQNSO5AEMVJF66Q9ASUAAJG",
  "eventID":"f2bec08c-a56a-4f04-be92-0cac7aaabe9b",
  "eventType":"AwsApiCall",
  "apiVersion":"2012-08-10",
  "recipientAccountId":"568388783903"
}
Sample queries
namespace=aws/dynamodb metric=SuccessfulRequestLatency Statistic=Average account=* region=* tablename=* | sum by account, region, namespace, tablename
account=dev namespace=aws/dynamodb region=us-east-1 "\"eventSource\":\"dynamodb.amazonaws.com\"" errorCode errorMessage
| json "eventName", "awsRegion", "requestParameters.tableName", "sourceIPAddress", "userIdentity.userName", "userIdentity.sessionContext.sessionIssuer.userName", "errorCode", "errorMessage" as EventName, Region, tablename, SourceIp, UserName, ContextUserName, ErrorCode, ErrorMessage nodrop
| if (isEmpty(UserName), ContextUserName, UserName) as UserName
| where (tolowercase(tablename) matches tolowercase("kinesistosumologicconnector")) or isBlank(tablename)
| where !isBlank(errorCode)
| count as Count by ErrorCode, ErrorMessage, EventName, UserName, SourceIp
| sort by Count, ErrorCode, ErrorMessage
| limit 20
Collect Metrics for Amazon DynamoDB
Sumo Logic supports collecting metrics using two source types:
- Configure an AWS Kinesis Firehose for Metrics Source (Recommended); or
- Configure an Amazon CloudWatch Source for Metrics
Namespace for Amazon DynamoDB Service is AWS/DynamoDB.
- Metadata. Add an account field to the source and assign it a value that is a friendly name/alias to your AWS account from which you are collecting metrics. Metrics can be queried via the “account field”.
Collect Amazon DynamoDB CloudTrail Logs
- To your Hosted Collector, add an AWS CloudTrail Source.
- Name. Enter a name to display the new Source.
- Description. Enter an optional description.
- S3 Region. Select the Amazon Region for your Amazon DynamoDB S3 bucket.
- Bucket Name. Enter the exact name of your Amazon DynamoDB S3 bucket.
- Path Expression. Enter the string that matches the S3 objects you'd like to collect. You can use a wildcard (
*) in this string. (DO NOT use a leading forward slash. See Amazon Path Expressions.) The S3 bucket name is not part of the path. Don’t include the bucket name when you are setting the Path Expression - Source Category. Enter
aws/observability/cloudtrail/logs - Fields. Add an account field and assign it a value that is a friendly name/alias to your AWS account from which you are collecting logs. Logs can be queried via the “account field”.
- Access Key ID and Secret Access Key. Enter your Amazon Access Key ID and Secret Access Key. Learn how to use Role-based access to AWS here
- Log File Discovery -> Scan Interval. Use the default of 5 minutes. Alternately, enter the frequency. Sumo Logic will scan your S3 bucket for new data. Learn how to configure Log File Discovery here.
- Enable Timestamp Parsing. Select the Extract timestamp information from log file entries check box.
- Time Zone. Select Ignore time zone from the log file and instead use, and select UTC from the dropdown.
- Timestamp Format. Select Automatically detect the format.
- Enable Multiline Processing. Select the Detect messages spanning multiple lines check box, and select Infer Boundaries.
- Click Save.
Field in Field Schema
- Classic UI. In the main Sumo Logic menu, select Manage Data > Logs > Fields.
New UI. In the top menu select Configuration, and then under Logs select Fields. You can also click the Go To... menu at the top of the screen and select Fields. - Search for the “tablename” field.
- If not present, create it. Learn how to create and manage fields here.
Field Extraction Rule(s)
Create Field Extraction Rule for CloudTrail Logs. Learn how to create Field Extraction Rule here.
Rule Name: AwsObservabilityDynamoDBCloudTrailLogsFER
Applied at: Ingest Time
Scope (Specific Data):
account=* eventname eventsource "dynamodb.amazonaws.com"
Parse Expression:
| json "eventSource", "awsRegion", "requestParameters.tableName", "recipientAccountId" as eventSource, region, tablename, accountid nodrop
| where eventSource = "dynamodb.amazonaws.com"
| "aws/dynamodb" as namespace
| tolowercase(tablename) as tablename
| fields region, namespace, tablename, accountid
Centralized AWS CloudTrail Log Collection
In case you have a centralized collection of CloudTraillogs and are ingesting them from all accounts into a single Sumo Logic CloudTraillog source, create following Field Extraction Rule to map proper AWS account(s) friendly name/alias. Create it if not already present / update it as required.
Rule Name: AWS Accounts
Applied at: Ingest Time
Scope (Specific Data):
_sourceCategory=aws/observability/cloudtrail/logs
Parse Expression
Enter a parse expression to create an “account” field that maps to the alias you set for each sub-account. For example, if you used the “dev” alias for an AWS account with ID "528560886094" and the “prod” alias for an AWS account with ID "567680881046", your parse expression would look like this:
| json "recipientAccountId"
// Manually map your aws account id with the AWS account alias you setup earlier for individual child account
| "" as account
| if (recipientAccountId = "528560886094",  "dev", account) as account
| if (recipientAccountId = "567680881046",  "prod", account) as account
| fields account
Installing the Amazon DynamoDB app
Now that you have set up a collection for Amazon DynamoDB, install the Sumo Logic app to use the pre-configured dashboards that provide visibility into your environment for real-time analysis of overall usage.
To install the app:
- Select App Catalog.
- In the 🔎 Search Apps field, run a search for your desired app, then select it.
- Click Install App.
note
Sometimes this button says Add Integration.
- On the next configuration page, under Select Data Source for your App, complete the following fields:
- Data Source. Select one of the following options:
- Choose Source Category and select a source category from the list; or
- Choose Enter a Custom Data Filter, and enter a custom source category beginning with an underscore. For example,
_sourceCategory=MyCategory.
- Folder Name. You can retain the existing name or enter a custom name of your choice for the app.
- All Folders (optional). The default location is the Personal folder in your Library. If desired, you can choose a different location and/or click New Folder to add it to a new folder.
- Data Source. Select one of the following options:
- Click Next.
- Look for the dialog confirming that your app was installed successfully.
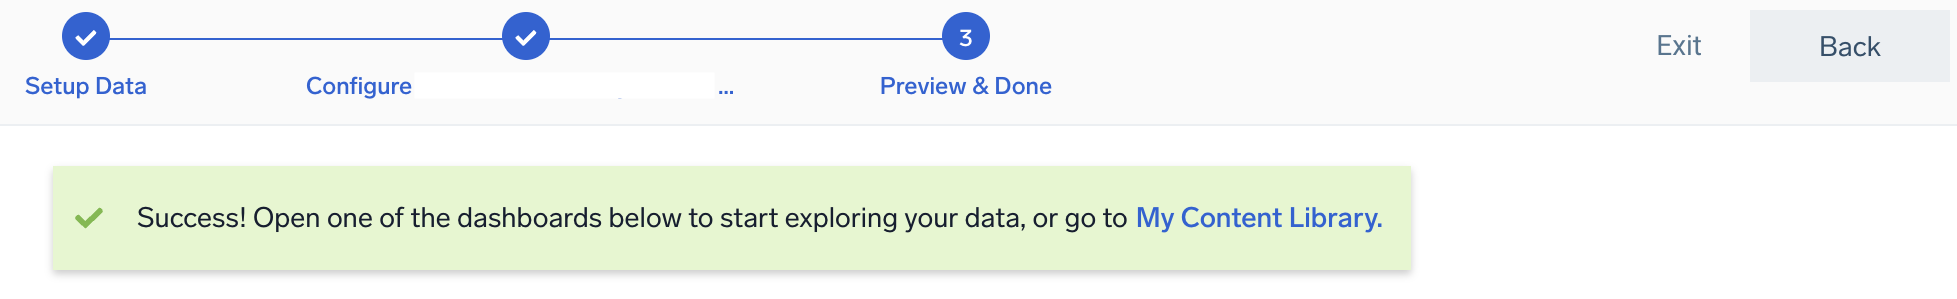
Post-installation
Once your app is installed, it will appear in your Personal folder or the folder that you specified. From here, you can share it with other users in your organization. Dashboard panels will automatically start to fill with data matching the time range query received since you created the panel. Results won't be available immediately, but within about 20 minutes, you'll see completed graphs and maps.
Viewing Amazon DynamoDB dashboards
The Sumo Logic AWS Observability DynamoDB Dashboards for AWS DynamoDB provides operational insights into DynamoDB instances. Preconfigured dashboards allow you to monitor key metrics and view the throttle events, errors, and latency. They also help you plan DynamoDB instances' capacity in your environment.
We highly recommend you view these dashboards in the AWS Observability view of the AWS Observability solution.
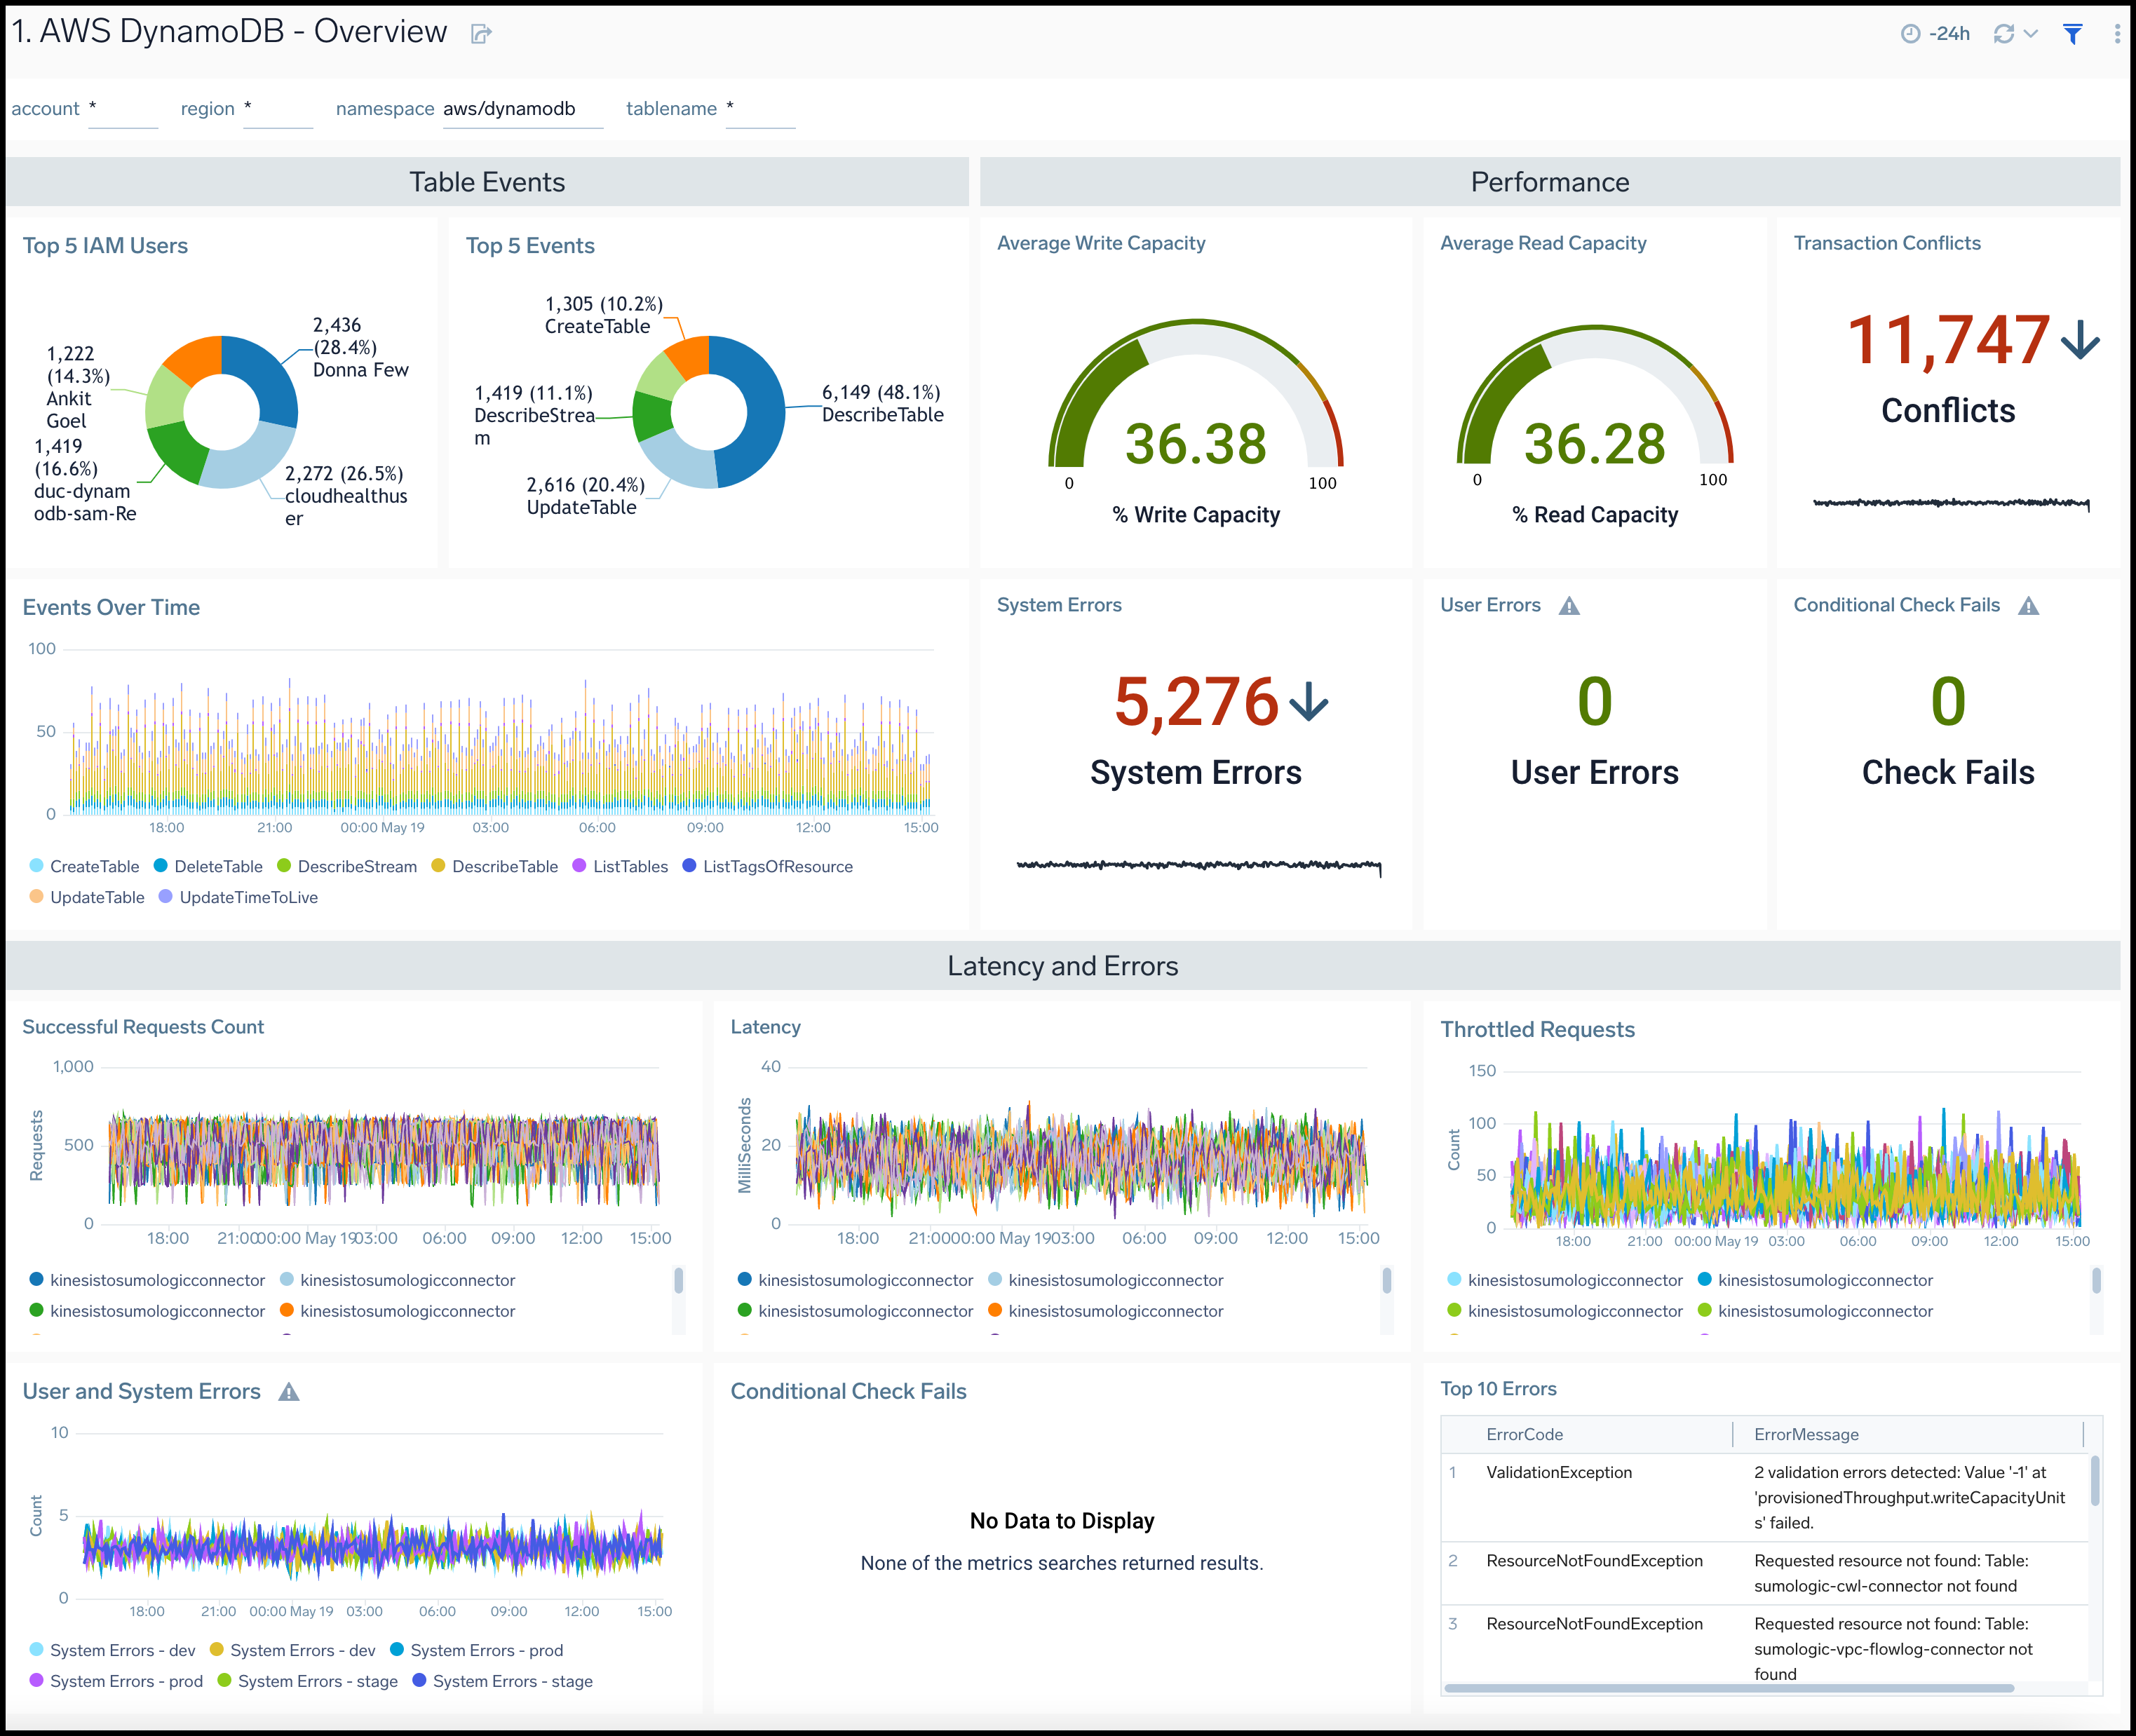
Overview
The AWS DynamoDB - Overview dashboard provides insights across your infrastructure for DynamoDB events, errors, requests, latency, and trends.
Use this dashboard to:
- Monitor average read and write capacity percentages for DynamoDB instances
- Quickly identify system errors, user errors, transaction conflicts, and conditional check fail requests for DynamoDB Monitor overall resource utilization of your DynamoDB instances
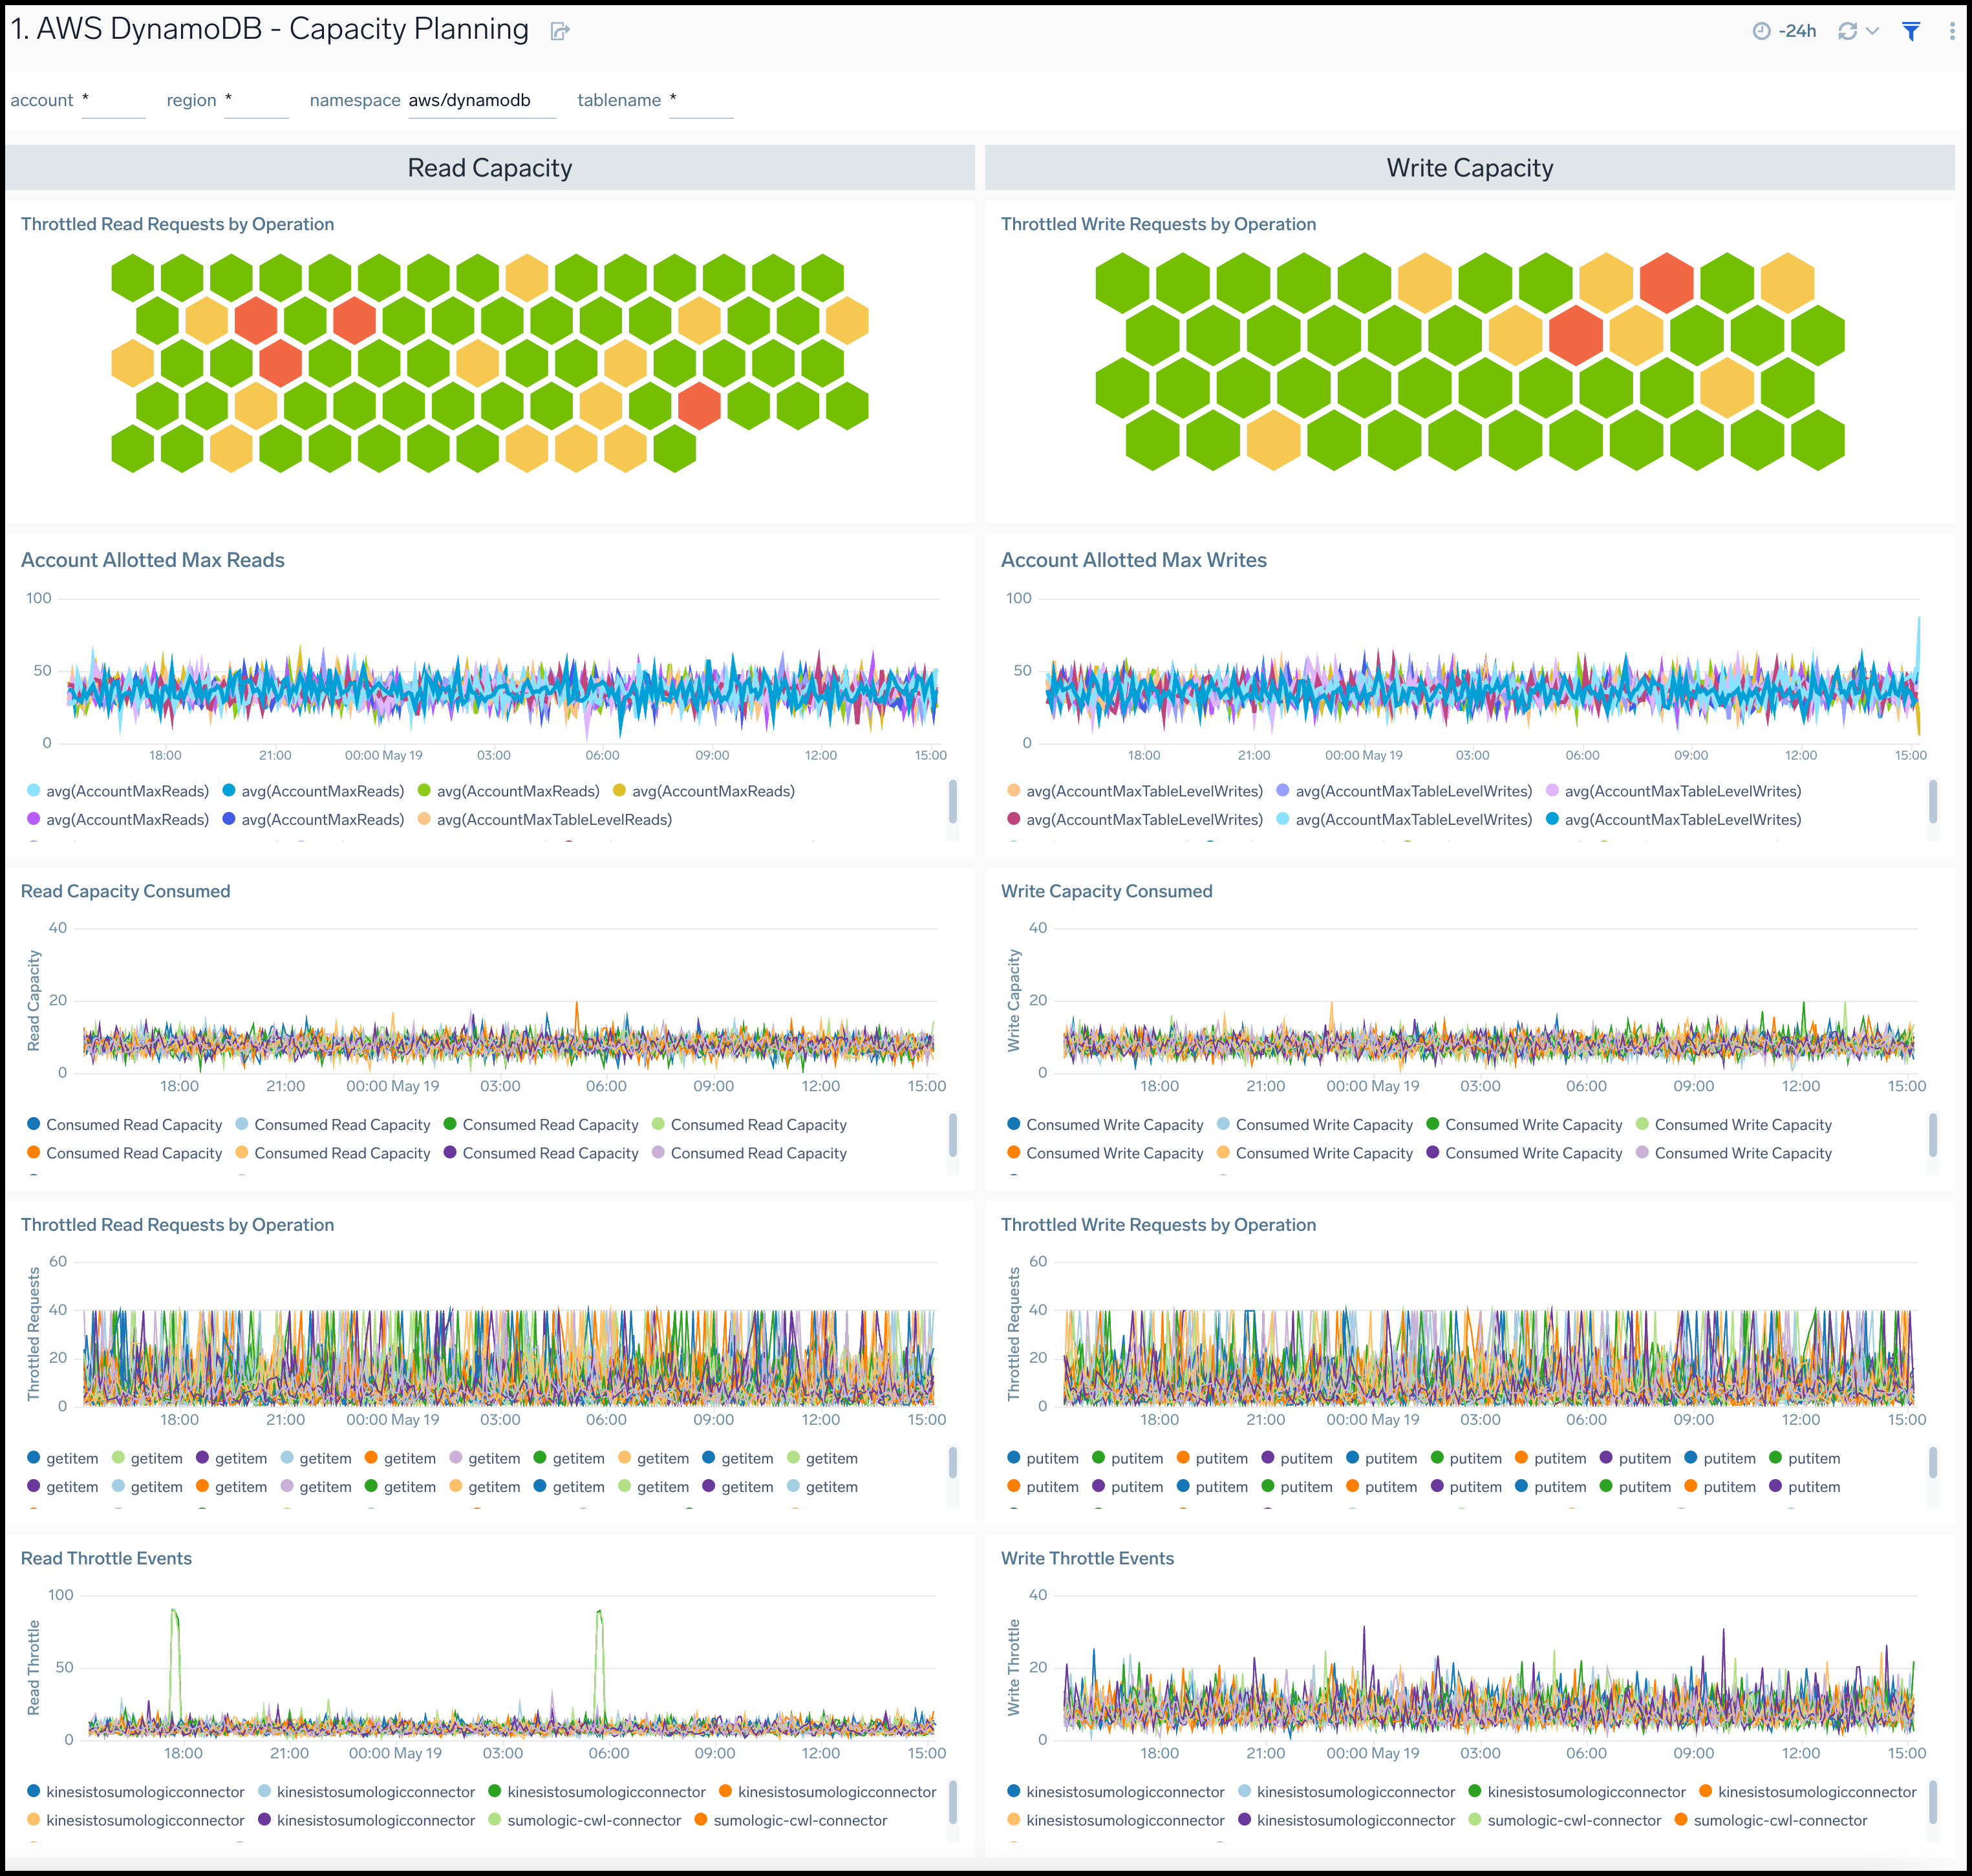
Capacity Planning
The AWS DynamoDB - Capacity Planning dashboard provides insights for DynamoDB read and writes capacity across account allotments, consumed percentages, throttle events, and requests.
Use this dashboard to:
- Monitor DynamoDB tables for throttled read and write requests, along with the type of operation.
- Monitor AWS account level maximum allocations across reading and writing capacities.
- Monitor resource utilization using trend panels for reading and write capacity, throttled read and write requests, as well as read and write throttle events for DynamoDB throughout your infrastructure.
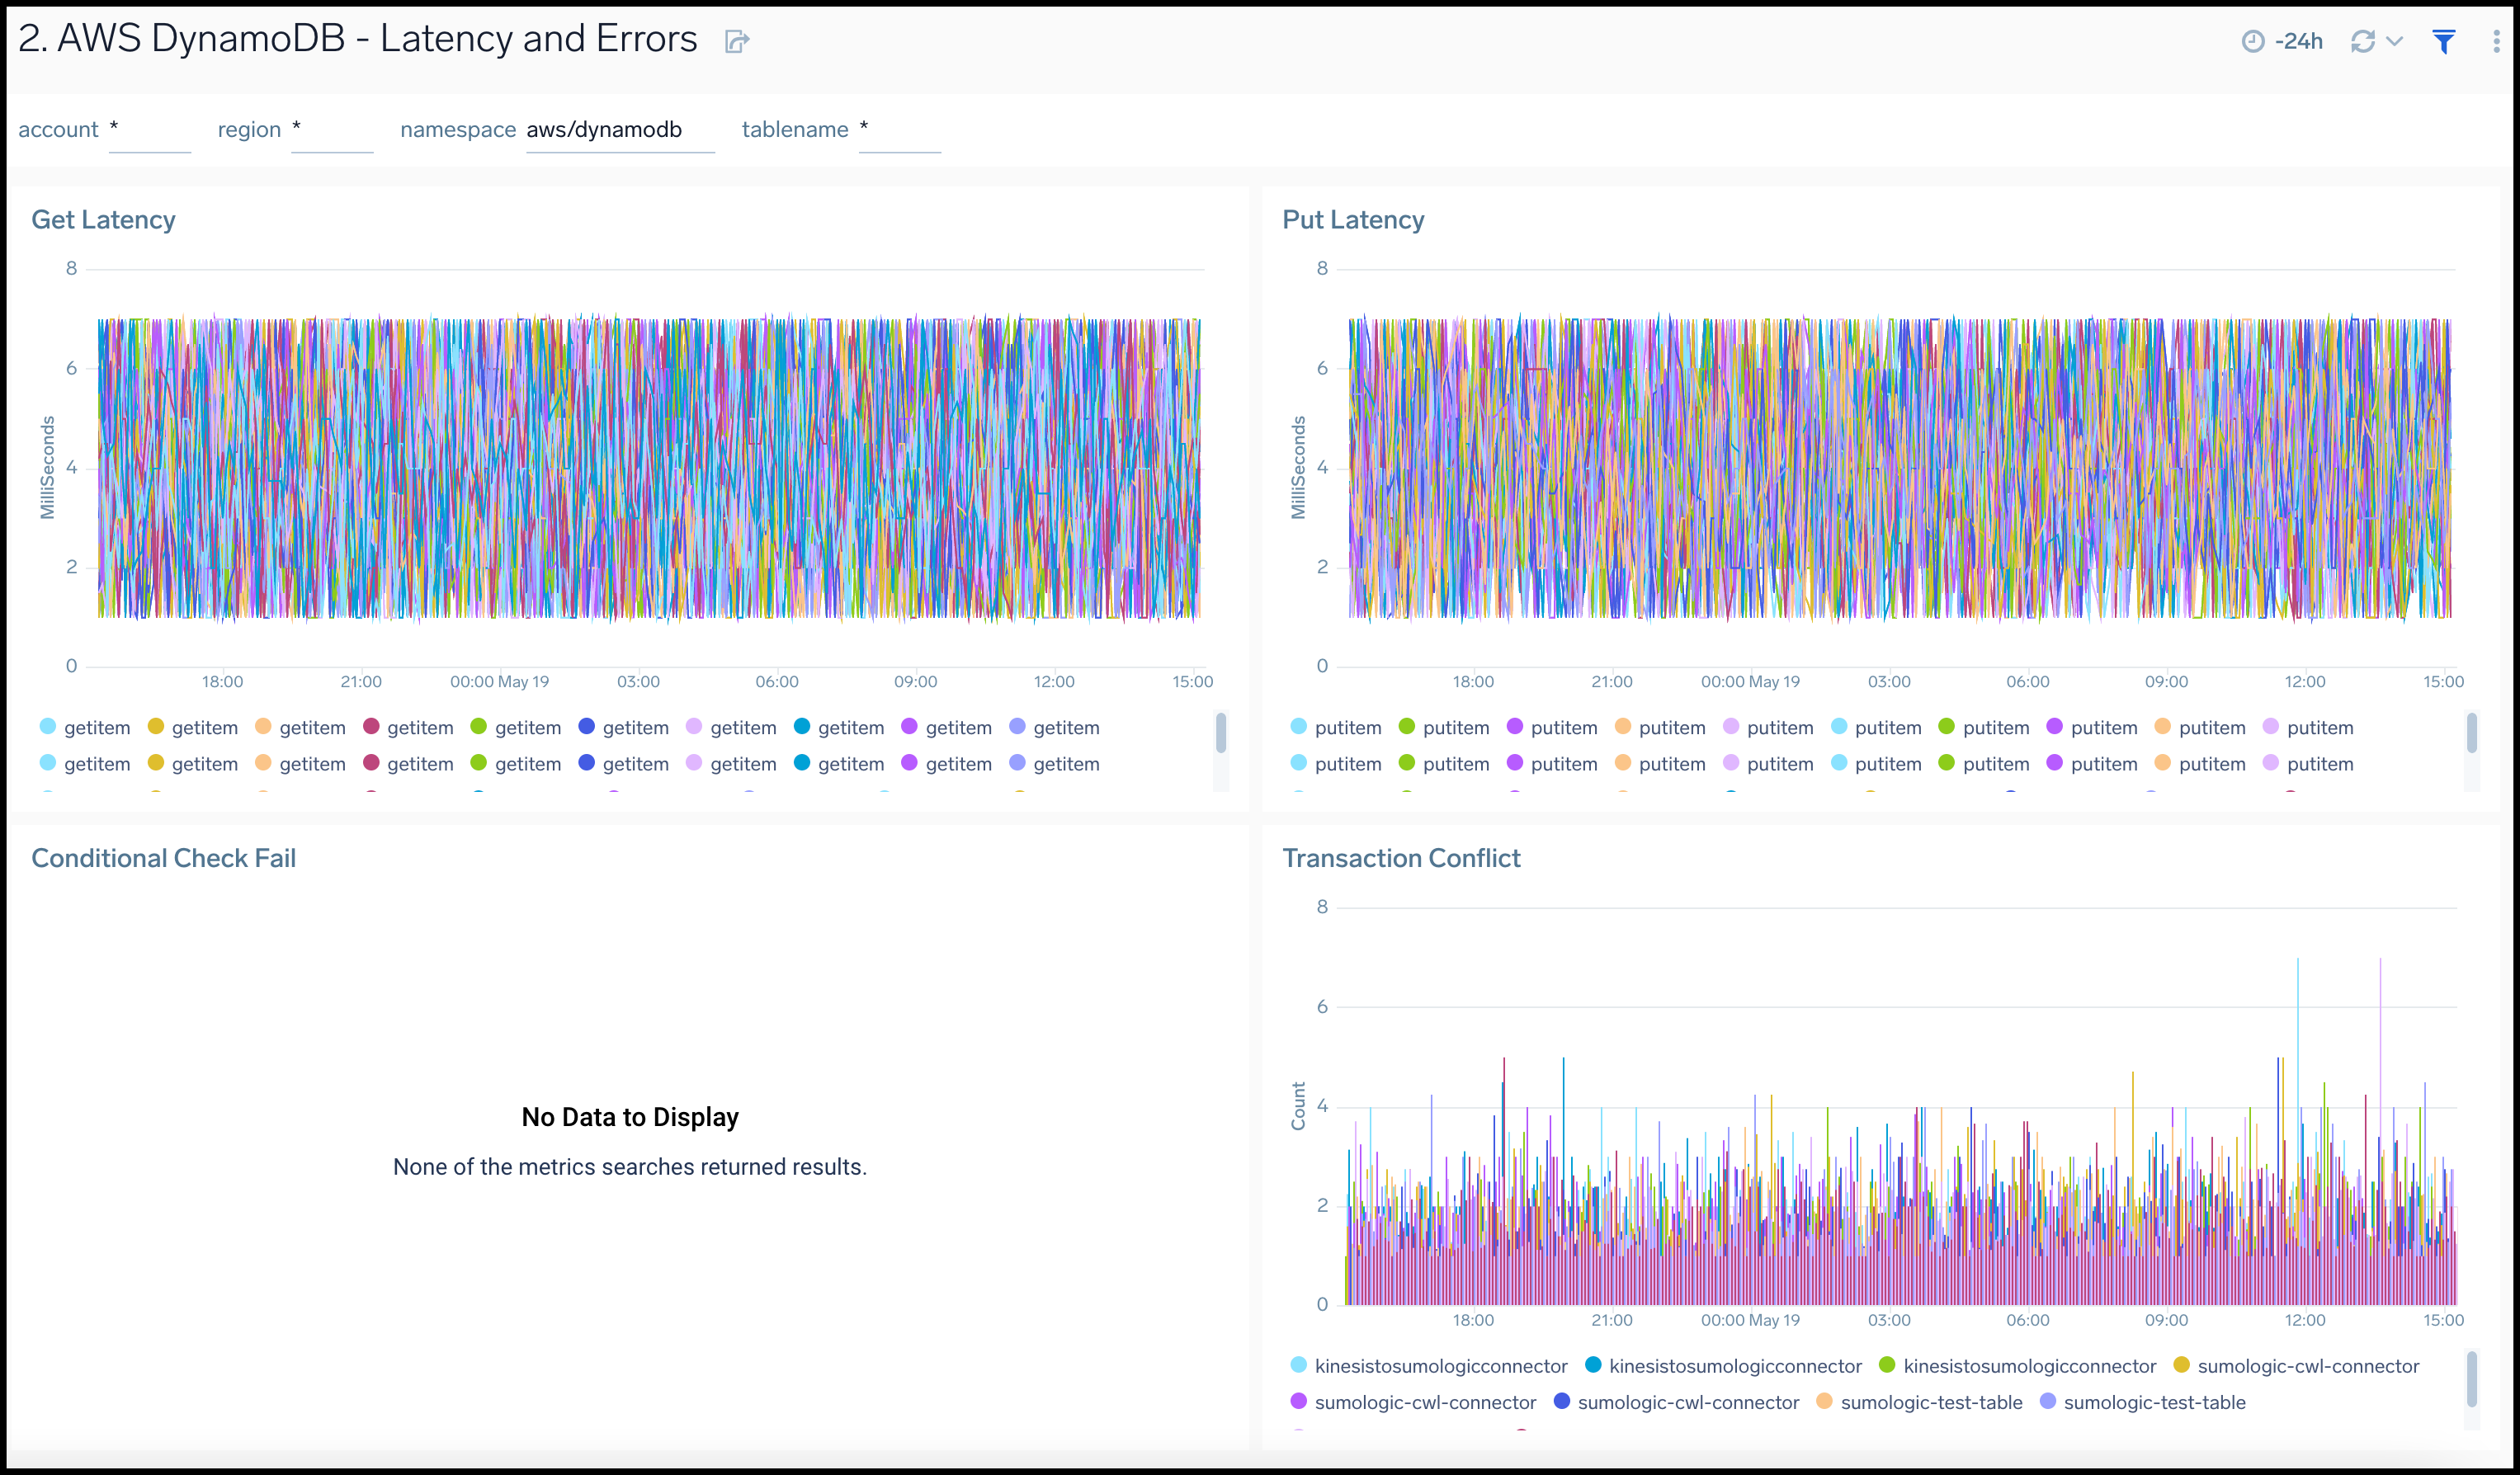
Latency and Errors
AWS DynamoDB - Latency and Errors dashboard provides insights across your infrastructure for DynamoDB errors and latency including failed requests, and latency.
Use this dashboard to:
- Identify high get and put latencies for DynamoDB tables
- Quickly identify the number of conditional checks that fail, and transaction conflicts for DynamoDB
- Monitor resource utilization using trend panels for latencies and errors for DynamoDB
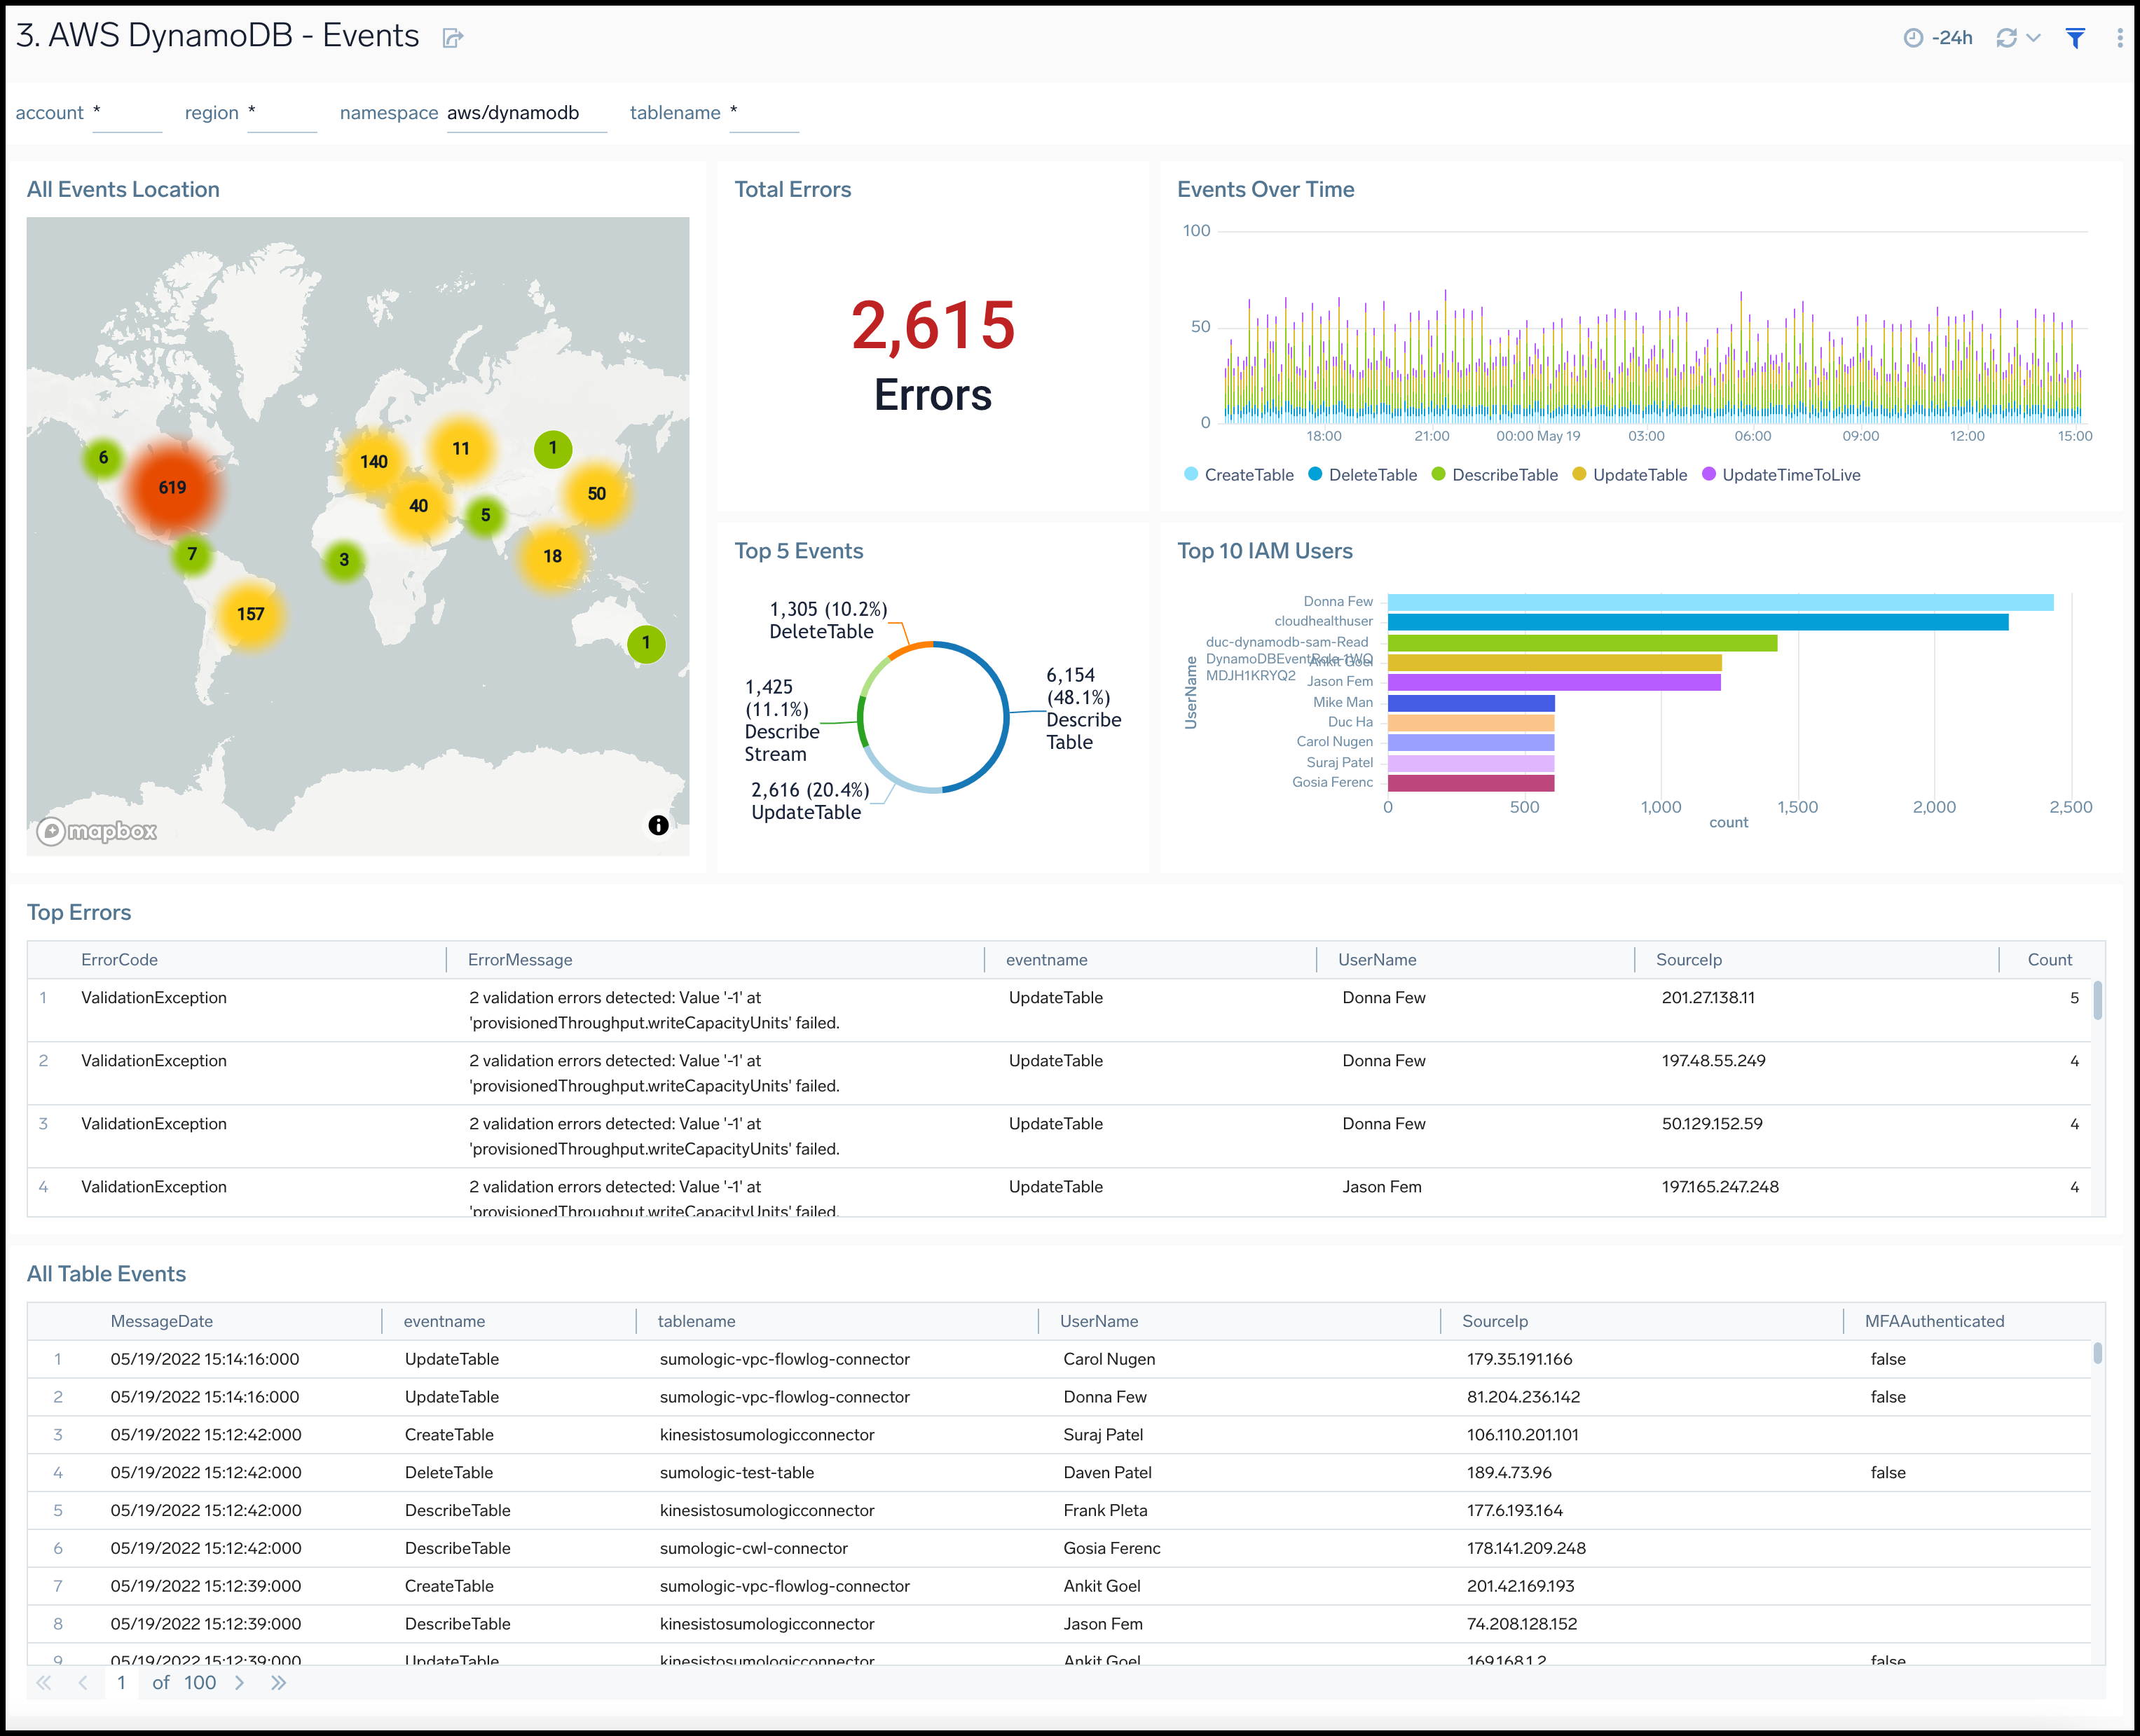
Events
The AWS DynamoDB - Events dashboard provides insights across your infrastructure for DynamoDB events including trends, users, errors, updates, creations and deletions to tables.
Use this dashboard to:
- Monitor DynamoDB activities and ensure they are in line with expectations.
- Monitor different types of table events, such as create, update, and describe tables.
- Quickly identify the top DynamoDB related errors
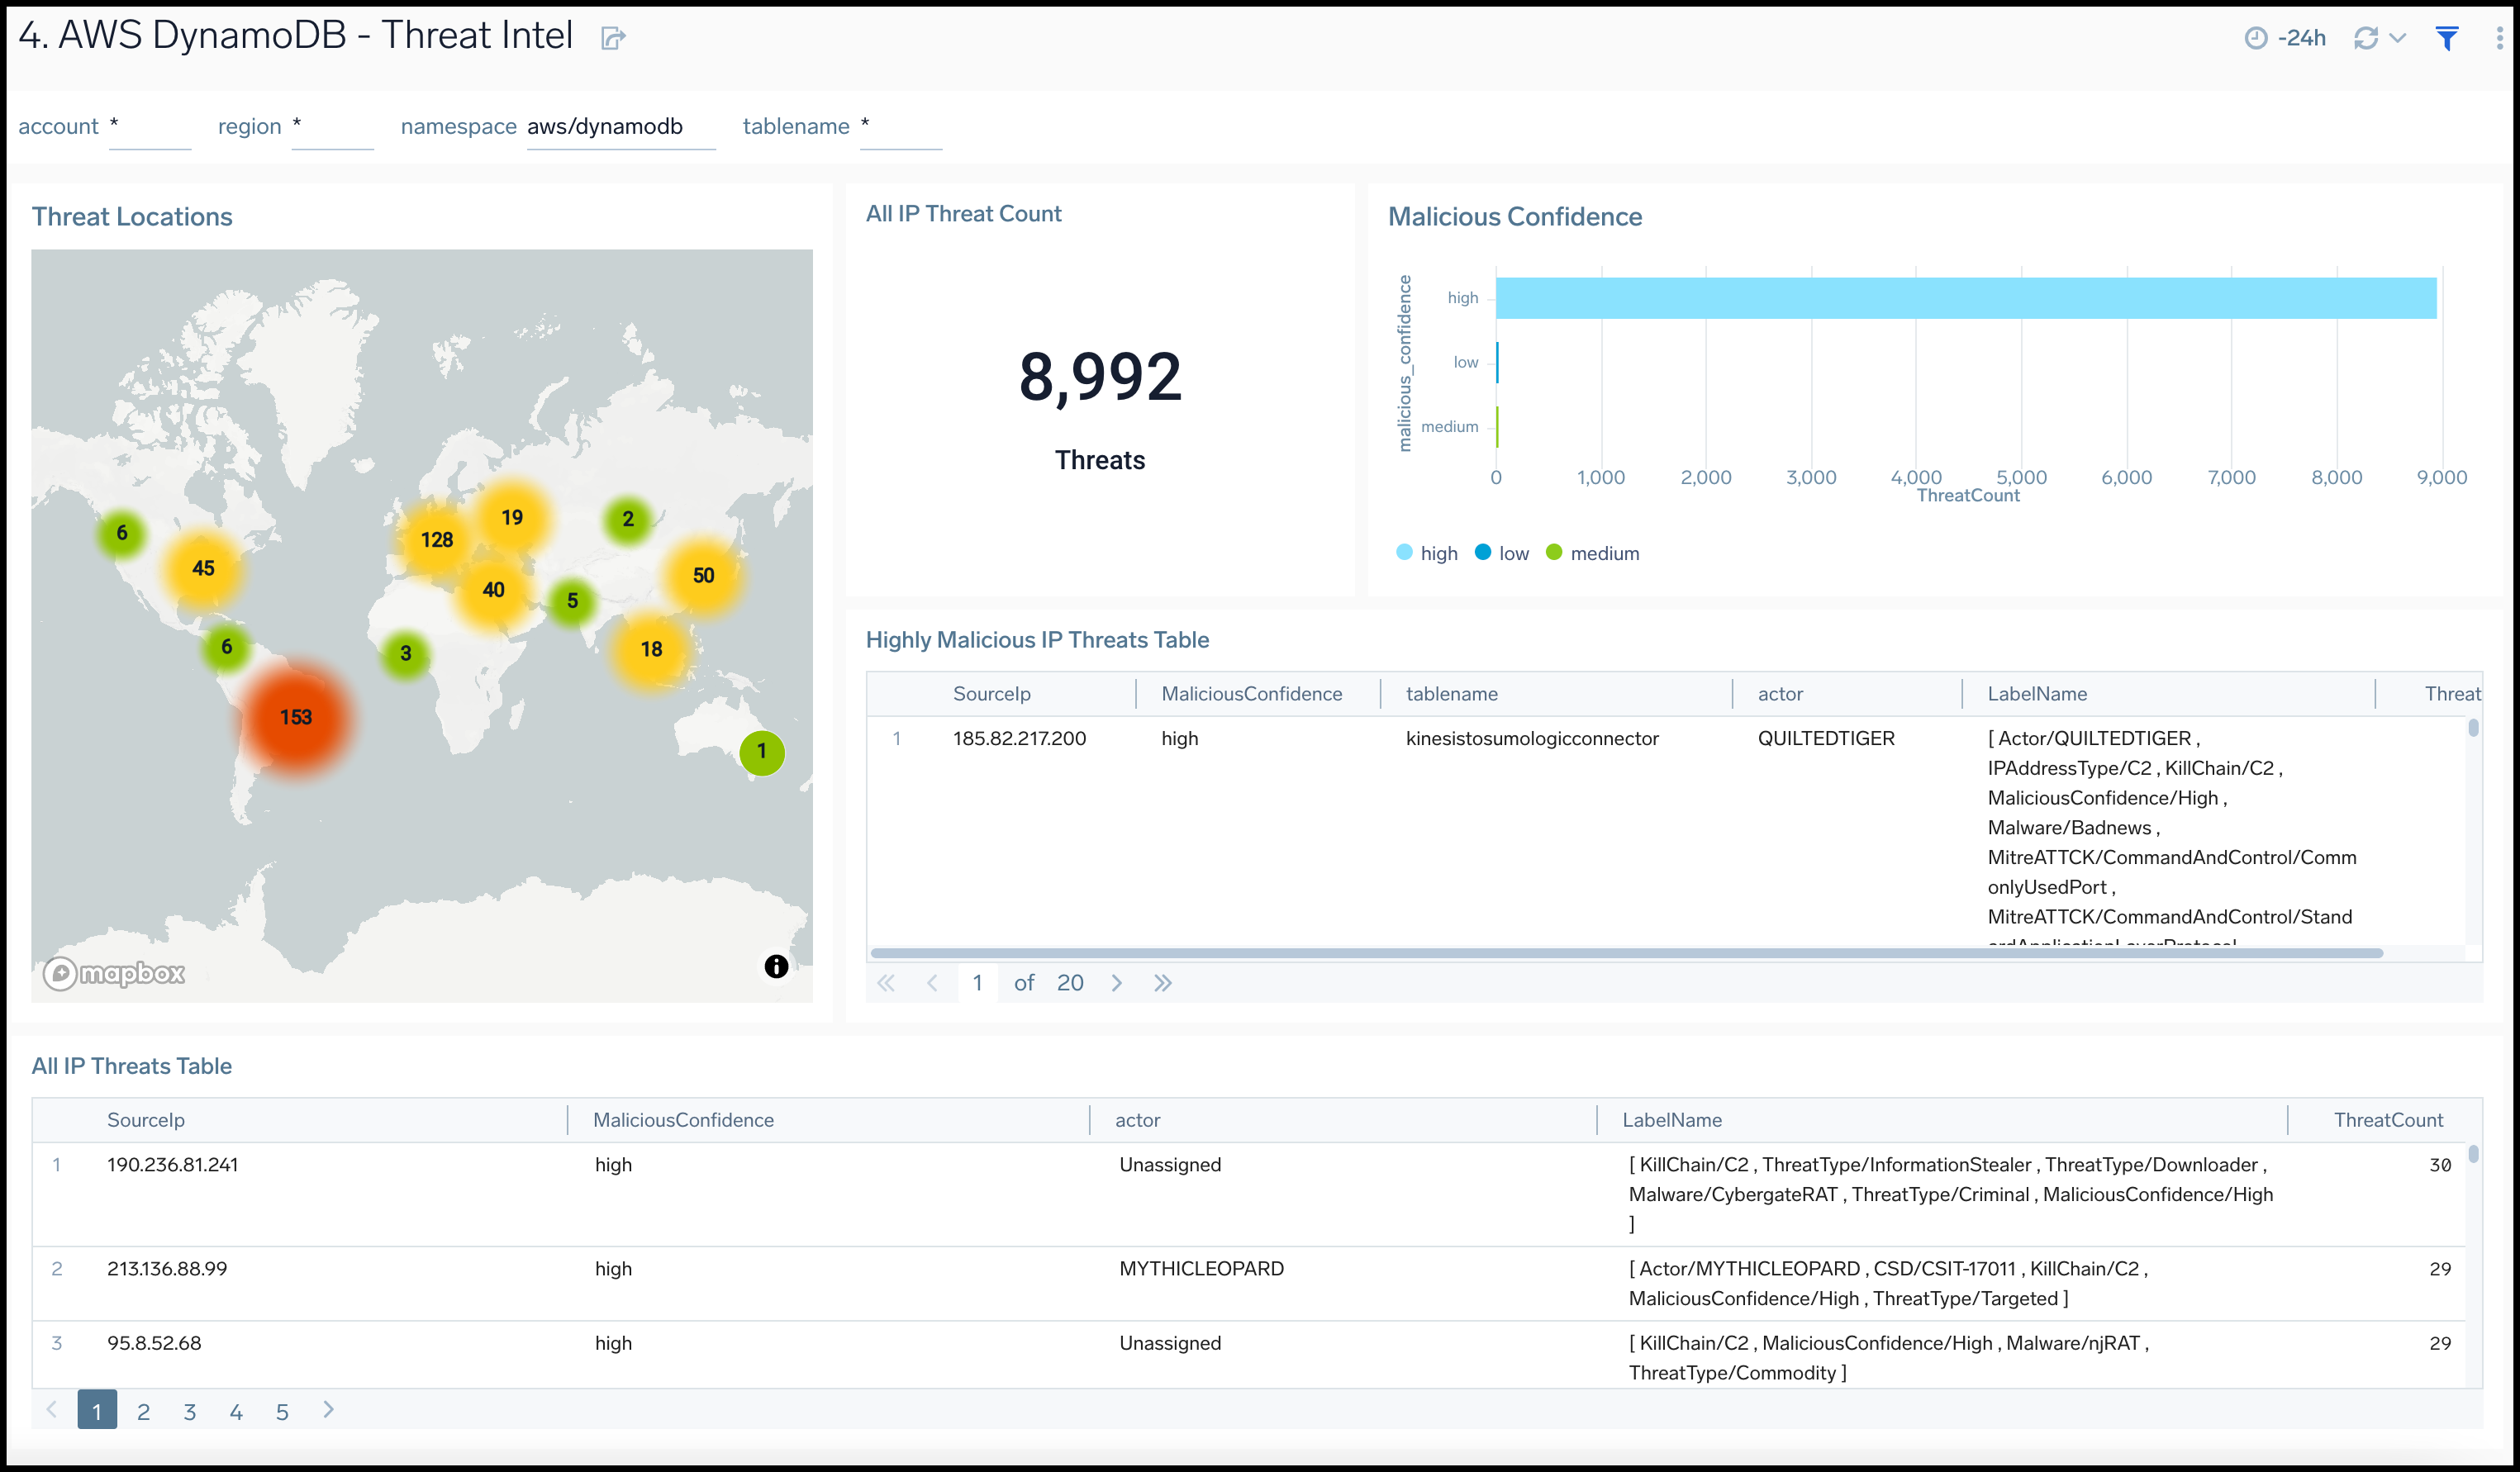
Threat Intel
The AWS DynamoDB - Threat Intel dashboard provides insights across your infrastructure for malicious requests to DynamoDB tables.
Use this dashboard to:
- Identify malicious IPs performing operations on DynamoDB tables using Sumo Logic Threat Intel.