Global Intelligence for AWS CloudTrail DevOps

Global Intelligence for AWS CloudTrail - DevOps provides insights for on-call engineers, infrastructure engineers, and DevOps users accelerate root cause analysis for incidents by providing error rate and configuration insights benchmarked from Sumo Logic’s AWS customers for nine AWS services:
- Amazon EC2
- Amazon S3
- AWS Elastic Load Balancing
- Amazon RDS
- Amazon Redshift
- Amazon DynamoDB
- Amazon ElastiCache
- AWS Lambda
- AWS Auto Scaling
The benchmarks are powered by more than 15 M data points per week from AWS CloudTrail logs for a few thousand Sumo Logic tenants across 27 AWS regions.
A well-architected modern app running on AWS can experience four types of errors during mission-critical scale-out events leading to an outage or application incident. These include:
- Service Availability errors, where a particular AWS service (For example, EC2) may be unavailable.
- Throttling errors, where AWS rate-limits API traffic from the customer’s application for a given service and API. (For example, PutItem requests for Amazon DynamoDB.)
- Account Quota errors, where a customer may saturate account limits for a particular service and resource. (For example, exceeding the 100 buckets per account limit of Amazon S3.)
- Insufficient capacity/out-of-stock errors where AWS is unable to provide resources of a particular size in a given region, such as EC2 m4.xlarge instances in us-west-1.
By comparing a given customer’s AWS error rate against other customers by AWS region, service, API, AWS account, and instance types, Global Intelligence for AWS CloudTrail DevOps, helps identify if such errors might be the probable cause of an incident.
In addition, the app provides configuration guidance for key AWS services based on settings common among other customers.
- Configuration guidance includes memory and concurrency settings for AWS Lambda, provisioned IOPS for DynamoDB, and min/max sizes of EC2 Auto Scaling groups.
- For throttling-related root causes for some services like AWS Lambda and Amazon DynamoDB, such guidance can help users right-size their apps based on common configuration settings.
- An action plan helps users focus their attention on specific microservices in particular AWS accounts that might be experiencing errors.
Prerequisites
This feature is available in the following account plans.
| Account Type | Account Level |
|---|---|
| Cloud Flex | Trial, Enterprise |
| Cloud Flex Credits | Trial, Enterprise Operations, Enterprise Security, Enterprise Suite |
Log types
Global Intelligence for CloudTrail DevOps App uses AWS CloudTrail logs.
The Sumo Logic Global Intelligence for AWS CloudTrail DevOps app provides insight into your key CloudTrail events. You can review the log collection process and start collecting data.
Sample log messages
{
	"eventVersion":"1.05",
	"userIdentity":{
		"type":"IAMUser",
		"principalId":"AIDAJK3NPEULWYAYYL73U",
		"arn":"arn:aws:iam::224064240813:user/username",
		"accountId":"224064240808",
		"userName":"acme@acme.com"
	},
	"eventTime":"2020-01-11 00:42:12+0000",
	"eventSource":"signin.amazonaws.com",
	"eventName":"ConsoleLogin",
	"awsRegion":"us-west-2",
	"sourceIPAddress":"115.13.72.133",
	"userAgent":"Mozilla/5.0 (Macintosh; Intel Mac OS X 10_13_1)
 AppleWebKit/537.36 (KHTML, like Gecko) Chrome/61.0.3163.100 Safari/537.36",
	"requestParameters":null,
	"responseElements":{
		"ConsoleLogin":"Success"
	},
	"additionalEventData":{
		"LoginTo":"https://us-west-2.console.aws.amazon.com/ecs/home?region=us-west-2&
state=hashArgs%23%2Frepositories%2Ftravellogic%3Aproducts&isauthcode=true",
		"MobileVersion":"No",
		"MFAUsed":"Yes"
	},
	"eventID":"8fd88195-8576-49ad-9e14-8330cb492604",
	"eventType":"AwsConsoleSignIn",
	"recipientAccountId":"224064240808"
}
Sample queries
Click to expand.
This sample query is from the Lambda Configuration: My Company v. Others (Categorical) panel of GI CloudTrail DevOps - 05. Configuration Benchmarks dashboard.
// id=@config_lambda_categorical_values
_sourceCategory=Labs/AWS/CloudTrailDevOps/Analytics
(AwsApiCall lambda !errorCode)
and (Runtime or Mode)
| parse "\"awsRegion\":\"*\"" as awsRegion
| parse "\"eventSource\":\"*\"" as eventSource
| parse "\"eventName\":\"*\"" as eventName
| parse "\"eventType\":\"*\"" as eventType
| parse "\"recipientAccountId\":\"*\"" as recipientAccountId
| parse field=eventSource "*.amazonaws.com" as resourceType
| parse "\"functionName\":\"*\"" as functionName nodrop
// Filter specific to this analysis
| where eventType = "AwsApiCall" and resourceType = "lambda"
// Categorical configuration - Lambda
| parse "\"mode\":\"*\"" as mode nodrop
| parse "\"runtime\":\"*\"" as runtime nodrop
// Now we need to inverse transpose the rows into different rows
| if(!isBlank(mode), mode, "Not-Available") as mode
| if(!isBlank(runtime), runtime, "Not-Available") as runtime
| count_distinct(functionName) by mode, runtime, awsRegion
// Unpack the different configuration options into their own benchmarkname rows
| concat("resourceType=lambda_tracingConfig=", mode, "_awsRegion=", awsRegion, ",", "resourceType=lambda_runtime=", runtime, "_awsRegion=", awsRegion) as benchmarkNames
| parse regex field=benchmarkNames "(?<benchmarkname>[^,]+)" multi
| where !(benchmarkname matches "*Not-Available*")
| fields benchmarkname, _count_distinct
| sum(_count_distinct) by benchmarkname
| _sum as _count_distinct
| parse field=benchmarkname "resourceType=lambda_*=*_awsRegion=*" as denomGroup, _, awsRegion
| concat(denomGroup, "_", awsRegion) as denomGroup
// Use join to do parallel calculations:
// t1: per-event type (denomGroup) denominators
// t2: per-event value (numerator) counts
| join
(sum(_count_distinct) as denom by denomGroup) as t1,
(sum(_count_distinct) as val by denomGroup, benchmarkName) as t2
on t1.denomGroup = t2.denomGroup
// Unpack the results and compute the desired percentages
| t2_val as val
| t2_benchmarkname as benchmarkname
| t1_denom as denom
| concat(round(toDouble(val) / denom * 10000) / 100, "%") as my_company_percentage
| infer _category=cloudtraildevops _model=benchmark benchmarktype=categorical
| concat(round(percentage * 10000) / 100, "%") as benchmark_percentage
| parse field=benchmarkname "resourceType=*_*=*_awsRegion=*" as _, configProperty, value, awsRegion
| fields awsRegion, configProperty, value, my_company_percentage, benchmark_percentage
| sort +awsRegion, +configProperty, +value
Collecting logs for the Global Intelligence for AWS CloudTrail DevOps App
If you already have AWS CloudTrail logs flowing into Sumo Logic, you can skip the steps in this section and go to Installing the App.
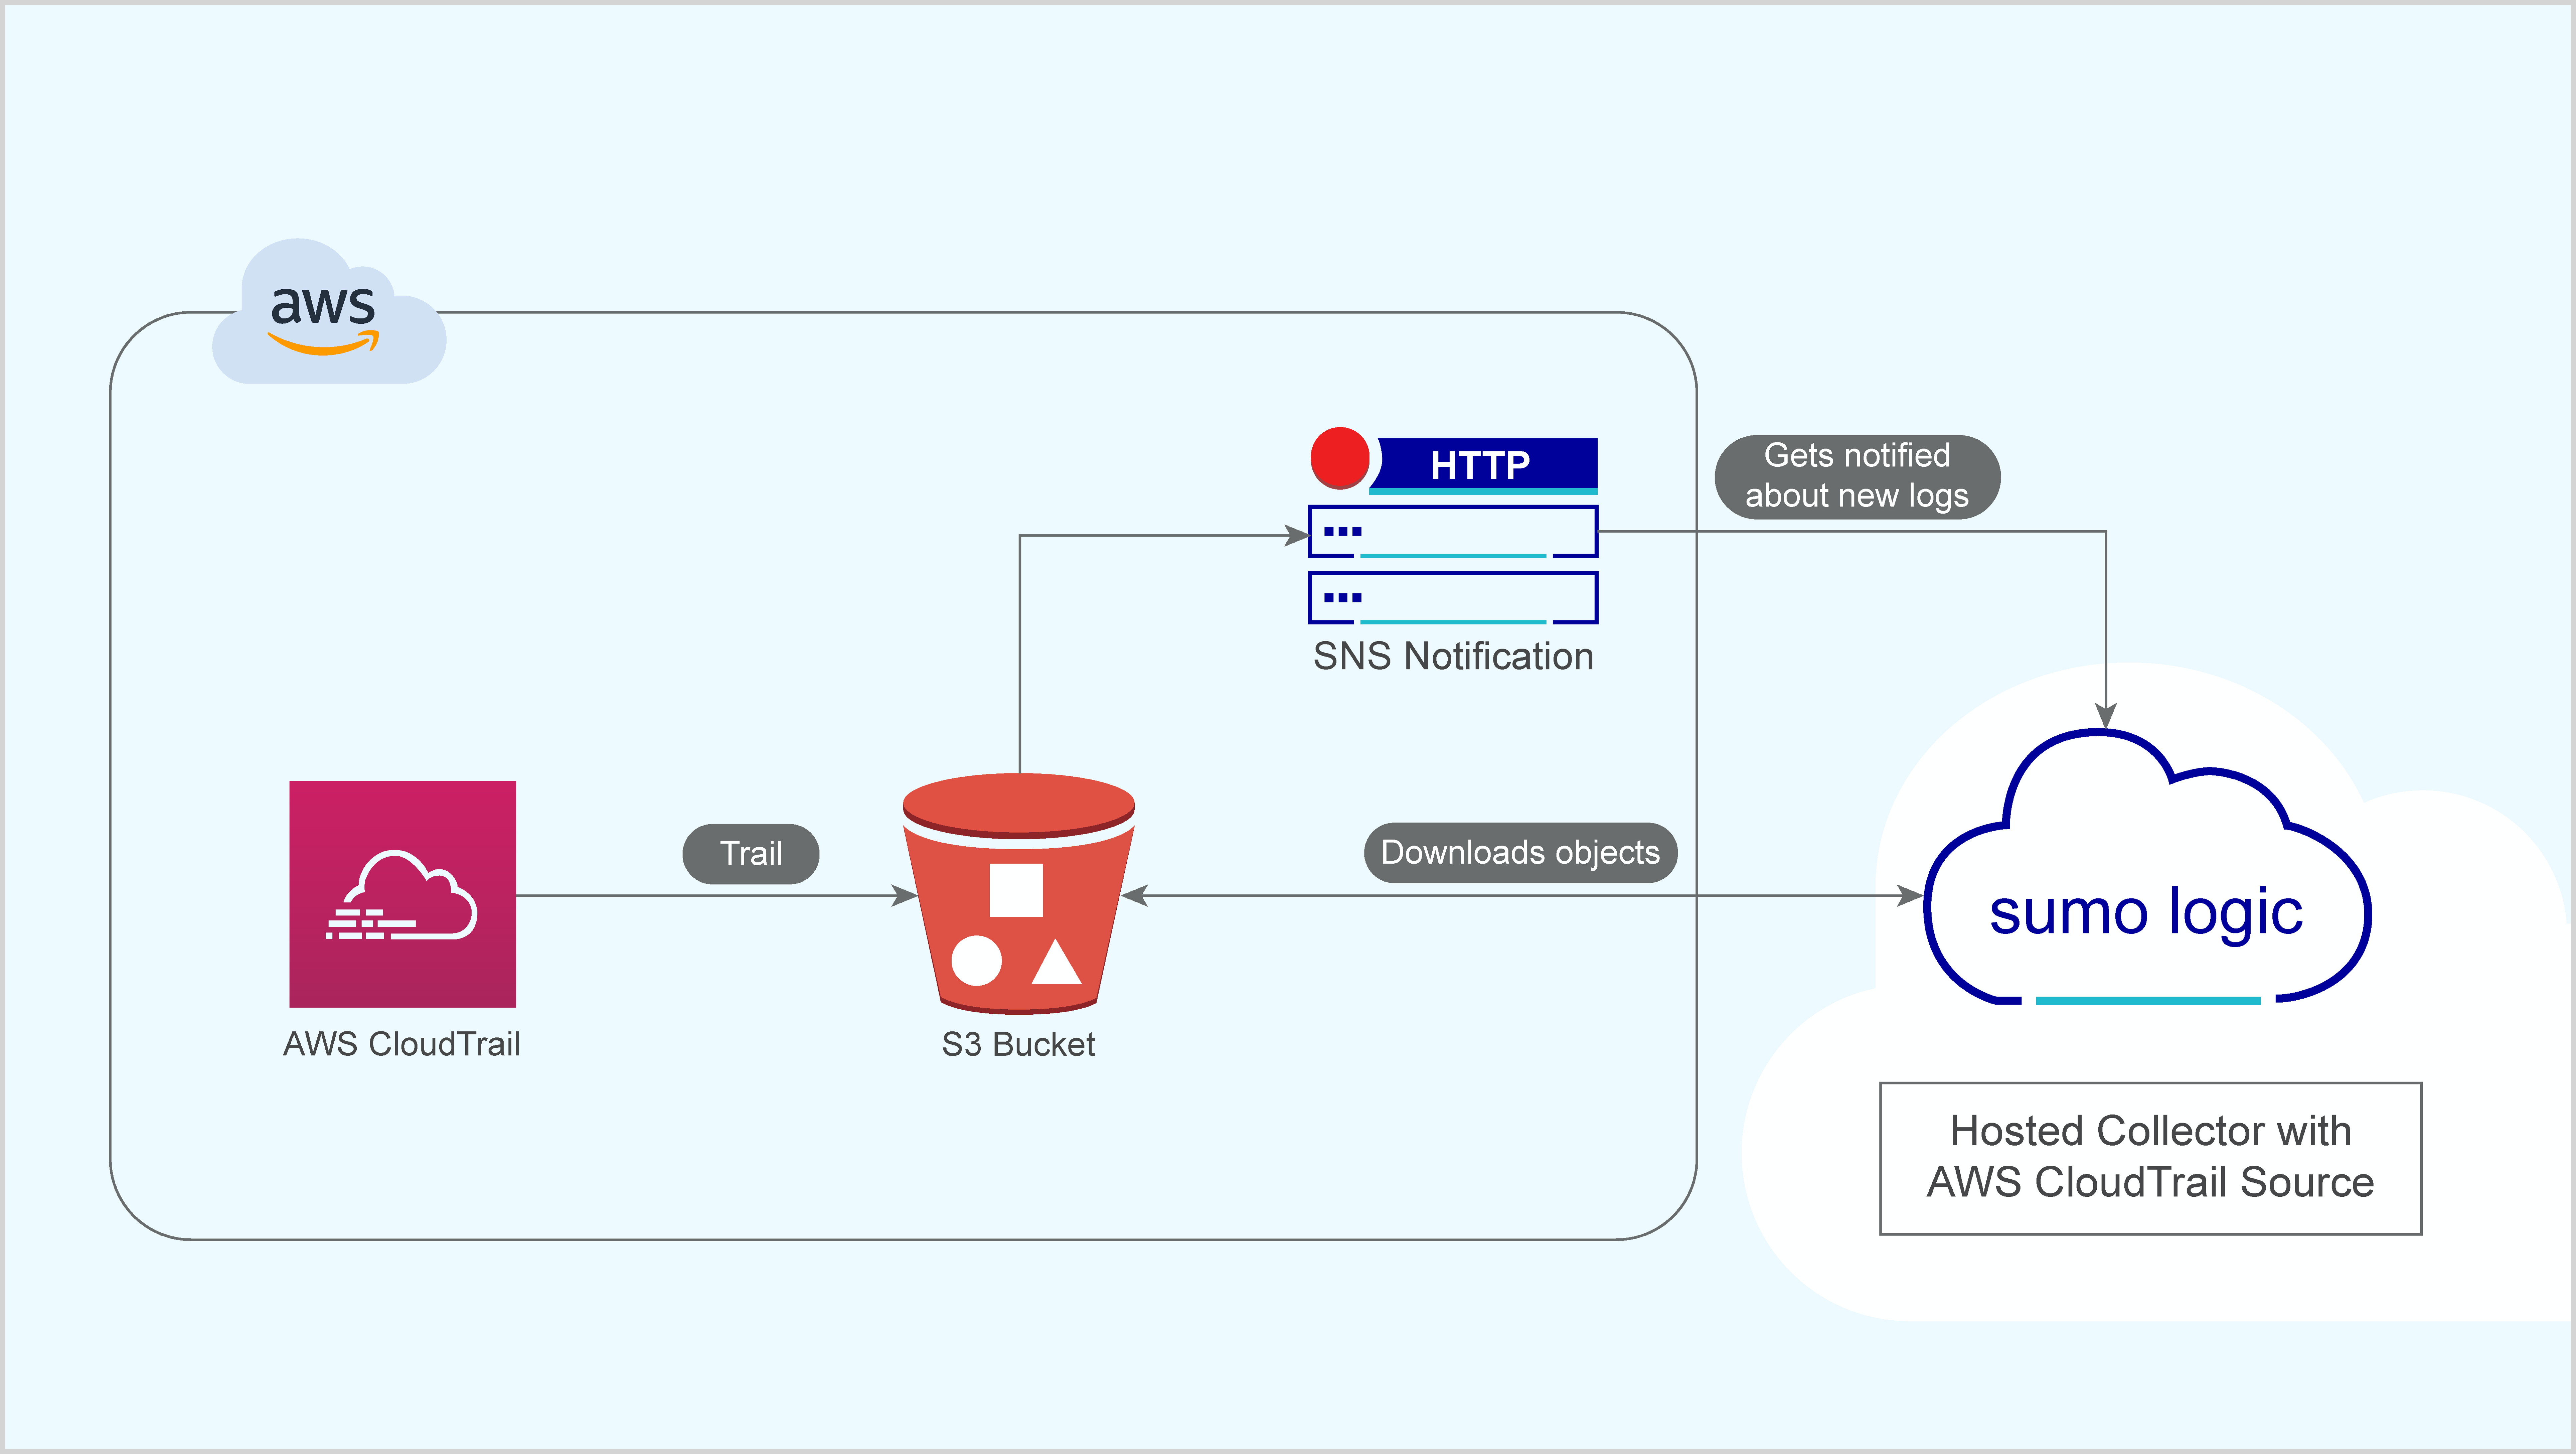
With this graphic, you can see how to collect logs from AWS CloudTrail DevOps and send them to Sumo Logic.
Prerequisites
Before you begin, you must configure AWS CloudTrail logging to an S3 bucket.
- Configure CloudTrail in your AWS account.
- Enable logging using the AWS Management Console.
- Confirm that logs are being delivered to the S3 bucket.
- Grant Access to an Amazon S3 Bucket.
Configuring Log Collection for AWS Global Intelligence CloudTrail DevOps
To configure log collection for Global Intelligence for AWS CloudTrail, follow the steps described here.
Installing the Global Intelligence for AWS CloudTrail DevOps App
To install the app:
- Select App Catalog.
- In the 🔎 Search Apps field, run a search for your desired app, then select it.
- Click Install App.
note
Sometimes this button says Add Integration.
- On the next configuration page, under Select Data Source for your App, complete the following fields:
- Data Source. Select one of the following options:
- Choose Source Category and select a source category from the list; or
- Choose Enter a Custom Data Filter, and enter a custom source category beginning with an underscore. For example,
_sourceCategory=MyCategory.
- Folder Name. You can retain the existing name or enter a custom name of your choice for the app.
- All Folders (optional). The default location is the Personal folder in your Library. If desired, you can choose a different location and/or click New Folder to add it to a new folder.
- Data Source. Select one of the following options:
- Click Next.
- Look for the dialog confirming that your app was installed successfully.

Post-installation
Once your app is installed, it will appear in your Personal folder or the folder that you specified. From here, you can share it with other users in your organization. Dashboard panels will automatically start to fill with data matching the time range query received since you created the panel. Results won't be available immediately, but within about 20 minutes, you'll see completed graphs and maps.
Viewing GI CloudTrail DevOps Dashboards
Each dashboard has a set of filters that you can apply to the entire dashboard, as shown in the following example. Click the funnel icon in the top dashboard menu bar to display a scroll-able list of filters that are applied across the entire dashboard.
You can use filters to drill down and examine the data on a granular level.
Each panel has a set of filters that are applied to the results for that panel only, as shown in the following example. Click the funnel icon in the top panel menu bar to display a list of panel-specific filters.
01. AWS Service Availability
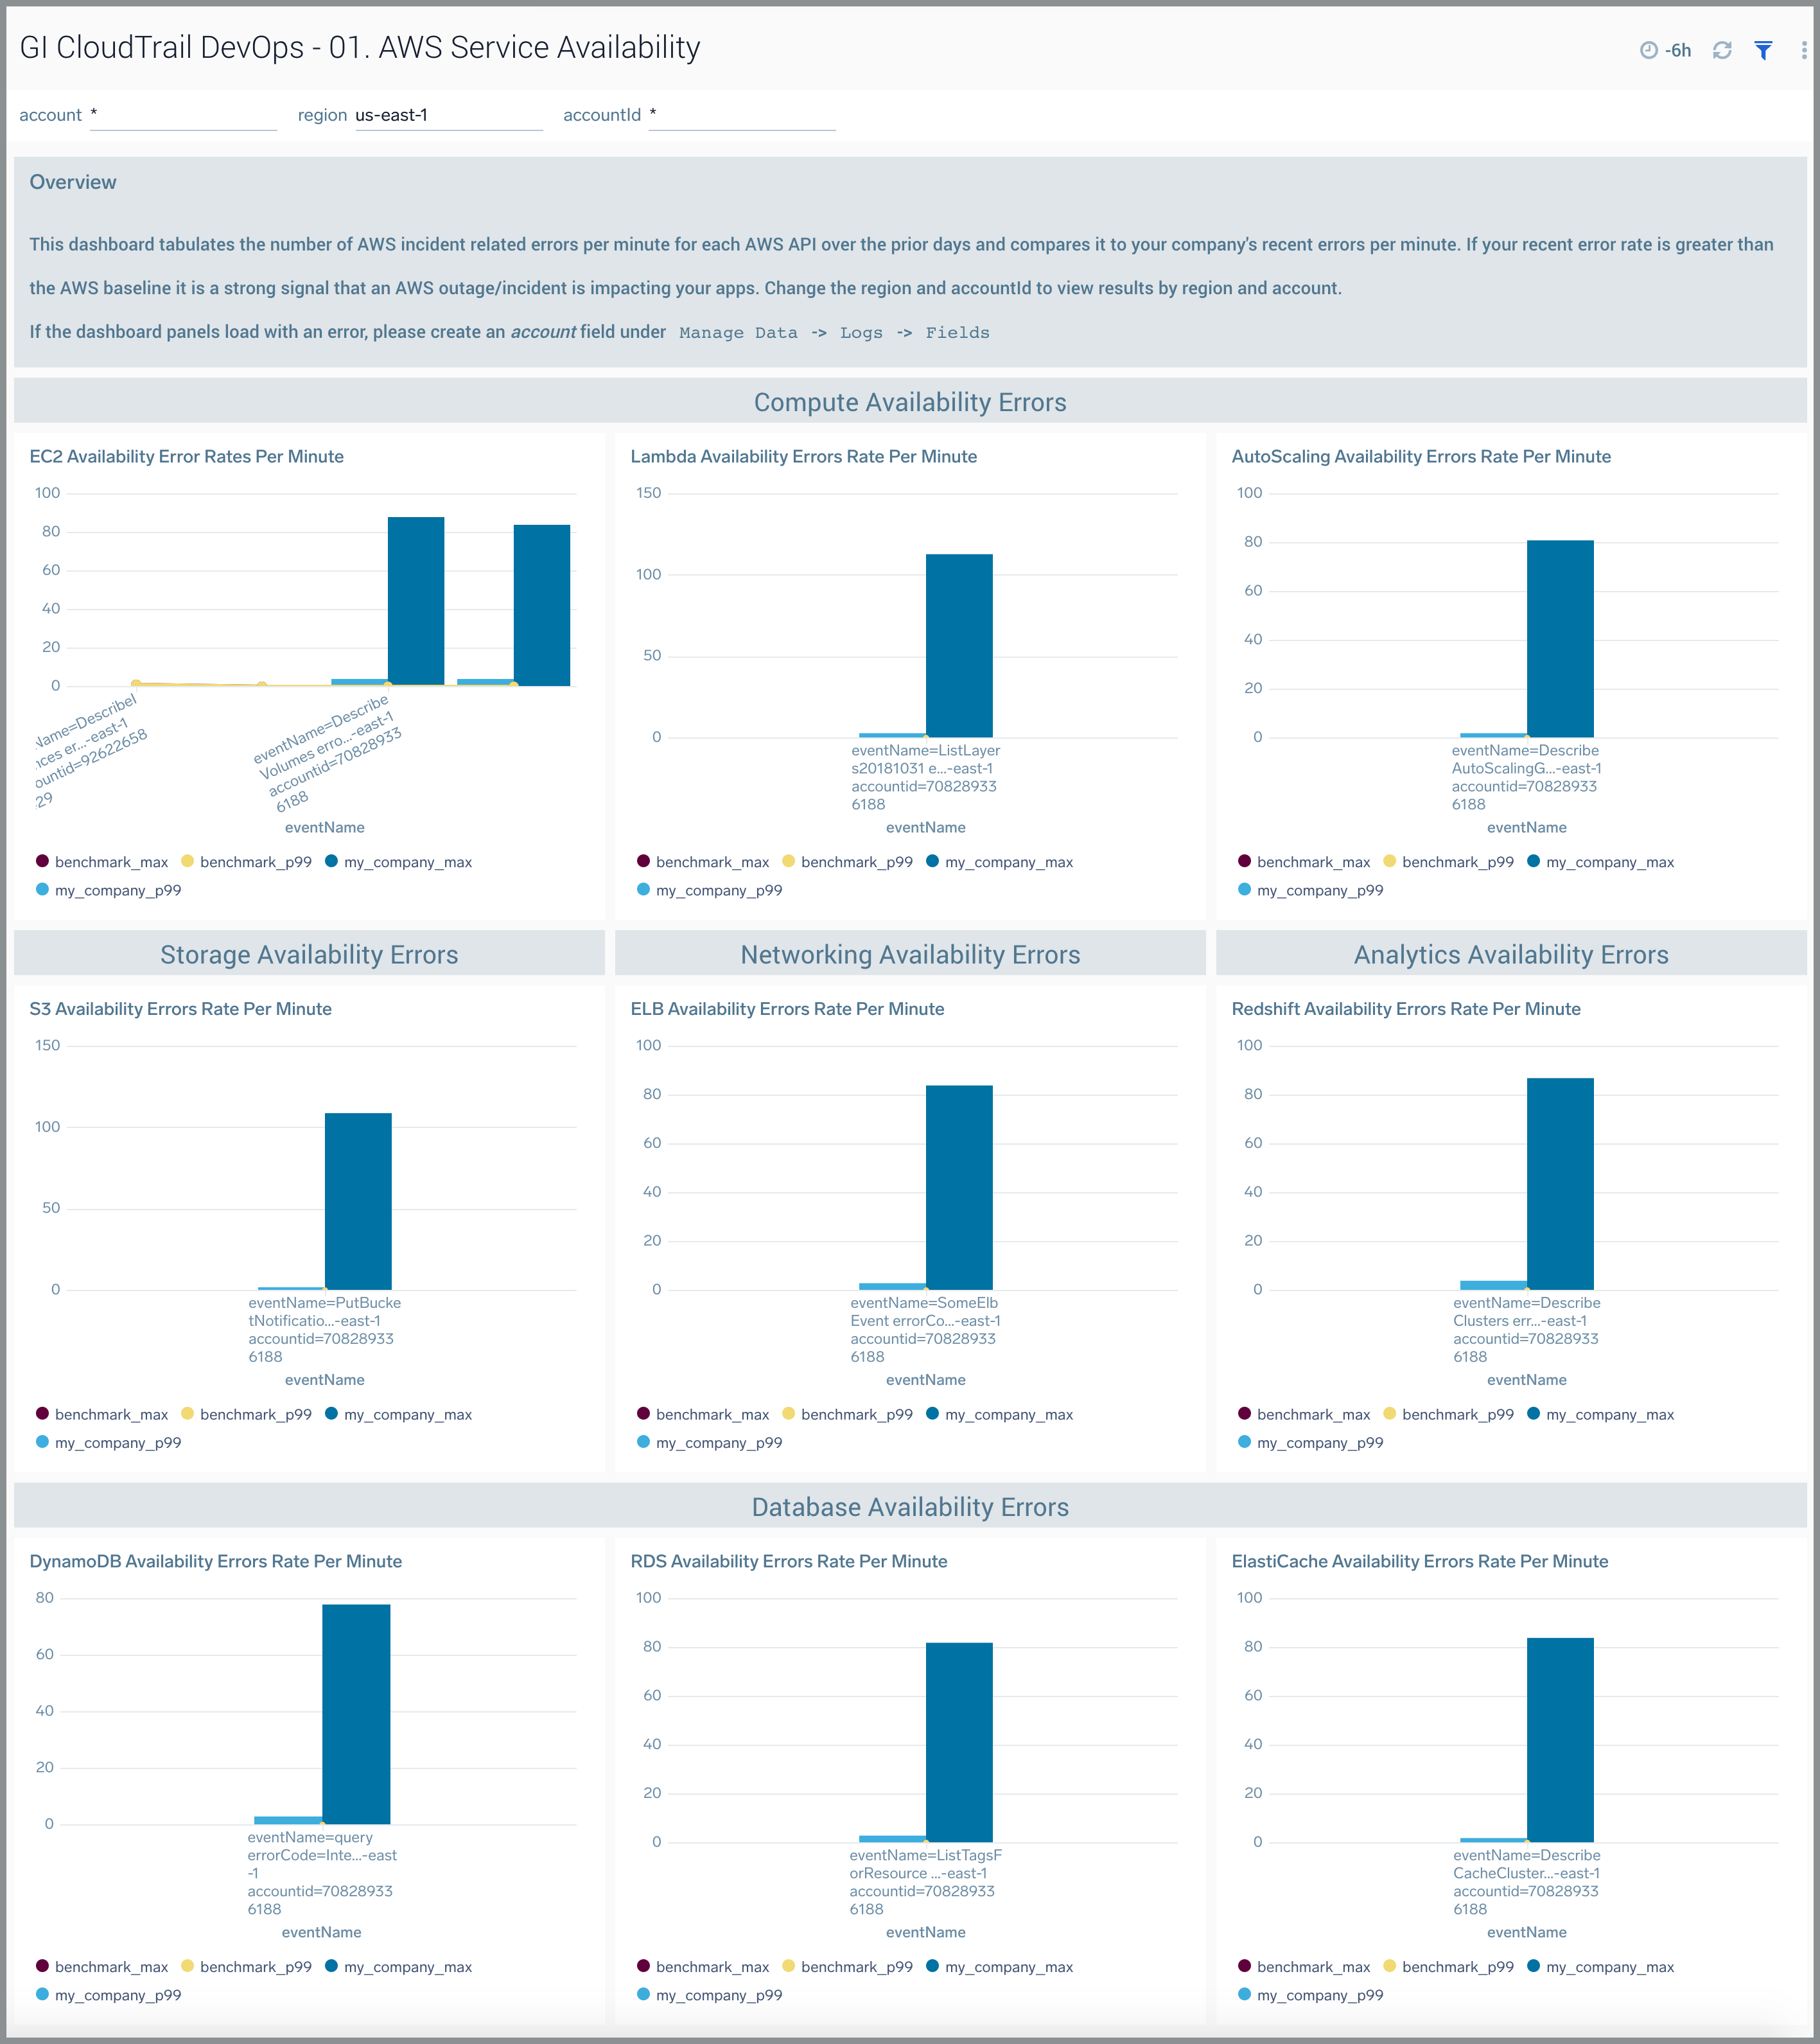
The GI CloudTrail DevOps - 01. AWS Service Availability dashboard tabulates the number of AWS incident-related errors for each minute and compares it to errors your company is facing. If your recent error rate is greater than the AWS baseline, it is a strong signal that an AWS outage or incident is impacting your apps. You can select the awsRegion and recipientAccountId to view results by region and an AWS account. Unlike the AWS Service Health Dashboard, this dashboard computes availability by API for each of the nine AWS services.
Use this dashboard to:
- Monitor AWS-related incidents in your organization.
- Compare AWS incident and outage rates by region and account to other customers.
02. My Company’s Throttling Errors
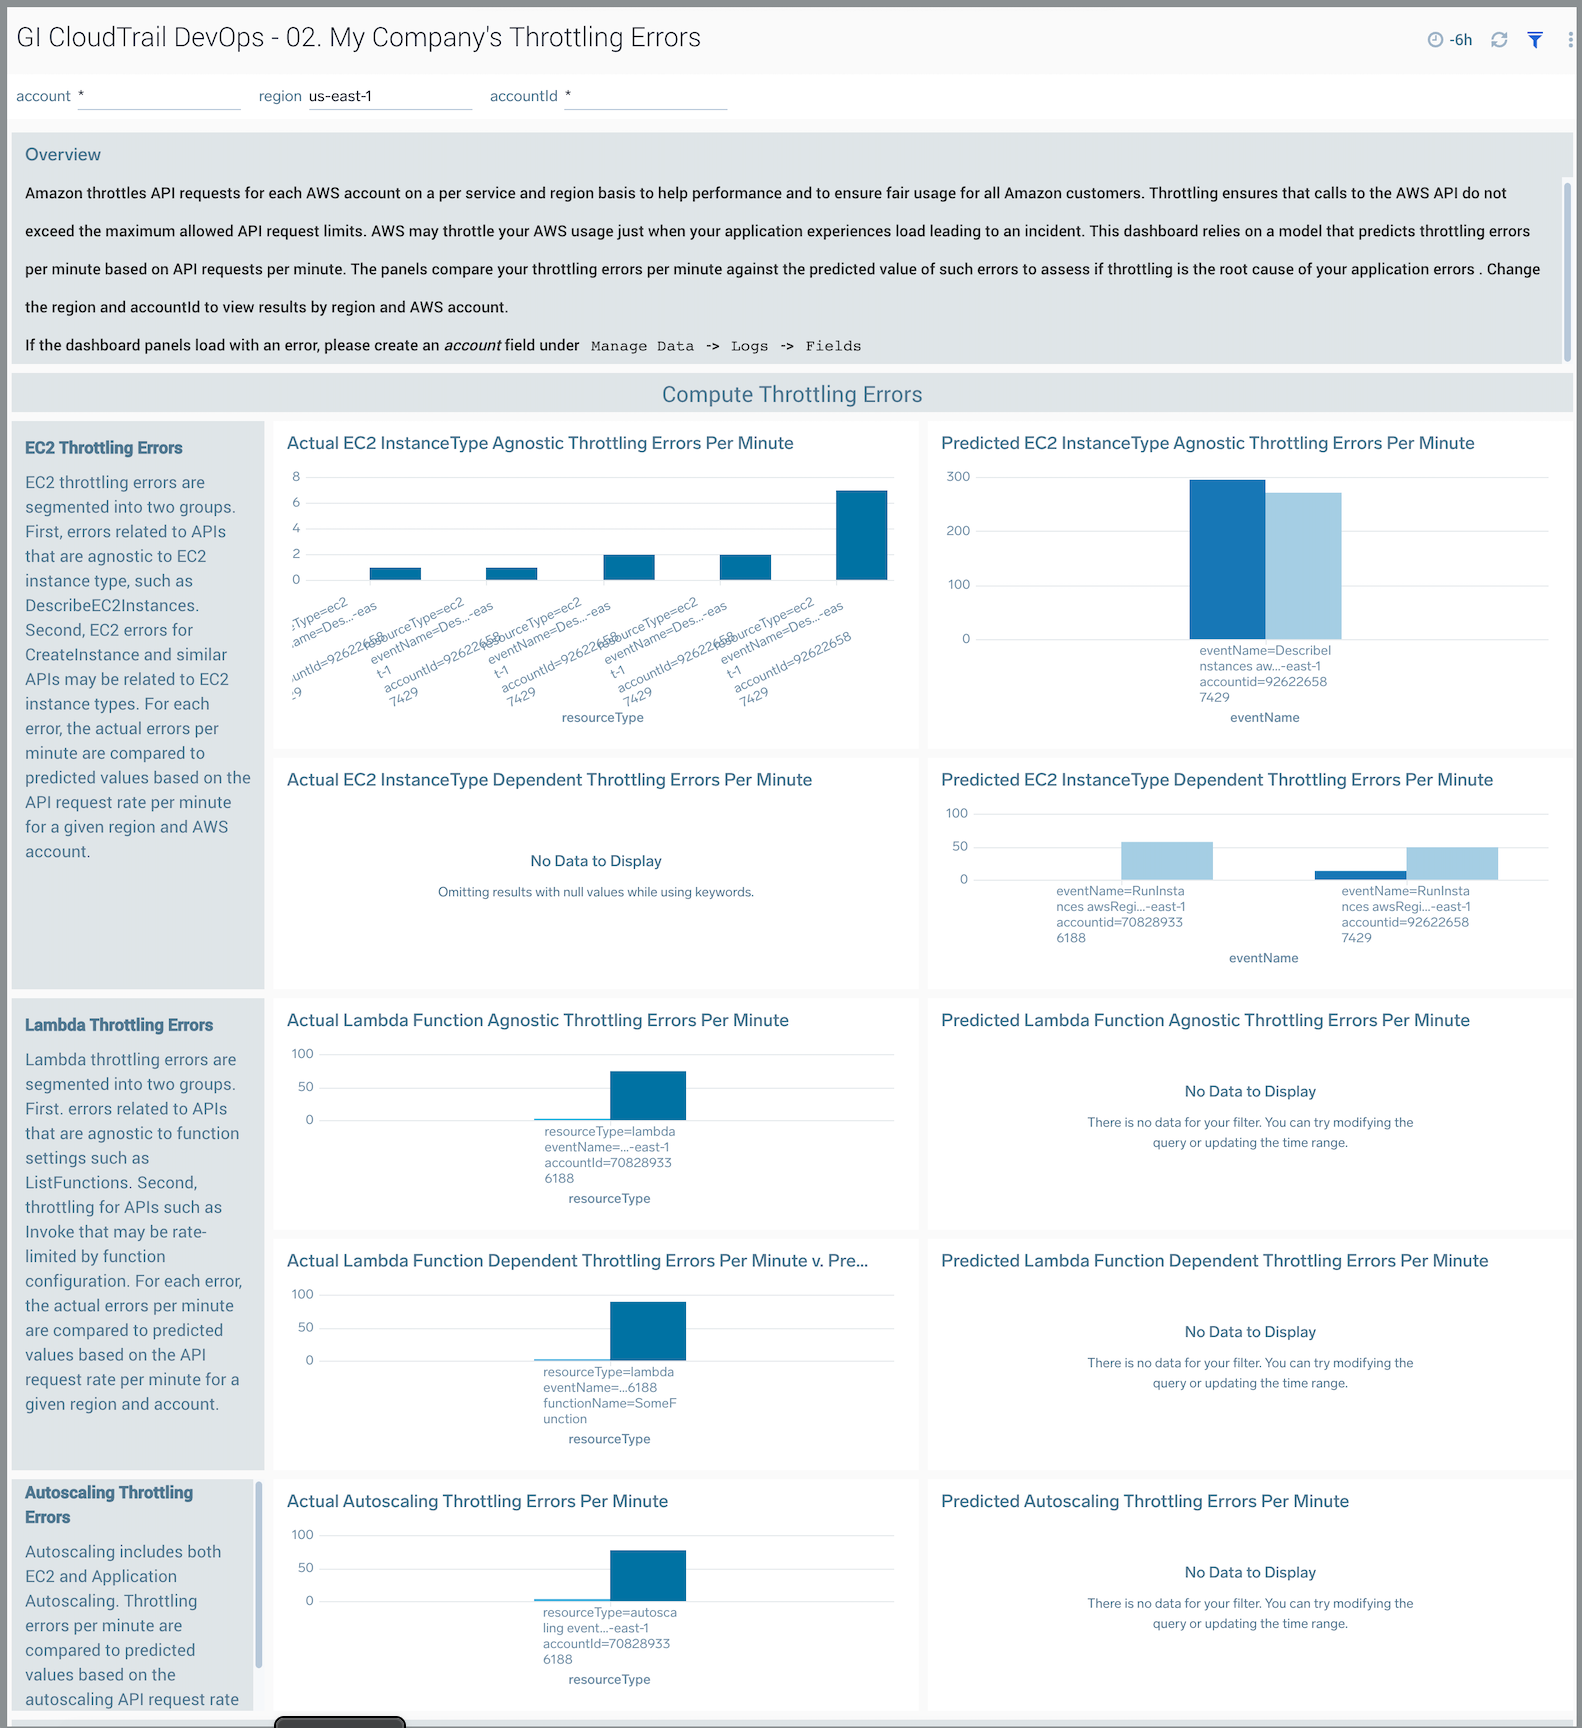
The GI CloudTrail DevOps - 02. My Company’s Throttling Errors dashboard predicts throttling errors per minute based on API requests per minute, for a given AWS API. The panels compare your throttling errors per minute to the predicted value of such errors to assess if throttling is the root cause of application errors. You can select the awsRegion and recipientAccountId to view results by region and account.
Throttling ensures that calls to the AWS API do not exceed the maximum allowed API request limits. AWS may throttle your AWS usage just when your application experiences load and make additional API requests, leading to an incident.
For many APIs, the throttling rate per minute as measured by Sumo Logic may indeed be zero. Where sufficient data exists from Sumo Logic customers, the app will show error rate predictions based on API request rates. To illustrate how to use this dashboard below is an example of a single API request for EC2, describeInstances, and how it might encounter one type of throttling error, Request Limit Exceeded. The correlation is not linear for many APIs; the diagram shows a linear relationship for illustration purposes. In the diagram, two hypothetical companies that are experiencing throttling at rates different from that predicted by the model (note that the predicted rate might be zero for many API) for the describeInstances APl.
Specifically, Company A is experiencing more throttling errors than predicted. This could mean one or more of the following:
- The latest AWS API usage patterns are different from what the model has learned from the prior 7 days data.
- There are company-specific factors that are not captured in our model.
- There may be periodicity or intricacies related to AWS’ throttling algorithms (For example, steady-state throughput allocation v. burst allocation) not captured in the model.
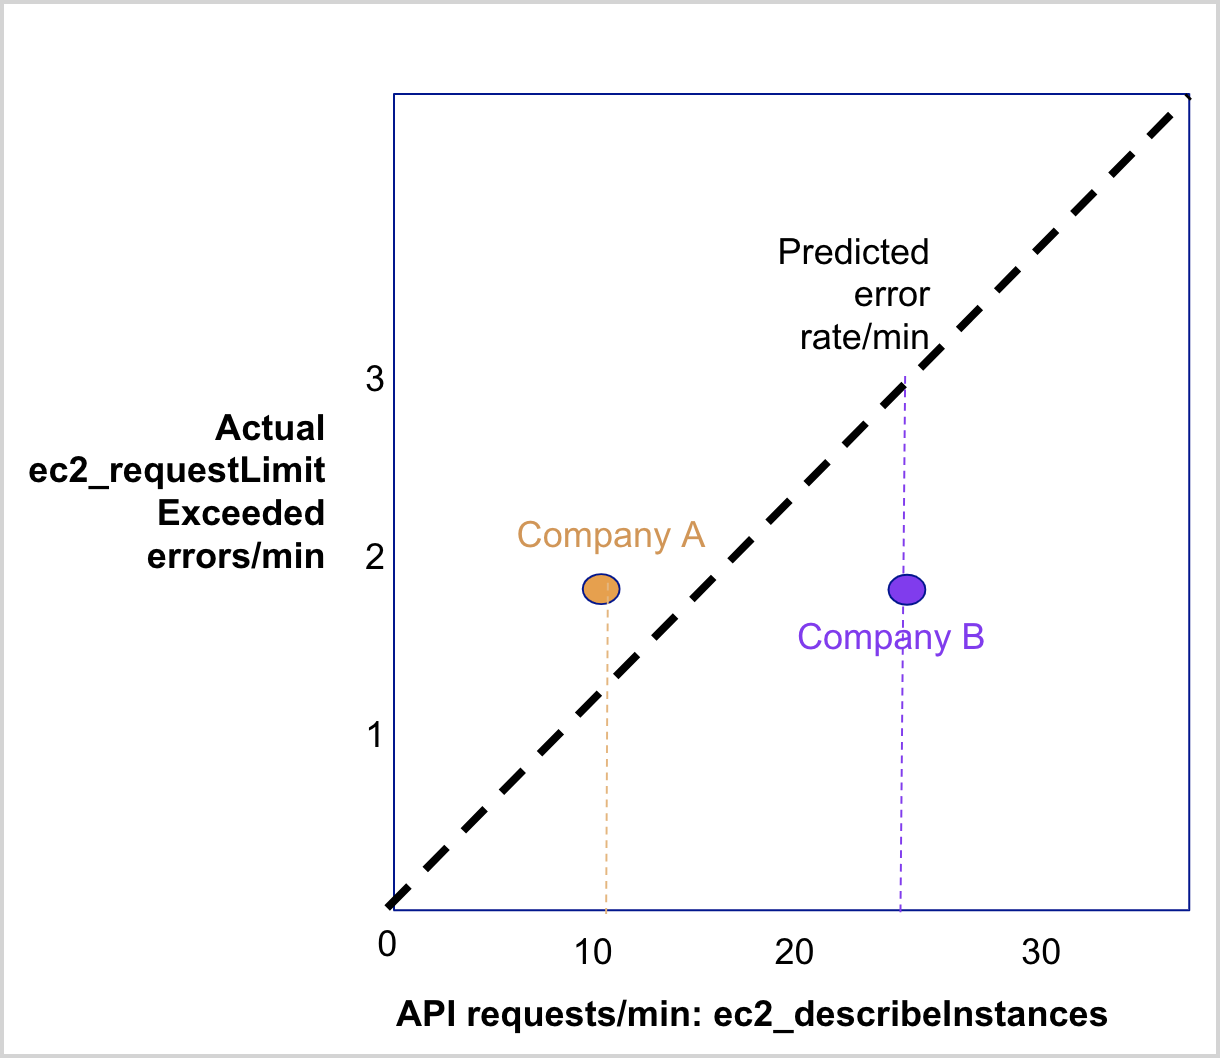
On the other hand, Company B is experiencing fewer throttling errors than predicted. This could mean one or more of the following:
- You may experience higher throttling errors in the future based on our models.
- The latest AWS API usage patterns are different from what the model has learned from the prior 7 days.
- There are company-specific factors that are not captured in our model, such as an increase in API request quota for your company.
- There may be periodicity or intricacies related to AWS’ throttling algorithms (For example, steady-state throughput allocation v. burst allocation) not captured in the model.
Consult the AWS documentation for the appropriate service to understand best practices to minimize throttling errors including batching requests and adding exponential backoff retries. See https://docs.aws.amazon.com/AWSEC2/latest/APIReference/query-api-troubleshooting.html for suggestions for EC2 throttling errors.
Use this dashboard to:
- Monitor throttling errors in your AWS environment.
- Compare your throttling errors by AWS service, API name, region and account to other customers.
- Troubleshoot application errors.
- Request greater API request limits through AWS Support if you feel your application is consistently being throttled at a greater rate than other customers.
03. My Company’s Account Quota Errors
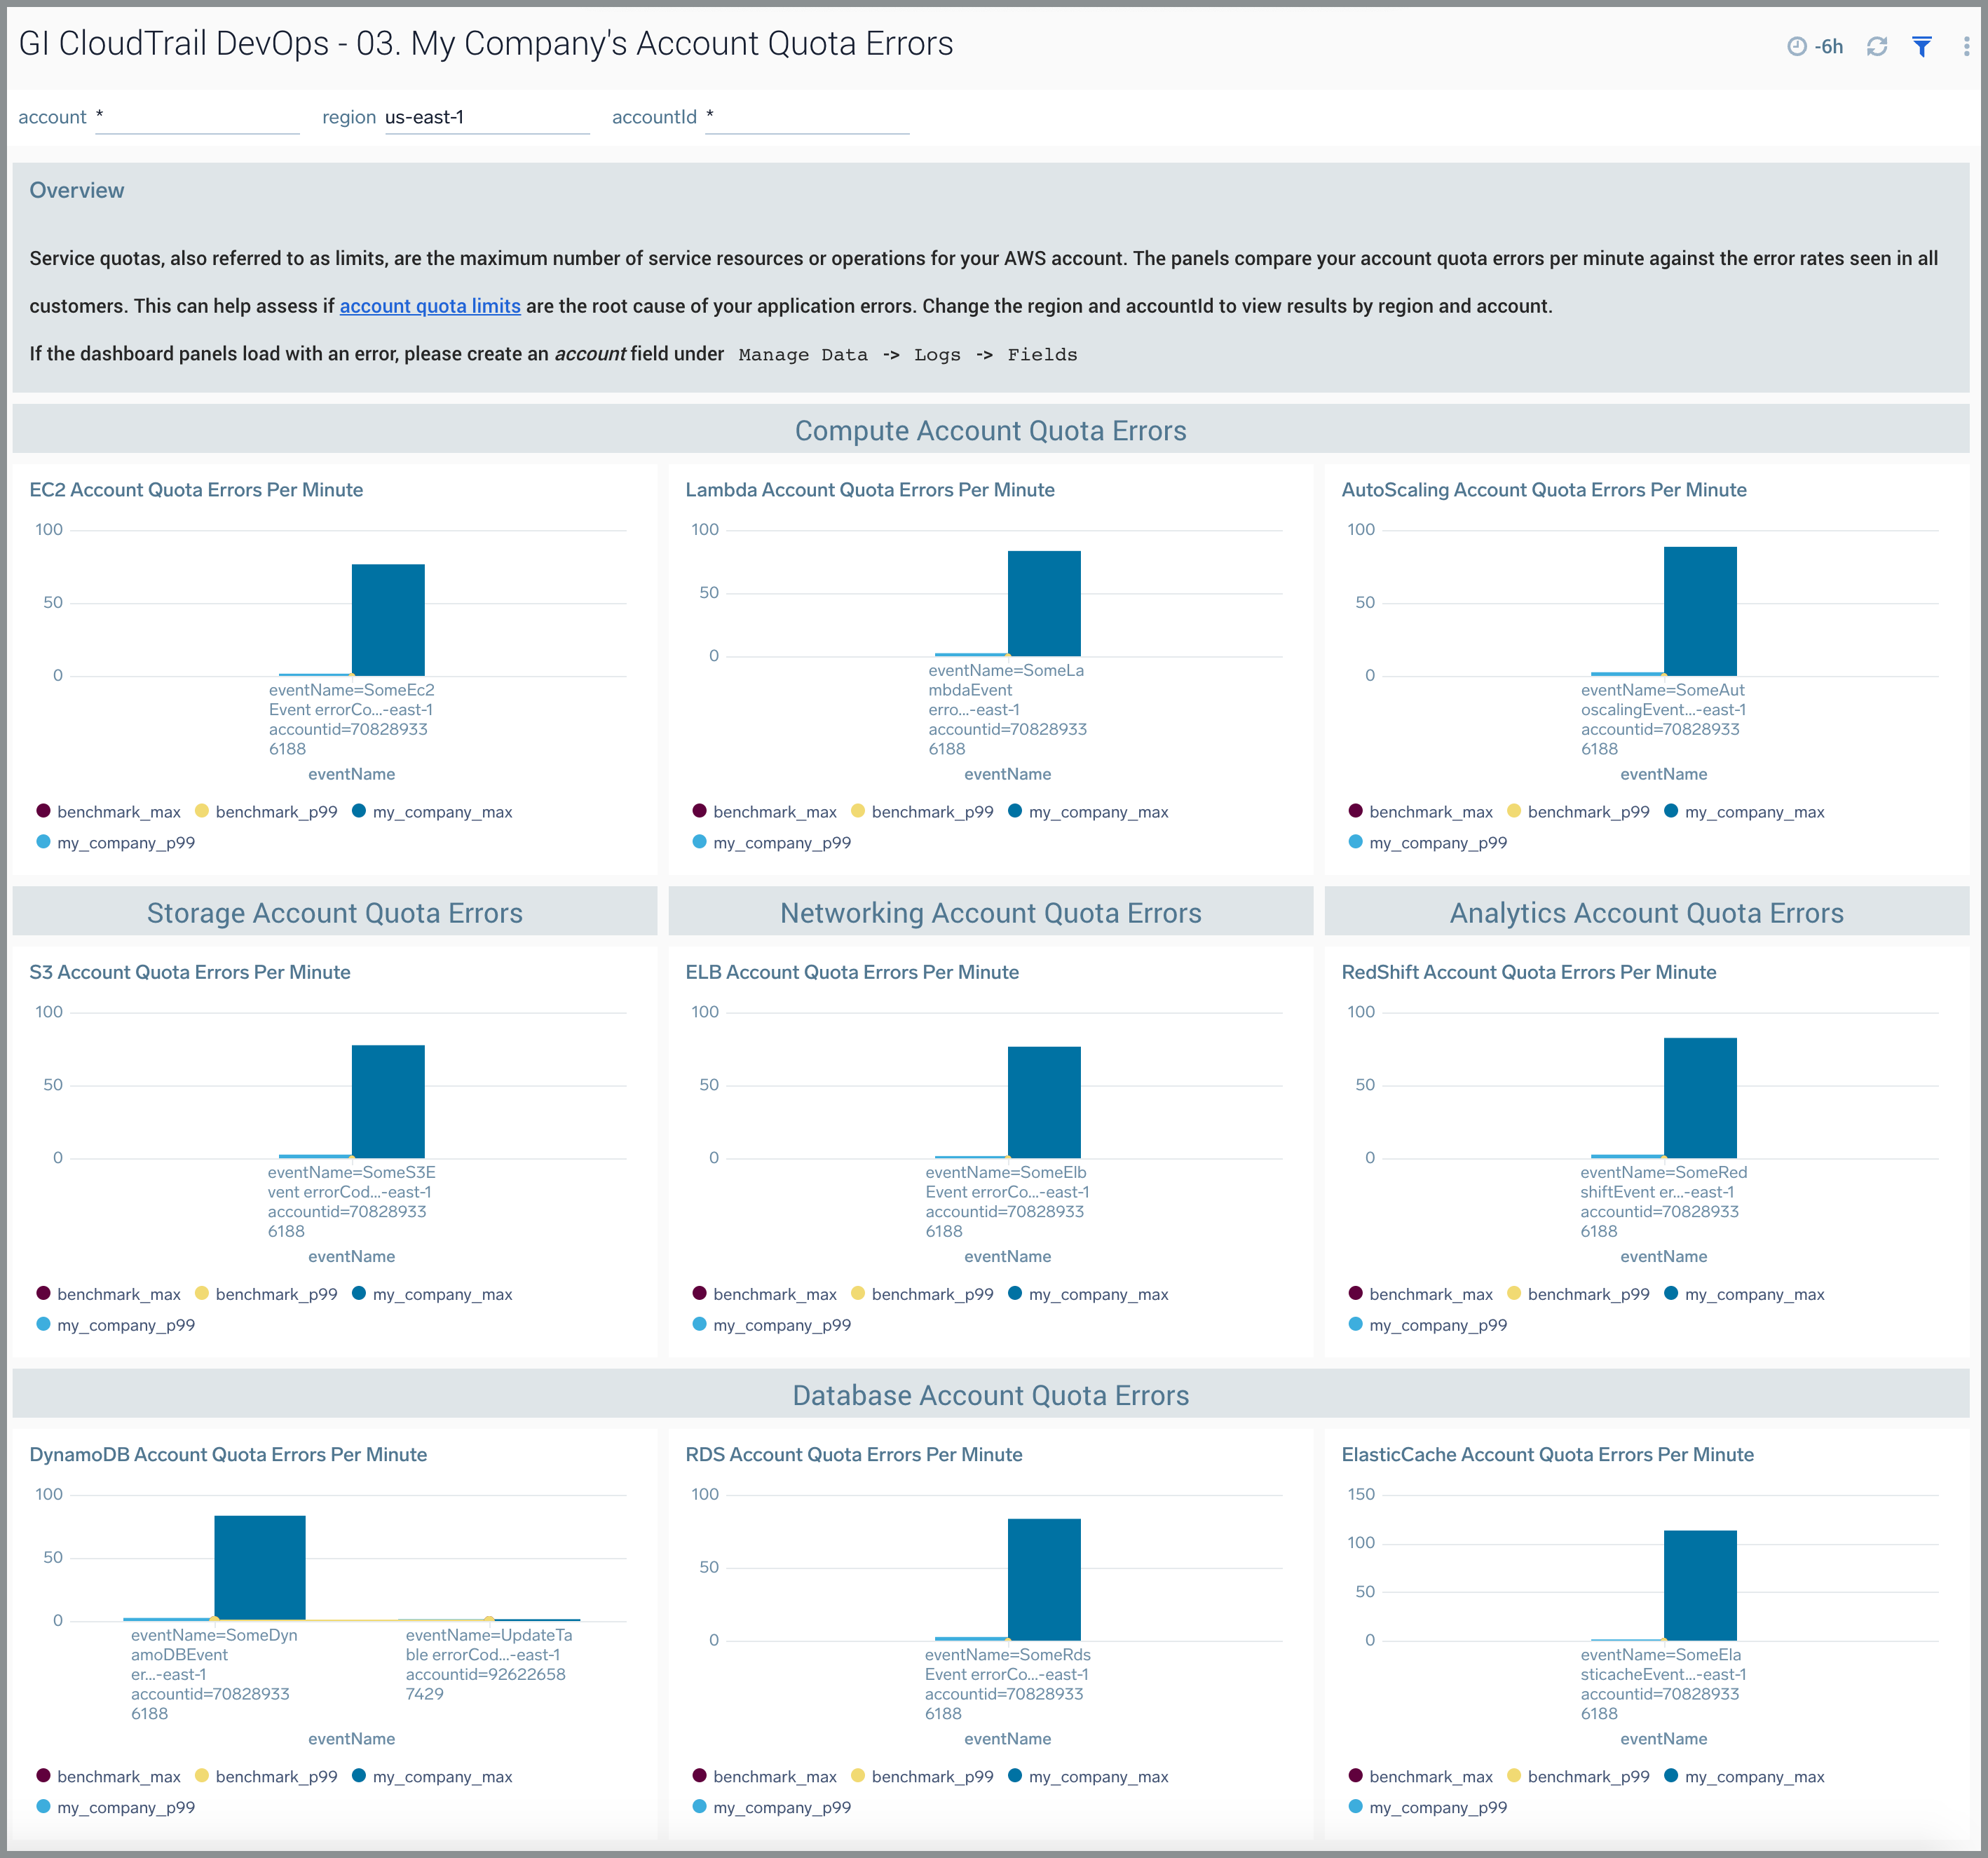
The GI CloudTrail DevOps - 03. My Company’s Account Quota Errors dashboard depicts account quota errors. Service quotas also referred to as limits, are the maximum number of service resources or operations for your AWS account. The panels compare your account quota errors per minute against the error rates seen in all customers. This can help you assess if account quota limits are the root cause of your application errors. You can select the awsRegion and recipientAccountId to view results by region and account. For more information, see AWS service documentation.
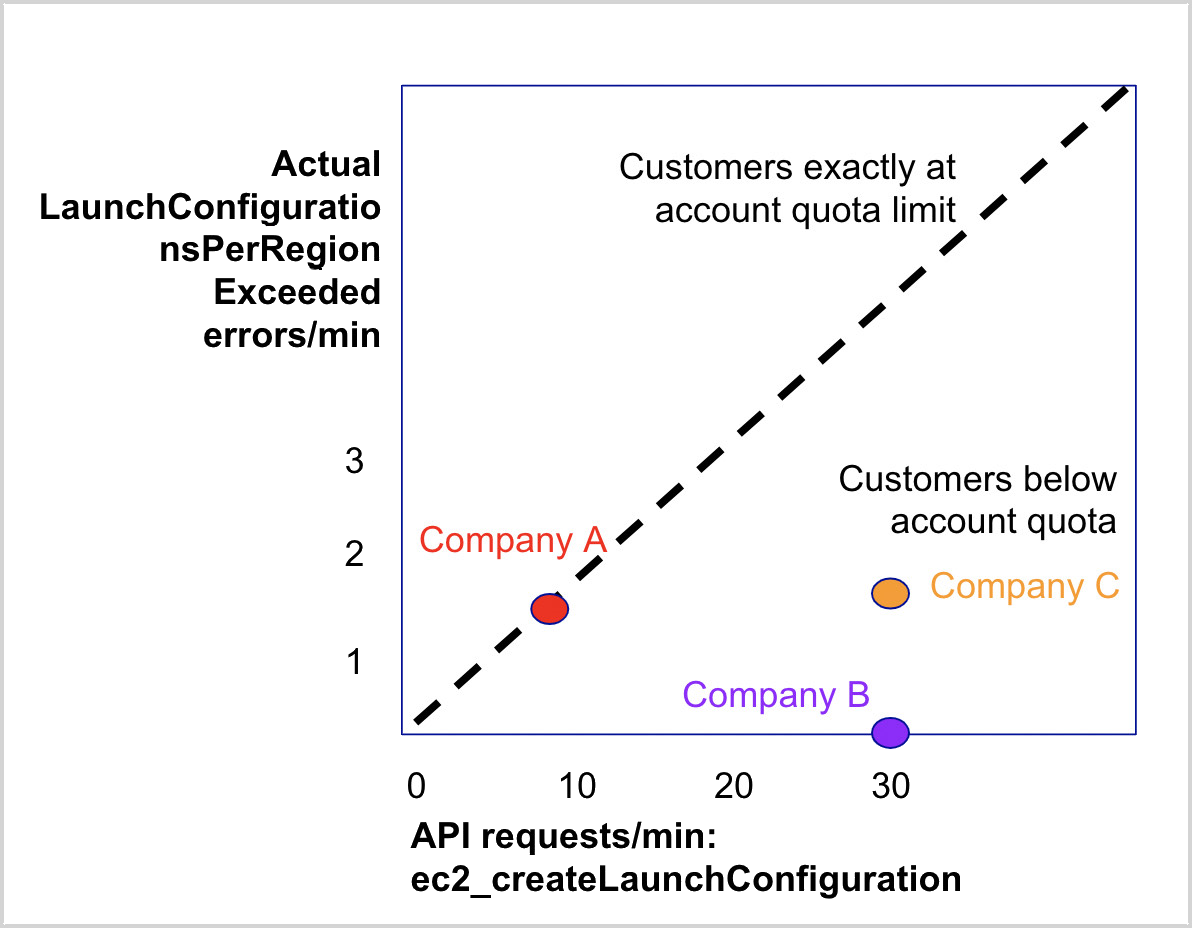
Unlike throttling errors, with few exceptions (For example, DynamoDB errors) account quota errors will persist once you experience them at a rate proportional to your API request rate. The diagram below shows three companies that experience account quota errors for EC2 createLaunchConfiguration API. AWS has a limit of 200 launch configurations per region for this EC2 API. Company A is experiencing account quota errors proportional to its API request rate. This is because they are already at their account limit for the given resource. They will continue to see these errors unless they request a quota upgrade through AWS, remove unused resources, or both.
On the other hand, Company B is experiencing zero account quota errors despite more API requests/min than Company A. This could mean one or more of the following:
- Company B is well under their account quota limits.
- Company B is monitoring their account quotas and removing unused resources to avoid breaching limits.
- Company B is monitoring their account quotas and has upgraded its limits to accommodate their higher API usage.
Company C is experiencing account quota errors but at higher levels of API requests than Company A. This could mean one or more of the following:
- Company C only recently breached its account quota limits.
- Company C has a higher account quota than Company A.
To minimize these errors, watch APIs that experience the most errors using the Account Limits API for the appropriate service - for example, https://docs.aws.amazon.com/autoscaling/ec2/APIReference/API_DescribeAccountLimits.html.
Use this dashboard to:
- Monitor account errors in your AWS environment by AWS service, API name, AWS account, and region.
- Compare account quota errors by API name, region, and account to other customers.
- Troubleshoot application errors arising from account quota limits being breached.
- Request an upgrade to account quotas through AWS Support if you experience account quota errors at a higher level than other customers.
- Re-architect your application to consume AWS services in a region with fewer account quota errors based on the benchmark.
04. My Company’s Insufficient Capacity Errors
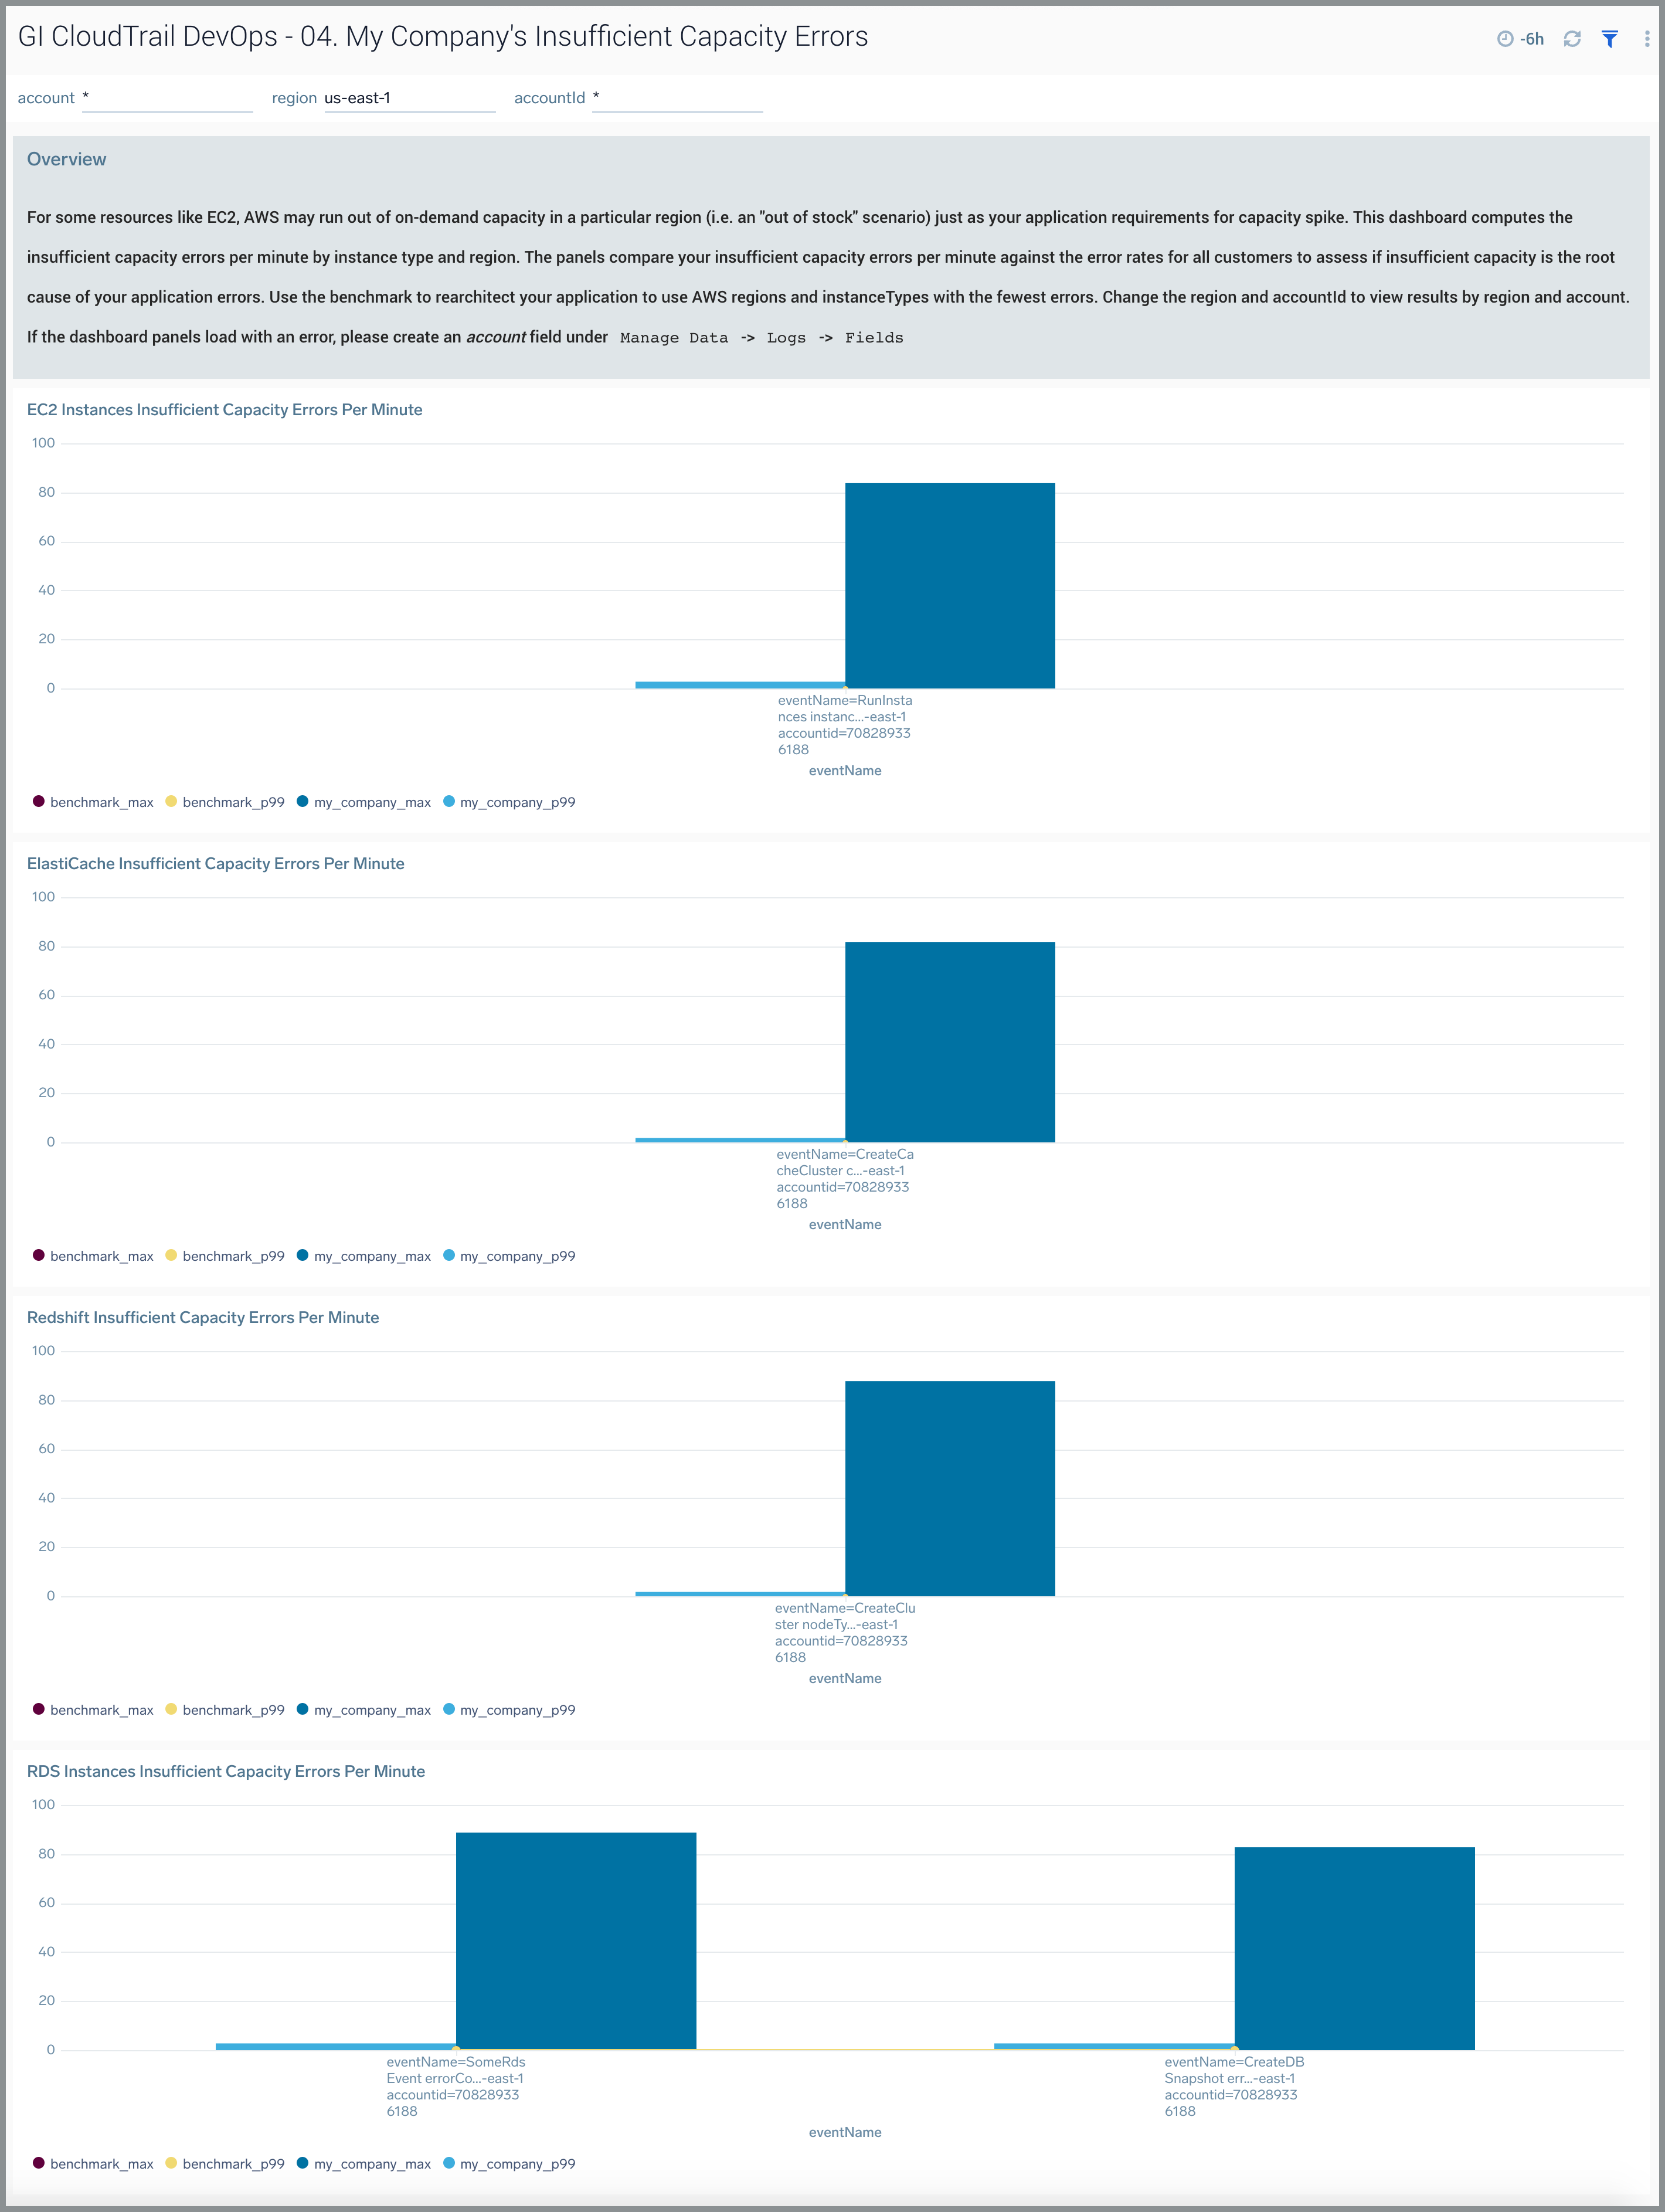
The GI CloudTrail DevOps - 04. My Company’s Insufficient Capacity Errors dashboard computes the insufficient capacity errors per minute by instance type and region. For some resources like EC2, AWS may run out of on-demand capacity in a particular region (an "out of stock" scenario) just like your application requirements for the capacity spike. The panels compare your insufficient capacity errors per minute against the error rates for all customers to help you assess if insufficient capacity is the root cause of your application errors. You can use the benchmark to re-architect your application to use AWS regions and instanceTypes with the fewest errors. You can select the awsRegion, recipientAccountId and instance type to view results by region, account, and instance type. This dashboard is supported for following AWS service:
- EC2
- ElastiCache
- RDS
- Redshift
Use this dashboard to:
- Monitor insufficient capacity errors in your AWS environment by AWS service, API name, AWS account, and region.
- Compare errors by API name, region, and account to other customers.
- Troubleshoot application errors arising from insufficient capacity errors.
- Re-architect your application to consume instance types or move to a region with fewer errors based on the benchmark.
05. Configuration Benchmarks
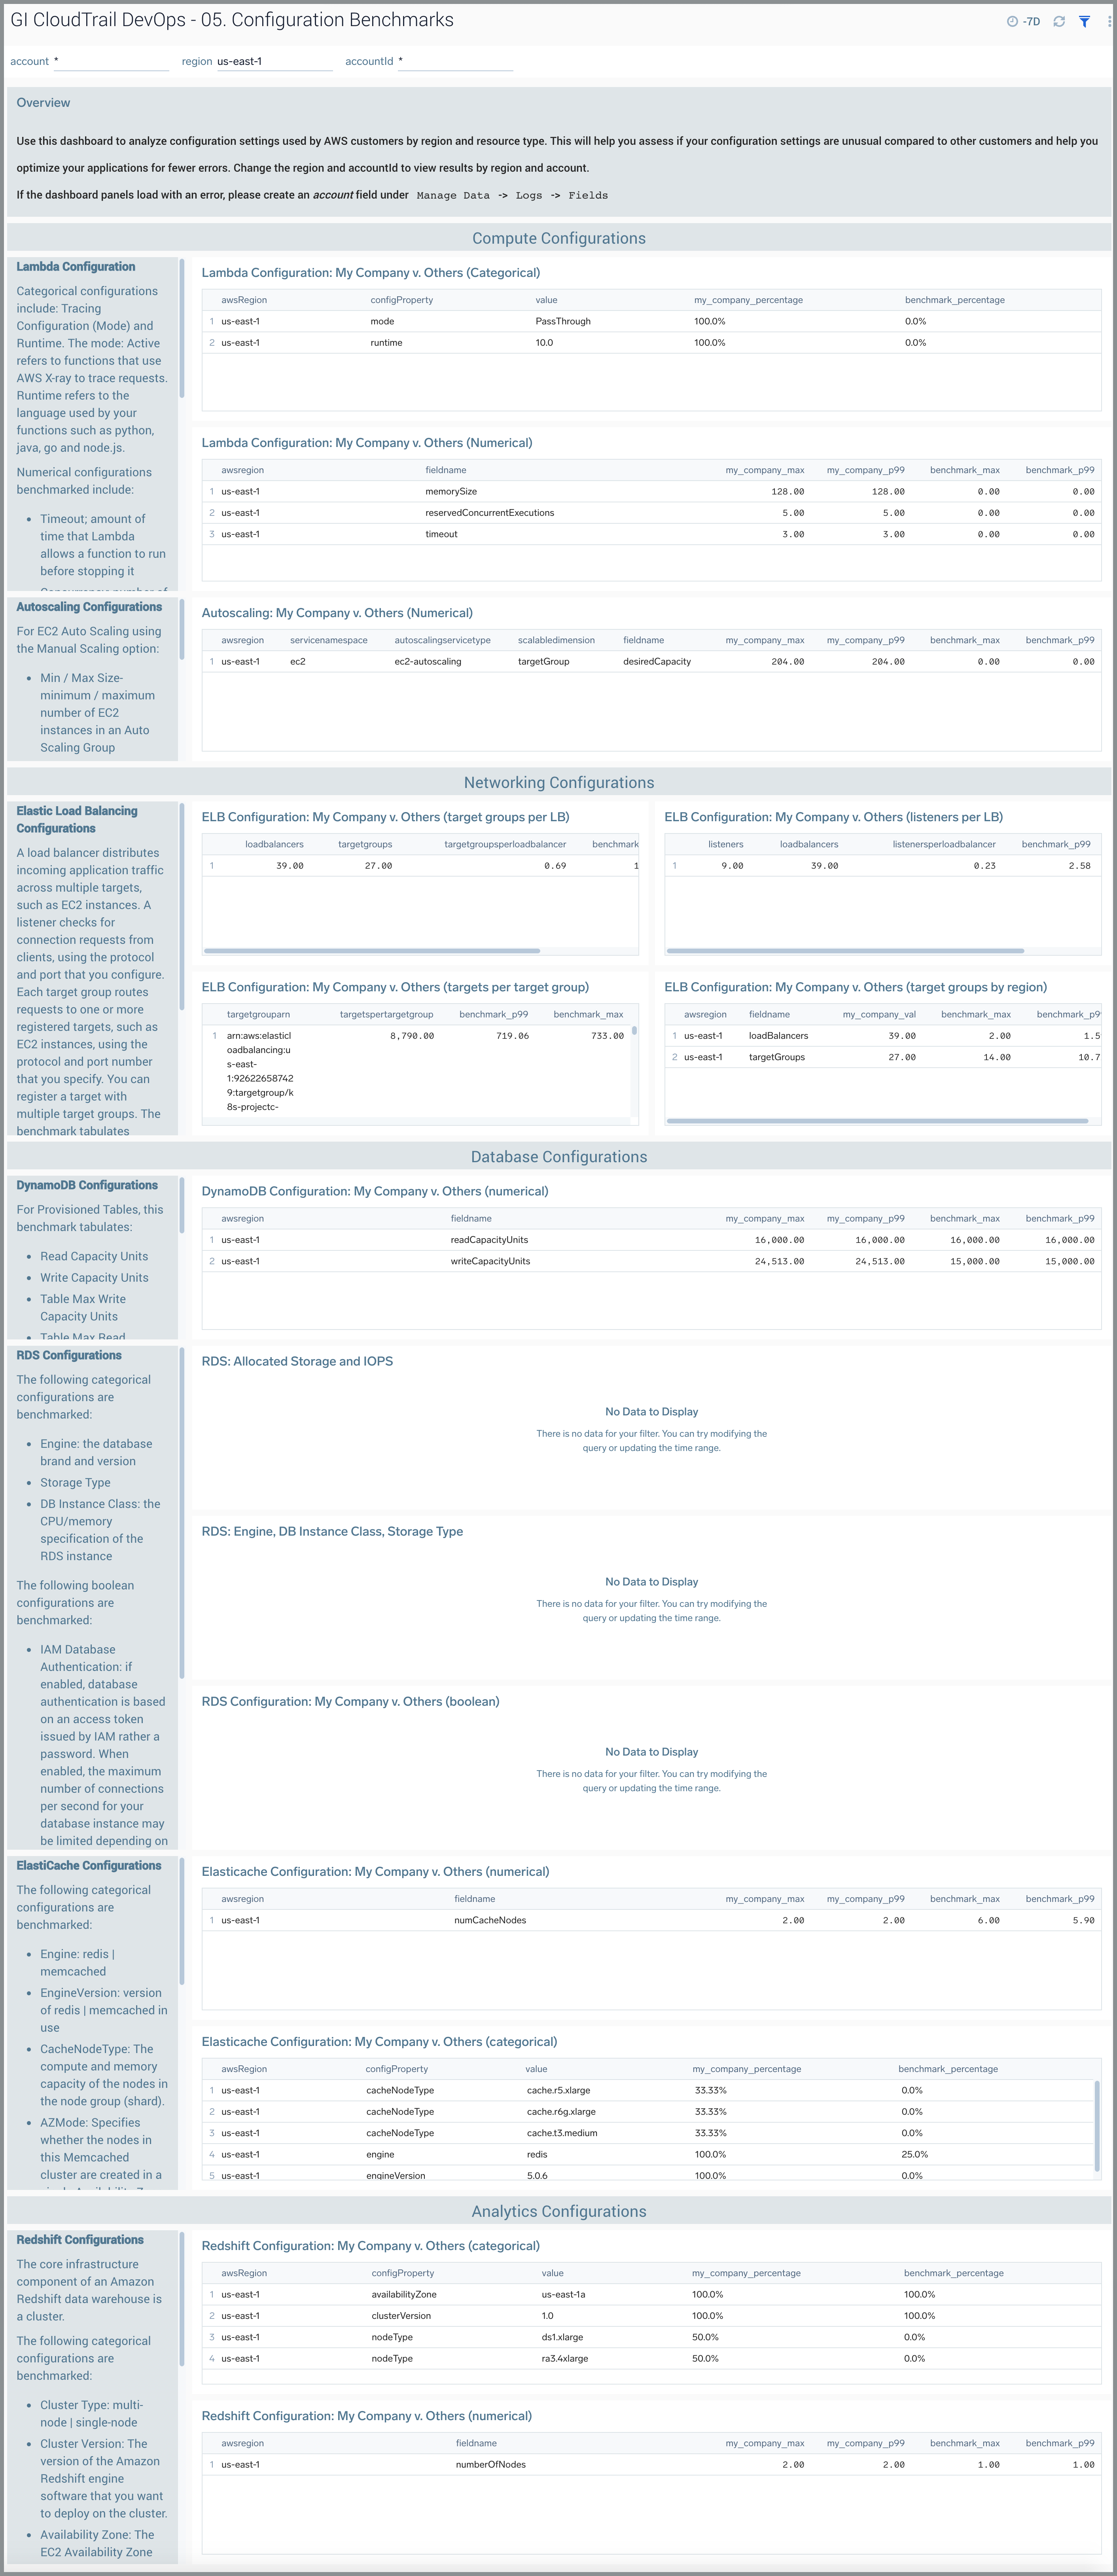
The GI CloudTrail DevOps - 05. Configuration Benchmarks dashboard provides insights for analyzing configuration settings used by AWS customers by region and resource type. This enables you to assess your configuration settings compared to that of other customers. You can select the awsRegion and recipientAccountId to view results by region. The configuration benchmarks are restricted to the following AWS services:
- AWS Lambda
- AWS Auto Scaling
- AWS Elastic Load Balancing
- Amazon RDS
- Amazon Redshift
- Amazon DynamoDB
- Amazon ElastiCache
Three types of configurations are benchmarked to help users understand the common values of each setting in the Sumo Logic population for a given AWS service:
- Categorical Configuration. Users pick a setting from a list of values, for example, database engine brand for RDS. For categorical configurations, the benchmark is the average number of resources with a given setting computed across all resources of a given service. For example, RDS engine type (for example, MySQL) is computed as the percentage of RDS instances across all customers that use MySQL in a given AWS region.
- Numerical Configuration. Users set a numerical value, for example, memory size for an AWS Lambda function. Numerical configurations are expressed as p99 and max values of the setting across all resources of a given service. For example, timeout value is represented as the p99 and max across all Lambda functions discovered by Global Intelligence.
- Boolean Configuration. Users turn a setting on or off, for example, multiAZ setting for RDS. Similar to categorical configuration, this is represented by the percentage of resources with true (or false) value for a given setting.
AWS Lambda
For AWS Lambda configuration, consult https://docs.aws.amazon.com/lambda/latest/dg/gettingstarted-features.html
Categorial configurations for AWS Lambda include:
- Mode (Tracing Configuration). Active refers to functions that use AWS X-ray to trace requests
- Runtime. The runtime refers to the language used by your functions such as python, java, go, and node.js.
Numerical configurations benchmarked include:
- Timeout. Amount of time that Lambda allows a function to run before stopping it. The default is 3 seconds. The maximum allowed value is 900 seconds.
- Concurrency. Number of requests that your function is serving at any given time
- Memory Size. The amount of memory available to the function during execution. Choose an amount between 128 MB and 3,008 MB in 64-MB increments.
- Allocated / Provisioned Concurrent Executions. To enable functions to scale without fluctuations in latency, use provisioned concurrency. For functions that take a long time to initialize, or require extremely low latency for all invocations, provisioned concurrency enables you to pre-initialize instances of your function and keep them running at all times.
- Reserved Concurrent Execution. A function with reserved concurrency only uses concurrency from its dedicated pool.
AWS Auto Scaling
AWS supports two flavors of Auto Scaling:
For EC2 Auto Scaling using the Manual Scaling option we benchmark the following:
- Min / Max Size. Minimum / maximum number of EC2 instances in the Auto Scaling Group
- Desired Capacity. The optional setting for the desired count of EC2 instances in the Auto Scaling Group
As explained in AWS documentation, for the EC2 Auto Scaling Manual Scaling option, you configure the size of your Auto Scaling group by setting the minimum, maximum, and desired capacity. The minimum and maximum capacity are required to create an Auto Scaling group, while the desired capacity is optional. If you do not define your desired capacity upfront, it defaults to your minimum capacity. By default, the minimum, maximum, and desired capacity are set to one instance when you create an Auto Scaling group from the console. If you change the desired capacity, the capacity that you specify will be the total number of instances launched right after creating your Auto Scaling group.
For Application Auto Scaling using Target Tracking Scaling Policies, we benchmark the Min and Max Capacity which refer to the minimum / maximum capacity of the scalable target based on the Scalable Dimension metric. With target tracking scaling policies, you choose a scaling metric and set a target value. Application Auto Scaling creates and manages the CloudWatch alarms that trigger the scaling policy and calculates the scaling adjustment based on the metric and the target value. The scaling policy adds or removes capacity as required to keep the metric at, or close to, the specified target value. In addition to keeping the metric close to the target value, a target tracking scaling policy also adjusts to changes in the metric due to a changing load pattern.
Elastic Load Balancer
As explained in AWS documentation, a load balancer distributes incoming application traffic across multiple targets, such as EC2 instances. This increases the availability of your application. You add one or more listeners to your load balancer. A listener checks for connection requests from clients, using the protocol and port that you configure. The rules that you define for a listener determine how the load balancer routes request to its registered targets. Each rule consists of a priority, one or more actions, and one or more conditions. When the conditions for a rule are met, then its actions are performed. You must define a default rule for each listener, and you can optionally define additional rules.
Each target group routes requests to one or more registered targets, such as EC2 instances, using the protocol and port number that you specify. You can register a target with multiple target groups. You can configure health checks on a per target group basis. Health checks are performed on all targets registered to a target group that is specified in a listener rule for your load balancer.
The benchmark tabulates statistics for:
- Listeners Per Load Balancer
- Target Groups Per Load Balancer
- Targets per Target Group
- Target Groups Per Region
DynamoDB
The benchmark tabulates the following settings for Provisioned Tables.
- Read Capacity Units
- Write Capacity Units
- Table Max Write Capacity Units
- Table Max Read Capacity Units
These are defined as follows:
- One read capacity unit = one strongly consistent read per second, or two eventually consistent reads per second, for items up to 4 KB in size.
- One write capacity unit = one write per second, for items up to 1 KB in size.
RDS
For an overview of RDS set up, see https://docs.aws.amazon.com/AmazonRDS/latest/UserGuide/CHAP_SettingUp.html
The following categorical configurations are benchmarked:
- Engine. The database brand and version
- Storage Type. See https://docs.aws.amazon.com/AmazonRDS/latest/UserGuide/CHAP_Storage.html
- DB Instance Class. The CPU/memory specification of the RDS instance. Amazon RDS supports three types of instance classes: Standard, Memory Optimized, and Burstable Performance. See https://docs.aws.amazon.com/AmazonRDS/latest/UserGuide/Concepts.DBInstanceClass.html
The following boolean configurations are benchmarked:
- IAM Database Authentication. If enabled, database authentication is based on an authentication token issued by AWS Identity and Access Management (IAM) rather than a password. When enabled, the maximum number of connections per second for your database instance may be limited depending on the instance type and your workload. IAM database authentication works with MySQL and PostgreSQL.
- multiAZ. Failover option for RDS
The following numerical configurations are benchmarked across RDS instances:
- iops
- Allocated Storage Capacity
- Max Allocated Storage
ElastiCache
The following categorical configurations are benchmarked:
- Engine. redis | memcached
- EngineVersion. version of redis | memcached in use
- CacheNodeType. The compute and memory capacity of the nodes in the node group (shard). For more information, see Choosing Your Node Size.
- AZMode. Specifies whether the nodes in this Memcached cluster are created in a single Availability Zone or created across multiple Availability Zones in the cluster's region.
The following numerical configurations are benchmarked:
- Number of CacheNodes by cluster. The initial node count in a cluster. Always 1 for Redis and between 1-20 for memcached.
- New Replica Count by cluster. For Redis (cluster mode disabled) replication groups, this is the number of read replica nodes in the replication group. For Redis (cluster mode enabled) replication groups, this is the number of read replica nodes in each of the replication group's node groups.
Redshift
The core infrastructure component of an Amazon Redshift data warehouse is a cluster.
The following categorical configurations are benchmarked:
- Cluster Type. multi-node | single-node. The type of the cluster. When cluster type is specified as:
- single-node. The NumberOfNodes parameter is not required.
- multi-node. The NumberOfNodes parameter is required.
- Cluster Version. The version of the Amazon Redshift engine software that you want to deploy on the cluster.
- Availability Zone. The EC2 Availability Zone (AZ) in which you want Amazon Redshift to provision the cluster. For example, if you have several EC2 instances running in a specific Availability Zone, then you might want the cluster to be provisioned in the same zone in order to decrease network latency.
- Node Type. The node type to be provisioned for the cluster
The following numerical configurations are benchmarked:
- Number of Nodes. The number of compute nodes in the cluster. This parameter is required when the ClusterType parameter is specified as multi-node.
- Target Number Of Nodes. The number of nodes that the cluster will have after the resize operation is complete.
Use this dashboard to:
- Understand common configurations for AWS services by categorical, numerical, and boolean values.
- Optimize your configuration based on settings common across customers.
06. Action Plan Dashboard
The GI CloudTrail DevOps - 06. Action Plan dashboard identifies users and services that contribute to AWS errors and potential instability of your applications. Change the awsRegion and recipientAccountID to view results by region and account. Only the Top 3 rows are shown based on error count.
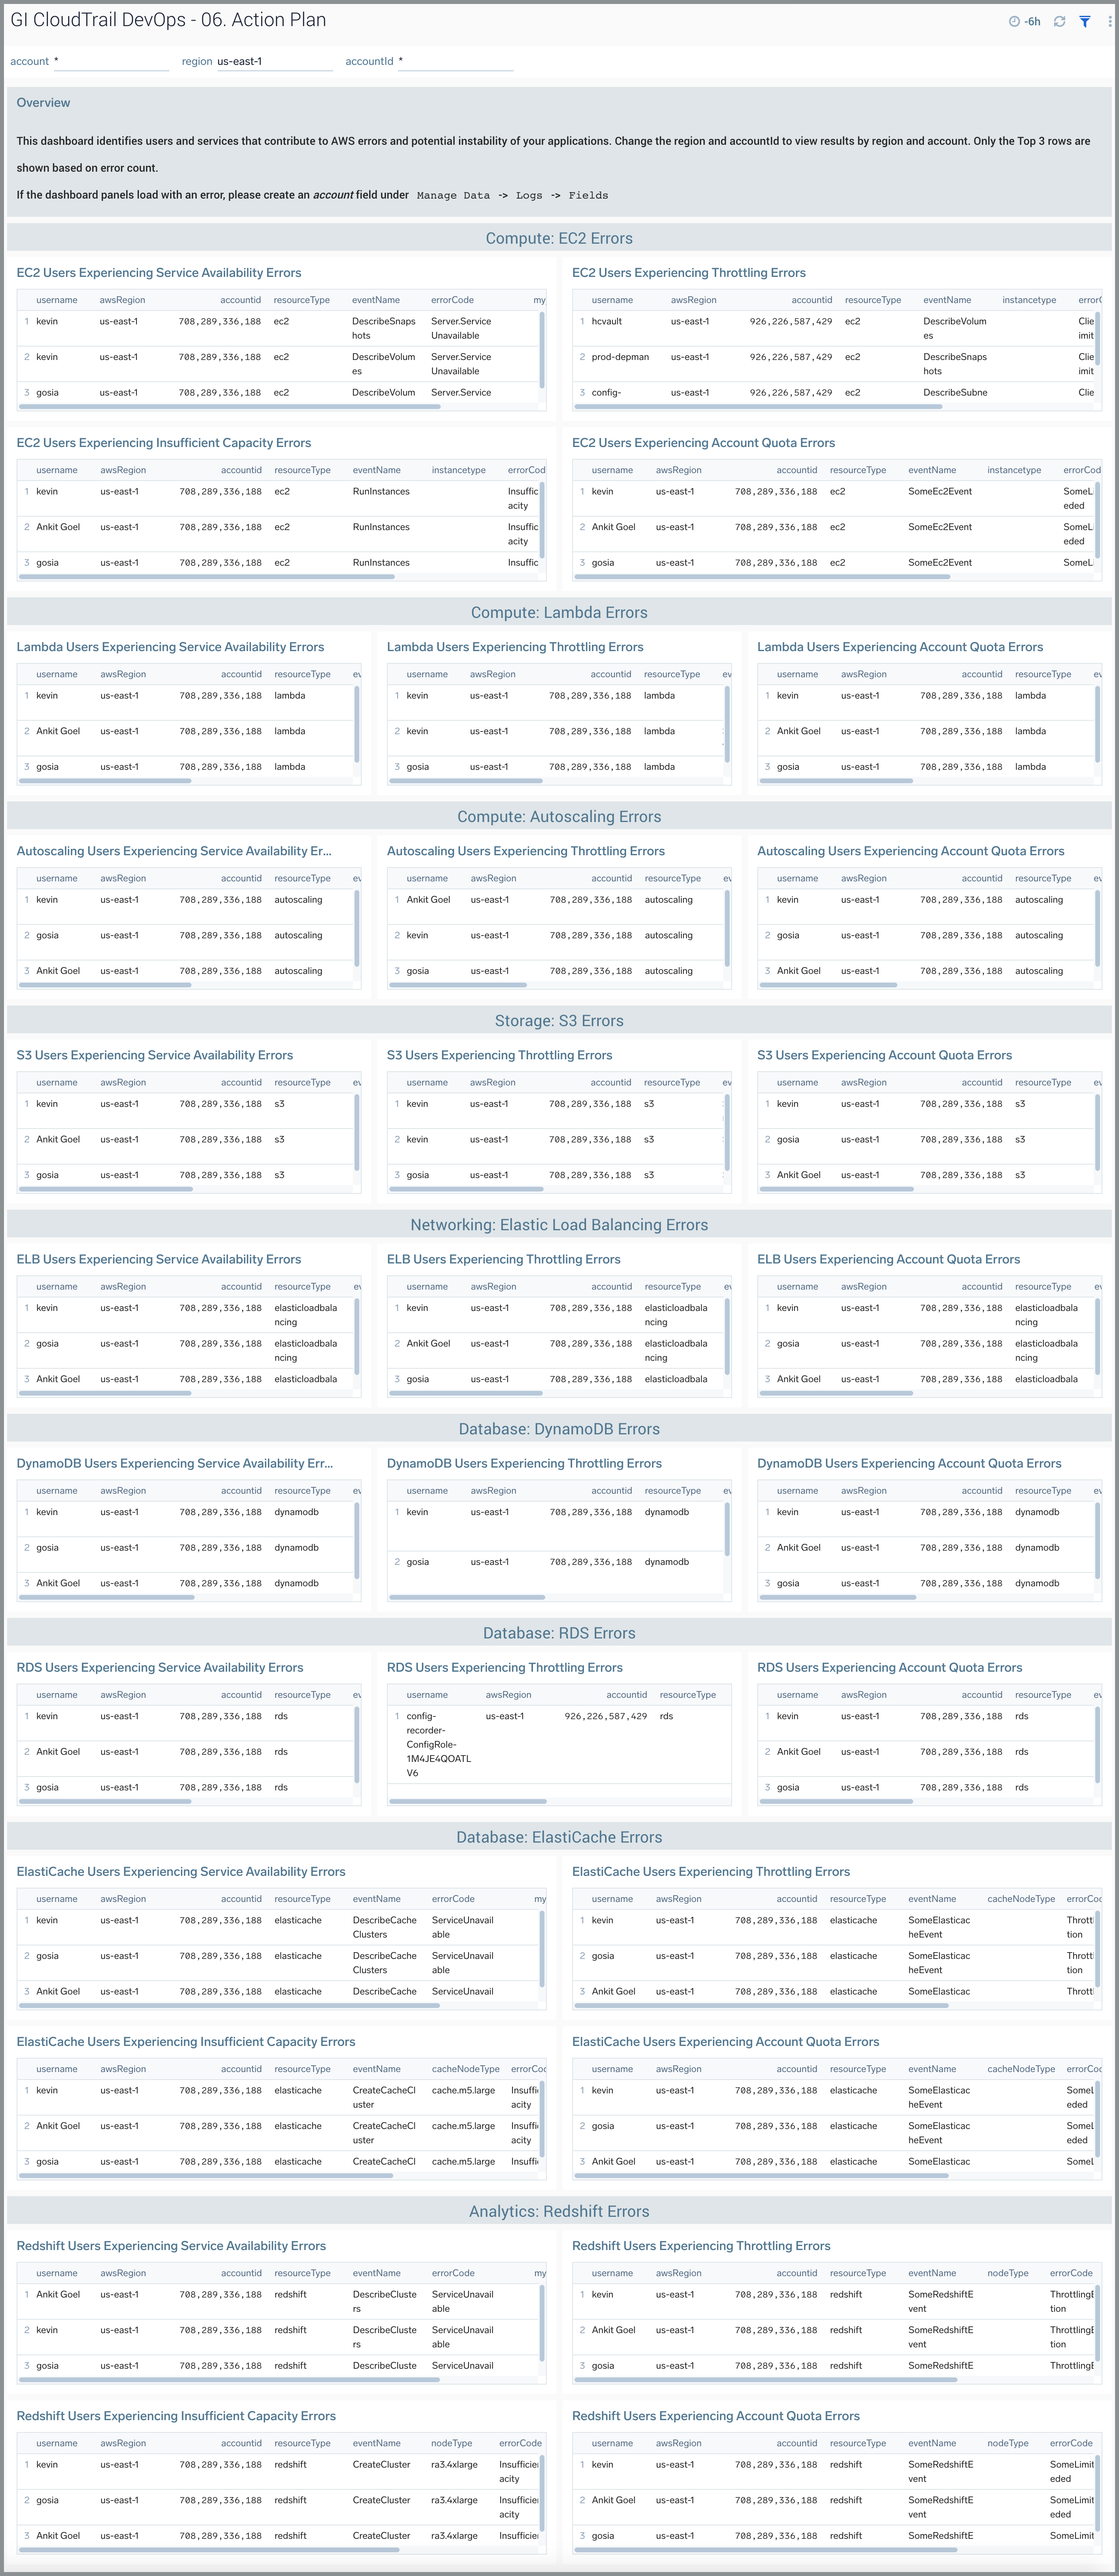
Use this dashboard to:
- Identify and remediate users or services that are experiencing errors and potentially causing incidents for your applications.