Amazon GuardDuty

Amazon GuardDuty is a continuous security monitoring service that analyzes and processes VPC Flow Logs and AWS CloudTrail event logs. The Sumo Logic App for Amazon GuardDuty provides insights into the activities in your AWS account based on the findings from Amazon GuardDuty. The App includes preconfigured dashboards that allow you to detect unexpected and potentially malicious activities in your AWS account by providing details on threats by severity, VPC, IP, account ID, region, and resource type.
Log types
The Sumo Logic App for GuardDuty requires the Amazon GuardDuty findings to be sent through the Amazon CloudWatch Events. For more details on GuardDuty findings, see here.
Sample log messages
Click to expand
{
   "schemaVersion":"2.0",
   "accountId":"012345678910",
   "region":"us-east-1",
   "partition":"aws",
   "id":"38af75470eced5f1c6e4ee9895961baa",
   "arn":"arn:aws:guardduty:us-east-1:012345678910:detector/aaaf7420746be13be119afd94e417684/finding/38af75470eced5f1c6e4ee9895961baa",
   "type":"Recon:EC2/PortProbeUnprotectedPort",
   "resource":{
      "resourceType":"Instance",
      "instanceDetails":{
         "imageId":"ami-06db9a11",
         "instanceId":"i-0d6c314027f74dc82",
         "instanceType":"m4.xlarge",
         "launchTime":1481719450000,
         "platform":null,
         "productCodes":[

         ],
         "iamInstanceProfile":{
            "arn":"arn:aws:iam::012345678910:instance-profile/nodes.k8s.travellogic.info",
            "id":"AIPAJQDPNZCGEVVUZ4FEW"
         },
         "networkInterfaces":[
            {
               "ipv6Addresses":[

               ],
               "privateDnsName":"ip-172-20-45-123.ec2.internal",
               "privateIpAddress":"172.20.45.123",
               "privateIpAddresses":[
                  {
                     "privateDnsName":"ip-172-20-45-123.ec2.internal",
                     "privateIpAddress":"172.20.45.123"
                  }
               ],
               "subnetId":"subnet-1637825f",
               "vpcId":"vpc-c9c4f0ae",
               "securityGroups":[
                  {
                     "groupName":"nodes.k8s.travellogic.info",
                     "groupId":"sg-67e3bb1d"
                  }
               ],
               "publicDnsName":"ec2-54-89-171-133.compute-1.amazonaws.com",
               "publicIp":"54.89.171.133"
            }
         ],
         "tags":[
            {
               "key":"KubernetesCluster",
               "value":"k8s.travellogic.info"
            },
            {
               "key":"Name",
               "value":"nodes.k8s.travellogic.info"
            },
            {
               "key":"k8s.io/role/node",
               "value":"1"
            },
            {
               "key":"aws:autoscaling:groupName",
               "value":"nodes.k8s.travellogic.info"
            }
         ],
         "instanceState":"running",
         "availabilityZone":"us-east-1a"
      }
   },
   "service":{
      "serviceName":"guardduty",
      "detectorId":"aaaf7420746be13be119afd94e417684",
      "action":{
         "actionType":"NETWORK_CONNECTION",
         "networkConnectionAction":{
            "connectionDirection":"INBOUND",
            "remoteIpDetails":{
               "ipAddressV4":"180.70.170.34",
               "organization":{
                  "asn":9318,
                  "asnOrg":"SK Broadband Co Ltd",
                  "isp":"SK Broadband",
                  "org":"SK Broadband"
               },
               "country":{
                  "countryCode":"KR",
                  "countryName":"South Korea"
               },
               "city":{
                  "cityName":"Uijeongbu-si"
               },
               "geoLocation":{
                  "lat":37.7415,
                  "lon":127.0474
               }
            },
            "remotePortDetails":{
               "port":59740,
               "portName":"Unknown"
            },
            "localPortDetails":{
               "port":22,
               "portName":"SSH"
            },
            "protocol":"TCP",
            "blocked":false
         }
      },
      "resourceRole":"TARGET",
      "additionalInfo":{
         "additionalPorts":[
            22
         ]
      },
      "eventFirstSeen":"2017-11-01T21:31:05.542+0000",
      "eventLastSeen":"2017-11-01T21:31:05.542+0000",
      "archived":false,
      "count":743
   },
   "severity":2,
   "createdAt":"2017-11-01T21:31:05.542+0000",
   "updatedAt":"2017-11-01T21:31:05.542+0000",
   "title":"Unprotected port in EC2 Instance i-0d6c314027f74dc82 is being probed.",
   "description":"EC2 Instance i-0d6c314027f74dc82 has an unprotected port 22 which is being probed by a known malicious host with IP address 180.70.170.34."
}
Sample queries
Click to expand
_sourceCategory=aws/guardduty
| json field=_raw "accountId", "region", "partition", "id", "arn", "type","service.serviceName","service.detectorId","service.action","severity","title","description" nodrop
| json field=_raw "resource.resourceType" as resourceType nodrop
| json field=%service.action "networkConnectionAction.remoteIpDetails.ipAddressV4" as ip nodrop
| json field=%service.action "networkConnectionAction.localPortDetails.port" as localPort nodrop
| parse "\"vpcId\": \"*\"" as vpcId, "\"subnetId\": \"*\"" as subnetId,"\"groupId\": \"*\"" as securityGroupId,"\"tags\": [*]" as tags,"\"groupName\": \"*\"" as securityGroupName nodrop
| json field=_raw "resource.instanceDetails.instanceId" as instanceid nodrop
| if(severity=2, "Low", if(severity=5, "Medium", if(severity=8, "High",severity))) as severity
| if(!isNull(instanceid),concat ("https://",region,".console.aws.amazon.com/ec2/v2/home?region=",region,"#Instances:search=",instanceid),"") as link
| json field=%service.action "networkConnectionAction.remoteIpDetails.geoLocation.lon" as longitude nodrop
| json field=%service.action "networkConnectionAction.remoteIpDetails.geoLocation.lat" as latitude nodrop
| json field=%service.action "networkConnectionAction.remoteIpDetails.organization.asnOrg" as asnOrg nodrop
| json field=%service.action "networkConnectionAction.remoteIpDetails.organization.org" as organization nodrop
| json field=%service.action "networkConnectionAction.remoteIpDetails.organization.isp" as isp nodrop
| count as count by title, accountId, resourceType, organization, isp, ip, link
| sort count
Collecting logs for the Amazon GuardDuty App
This section has instructions for collecting logs for the Amazon GuardDuty App.
- Amazon GuardDuty sends notifications based on CloudWatch events when new findings, or new occurrences of existing findings, are generated.
- A CloudWatch events rule enables CloudWatch to send events for the GuardDuty findings to the Sumo CloudWatchEventFunction Lambda function.
- The Lambda function sends the events to an HTTP source on a Sumo hosted collector.
This configuration is defined in a AWS Serverless Application Model (SAM) specification published in the AWS Serverless Application Repository. You do not need to manually create the necessary AWS resources. You simply deploy the configuration, as described in Step 2 below.
Step 1: Configure an HTTP source
- In Sumo Logic, configure a Hosted Collector.
- In Sumo Logic, configure an HTTP Source. When you configure the source:
- Select Forward to SIEM if you have Cloud SIEM installed and you want to forward log data to Cloud SIEM. If you select Forward to SIEM, also click the +Add link and add a field whose name is
_parserwith value /Parsers/System/AWS/GuardDuty. - In the Advanced Options for Logs section of the page:
- Specify Format as
yyyy-MM-dd'T'HH:mm:ss.SSS'Z' - Specify Timestamp locator as
.*"updatedAt":"(.*)".*
- Specify Format as
- Select Forward to SIEM if you have Cloud SIEM installed and you want to forward log data to Cloud SIEM. If you select Forward to SIEM, also click the +Add link and add a field whose name is
When you configure the HTTP Source, make a note of the HTTP Source Address URL. You will need it in the next step.
Step 2: Deploy Sumo GuardDuty events processor
In this step, you deploy the events processor. This will create the AWS resources described in Collection overview.
- Go to https://serverlessrepo.aws.amazon.com/applications.
- Search for “sumologic-guardduty-events-processor”.
- When the page for the Sumo app appears, click Deploy.
- In Configure application parameters panel, paste the URL for the HTTP source you created above.
- Click Deploy.
Configure optional environment variables
- Go to the AWS Lambda console.
- Search for the
"aws-serverless-repository-CloudWatchEventFunction-<_suffix_>"function and click it. - Scroll down to the Environment variables section. You can set any of the following optional variables:
ENCODING(optional). Encoding to use when decoding CloudWatch log events. Default is utf-8.SOURCE_CATEGORY_OVERRIDE(optional). Override_sourceCategoryvalue configured for the HTTP source.SOURCE_HOST_OVERRIDE(optional). Override_sourceHostvalue configuredforthe HTTP source.SOURCE_NAME_OVERRIDE(optional). Override_sourceNamevalue configured for the HTTP source.
Installing the Amazon GuardDuty App
Now that you have set up collection for Amazon GuardDuty, install the Sumo Logic App to use the pre-configured searches and dashboards that provide visibility into your environment for real-time analysis of overall usage.
To install the app, do the following:
Next-Gen App: To install or update the app, you must be an account administrator or a user with Manage Apps, Manage Monitors, Manage Fields, Manage Metric Rules, and Manage Collectors capabilities depending upon the different content types part of the app.
- Select App Catalog.
- In the 🔎 Search Apps field, run a search for your desired app, then select it.
- Click Install App.
note
Sometimes this button says Add Integration.
- Click Next in the Setup Data section.
- In the Configure section of your respective app, complete the following fields.
- Field Name. If you already have collectors and sources set up, select the configured metadata field name (eg _sourcecategory) or specify other custom metadata (eg: _collector) along with its metadata Field Value.
- Click Next. You will be redirected to the Preview & Done section.
Post-installation
Once your app is installed, it will appear in your Installed Apps folder, and dashboard panels will start to fill automatically.
Each panel slowly fills with data matching the time range query received since the panel was created. Results will not immediately be available but will be updated with full graphs and charts over time.
Viewing Amazon GuardDuty dashboards
All dashboards have a set of filters that you can apply to the entire dashboard. Use these filters to drill down and examine the data to a granular level.
- You can change the time range for a dashboard or panel by selecting a predefined interval from a drop-down list, choosing a recently used time range, or specifying custom dates and times. Learn more.
- You can use template variables to drill down and examine the data on a granular level. For more information, see Filtering Dashboards with Template Variables.
- Most Next-Gen apps allow you to provide the scope at the installation time and are comprised of a key (
_sourceCategoryby default) and a default value for this key. Based on your input, the app dashboards will be parameterized with a dashboard variable, allowing you to change the dataset queried by all panels. This eliminates the need to create multiple copies of the same dashboard with different queries.
Overview
See the overview of GuardDuty threats including the severity, threat purpose, resource type, threat name, account ID, and region.
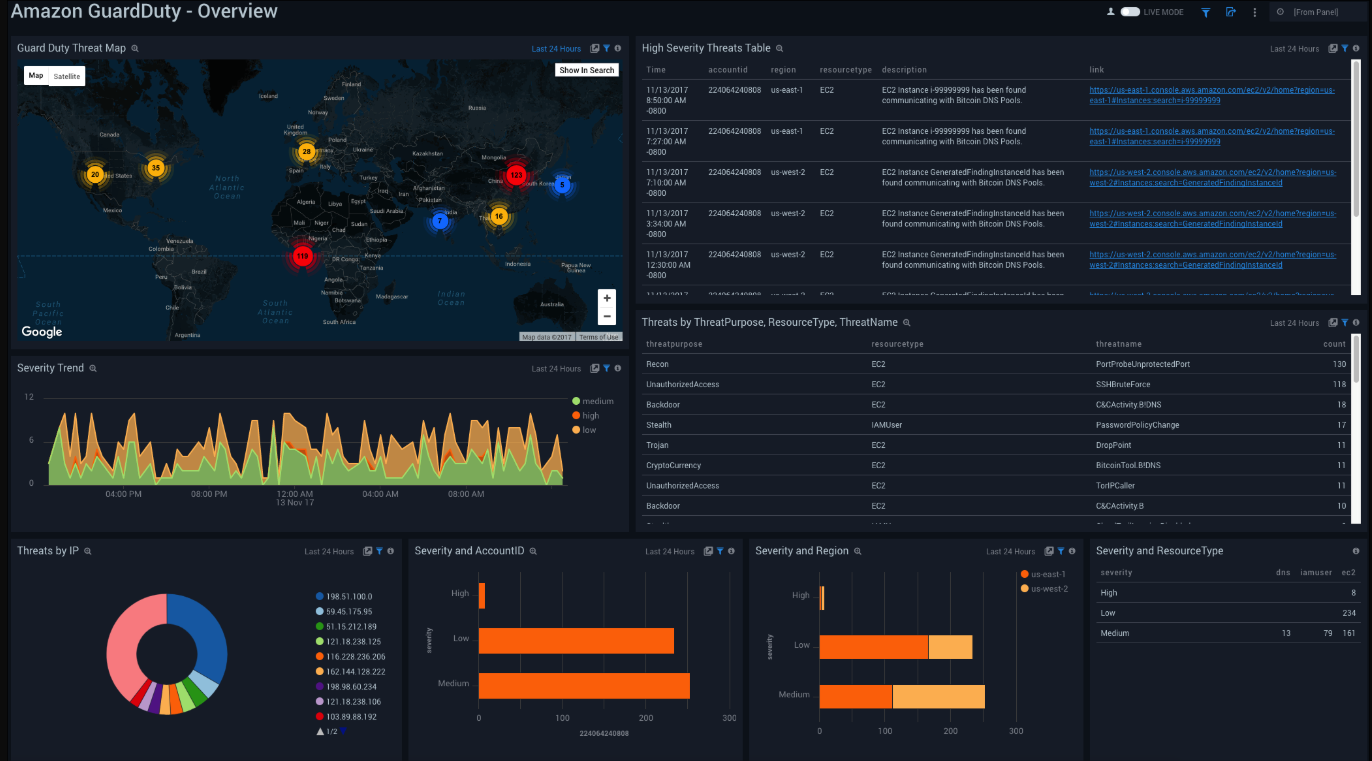
GuardDuty Threat Map. See the count of threats on a world map in the last 24 hours.
High Severity Threats Table. See the details of high severity threats in the last 24 hours including the time, account ID, region, resource type, description, and link, displayed in a table.
Severity Trend. See the trend of the various severity levels in the last 24 hours on an area chart.
Threats by ThreatPurpose, ResourceType, ThreatName. See the details of threats in the last 24 hours including the threat purpose, resource type, threat name, and count displayed in a table.
Threats by IP. See the count of threats by IP addresses in the last 24 hours on a pie chart.
Severity and AccountID. See the count of severity levels in the last 24 hours by Account ID on a bar chart.
Severity and Region. See the count of severity levels in the last 24 hours by region on a bar chart.
Severity and ResourceType. See the count of severity levels in the last 24 hours by resource type on a bar chart.
CloudTrail Details
See the details of GuardDuty CloudTrail threats including the count, title, the trend, and action type.
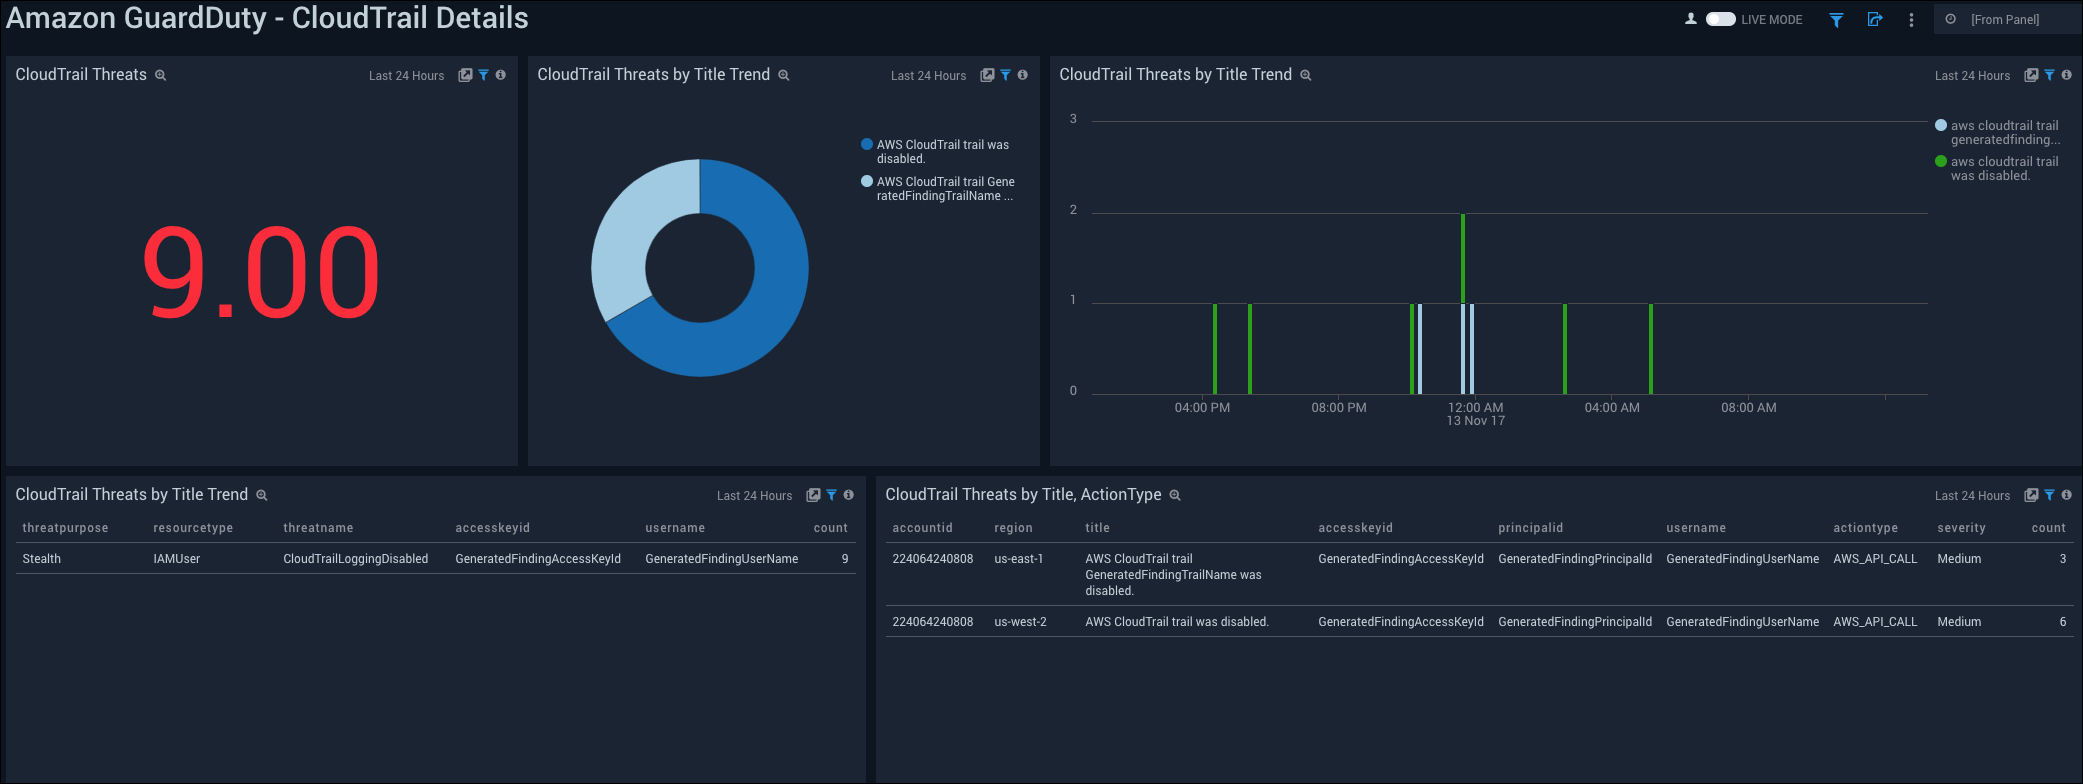
CloudTrail Threats. See the count of CloudTrail threats in the last 24 hours.
CloudTrail Threats by Title Trend. See the count of CloudTrail threats by title in the last 24 hours on a pie chart.
CloudTrail Threats by Title Trend. See the trend of CloudTrail threats by title in the last 24 hours on a column chart.
CloudTrail Threats by Title Trend. See the details of CloudTrail threats by title in the last 24 hours including the threat purpose, resource type, threat name, accesskey ID, username, and count, displayed in a table.
CloudTrail Threats by Title, ActionType. See the details of CloudTrail threats in the last 24 hours including the account ID, region, title, accesskey ID, principal ID, action type, severity, and count, displayed in a table.
Details
See the GuardDuty threat details including the count, account-region trend, threat purpose, severity, resource type, and security group.
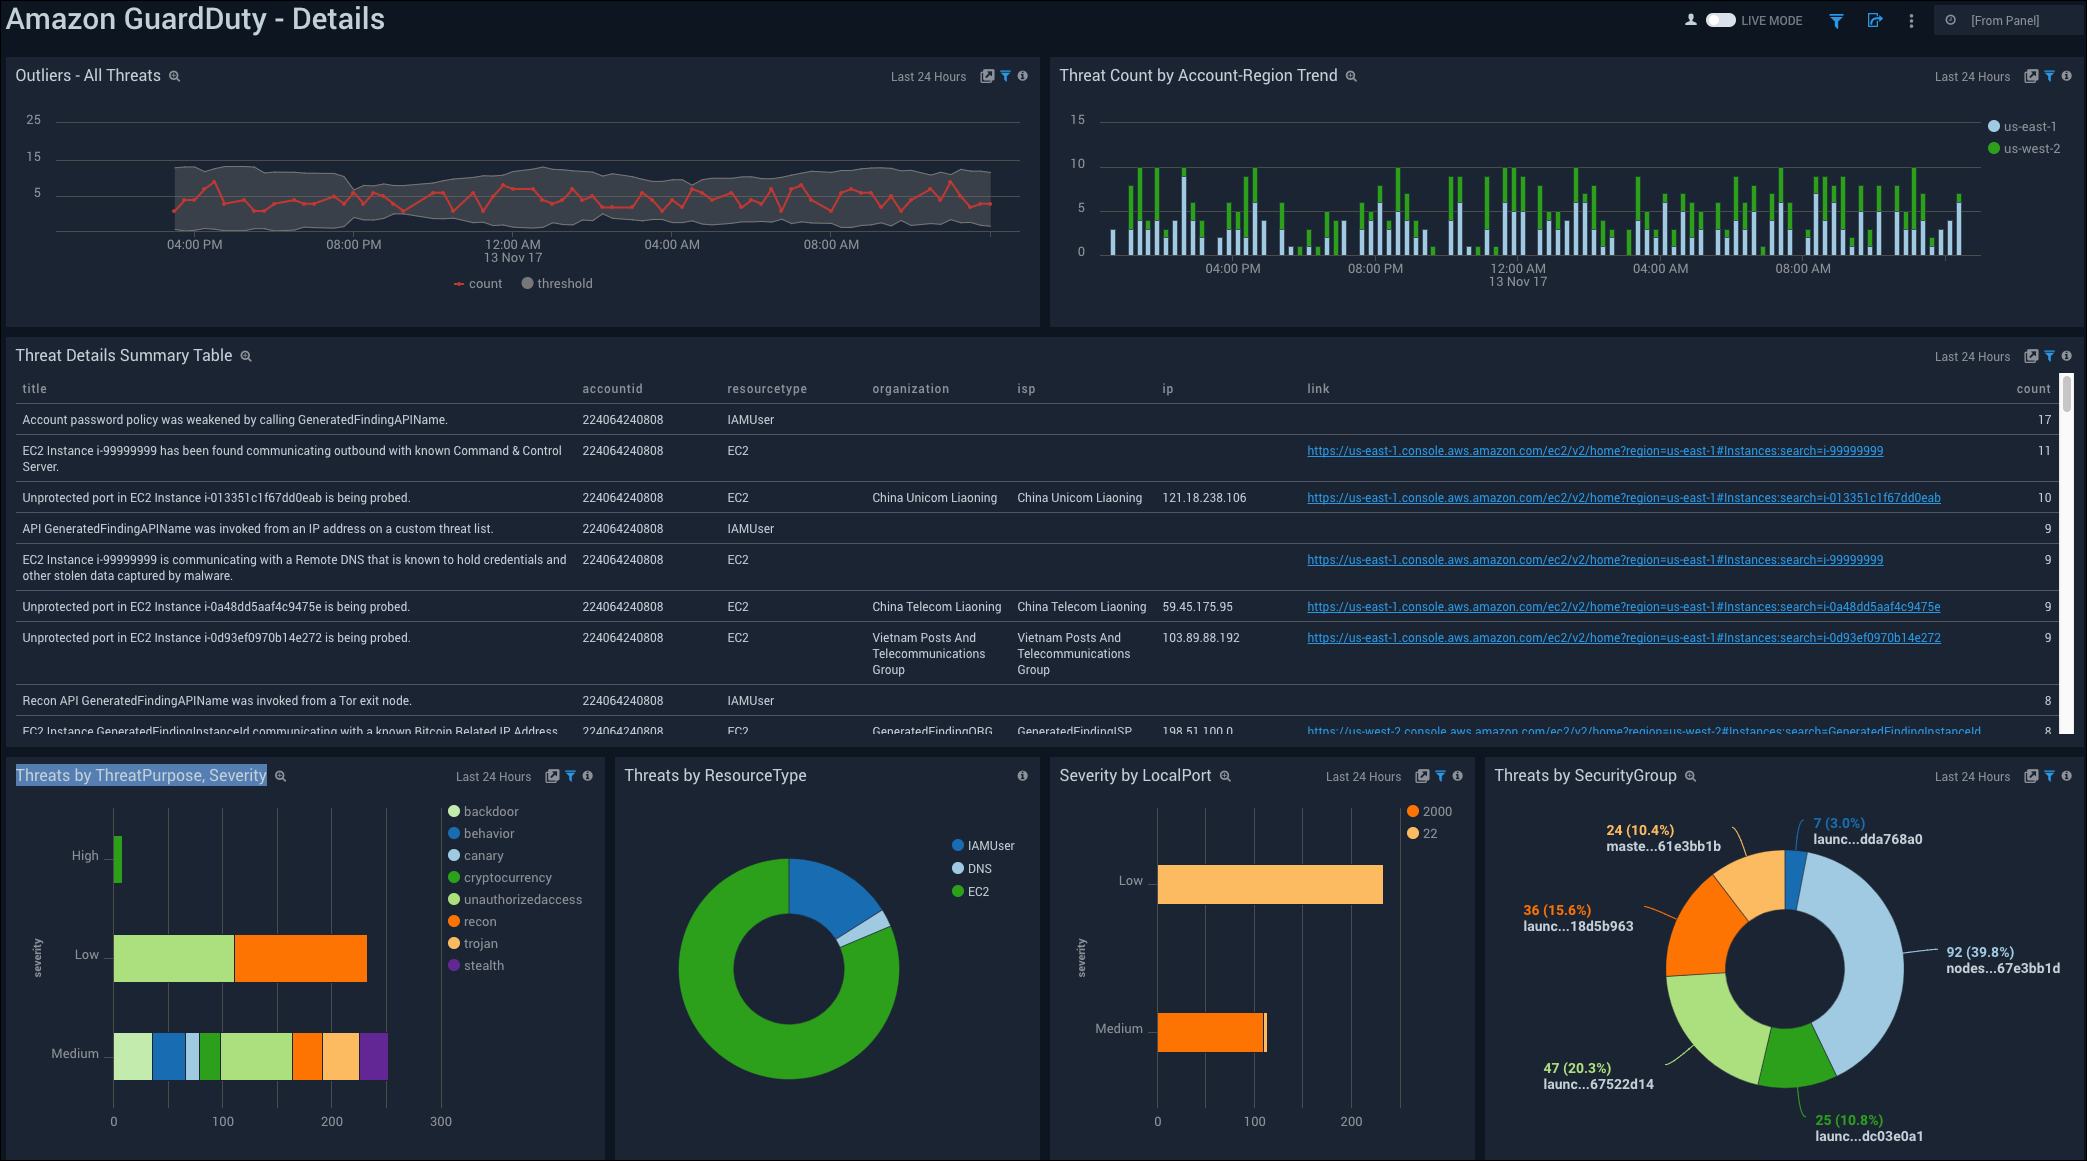
Outliers - All Threats. See the outliers in all threats in the last 24 hours on a line chart.
Threat Count by Account-Region Trend. See the trend of the count of threats by account-region in the last 24 hours on a column chart.
Threat Details Summary Table. See the details of threats in the last 24 hours including the title, account ID, resourcetype, organization, ISP, IP, link, and count, displayed in a table.
Threats by ThreatPurpose, Severity. See the count of threats in the last 24 hours by the severity and purpose on a bar chart.
Threats by ResourceType. See the count and percentage of threats in the last 24 hours by resource type on a pie chart.
Severity by LocalPort. See the count of severity by local port in the last 24 hours on a bar chart.
Threats by SecurityGroup. See the count and percentage of threats in the last 24 hours by security group on a pie chart.
VPCs, Subnets, Security Group Details
See the details of GuardDuty threats by VPC, security group, and subnet ID.
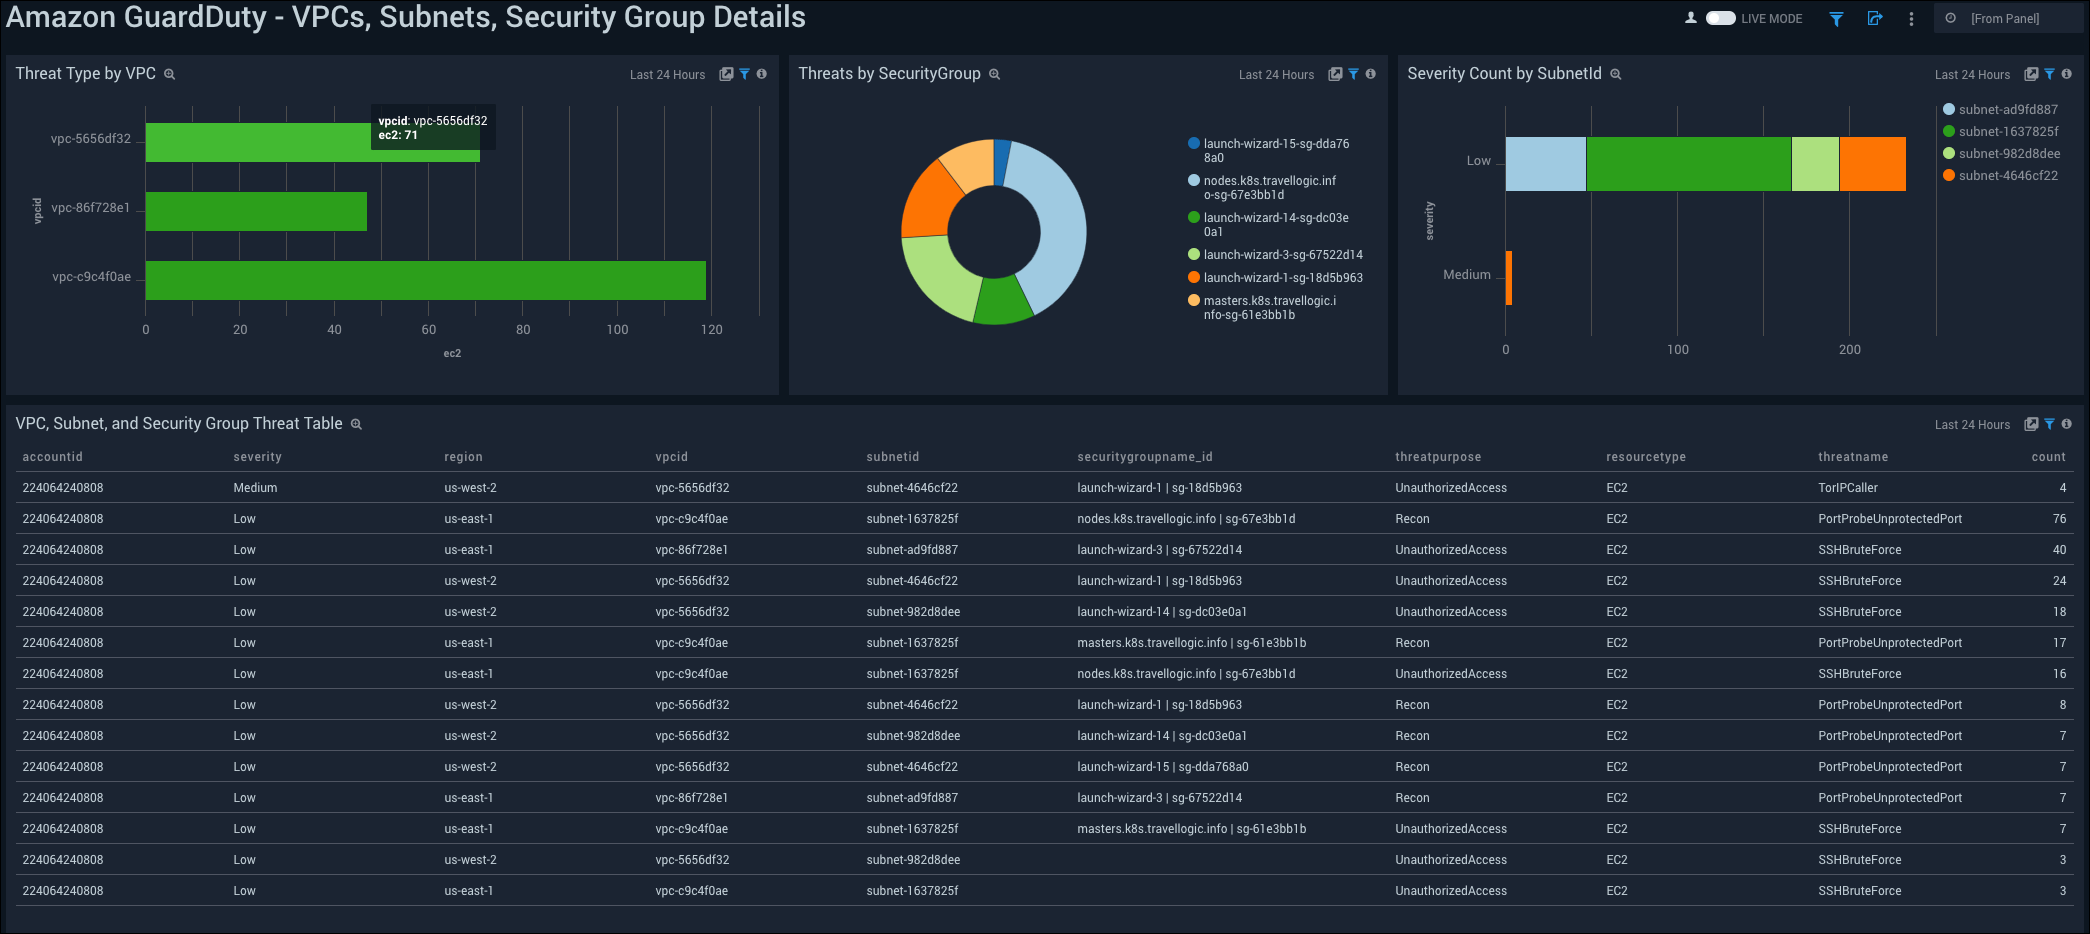
Threat Type by VPC. See the count of threat type by VPC in the last 24 hours displayed on a bar chart.
Threats by SecurityGroup. See the count of threats by security group in the last 24 hours displayed on a pie chart.
Severity Count by SubnetID. See the count of severity in the last 24 hours by Subnet ID on a bar chart.
VPC, Subnet, and Security Group Threat Table. See the details of severity in the last 24 hours including the account ID, severity, region, VPC ID, Subnet ID, security group name and ID, threat purpose, resource type, threat name, and count, displayed in a table.