AWS Lambda

AWS Lambda allows you to run code without the burden of provisioning or managing servers. The AWS Lambda App is a unified logs and metrics app for monitoring operations and performance trends in the Lambda functions in your account.
The Sumo Logic AWS Lambda App uses the Lambda logs via CloudWatch, CloudWatch Metrics, and the CloudTrail Lambda Data Events to visualize the operational and performance trends in all the Lambda functions in your account. The preconfigured dashboards provide insights into executions, memory, and duration (including cold start) usage by function versions or aliases, errors, billed duration, function callers, IAM users, and threat details.
Log and Metric Types
This section describes the data sources for the AWS Lambda app and how the app leverages these data sources to provide insight into AWS Lambda.
The AWS Lambda app uses the following logs and metrics:
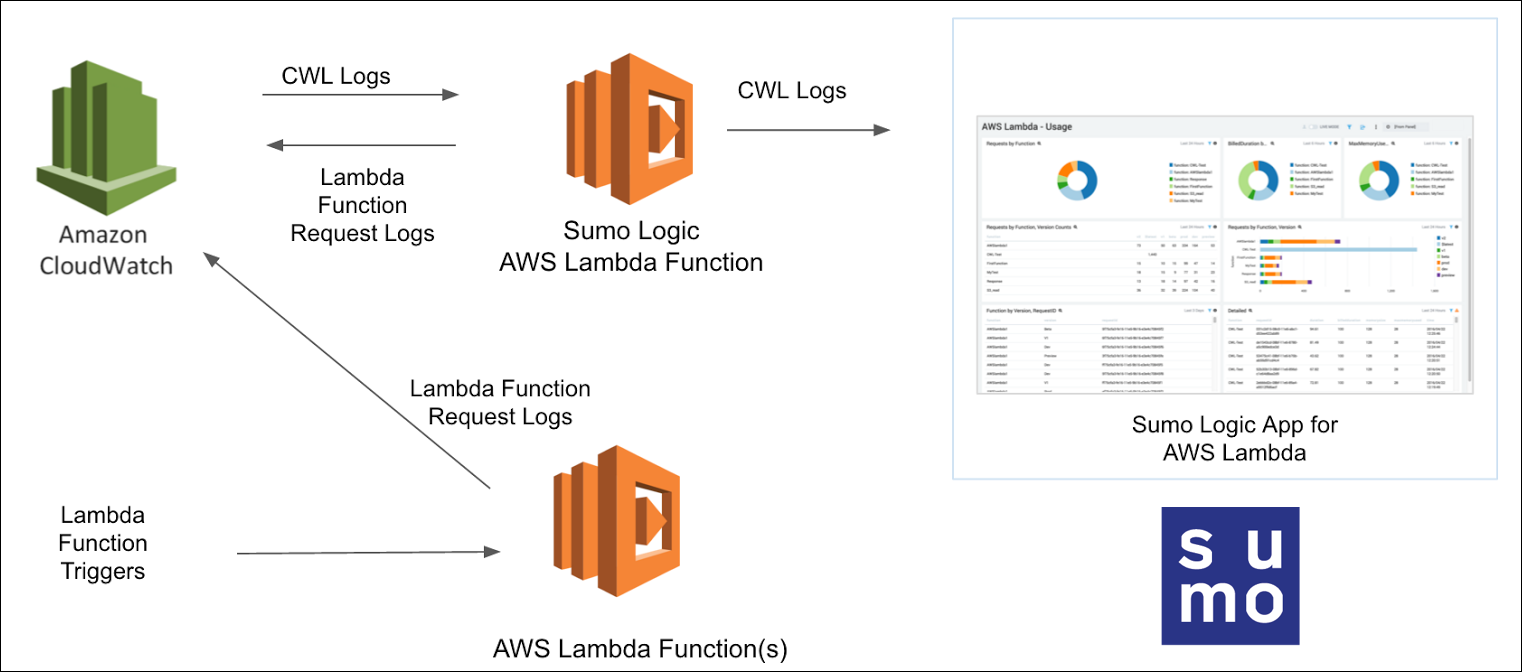
AWS CloudWatch Logs
AWS Lambda monitors Lambda functions and reports metrics through Amazon CloudWatch. Lambda then logs all requests handled by your function and stores logs through AWS CloudWatch Logs.
The Sumo Logic AWS Lambda App uses the Lambda logs via CloudWatch, CloudWatch Metrics, and the CloudTrail Lambda Data Events to visualize the operational and performance trends in all the Lambda functions in your account. The preconfigured dashboards provide insights into executions, memory, and duration (including cold start) usage by function versions or aliases, errors, billed duration, function callers, IAM users, and threat details.
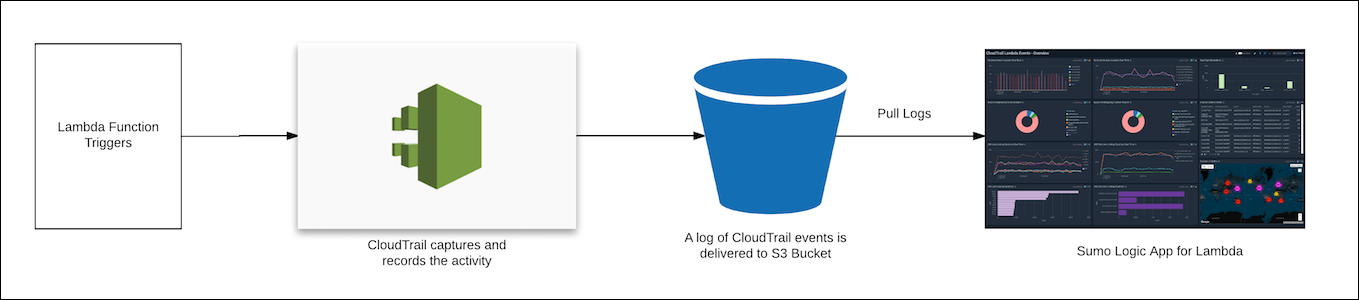
CloudTrail Lambda Data Events
CloudTrail Lambda Data Events allow you to continuously monitor the execution activity of your Lambda functions and to record details on when and by whom an Invoke API call was made.
The Sumo Logic App for AWS Lambda provide insights into the Lambda Functions invocation by Function name, version, AWS service, and threat details, by using the CloudTrail Lambda Data Events that capture and record the activities in your Lambda functions.
AWS Lambda CloudWatch Metrics
AWS Lambda automatically monitors functions on your behalf, reporting AWS Lambda metrics through Amazon CloudWatch. These metrics are collected by our Hosted Collector by configuring the Amazon CloudWatch source.
The Sumo Logic App for AWS Lambda provide insights into the Lambda Functions invocations, IteratorAge for stream-based invocations, Errors, Dead Letter Errors, Concurrent Executions, Unreserved Concurrent Executions, Duration, Throttles by Function and Time based Comparison.
Sample log messages
This section provides sample Amazon CloudWatch Logs and CloudTrail Lambda Data Events log messages.
{
	"id":"32563142671071560797760688825700039436306340248688066573",
	"timestamp":1511808906799,
	"message":"REPORT RequestId: cf75cfa3-fe16-11e5-9b16-e3e4c70845f2    Duration: 50.23 ms    Billed Duration: 100 ms     Memory Size: 128 MB    Max Memory Used: 24 MB ",
	"requestID":null,
	"logStream":"2017/11/27/[Prod]1108153ced144f8cbb161aef096218d1",
	"logGroup":"/aws/lambda/AWSlambda1"
}
{
   "eventVersion":"1.06",
   "userIdentity":{
      "type":"IAMUser",
      "principalId":"AIDAJ45Q7YFFAREXAMPLE",
      "arn":"arn:aws:iam::111111111111:user/duc",
      "accountId":"111111111111",
      "accessKeyId":"AKIAIOSFODNN7EXAMPLE",
      "userName":"duc"
   },
   "eventTime":"2017-11-27T19:05:20.524Z",
   "eventSource":"lambda.amazonaws.com",
   "eventName":"Invoke",
   "awsRegion":"us-west-1",
   "sourceIPAddress":"155.14.186.236",
   "userAgent":"aws-cli/1.11.129 Python/2.7.8 botocore/1.5.92",
   "requestParameters":{
      "invocationType":"RequestResponse",
      "functionName":"arn:aws:lambda:us-west-1:111111111111:function:function237",
      "clientContext":"ew0KICAiB99udGV6lGtleSIgOiAiY29udGV4dHZhbEXAMPLE=="
   },
   "responseElements":null,
   "additionalEventData":{
      "functionVersion":"arn:aws:lambda:us-west-1:111111111111:function:function238:$LATEST"
   },
   "requestID":"e38fb262-8f45-11e7-9845-e5f2f205b110",
   "eventID":"277a6881-66f4-4f3e-ade5-ba76255b7d93",
   "readOnly":false,
   "resources":[
      {
         "accountId":"111111111111",
         "type":"AWS::Lambda::Function",
         "ARN":"arn:aws:lambda:us-west-1:111111111111:function:function239"
      }
   ],
   "eventType":"AwsApiCall",
   "managementEvent":false,
   "recipientAccountId":"111111111111"
}
Sample queries
account={{account}} region={{region}} Namespace={{namespace}}
| json "message" nodrop | if (_raw matches "{*", message, _raw) as message
// | json "logStream", "logGroup" nodrop
| _sourceName as logStream | _sourceHost as logGroup
| parse regex field=message "REPORT\s+RequestId:\s+(?<RequestId>[^\s]+)\s+Duration:\s+(?<Duration>[^\s]+)\s+ms\s+Billed Duration:\s+(?<BilledDuration>[^\s]+)\s+ms\s+Memory\s+Size:\s+(?<MemorySize>[^\s]+)\s+MB\s+Max\s+Memory\s+Used:\s+(?<MaxMemoryUsed>[^\s]+)\s+MB"
| parse field=logstream "*/[*]*" as logstreamDate,version,logstreamID
| parse field=loggroup "/aws/lambda/*" as functionname
| where tolowercase(functionname) matches tolowercase("{{functionname}}")
| count by functionname, version
| transpose row functionname column version
"lambda.amazonaws.com" "\"eventName\":\"Invoke\"" "\"type\":\"AWSService\"" account={{account}} Namespace={{namespace}} region={{region}}
| json "eventName", "eventSource", "awsRegion", "userAgent", "sourceIPAddress", "recipientAccountId", "userIdentity", "requestParameters", "additionalEventData" as event_name, event_source, Region, user_agent, src_ip, accountId, userIdentity, requestParameters, additionalEventData nodrop
| json field=userIdentity "type", "userName", "invokedBy", "arn" as caller_type, user_name, invoked_by, arn nodrop | json field=requestParameters "functionName", "resource" as functionname, resource nodrop | json field=additionalEventData "functionVersion" as func_version nodrop
| where event_name = "Invoke" and caller_type = "AWSService"
| parse regex field=functionname "\w+:\w+:\S+:[\w-]+:\S+:\S+:(?<functionname>[\S]+)$" nodrop
| parse field=resource "arn:aws:lambda:*:function:*" as f1, functionname2 nodrop
| if (isEmpty(functionname), functionname2, functionname) as functionname
| where tolowercase(functionname) matches tolowercase("{{functionname}}")
| parse regex field=func_version "\w+:\w+:\S+:[\w-]+:\S+:\S+:(?<function_version>[\S]+:[\S ]+)$" nodrop
| parse field=arn "arn:aws:*::*:*" as f1, f2, assumedroleuser nodrop
| if (isNull(user_name), invoked_by, user_name) as caller
| if (isNull(invoked_by), user_name, invoked_by) as caller
| if (isNull(caller), assumedroleuser, caller) as caller
| count as Invocations by caller
| top 10 caller by Invocations
namespace=aws/lambda metric=Errors statistic=Sum account=* region=* functionname=* Resource=* | sum
Collecting logs for the AWS Lambda App
This section provides instructions for setting up log and metric collection.
Collect Amazon CloudWatch Logs
Sumo supports several methods for collecting Lambda logs from Amazon CloudWatch. You can choose any of them to collect logs.
- AWS Kinesis Firehose for Logs. Configure an AWS Kinesis Firehose for Logs (Recommended).
- Lambda Log Forwarder. Configure a collection of Amazon CloudWatch Logs using our AWS Lambda function using a Sumo Logic provided CloudFormation template, as described in Amazon CloudWatch Logs or configure collection without using CloudFormation, see Collect Amazon CloudWatch Logs using a Lambda Function.
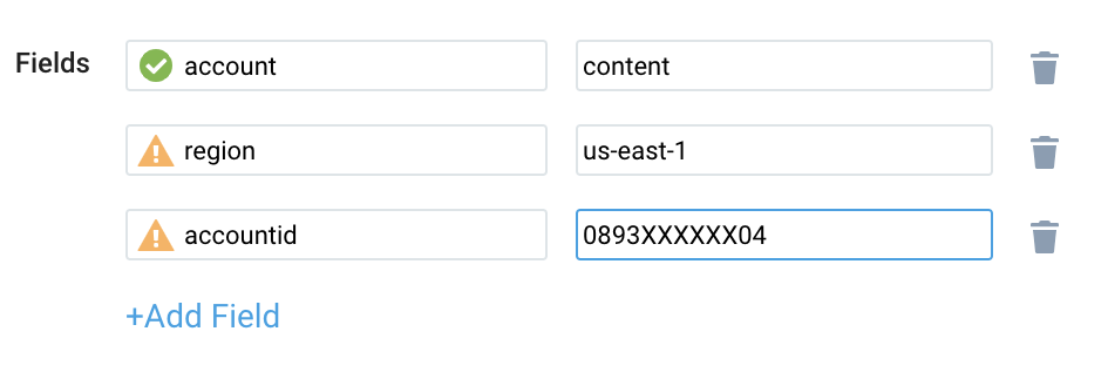
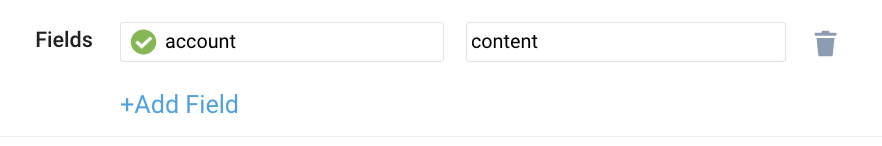
- While configuring the CloudWatch log source, the following Fields can be added in the source:
- Add an account field and assign it a value that is a friendly name/alias to your AWS account from which you are collecting logs. Logs can be queried via the account field.
- Add a region field and assign it the value of the respective AWS region where the Lambda function exists.
- Add an accountId field and assign it the value of the respective AWS account ID being used.
Collect CloudTrail Lambda Data Events
To configure a CloudTrail Source, perform these steps:
- Grant Sumo Logic access to an Amazon S3 bucket.
- Configure DataEvents with CloudTrail in your AWS account.
- Confirm that logs are being delivered to the Amazon S3 bucket.
- Add an AWS CloudTrail Source to Sumo Logic.
- While configuring the cloud trail log source, the following field can be added to the source:
- Add an account field and assign it a value that is a friendly name/alias to your AWS account from which you are collecting logs. Logs can be queried via the “account field”.
Collect Amazon CloudWatch Metrics
Sumo Logic supports collecting metrics using two source types:
- Configure an AWS Kinesis Firehose for Metrics Source (Recommended) or
- Configure an Amazon CloudWatch Source for Metrics
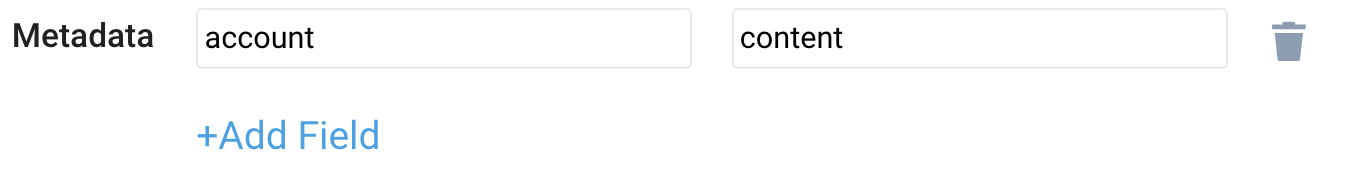
Namespace for Amazon Lambda Service is AWS/Lambda.
- Metadata. Add an account field to the source and assign it a value that is a friendly name/alias to your AWS account from which you are collecting metrics. The account field allows you to query metrics.
Continue with the process of enabling Provisioned Concurrency configurations for Lambda functions, as needed.
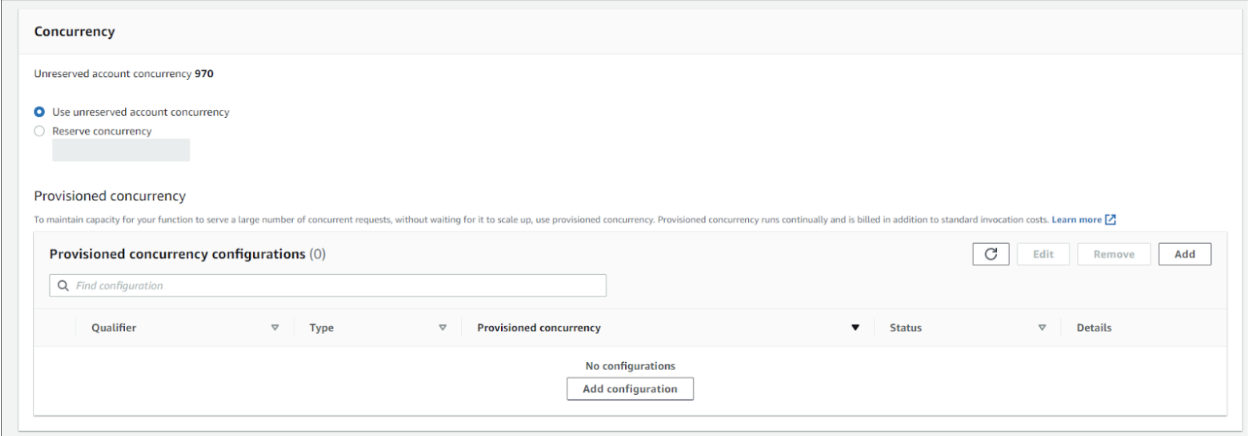
Enable Provisioned Concurrency configurations for Lambda functions
AWS Lambda provides Provisioned Concurrency for greater control over the start-up time for Lambda functions. When enabled, Provisioned Concurrency keeps functions initialized and hyper-ready to respond in double-digit milliseconds. AWS Lambda provides additional metrics for provisioned concurrency with CloudWatch.
To collect the metrics in Sumo Logic, follow the steps below:
- Jump to the Collect Amazon CloudWatch Metrics section and complete the steps as described.
- Configure Provisioned Concurrency while creating a Lambda function in the AWS Management Console, as shown in the following example.
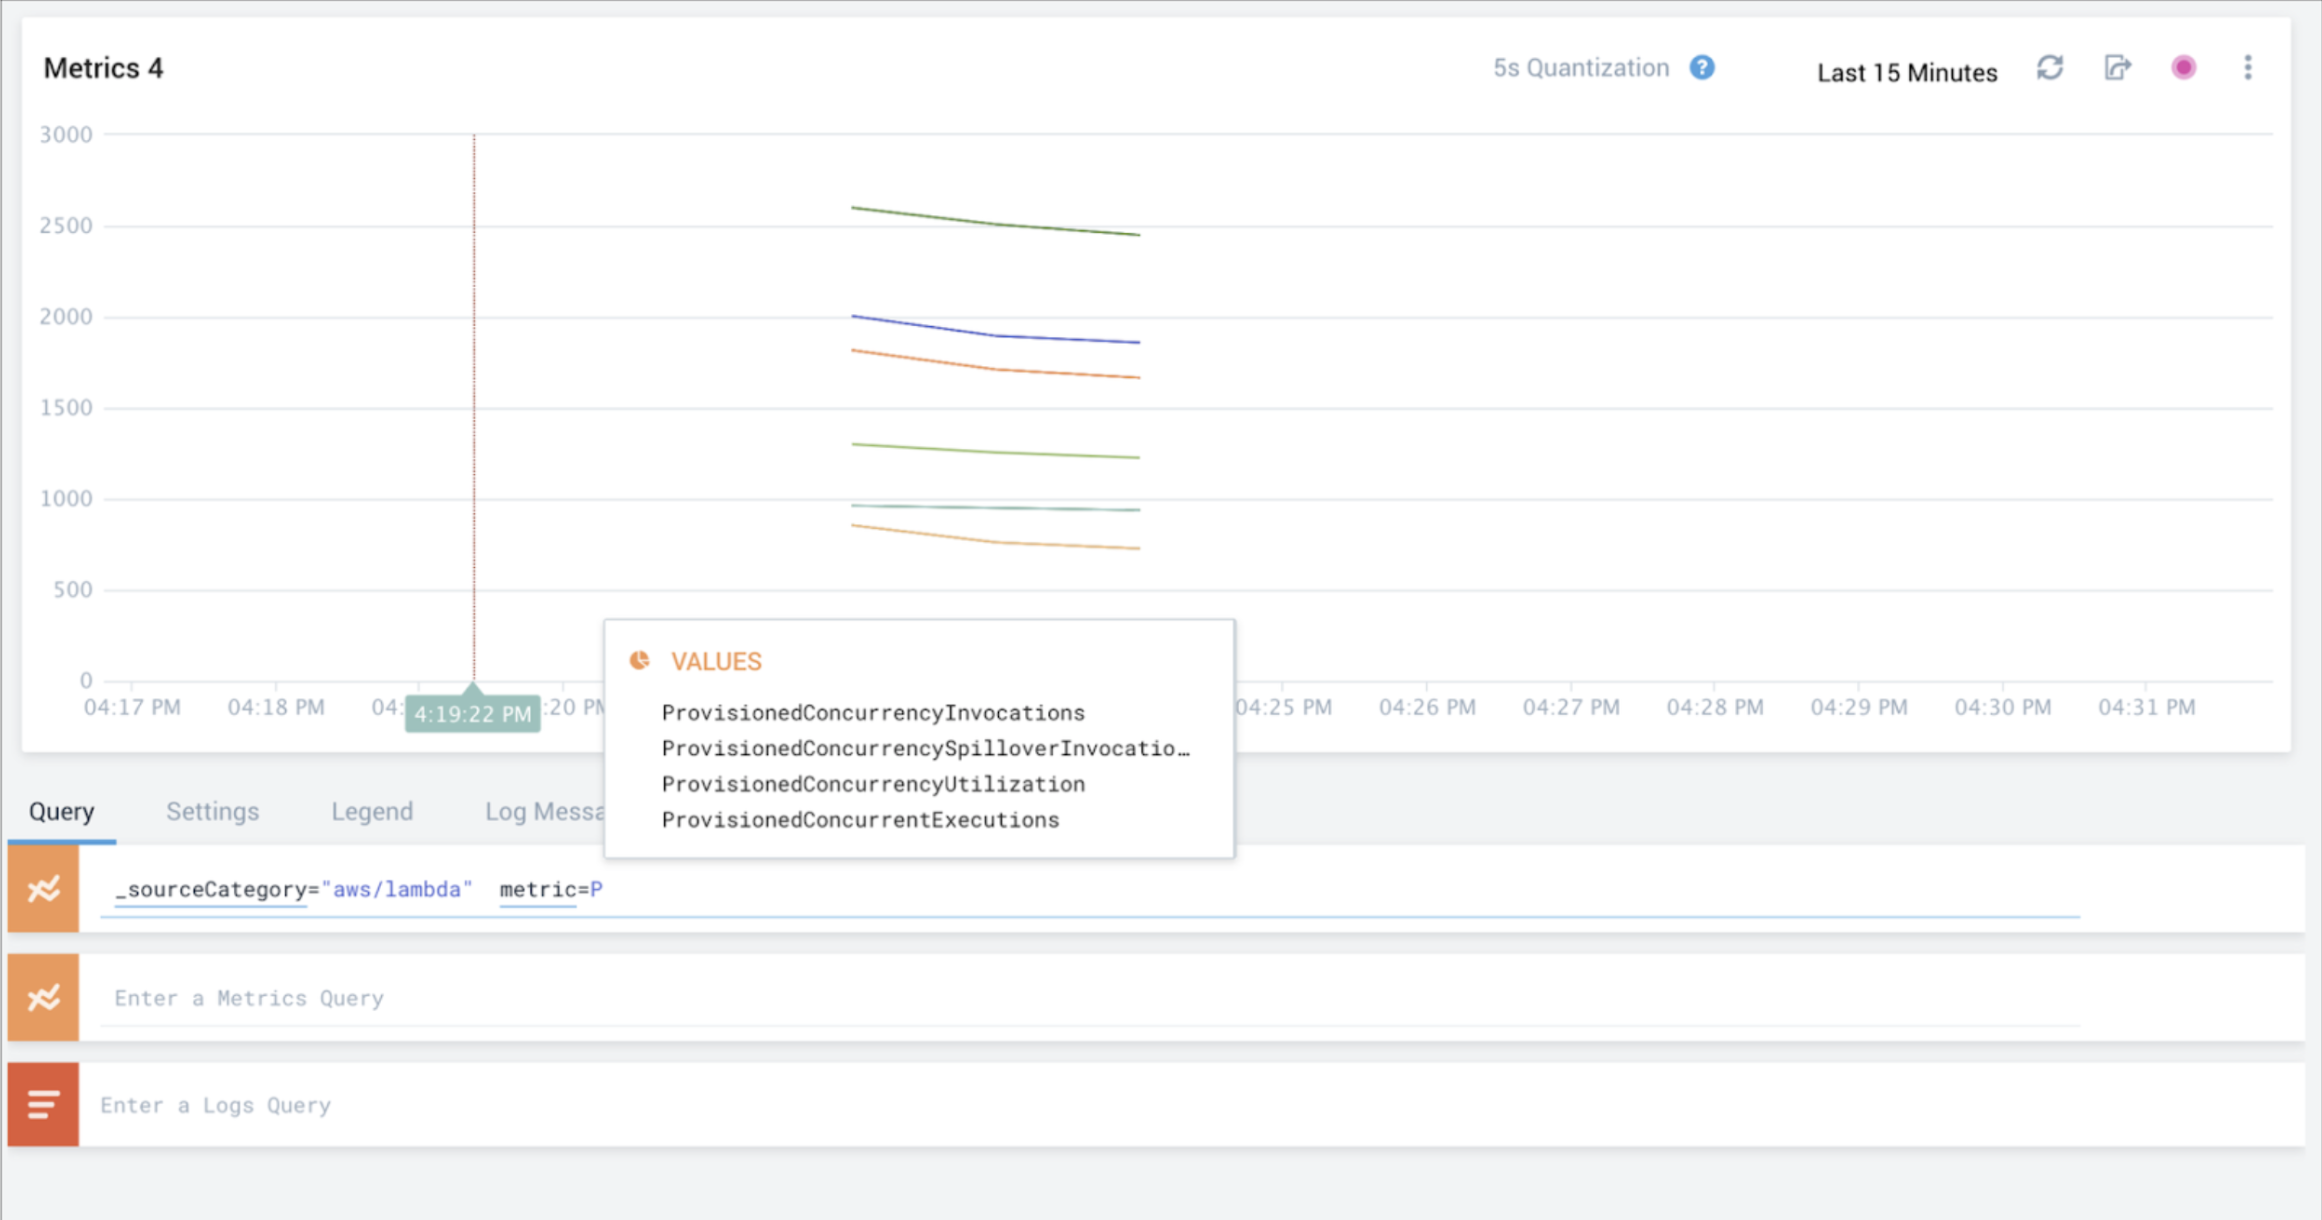
Once Provisioned Concurrency is enabled and you start collecting CloudWatch metrics, the following new metrics will be available:
| Metric | Description |
|---|---|
| ProvisionedConcurrentExecutions | Concurrent Executions using Provisioned Concurrency |
| ProvisionedConcurrencyUtilization | Fraction of Provisioned Concurrency in use |
| ProvisionedConcurrencyInvocations | Number of Invocations using Provisioned Concurrency |
| ProvisionedConcurrencySpilloverInvocations | Number of Invocations that are above Provisioned Concurrency |
These metrics can then be queried using Sumo Logic Metrics queries, as shown in the following example:
Field in Field Schema
- Classic UI. In the main Sumo Logic menu, select Manage Data > Logs > Fields.
New UI. In the top menu, select Configuration, and then under Logs select Fields. You can also click the Go To... menu at the top of the screen and select Fields. - Search for the “functionname” field.
- If not present, create it. Learn how to create and manage fields here.
Field Extraction Rule(s)
Create a Field Extraction Rule for AWS Lambda. Learn how to create a Field Extraction Rule here.
Cloud Trail FER
Rule Name: AwsObservabilityFieldExtractionRule
Applied at: Ingest Time
Scope (Specific Data): account=* eventname eventsource "lambda.amazonaws.com"
| json "eventSource", "awsRegion", "requestParameters", "recipientAccountId" as eventSource, region, requestParameters, accountid nodrop
| where eventSource = "lambda.amazonaws.com"
| json field=requestParameters "functionName", "resource" as functionname, resource nodrop
| parse regex field=functionname "\w+:\w+:\S+:[\w-]+:\S+:\S+:(?<functionname>[\S]+)$" nodrop
| parse field=resource "arn:aws:lambda:*:function:*" as f1, functionname2 nodrop
| if (isEmpty(functionname), functionname2, functionname) as functionname
| "aws/lambda" as namespace
| tolowercase(functionname) as functionname
| fields region, namespace, functionname, accountid
Centralized AWS CloudTrail Log Collection
In case you have a centralized collection of CloudTrail logs and are ingesting them from all accounts into a single Sumo Logic CloudTrail log source, create the following Field Extraction Rule to map the proper AWS account(s) friendly name/alias. Create it if not already present / update it as required.
Rule Name: AWS Accounts
Applied at: Ingest Time
Scope (Specific Data): _sourceCategory=<SourceCategory_of_CloudTrail_source_created_in_sumo>
Parse Expression:
Enter a parse expression to create an “account” field that maps to the alias you set for each sub-account. For example, if you used the “dev” alias for an AWS account with ID "528560886094" and the “prod” alias for an AWS account with ID "567680881046", your parse expression would look like:
| json "recipientAccountId"
// Manually map your aws account id with the AWS account alias you setup earlier for individual child account
| "" as account
| if (recipientAccountId = "528560886094",  "dev", account) as account
| if (recipientAccountId = "567680881046",  "prod", account) as account
| fields account
Cloud Watch FER
Rule Name: AwsObservabilityLambdaCloudWatchLogsFER
Applied at: Ingest Time
Scope (Specific Data): account=* region* _sourceHost=/aws/lambda/*
Parse Expression:
| parse field=_sourceHost "/aws/lambda/*" as functionname
| tolowercase(functionname) as functionname
| "aws/lambda" as namespace
| fields functionname, namespace
Installing the AWS Lambda App
Now that you have set up collection for AWS Lambda, install the Sumo Logic App to use the pre-configured searches and dashboards that provide visibility into your environment for real-time analysis of overall usage.
To install the app:
- Select App Catalog.
- In the 🔎 Search Apps field, run a search for your desired app, then select it.
- Click Install App.
note
Sometimes this button says Add Integration.
- On the next configuration page, under Select Data Source for your App, complete the following fields:
- Data Source. Select one of the following options:
- Choose Source Category and select a source category from the list; or
- Choose Enter a Custom Data Filter, and enter a custom source category beginning with an underscore. For example,
_sourceCategory=MyCategory.
- Folder Name. You can retain the existing name or enter a custom name of your choice for the app.
- All Folders (optional). The default location is the Personal folder in your Library. If desired, you can choose a different location and/or click New Folder to add it to a new folder.
- Data Source. Select one of the following options:
- Click Next.
- Look for the dialog confirming that your app was installed successfully.
Post-installation
Once your app is installed, it will appear in your Personal folder or the folder that you specified. From here, you can share it with other users in your organization. Dashboard panels will automatically start to fill with data matching the time range query received since you created the panel. Results won't be available immediately, but within about 20 minutes, you'll see completed graphs and maps.
Viewing AWS Lambda dashboards
The following measurements and calculations drive the information shown in the dashboard panels:
- Duration (ms). This represents the function duration as the elapsed wall clock time, in milliseconds, from when a function starts executing as a result of an invocation to when it stops executing. Function duration is a measure of performance. Billed Duration for an invocation is the value of duration rounded up to the nearest 100 milliseconds.
- Memory Size. The amount of memory allocated for a function.
- Max Memory (MB) Used. The amount of memory used by a function, in MBs. This is a measure of performance.
- Compute Usage (GBs). This is a product of Memory Size and Billed Duration (Memory Size * Billed Duration).
- Billed Compute. memory configured on the function (in GB) x duration of the request (in seconds). In the actual query, Sumo Logic converts MB to GB and milliseconds to seconds to get the real billing numbers used. The actual cost varies by customer. This measurement is used to measure cost.
- Unused Memory. This is Memory Size - Max Memory Used = Unused Memory. Because you are billed based on Memory Size (which you allocate), this is an indicator of not allocating appropriately.
- IteratorAge. This AWS Lambda CloudWatch metric is emitted for stream-based invocations (functions triggered by an Amazon DynamoDB stream or Kinesis stream). Measures, in milliseconds, the age of the last record for each batch of records processed. Age is the difference between the time Lambda received the batch and the time the last record in the batch was written to the stream.
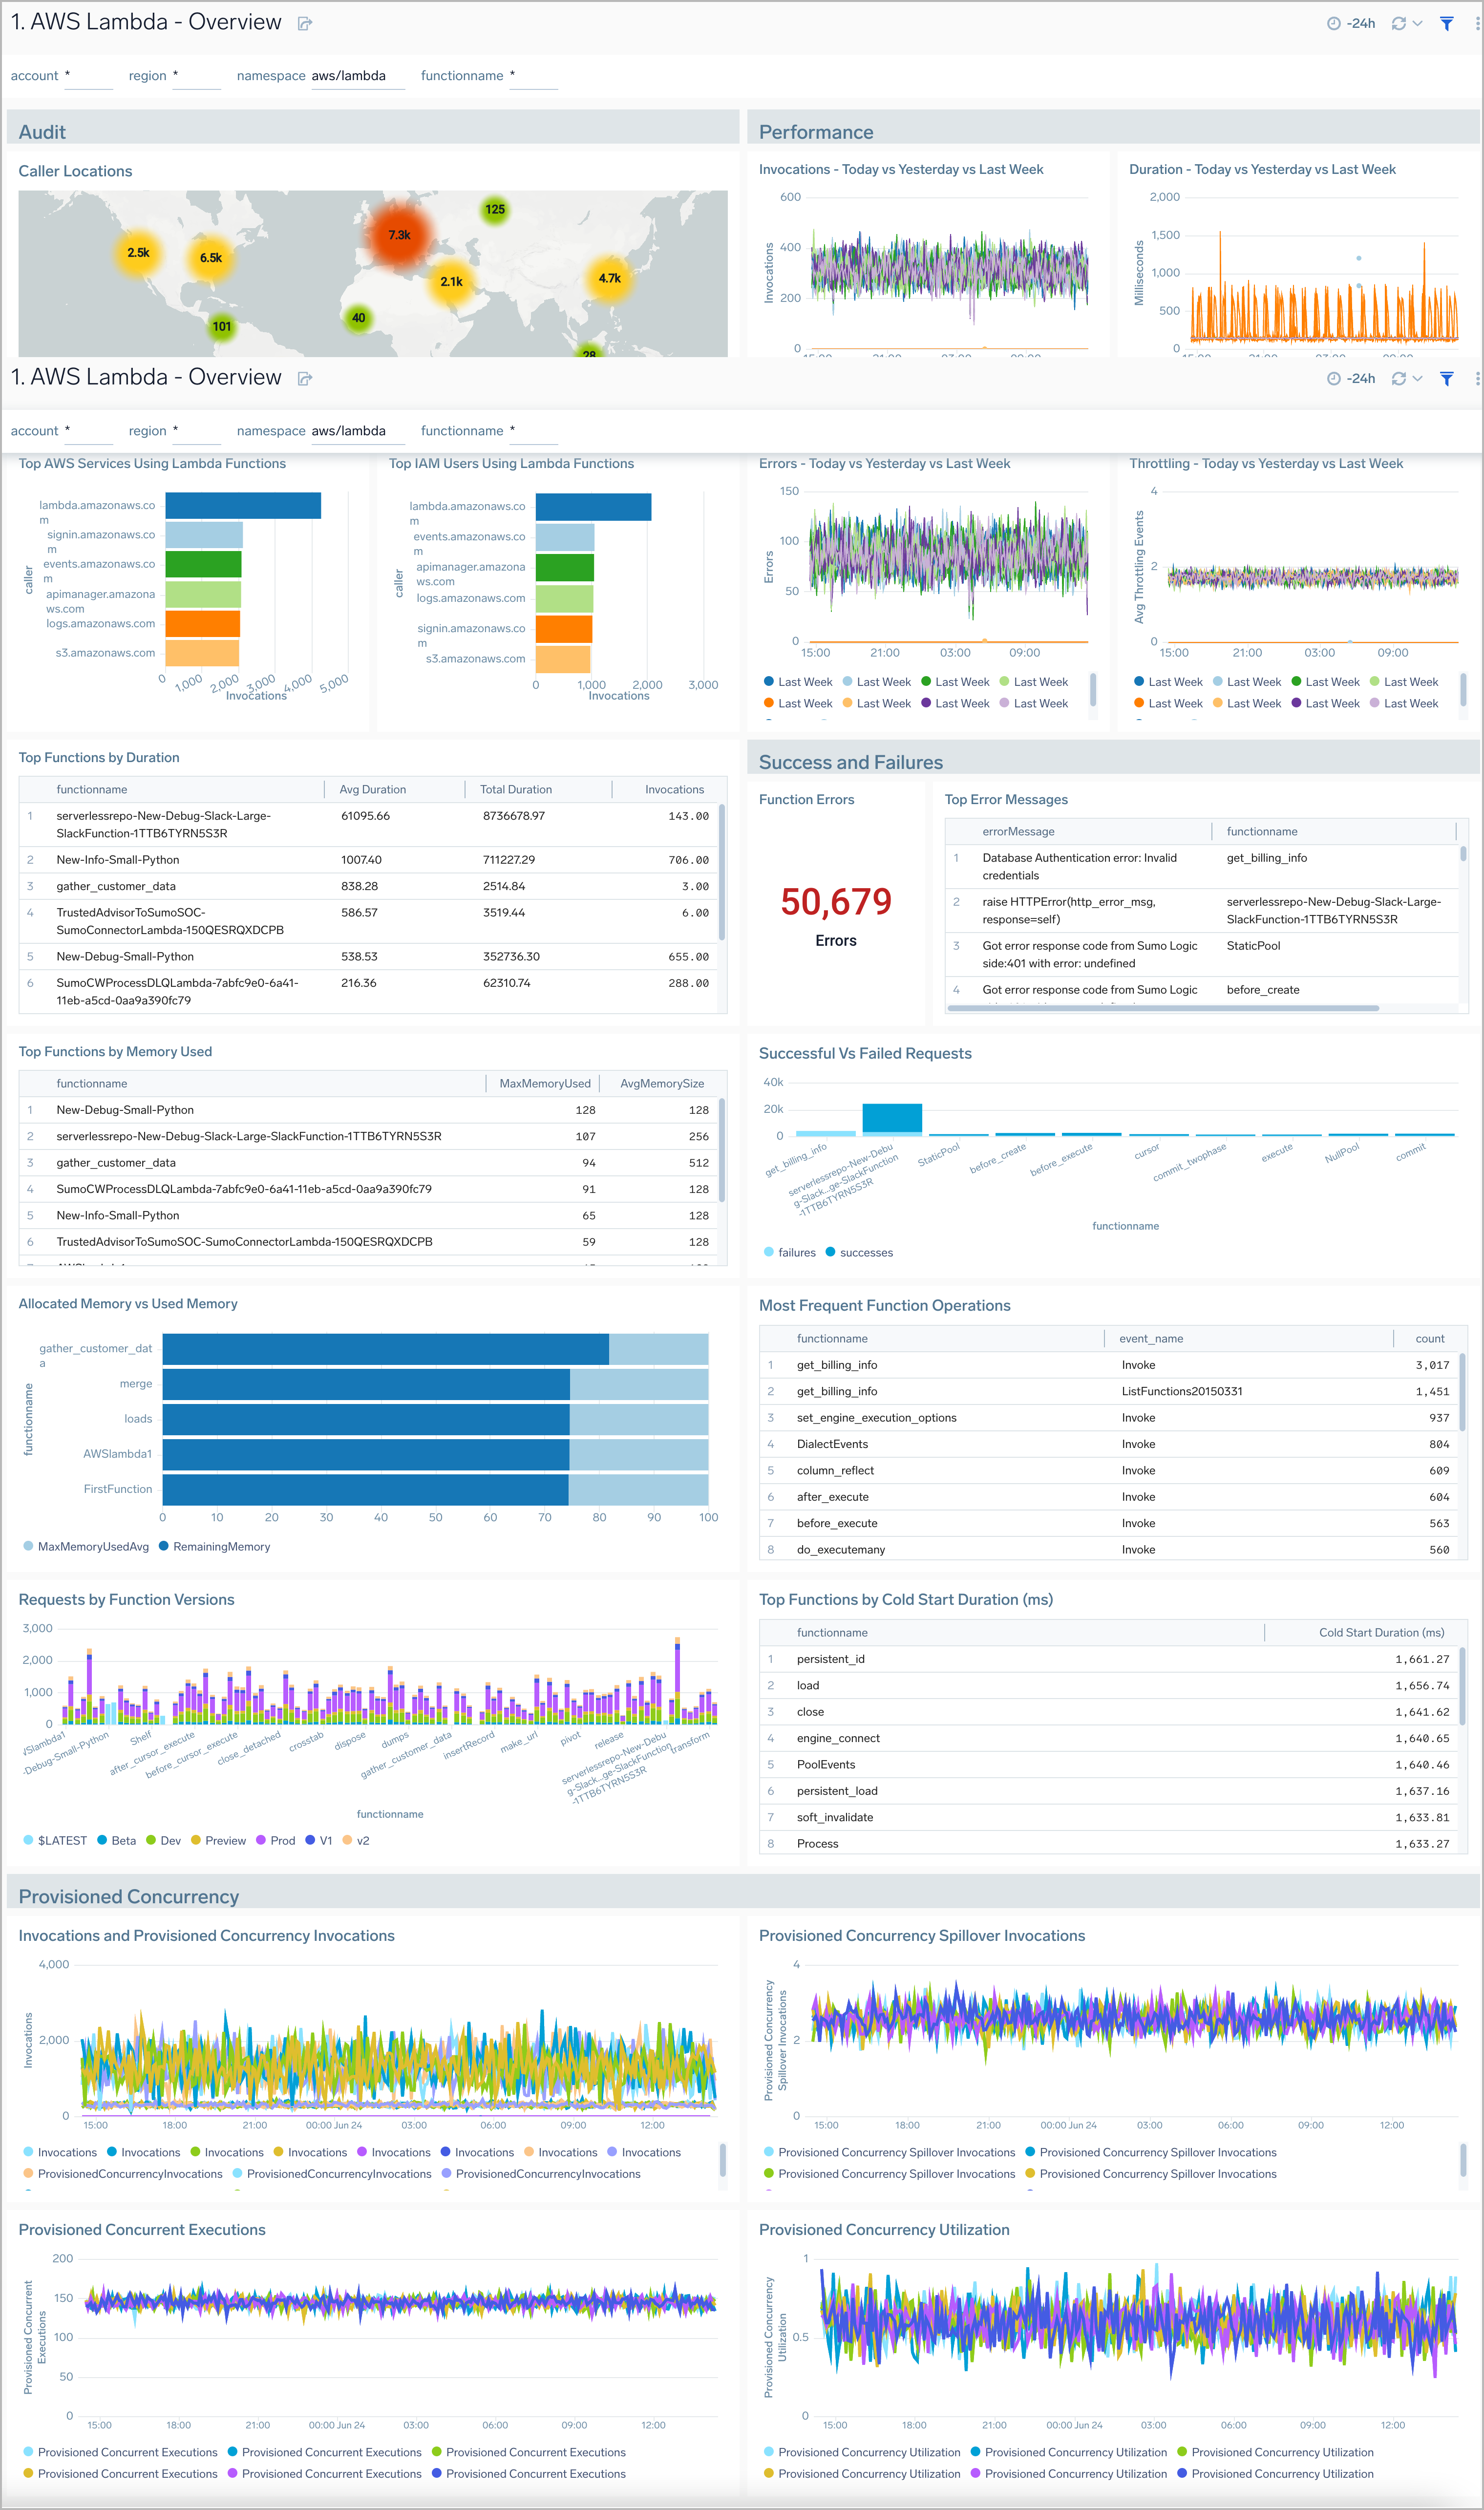
Overview
The AWS Lambda - Overview dashboard provides intuitive insights with CloudWatch Lambda metrics, CloudTrail audit logs for Lambda, as well as Lambda logs to give you an at-a-glance view of actions, performance, and health of your AWS Lambda functions.
Use this dashboard to:
- Monitor how often your Lambda functions are being invoked across and ensure they are as per expectations.
- Identify and resolve the top error messages across your Lambda functions.
- Quickly identify top error messages, slow-performing Lambda functions, and functions using the most resources.
- Monitor provisioned concurrency invocations, executions, and utilization.
- Identify and validate the top IAM Users and AWS services that invoke AWS Lambda functions.
- Monitor cold start duration for Lambda functions.
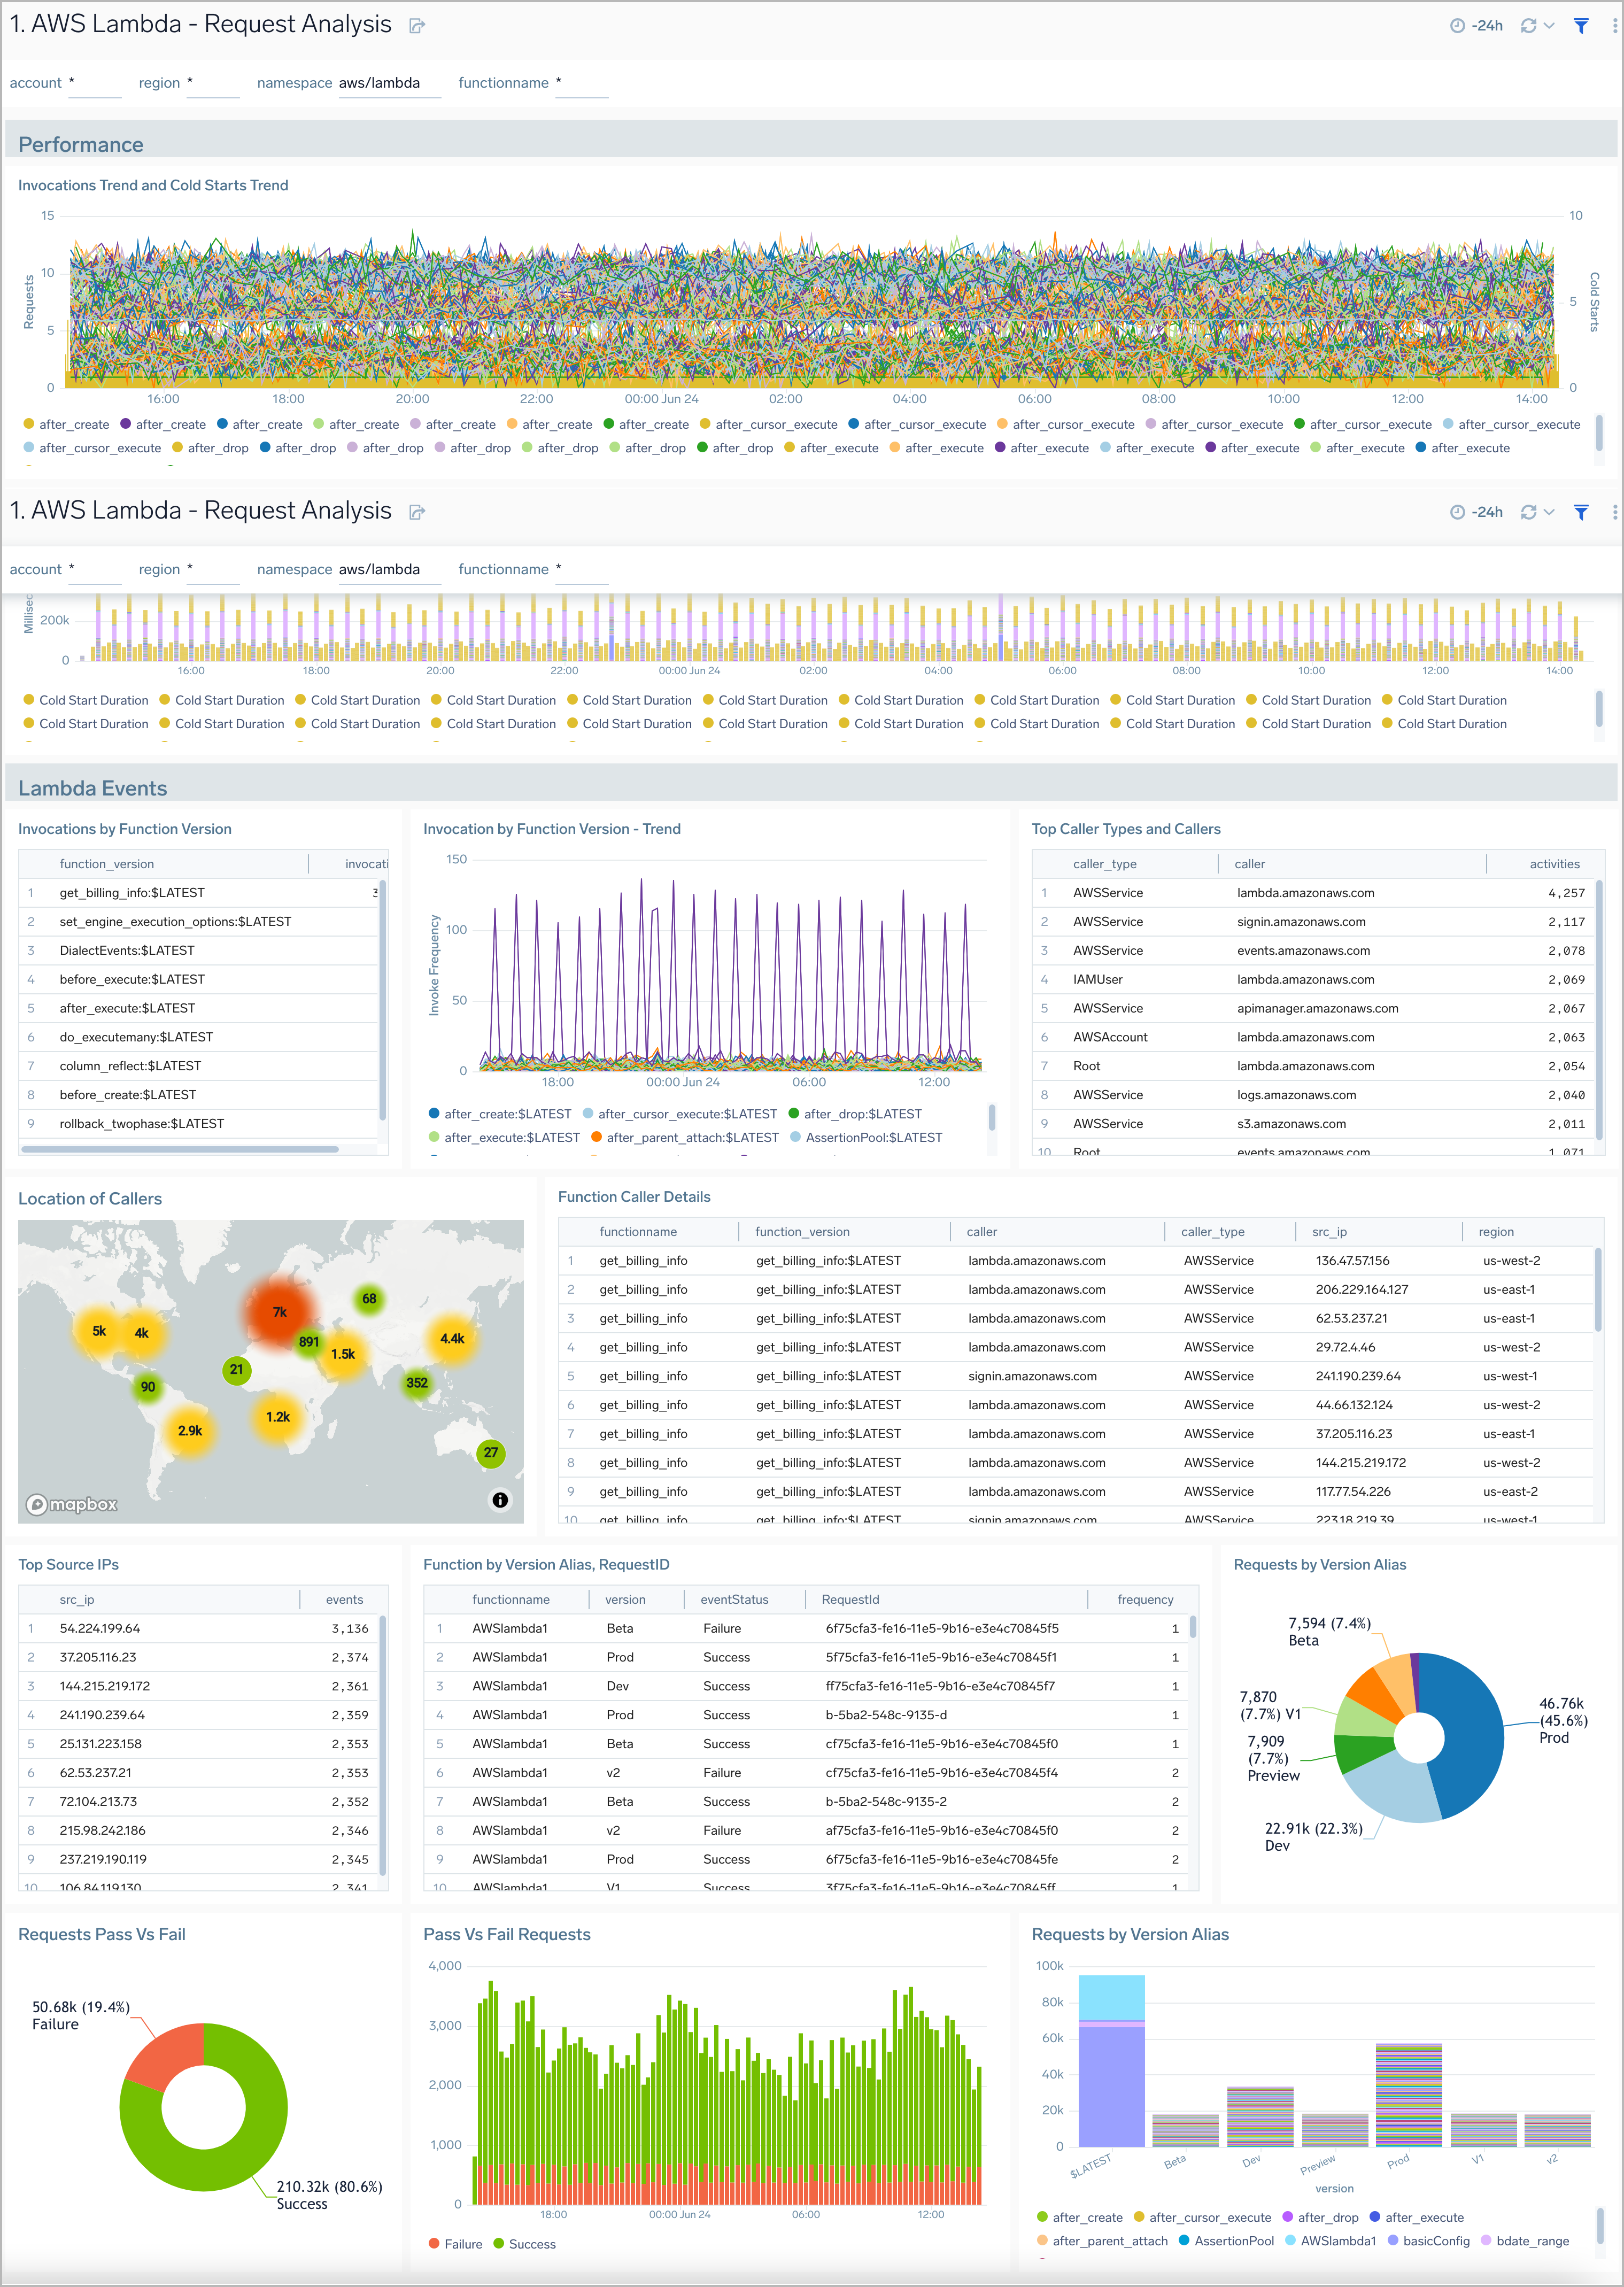
Request Analysis
The AWS Lambda - Request Analysis dashboard provides deeper insights into the invocations, operations, and performance of your AWS Lambda functions.
Use this dashboard to:
- Monitor the invocation of an AWS Lambda function against all other functions.
- Identify the top source IPs.
- Monitor failed and successful requests by function name to quickly identify when failed requests are occurring.
- Troubleshoot and investigate individual function requests.
- Monitor cold start duration and key operations for Lambda functions.
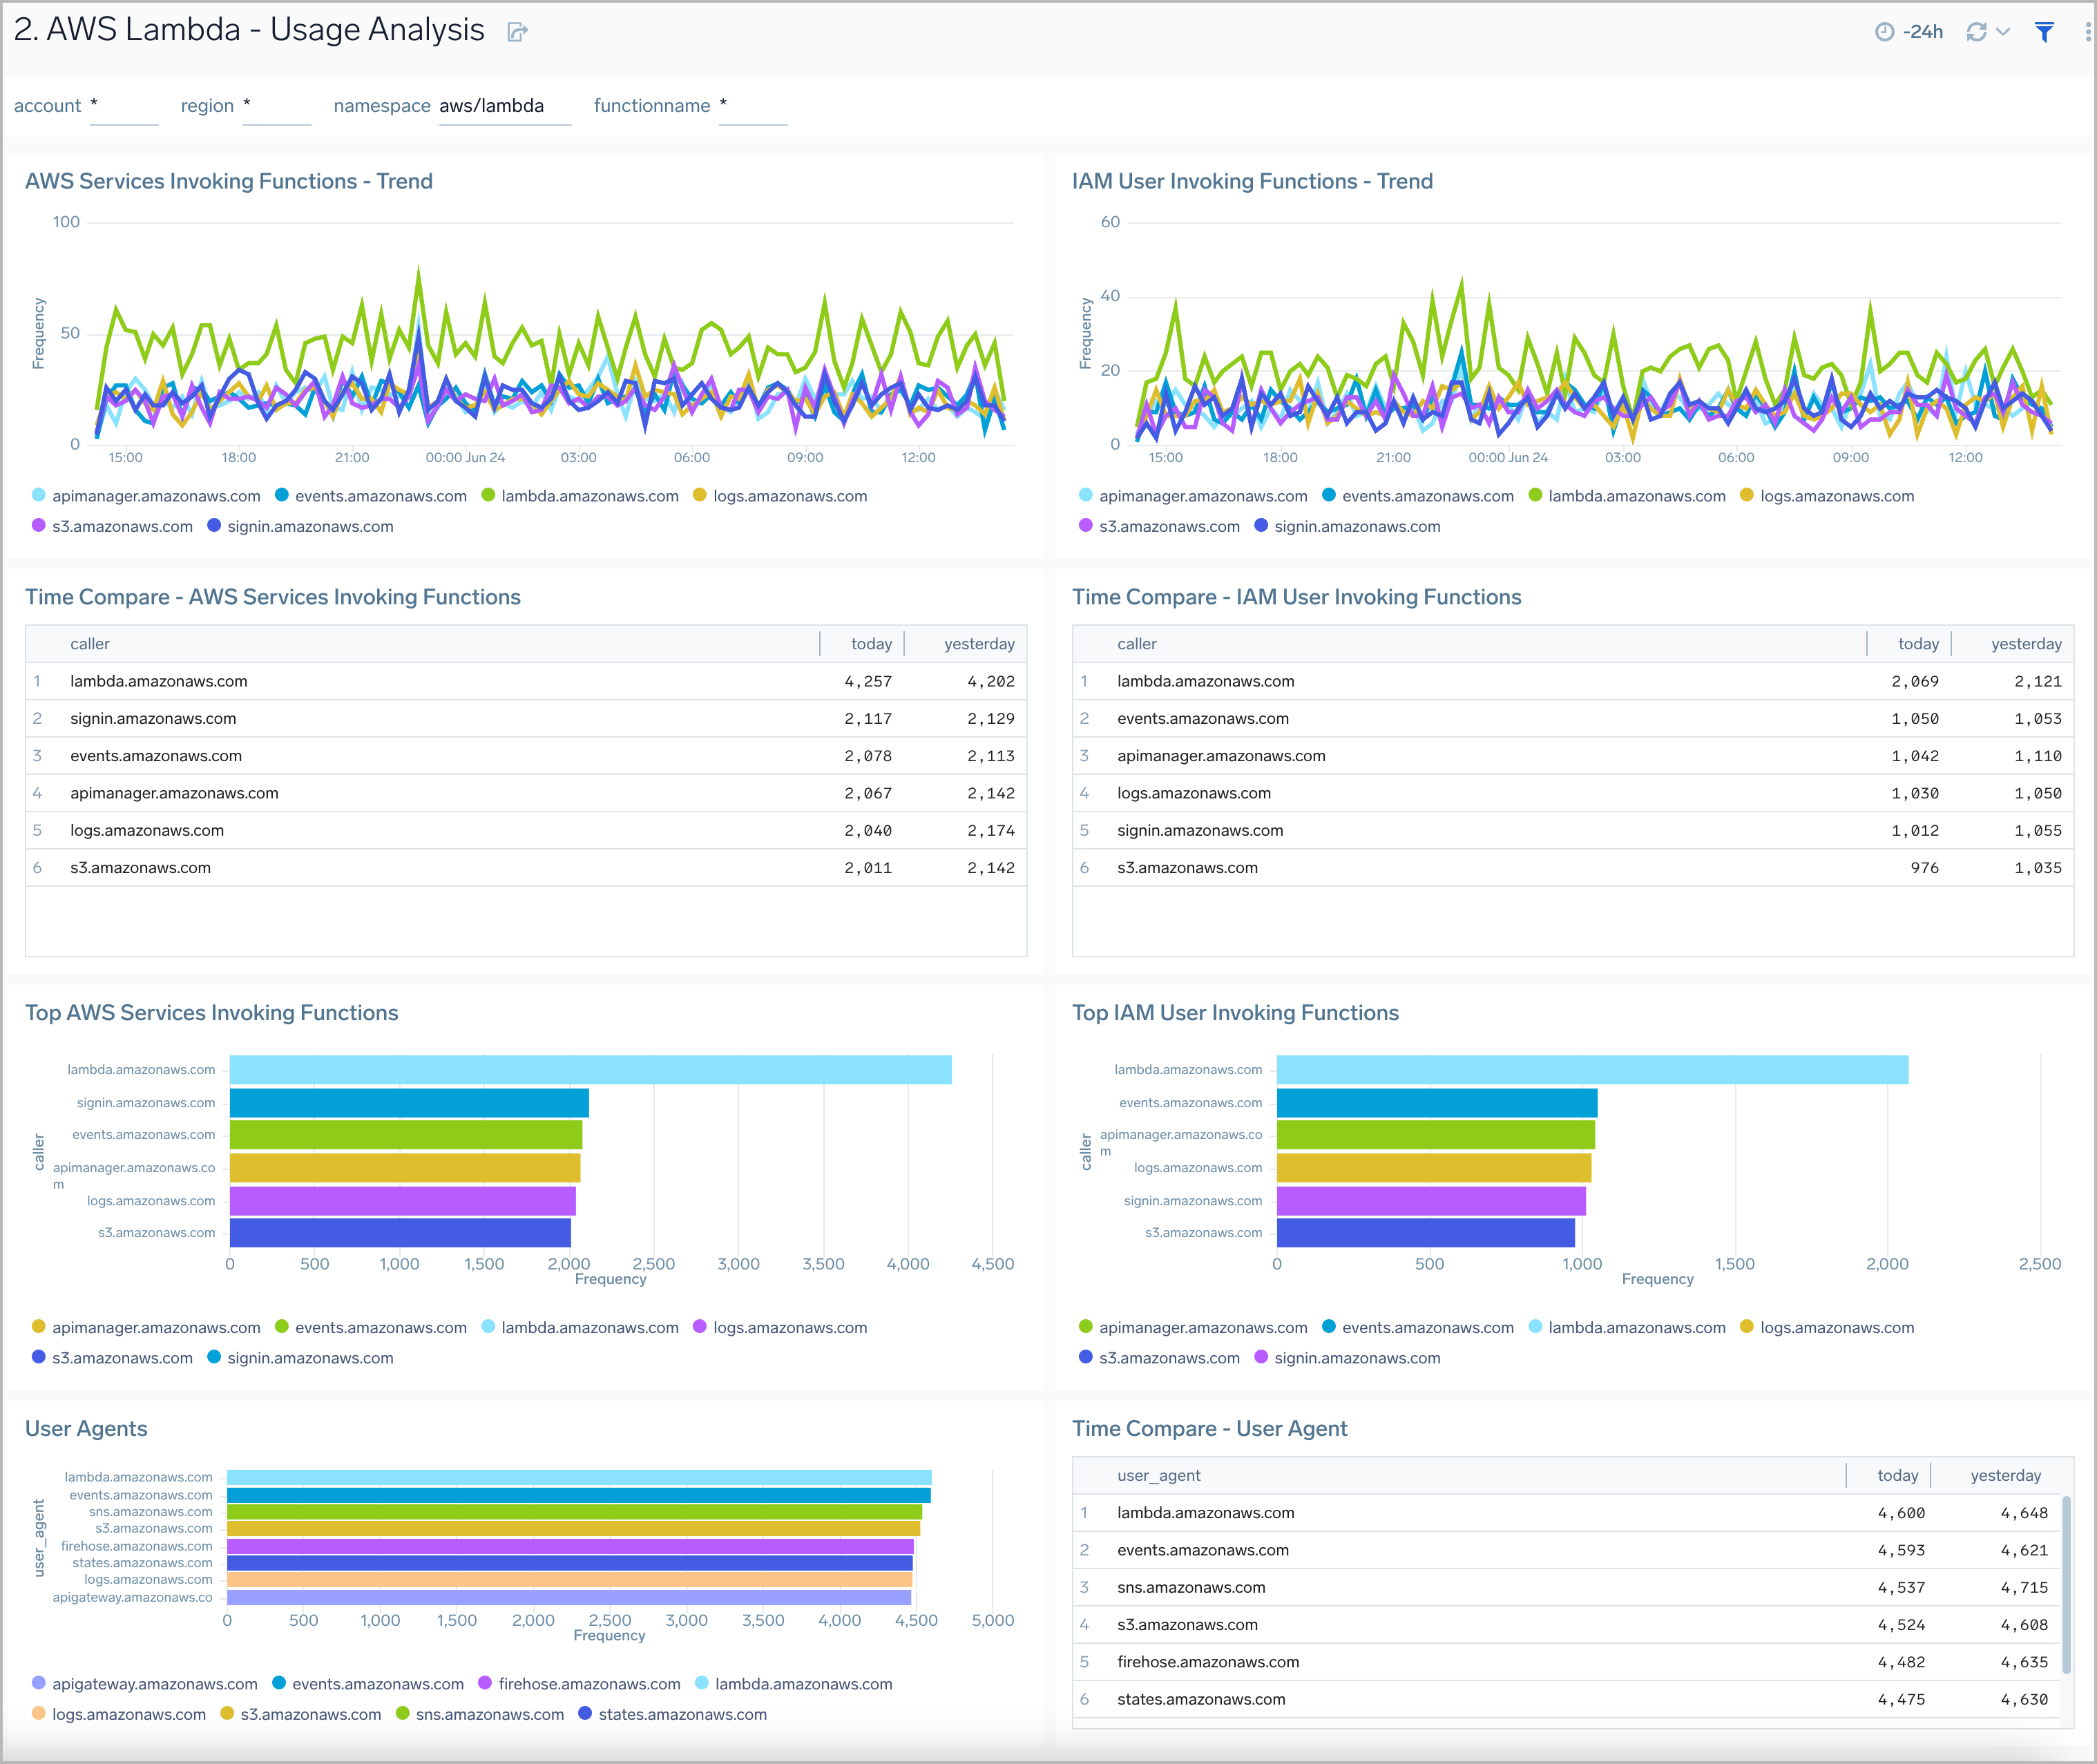
Usage Analysis
AWS Lambda - Usage Analysis dashboard offers insights into function usage, including invocations, calling AWS services, user agents, IAM users, and detailed information about function callers.
This dashboard provides analysis of AWS CloudTrail Data Events. By default, AWS CloudTrail does not log data events. To enable AWS CloudTrail data events, refer to AWS Lambda Data Event
Use this dashboard to:
- Audit, monitor, and compare the functions used in your serverless infrastructure.
- Monitor which AWS services and IAM users are calling individual AWS Lambda functions.
- Monitor which user agents are being used in Lambda function calls.
- Compare data across time to identify any unusual trends.
- Identify top callers, top caller types.
- Monitor the invocation of an AWS Lambda function.
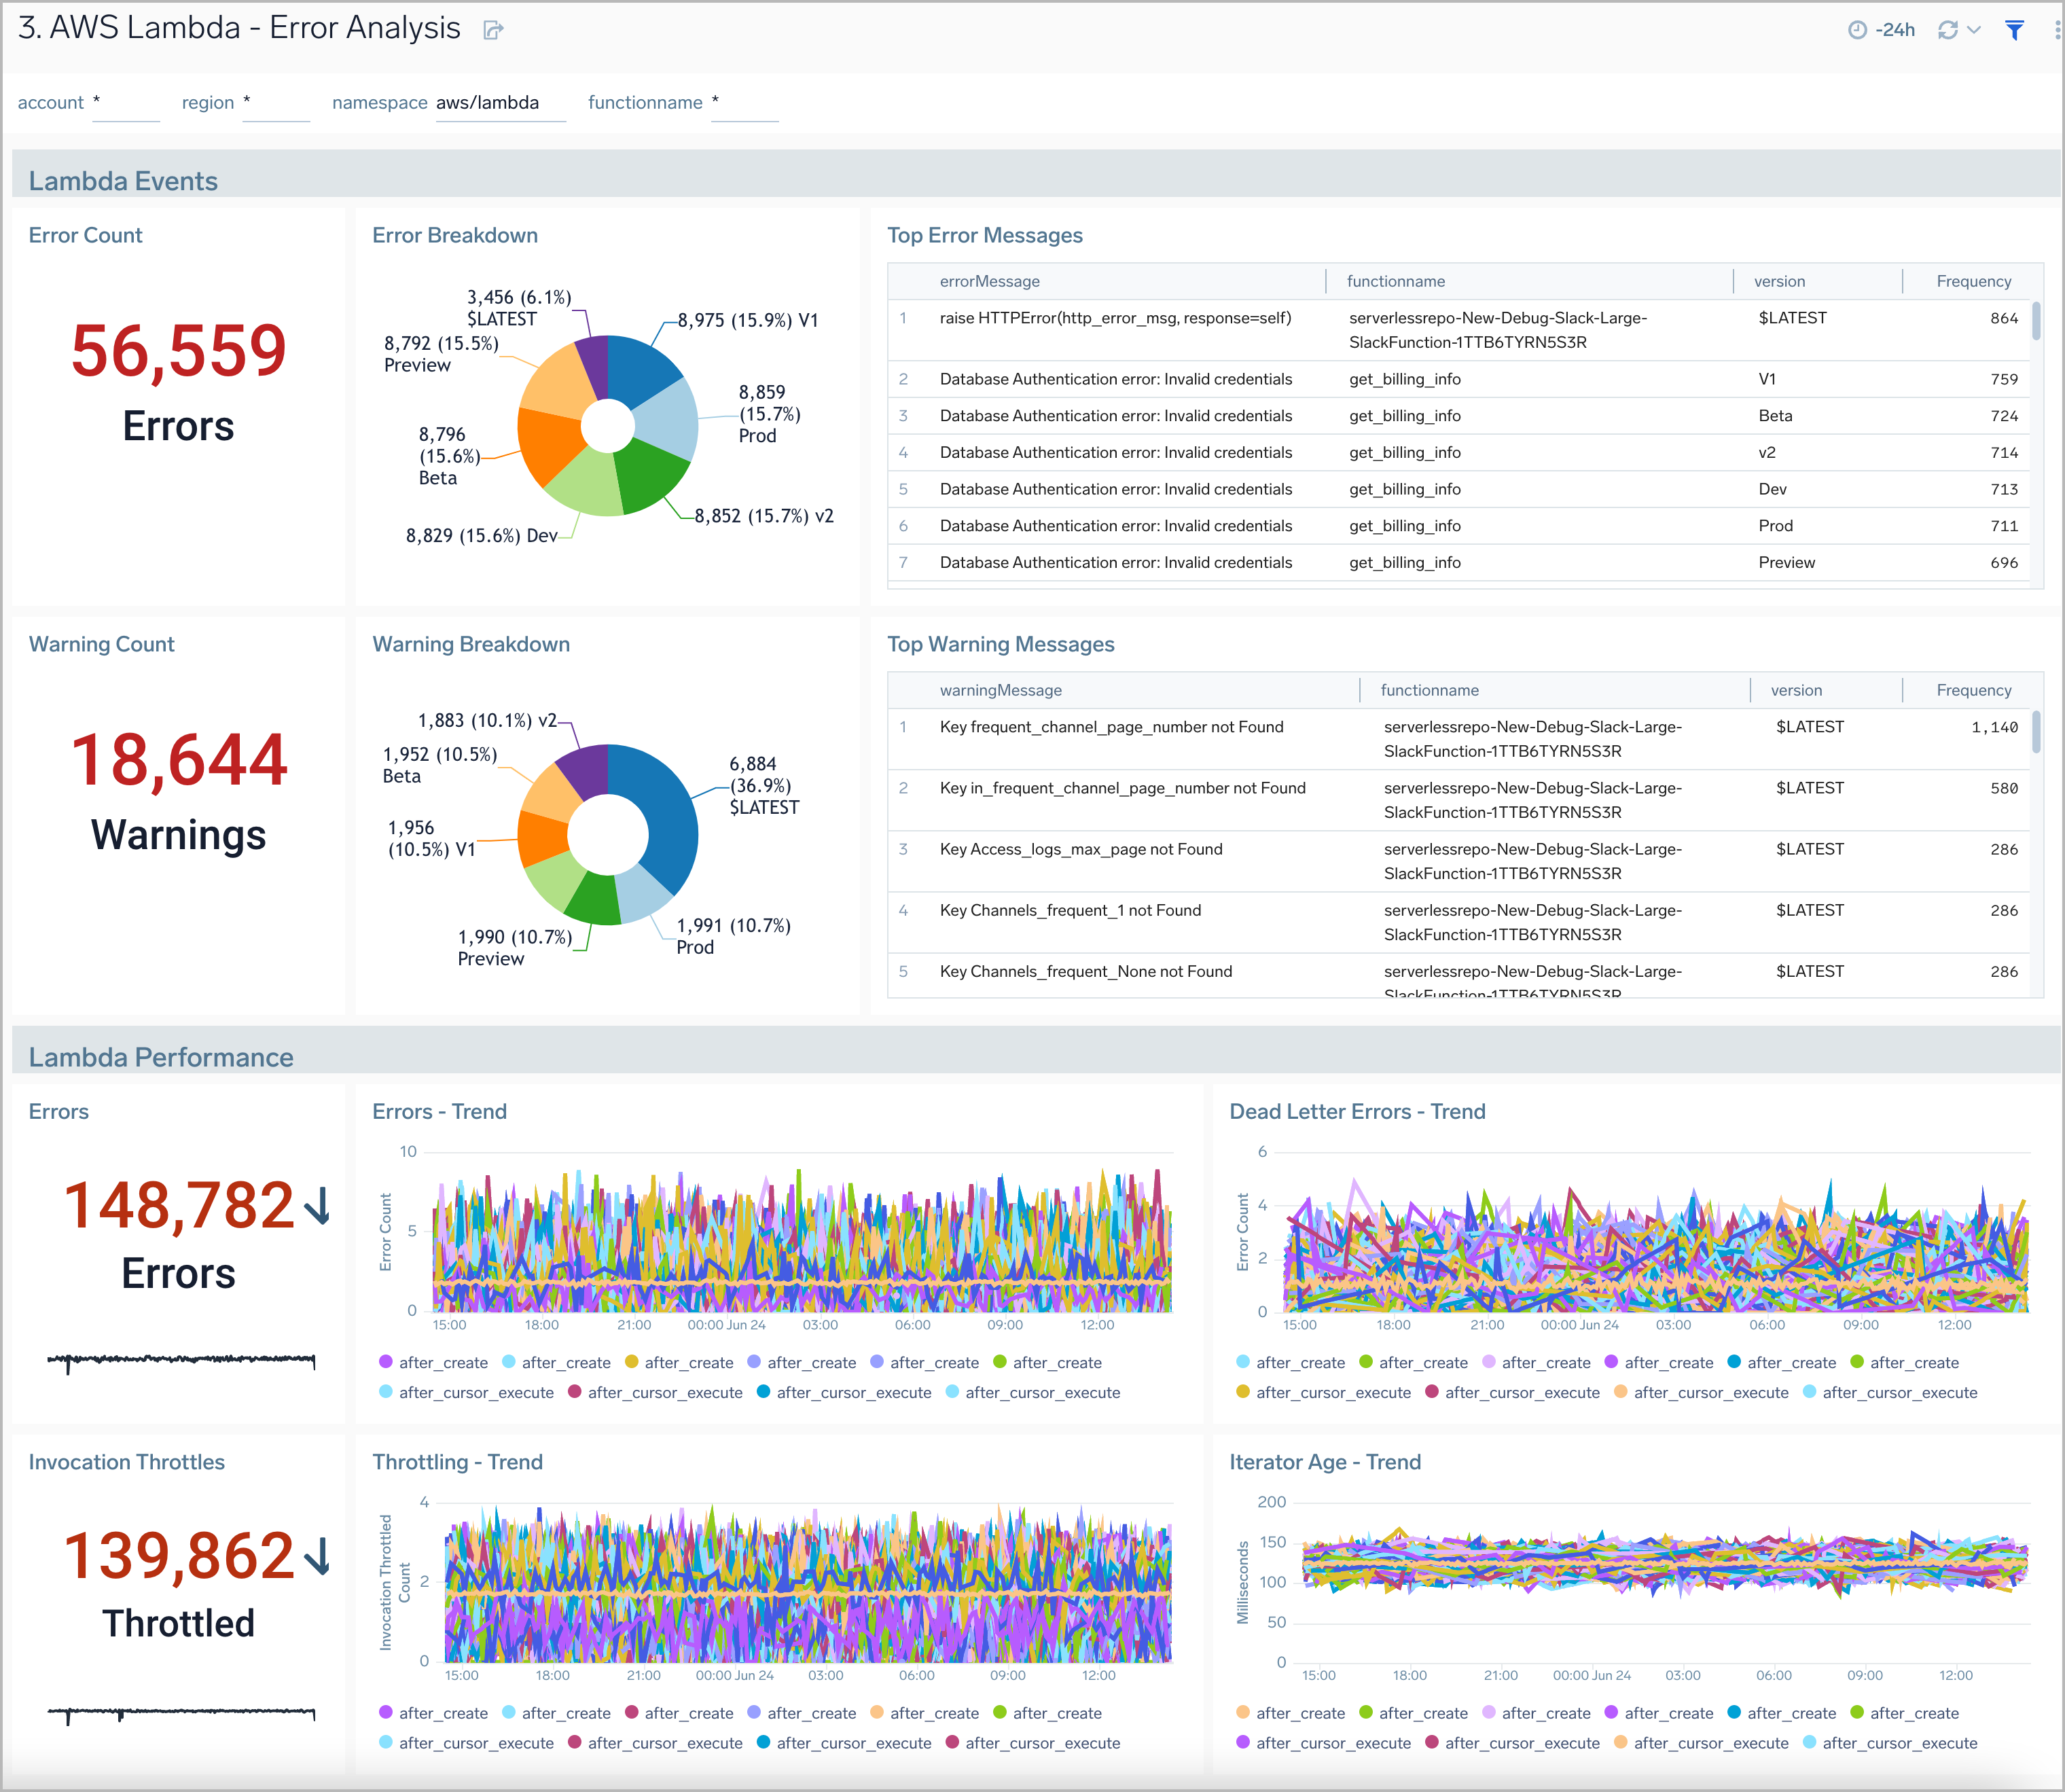
Error Analysis
The AWS Lambda - Error Analysis dashboard provides insights into errors and warnings in your AWS Lambda functions.
Use this dashboard to:
- Quickly identify the top errors and warnings across a Lambda function and its version.
- Prioritize the resolution of errors and warnings across all Lambda functions.
- Monitor the trend for the number of dead-letter errors when a Lambda is unable to write the failed event payload to your function's dead-letter queue.
- Monitor the trend for the number of Lambda function throttling events; the number of Lambda function invocation attempts throttled due to invocation rates exceeding the configured concurrent limits.
- Monitor the trend for Iterator Age applicable for your stream-based invocations only. This measures the age of the last record for each batch of records processed. Age is the difference between the time Lambda received the batch and the time the last record in the batch was written to the stream.
- Monitor the trend for the number of async event drops. This indicates the number of asynchronous invocation requests that were dropped due to internal service errors or exceeding service limits.
- Monitor the trend for recursive invocation drops. This measures the number of recursive invocation attempts that were dropped to prevent potential infinite loops and unbounded recursion within Lambda functions.
- Monitor the trend for destination delivery failures. This tracks the number of times Lambda failed to deliver an asynchronous invocation result to a configured destination, such as an SNS topic, SQS queue, or EventBridge.
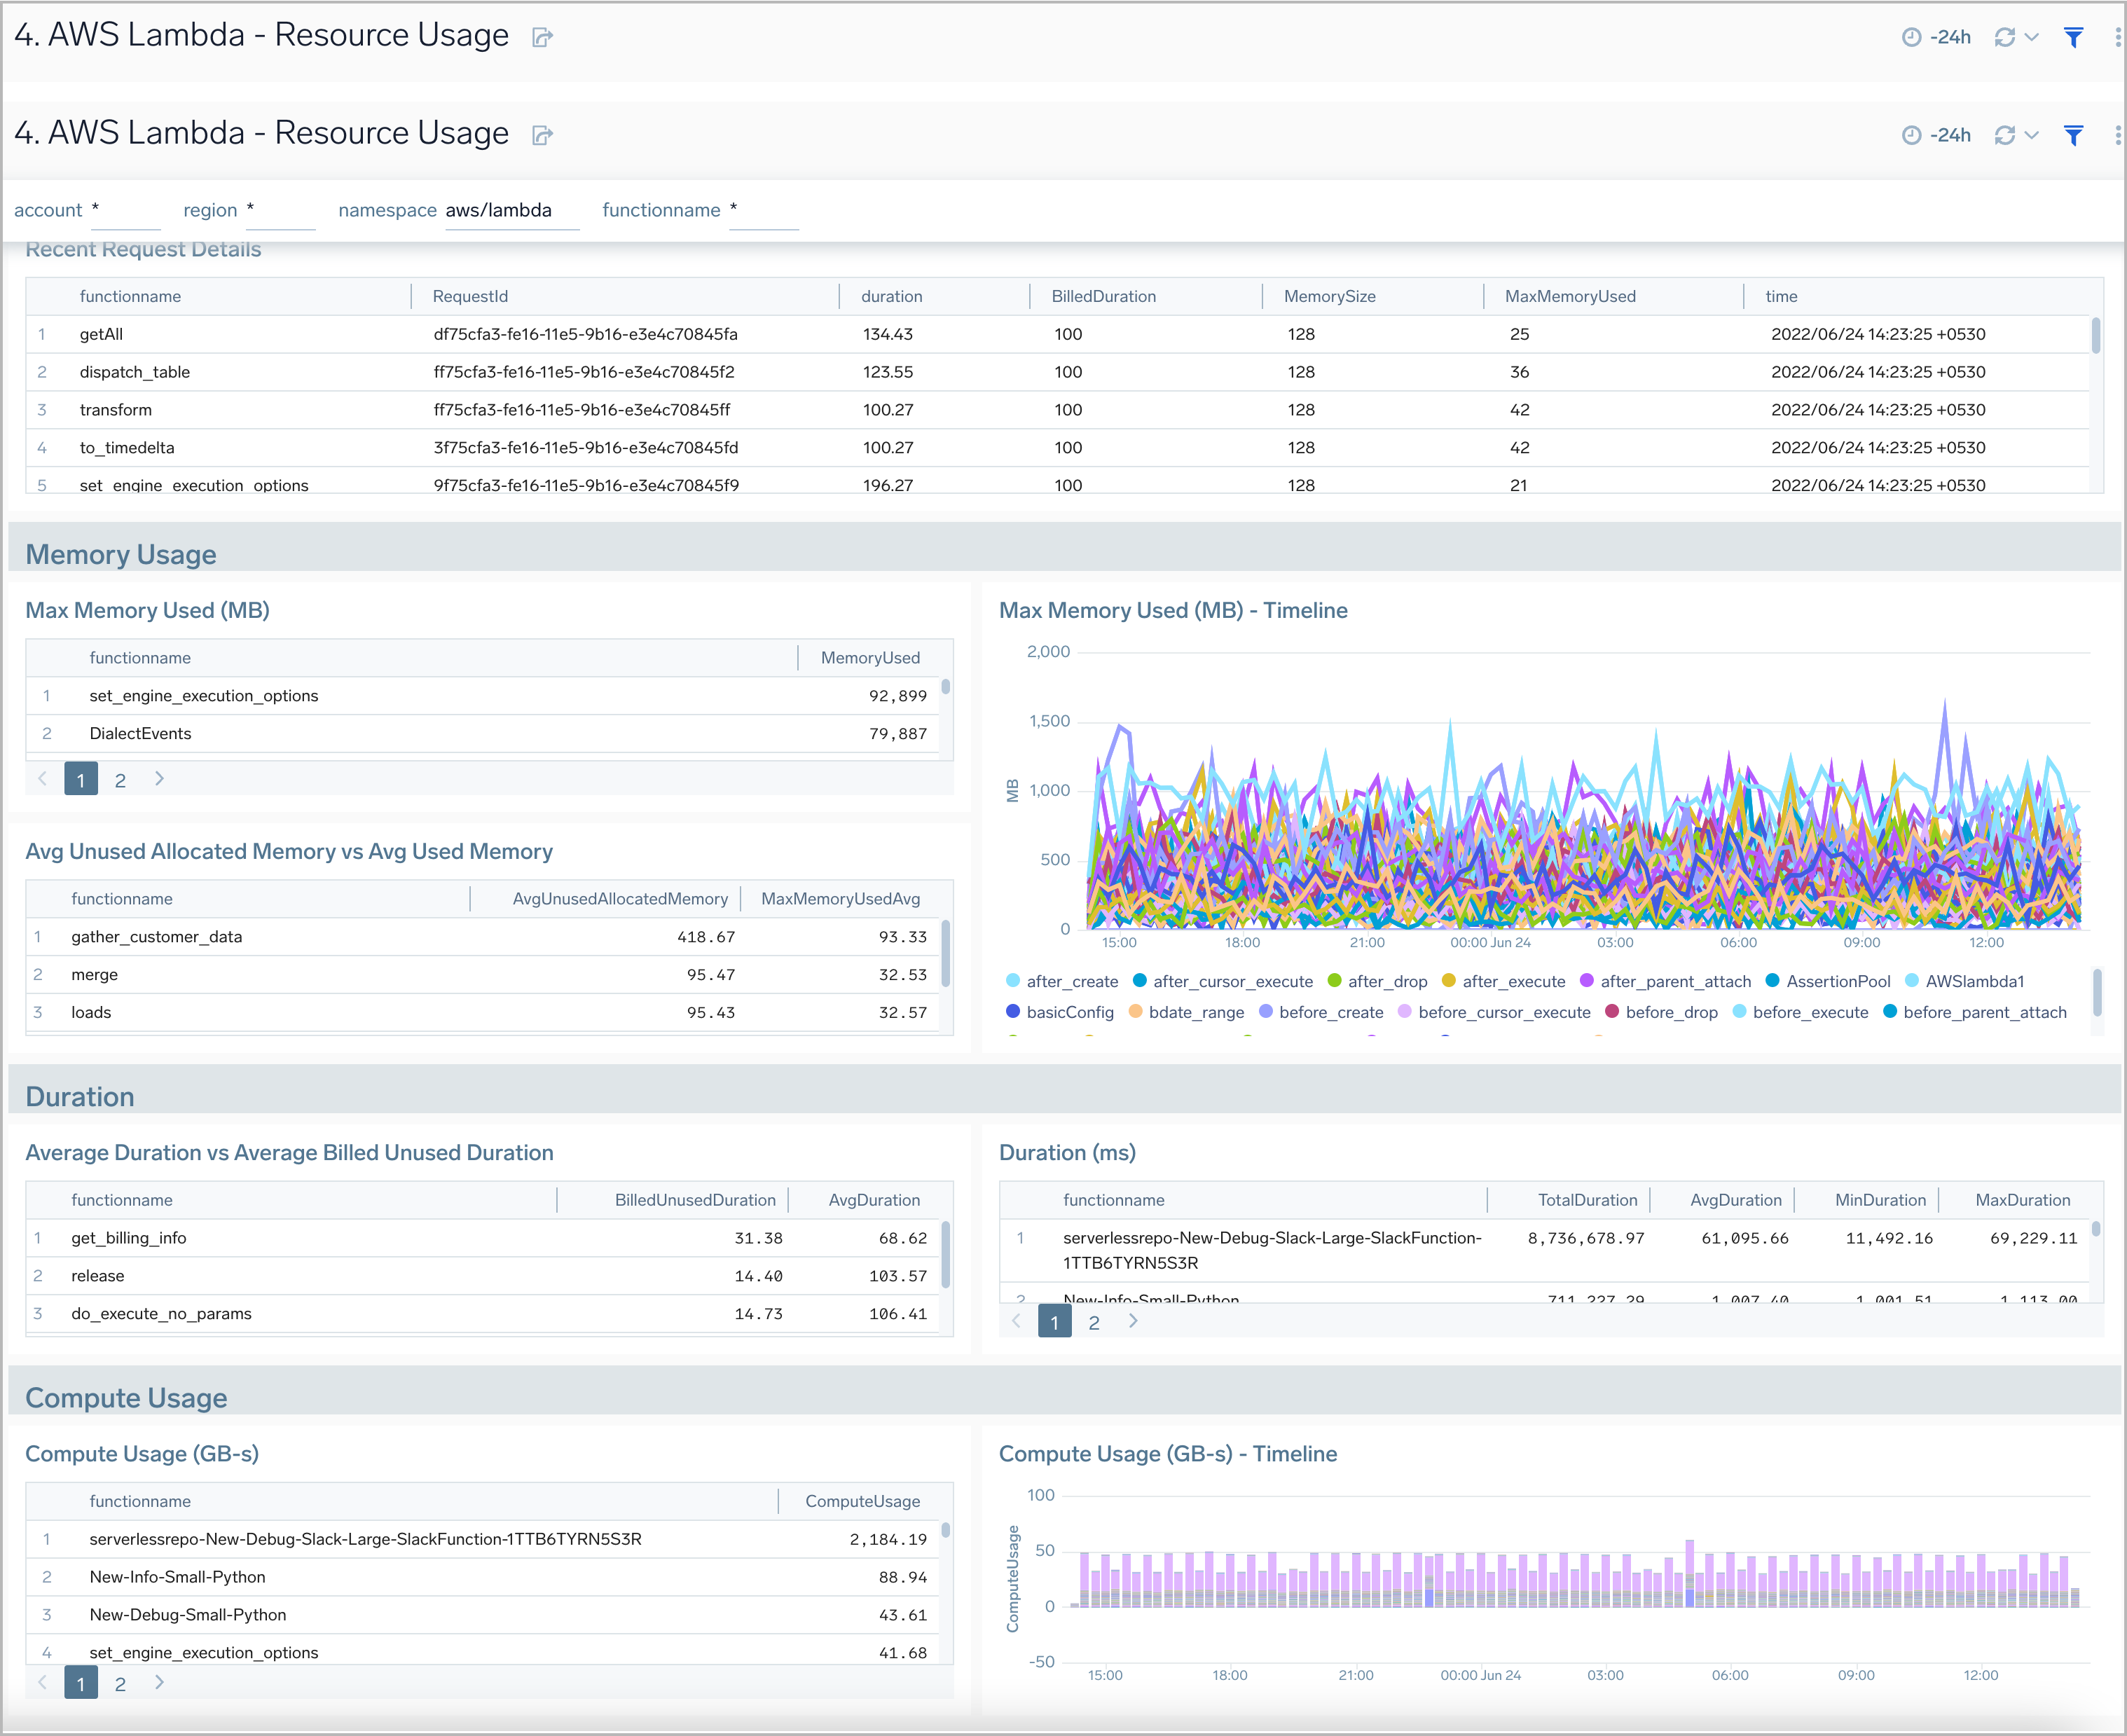
Resource Usage
AWS Lambda - Resource Usage dashboard provides insights on recent AWS Lambda request details, memory usage trends, function duration, claimed concurrency, and compute usage.
Use this dashboard to:
- Monitor the memory usage pattern of a Lambda function during its execution.
- Monitor the time taken by the function for execution, particularly to understand the unbilled duration.
- Monitor the compute usage by function.
- Monitor claimed account concurrency at the account level, segmented by region.
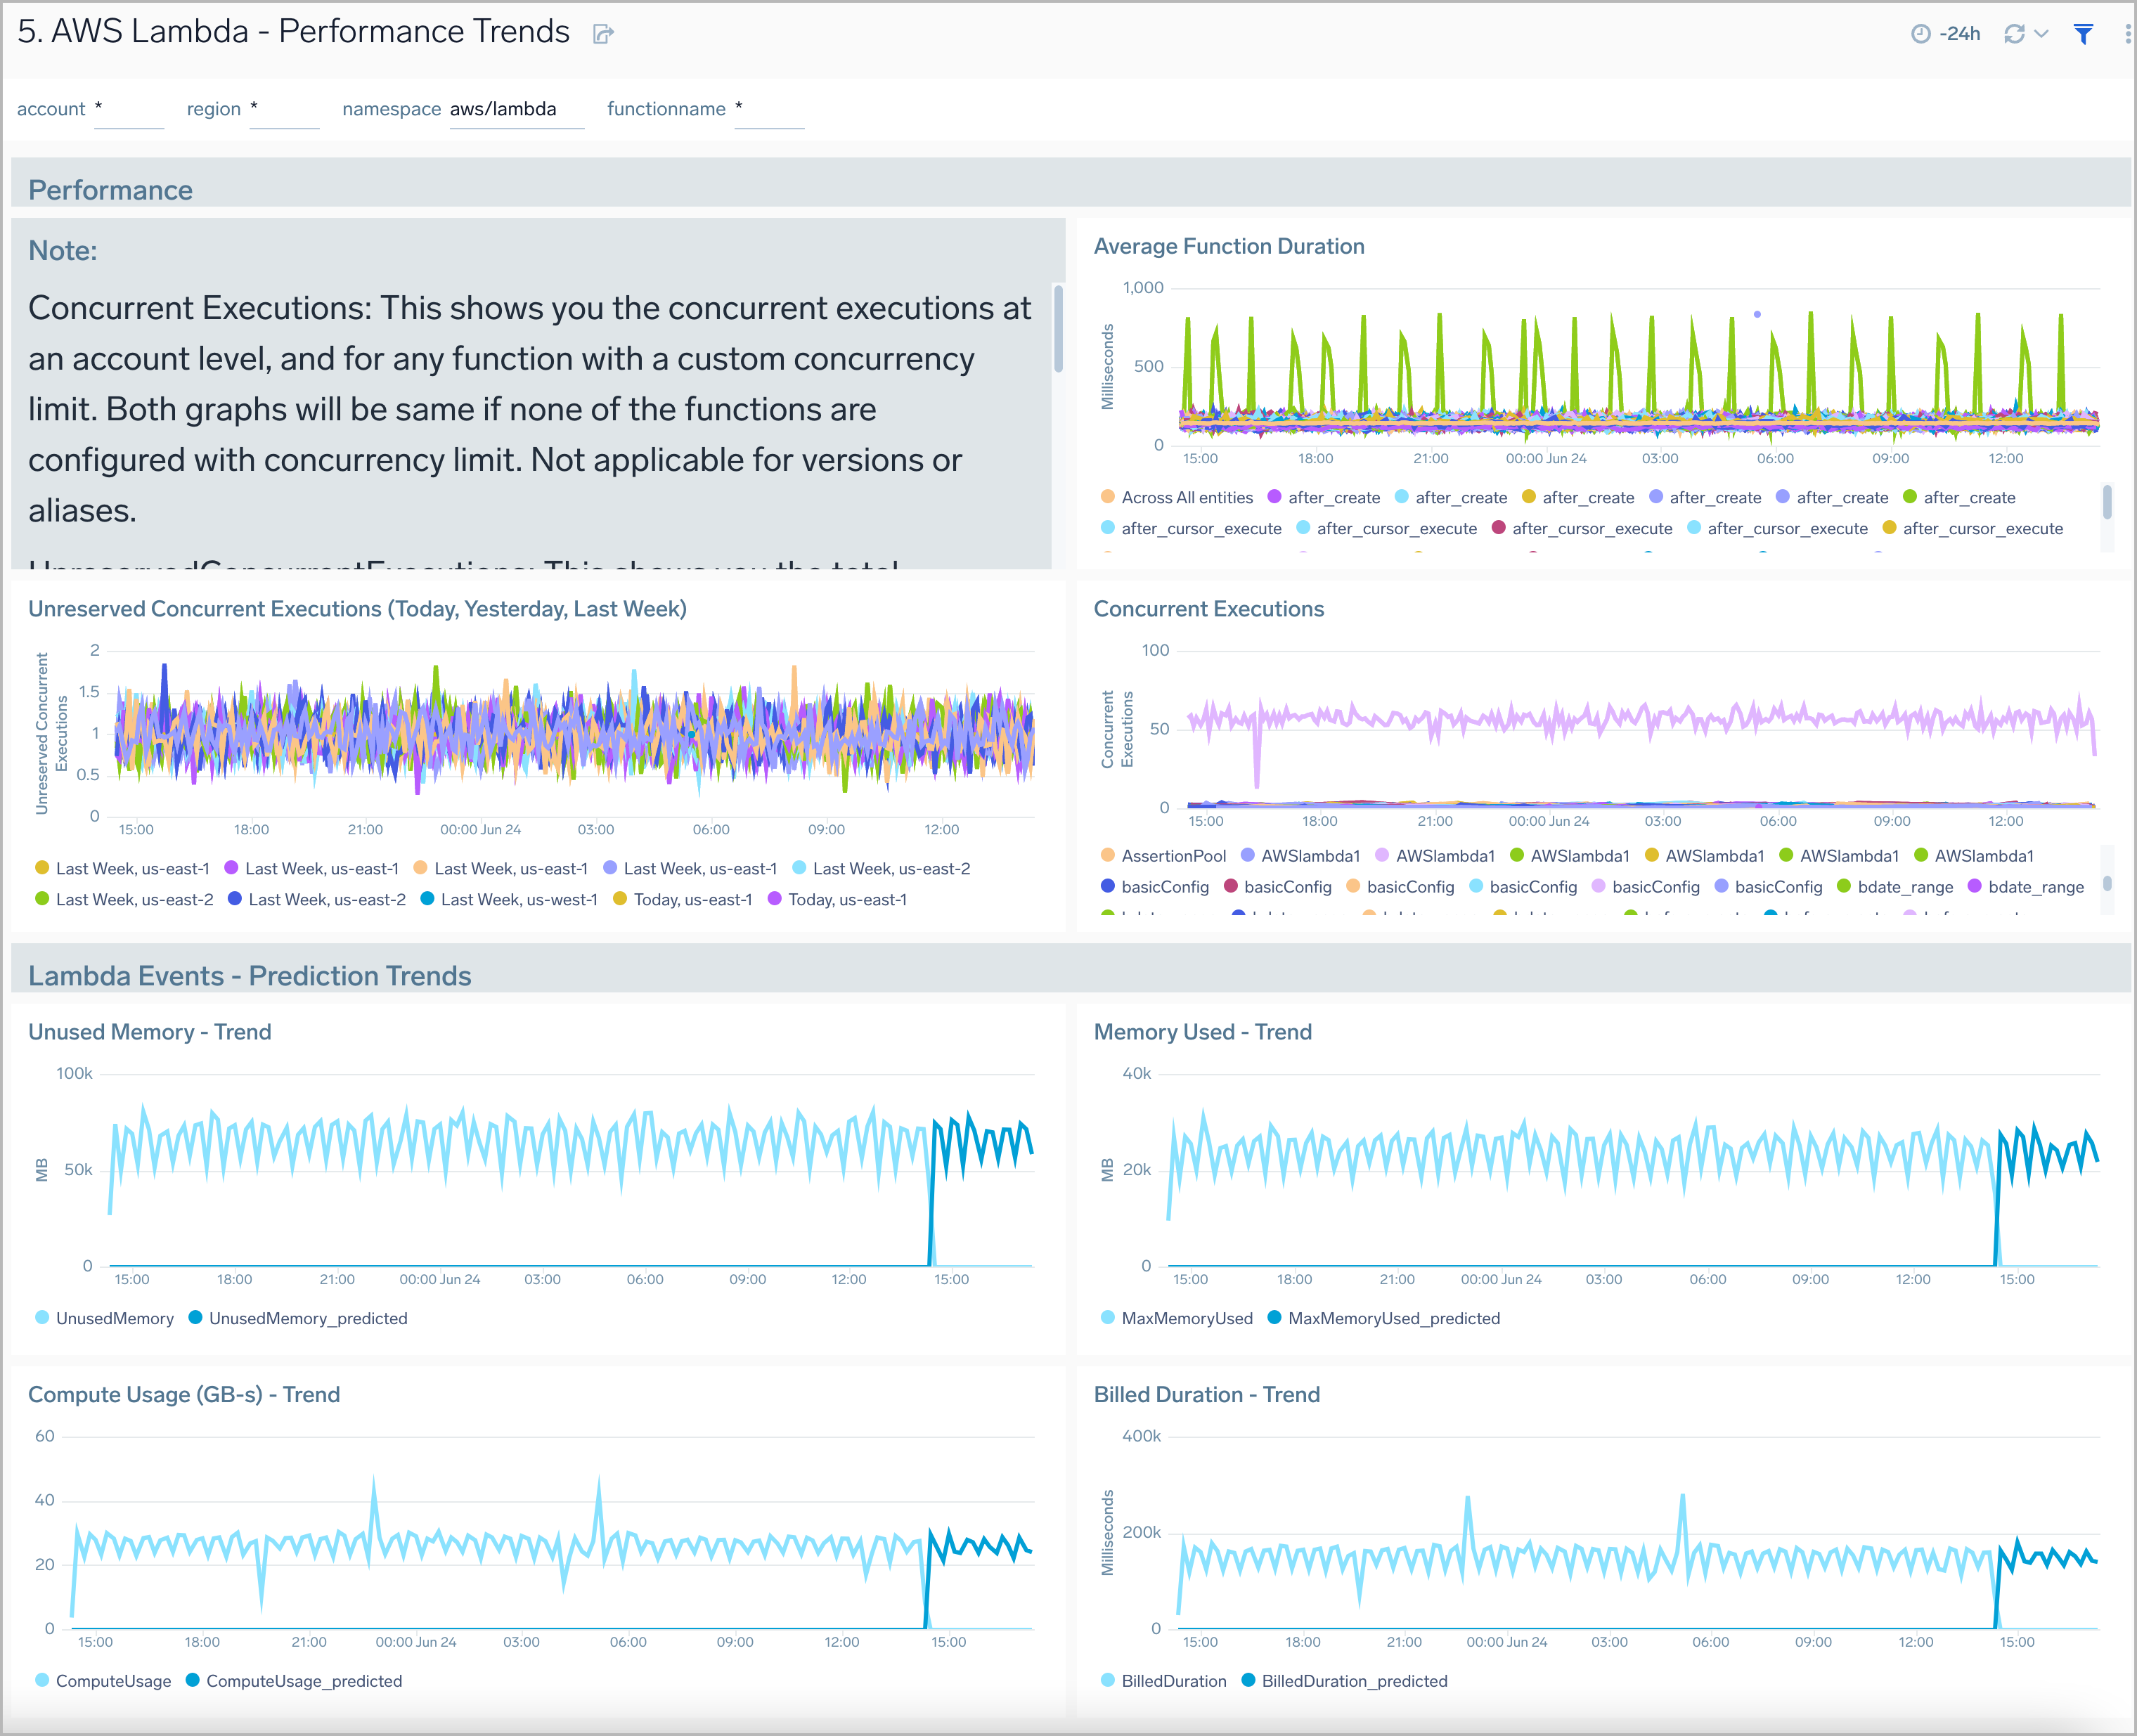
Performance Trends
AWS Lambda - Performance Trends dashboard displays log data analytics to provide insights on memory usage, function duration, recent request details, and compute usage.
Use this dashboard to:
- Monitor concurrent executions of an AWS Lambda function and understand trends over time.
- Monitor average AWS Lambda execution durations against wasted billed durations.
- Monitor memory used by AWS Lambda functions.
- Monitor compute usage trends and predictions by AWS Lambda function in GB-Seconds.
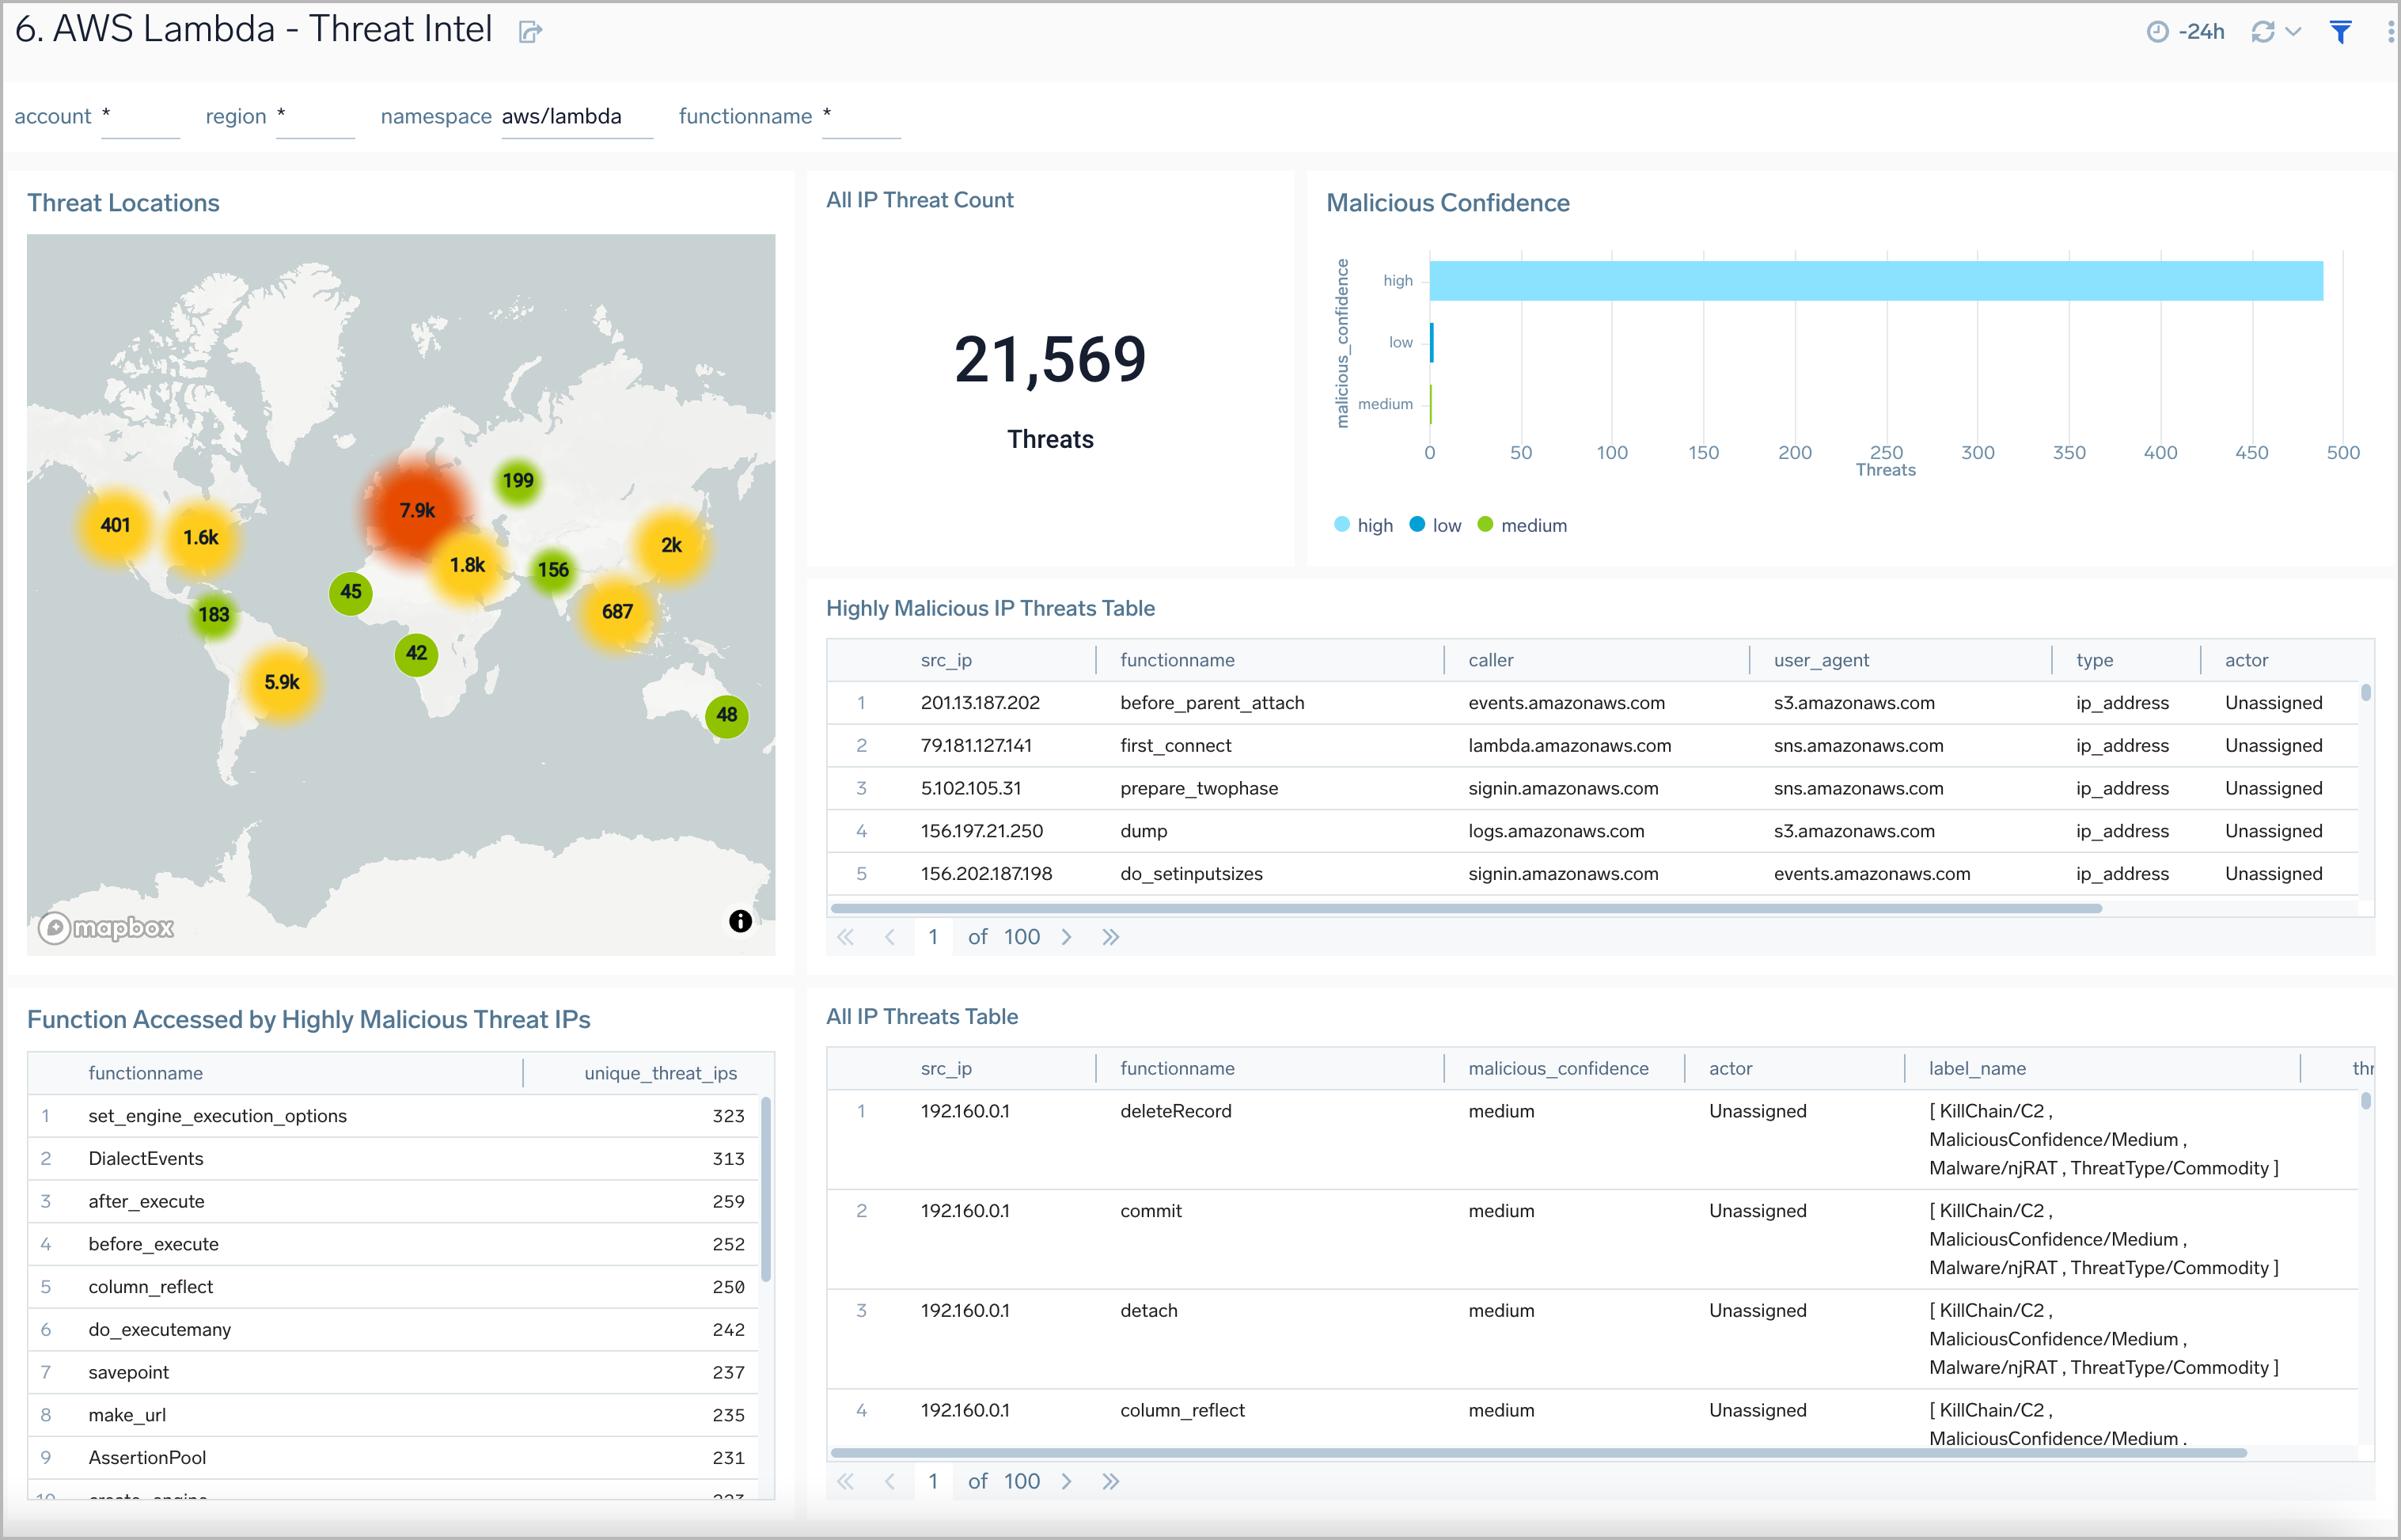
Threat Intel
AWS Lambda - Threat Intel dashboard provides insights into incoming requests to your AWS Lambda functions from malicious sources determined via Sumo Logic threat intelligence. Panels show detailed information on malicious IPs and the malicious confidence of each threat.
Use this dashboard to:
- Identify known malicious IPs that are accessing your load-balancers and use firewall access control lists to prevent them from sending you traffic going forward
- Monitor the malicious confidence level for all incoming malicious IP address threats.