AWS Network Load Balancer
AWS Network Load Balancer service is distributed in OSI Layer 4 (the network layer) traffic (TCP, UDP, TLS) and can handle over a million requests per second.
The Sumo Logic app for AWS Network Load Balancer is using metrics to provide insights to ensure that your network load-balancers are operating as expected, backend hosts are healthy, and to quickly identify errors.
Metric types
The AWS Network Load Balancer app uses AWS Network Load Balancer metrics.
Sample queries
account=* region=* LoadBalancer=* Namespace=aws/NetworkELB metric=ActiveFlowCount Statistic=Sum | sum by account, region, namespace, LoadBalancer
Collecting logs and metrics for the AWS Network Load Balancer
When you create an AWS Source, you'll need to identify the Hosted Collector you want to use or create a new Hosted Collector. Once you create an AWS Source, associate it with a Hosted Collector. For instructions, see Configure a Hosted Collector and Source.
Collect metrics
- Sumo Logic supports collecting metrics using two source types:
- Configure an AWS Kinesis Firehose for Metrics Source (recommended); or
- Configure an Amazon CloudWatch Source for Metrics
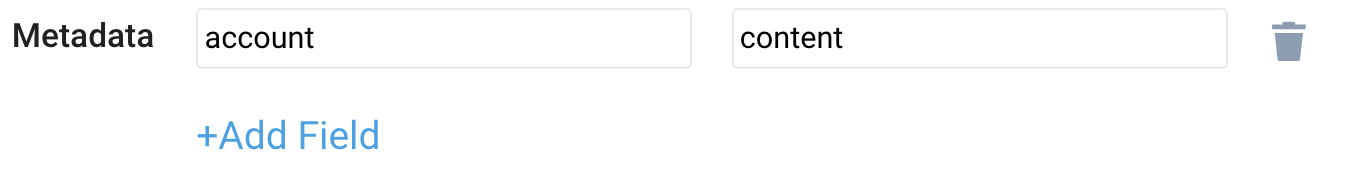
- Metadata. Click the +Add Field link to add custom log metadata fields. Define the fields you want to associate, each field needs a name (key) and value.
- Add an account field and assign it a value which is a friendly name / alias to your AWS account from which you are collecting logs. Logs can be queried via the “account field”.
- Keep in mind:
 A green circle with a check mark is shown when the field exists and is enabled in the Fields table schema.
 An orange triangle with an exclamation point is shown when the field doesn't exist, or is disabled in the Fields table schema. In this case, you'll see an option to automatically add or enable the nonexistent fields to the Fields table schema. If a field is sent to Sumo Logic but isn’t present or enabled in the schema, it’s ignored and marked as Dropped.
- Add an account field and assign it a value which is a friendly name / alias to your AWS account from which you are collecting logs. Logs can be queried via the “account field”.
Collect Cloudtrail logs
- Configure a Network Load Balancing (NLB) Cloudtrail Logs Source.
- Metadata. Click the +Add Field link to add custom log metadata fields. Define the fields you want to associate, each field needs a name (key) and value.
- Add an account field and assign it a value which is a friendly name / alias to your AWS account from which you are collecting logs. Logs can be queried via the “account field”.
- Keep in mind:
- A green circle with a check mark is shown when the field exists and is enabled in the Fields table schema.
- An orange triangle with an exclamation point is shown when the field doesn't exist, or is disabled in the Fields table schema. In this case, you'll see an option to automatically add or enable the nonexistent fields to the Fields table schema. If a field is sent to Sumo Logic but isn’t present or enabled in the schema, it’s ignored and marked as Dropped.
Namespace for AWS Network Load Balancer Service is AWS/NetworkELB.
Field in field schema
- New UI. In the main Sumo Logic menu select Data Management, and then under Logs select Fields. You can also click the Go To... menu at the top of the screen and select Fields.
Classic UI. In the main Sumo Logic menu, select Manage Data > Logs > Fields. - Search for the “networkloadbalancer” field.
- If not present, create it. Learn how to create and manage fields here.
Field Extraction Rule(s)
Create a Field Extraction Rule for AWS Network Load Balancer Cloudtrail Logs. Learn how to create Field Extraction Rule here.
AWS Network Load Balancer CloudTrail Logs
Rule Name: AwsObservabilityNLBCloudTrailLogsFER
Applied at: Ingest Time
Scope (Specific Data): account=* eventSource eventName "elasticloadbalancing.amazonaws.com" "2015-12-01"
json "eventSource", "awsRegion", "recipientAccountId", "requestParameters.name", "requestParameters.type", "requestParameters.loadBalancerArn", "apiVersion" as event_source, region, accountid, networkloadbalancer, loadbalancertype, loadbalancerarn, api_version nodrop
|"" as namespace
| where event_source = "elasticloadbalancing.amazonaws.com" and api_version matches "2015-12-01"
| parse field=loadbalancerarn ":loadbalancer/*/*/*" as balancertype, networkloadbalancer, f1 nodrop
| if(loadbalancertype matches "network", "aws/nlb", if(balancertype matches "net", "aws/nlb", namespace)) as namespace
| if(loadbalancertype matches "application", "aws/applicationelb", if(balancertype matches "app", "aws/applicationelb", namespace)) as namespace
| where namespace="aws/nlb" or isEmpty(namespace)
| toLowerCase(networkloadbalancer) as networkloadbalancer
| fields region, namespace, networkloadbalancer, accountid
Metric rules
Create the following Metric Rule for the AWS/NetworkELB namespace if not already created. Learn how to create a Metrics Rule here.
Rule name: AwsObservabilityNLBMetricsAddonEntityRule
Metric match expression: Namespace=AWS/NetworkELB LoadBalancer=*
Variable name: networkloadbalancer
Tag sequence: $LoadBalancer._1
Save it
Installing the AWS Network Load Balancer app
Now that you have set up a collection for AWS Network Load Balancer, install the Sumo Logic app to use the pre-configured dashboards that provide visibility into your environment for real-time analysis of overall usage.
To install the app:
- Select App Catalog.
- In the 🔎 Search Apps field, run a search for your desired app, then select it.
- Click Install App.
note
Sometimes this button says Add Integration.
- On the next configuration page, under Select Data Source for your App, complete the following fields:
- Data Source. Select one of the following options:
- Choose Source Category and select a source category from the list; or
- Choose Enter a Custom Data Filter, and enter a custom source category beginning with an underscore. For example,
_sourceCategory=MyCategory.
- Folder Name. You can retain the existing name or enter a custom name of your choice for the app.
- All Folders (optional). The default location is the Personal folder in your Library. If desired, you can choose a different location and/or click New Folder to add it to a new folder.
- Data Source. Select one of the following options:
- Click Next.
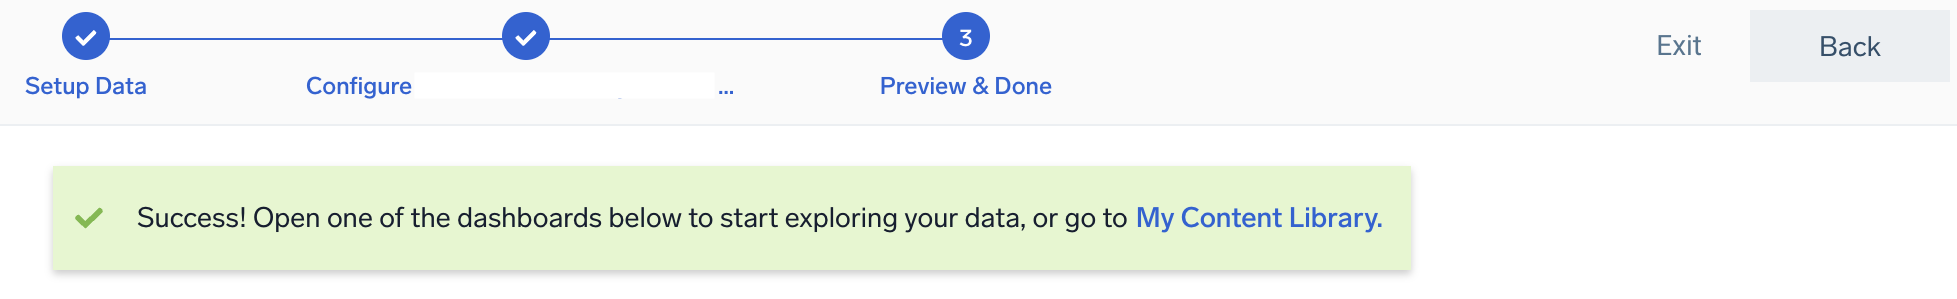
- Look for the dialog confirming that your app was installed successfully.
Post-installation
Once your app is installed, it will appear in your Personal folder or the folder that you specified. From here, you can share it with other users in your organization. Dashboard panels will automatically start to fill with data matching the time range query received since you created the panel. Results won't be available immediately, but within about 20 minutes, you'll see completed graphs and maps.
Viewing AWS Network Load Balancer dashboards
All dashboards have a set of filters that you can apply to the entire dashboard. Use these filters to drill down and examine the data to a granular level.
- You can change the time range for a dashboard or panel by selecting a predefined interval from a drop-down list, choosing a recently used time range, or specifying custom dates and times. Learn more.
- If required, configure the refresh interval rate for a dashboard or panel by clicking the drop-down arrow next to the refresh icon.
- Click the funnel icon in the dashboard top menu bar to filter dashboard with Template Variables.
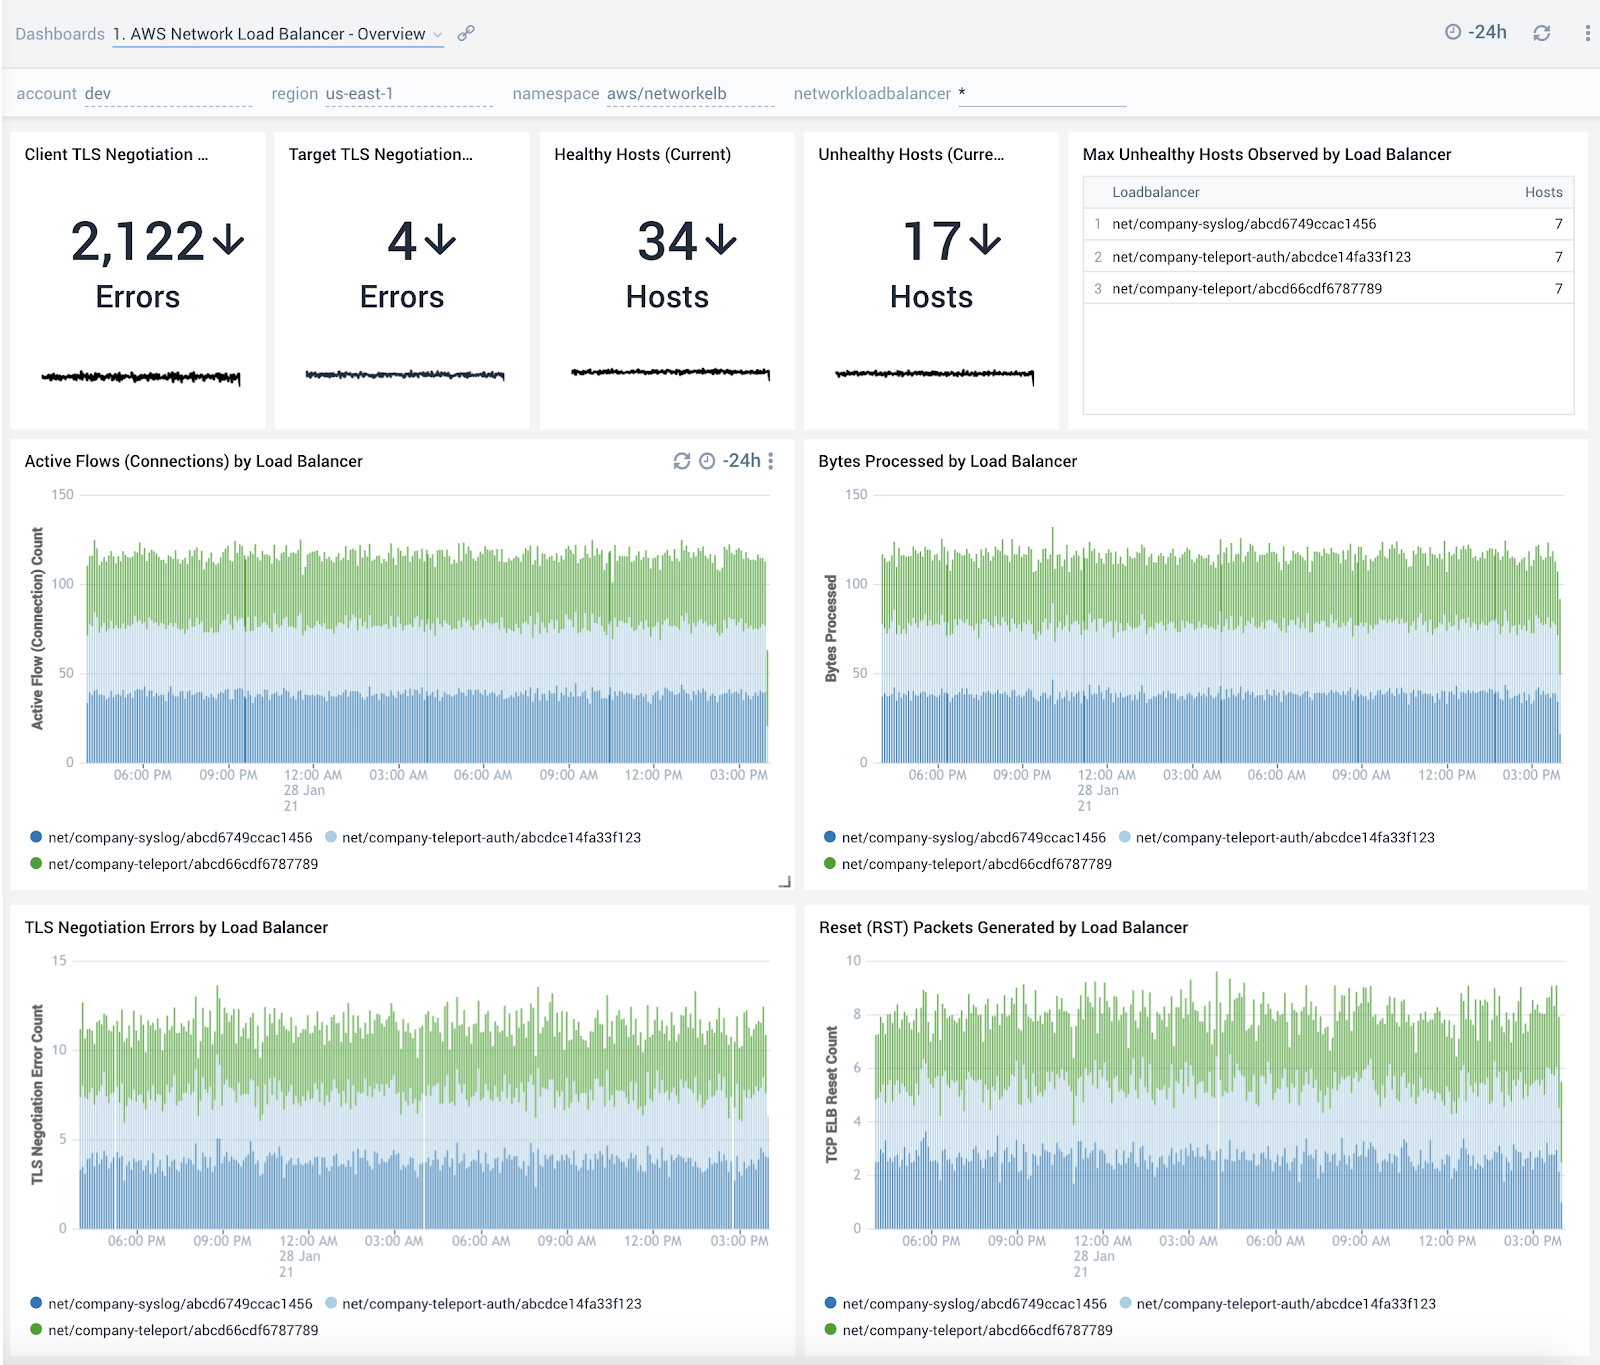
Overview
The The AWS Network Load Balancer - Overview dashboard provides detailed insights into a view of network utilization and performance. The dashboard provides information about the errors, health, and traffic handled by the load balancer.
Use this dashboard to:
- Get an at-a-glance view of the number of errors and status of backend hosts.
- Identify load balancers with the most number of unhealthy hosts.
- Monitor trends around active connections, bytes processed, and reset packets to ensure load balancers are operating as expected.
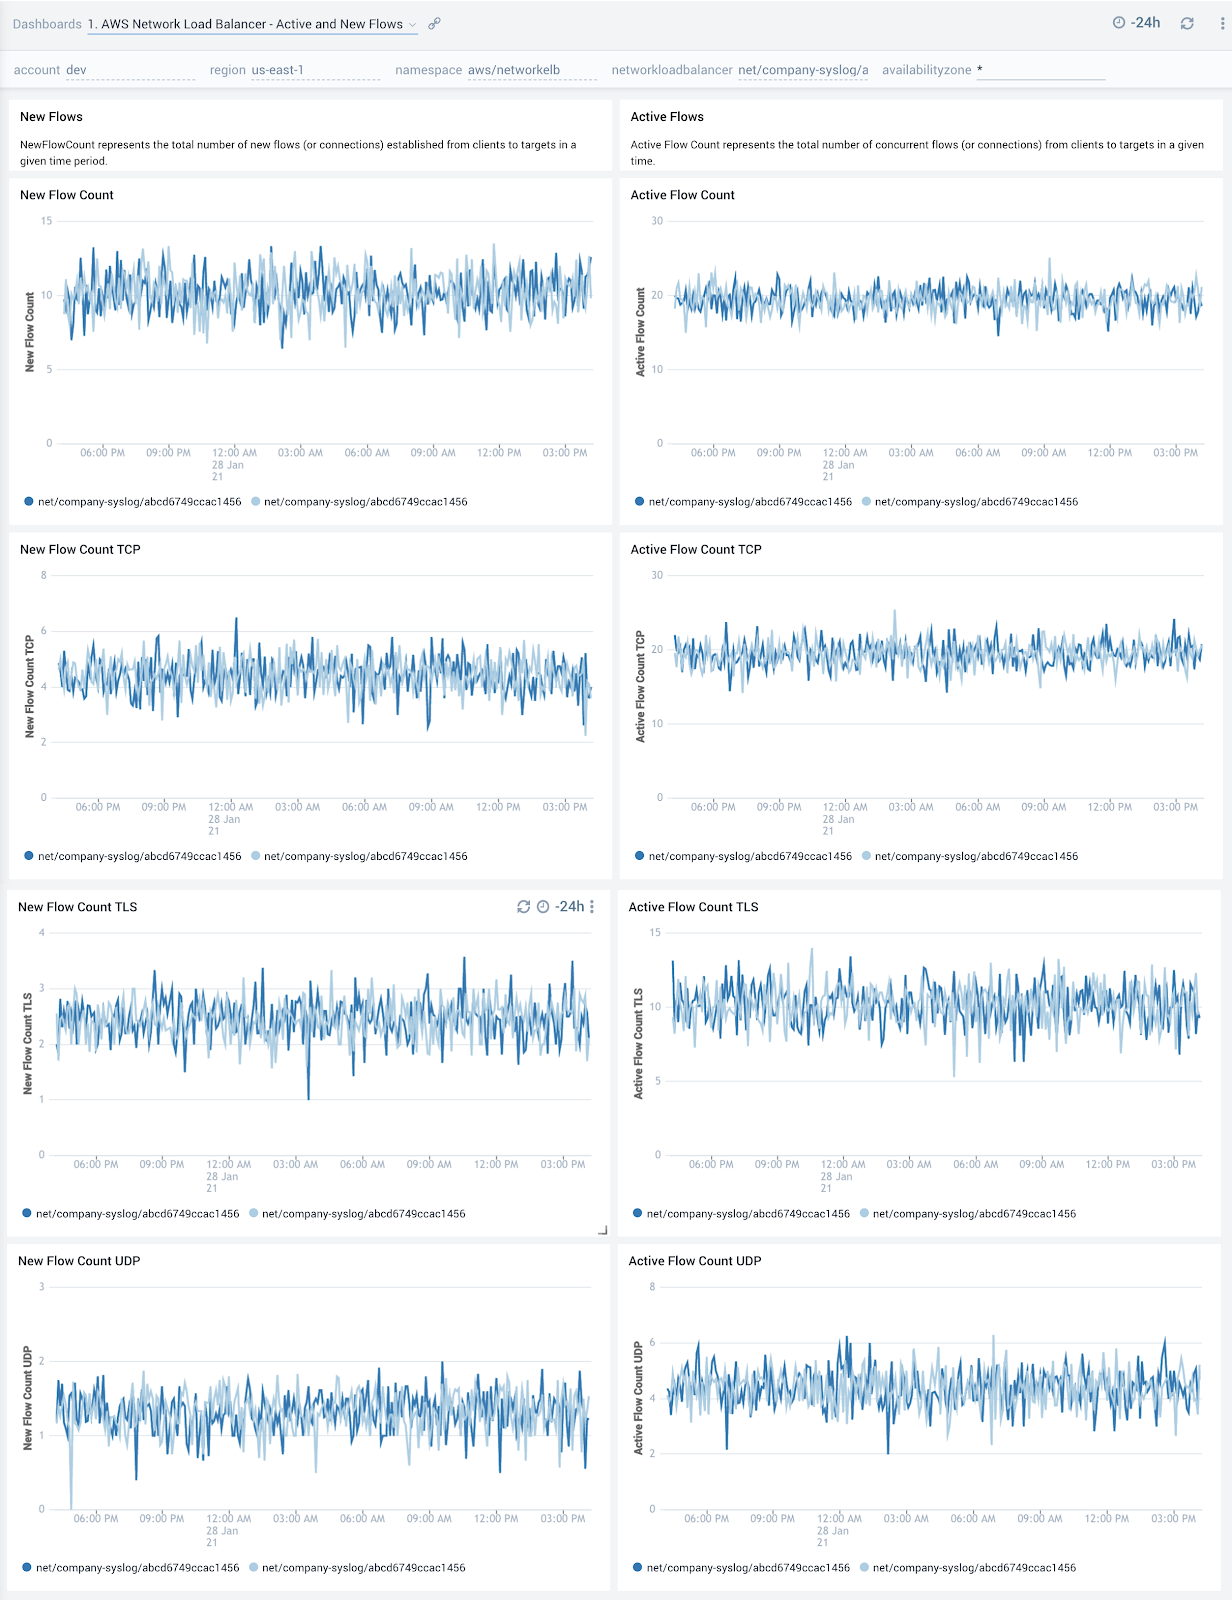
Active and New Flows
The AWS Network Load Balancer - Active and New Flows dashboard provides detailed insights for new flows, and active flows for TCP, TLS, and UDP traffic. Use this dashboard to to monitor trends around active and new flows (connections) to make sure they line up with expectations, then use this information to scale up/scale down backend hosts.
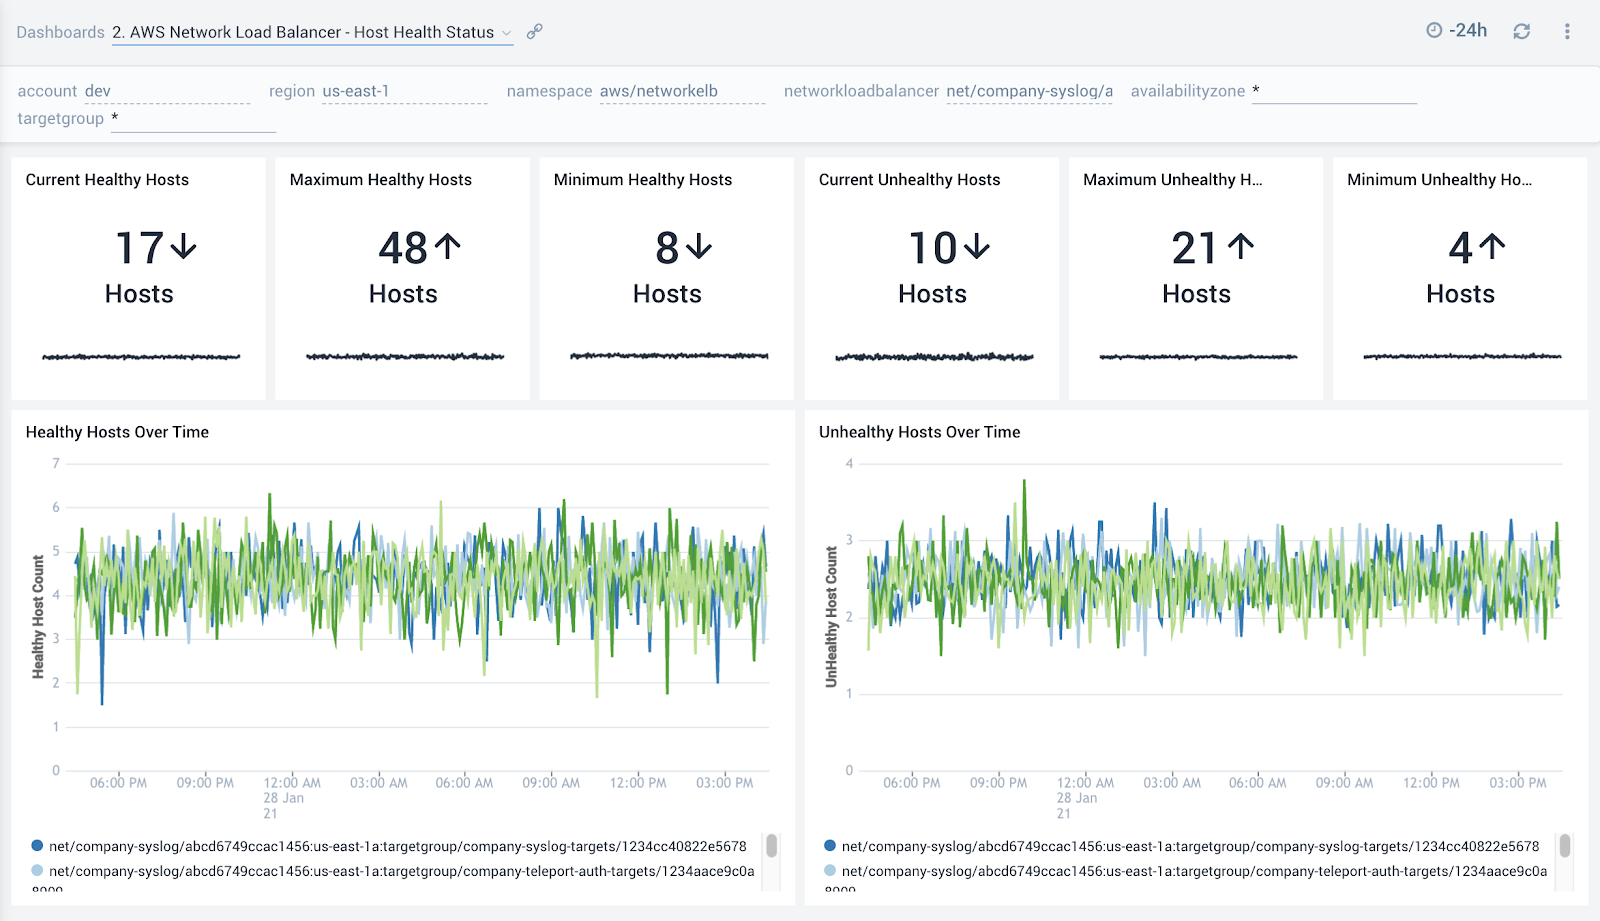
Host Health Status
The AWS Network Load Balancer - Host Health Status dashboard provides detailed insights into the number of healthy and unhealthy hosts.
Use this dashboard to:
- Get a quick overview of the number of healthy and unhealthy hosts.
- Monitor trends around the number of unhealthy hosts to spot potential service disruptions that could warrant deeper investigation.
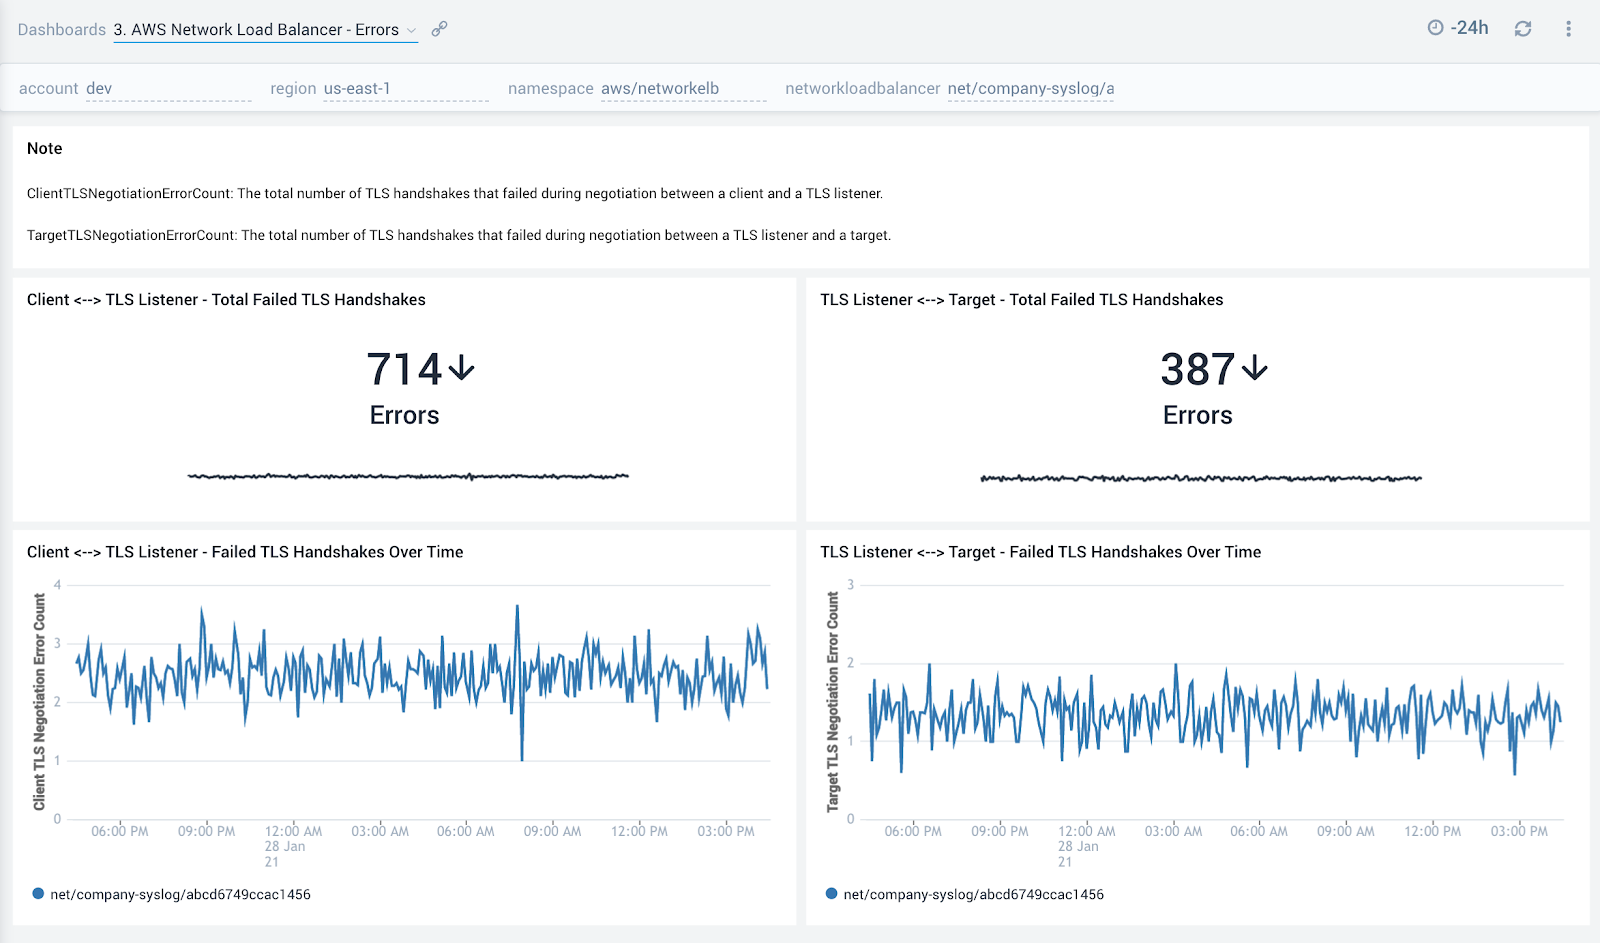
Errors
The AWS Network Load Balancer - Errors dashboard provides detailed insights into the errors reported by the network load balancer. This dashboard shows information for the total number of TLS handshakes that failed during negotiation between a client and a TLS listener, and the total number of TLS handshakes that failed during negotiation between a TLS listener and a target.
Use this dashboard to:
- Monitor TLS handshake errors during negotiation between a client and a TLS listener, which could happen if clients are sending an incorrect cipher or are using incorrect protocols not matching the one specified in the security policy. It’s recommended to use the most recent AWS CLI client version.
- Monitor TLS handshake errors during negotiation between a TLS listener and a target. Possible causes for this error include a mismatch of ciphers or protocols.
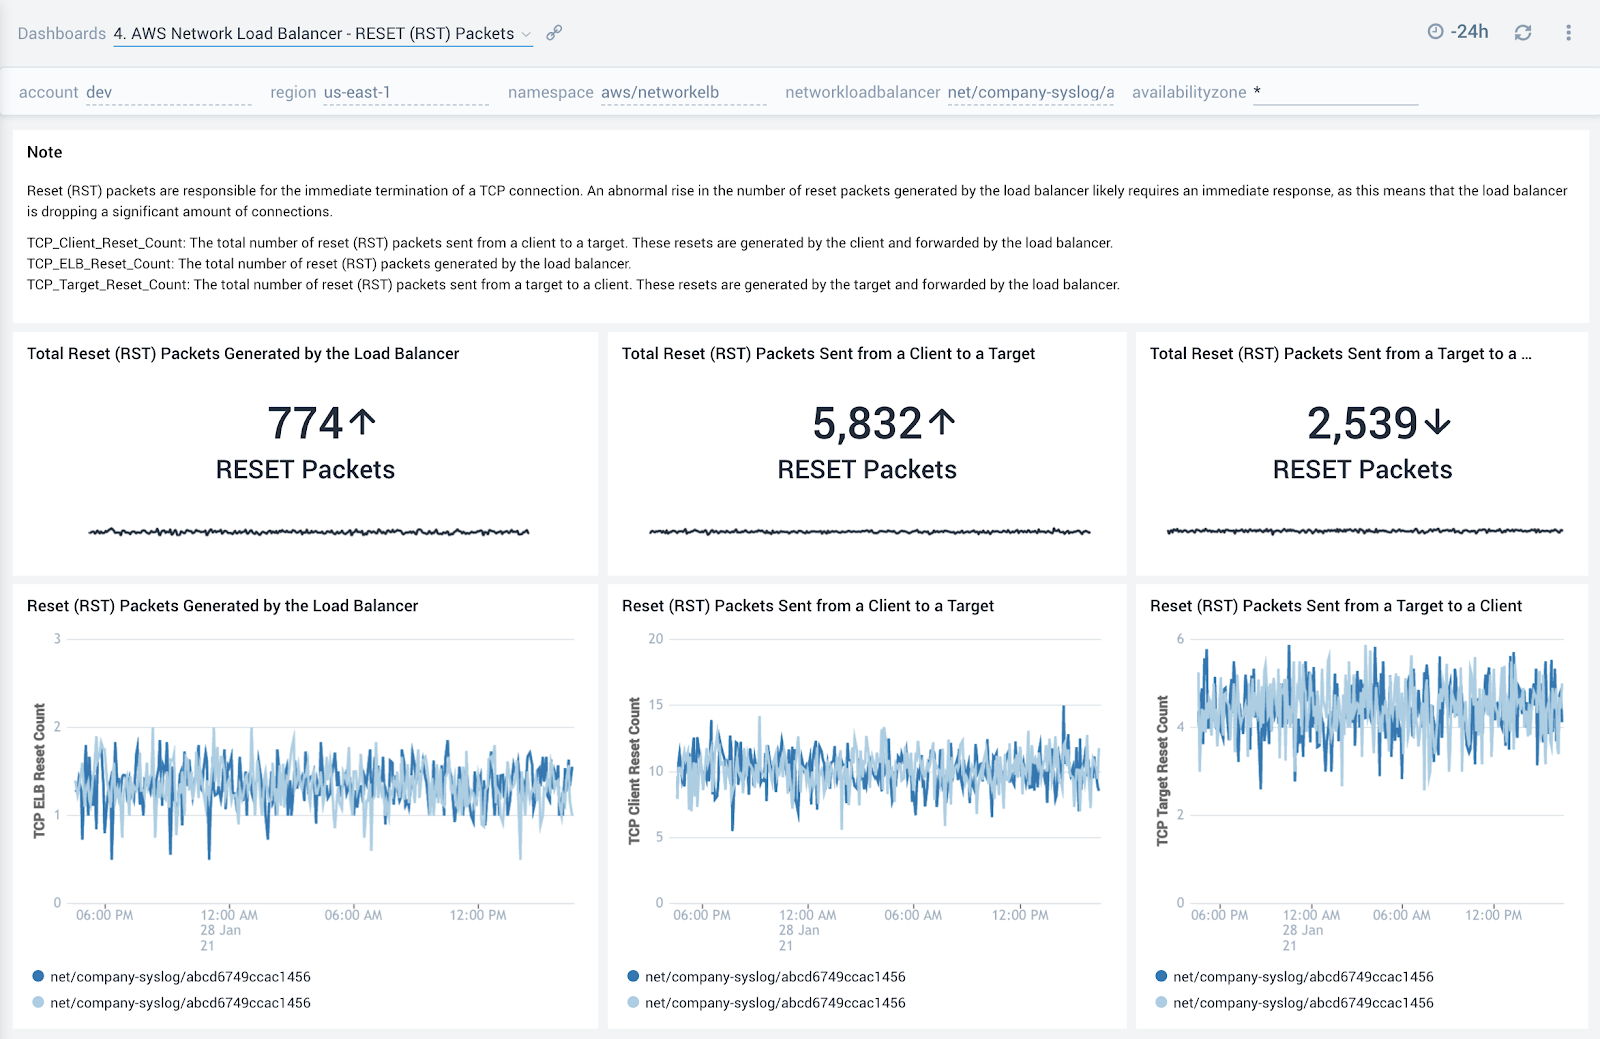
Reset (RST) Packets
The AWS Network Load Balancer - Reset (RST) Packets dashboard provides detailed insights into the number reset (RST) packets received by the network load balancer. The dashboard shows the information for the total number of reset (RST) packets sent from a client to a target , the total number of reset (RST) packets generated by the load balancer, and the total number of reset (RST) packets sent from a target to a client.
Use this dashboard to monitor the number of RST packets. A high number of reset packets could indicate connections are getting dropped and could mean a disruption in service.
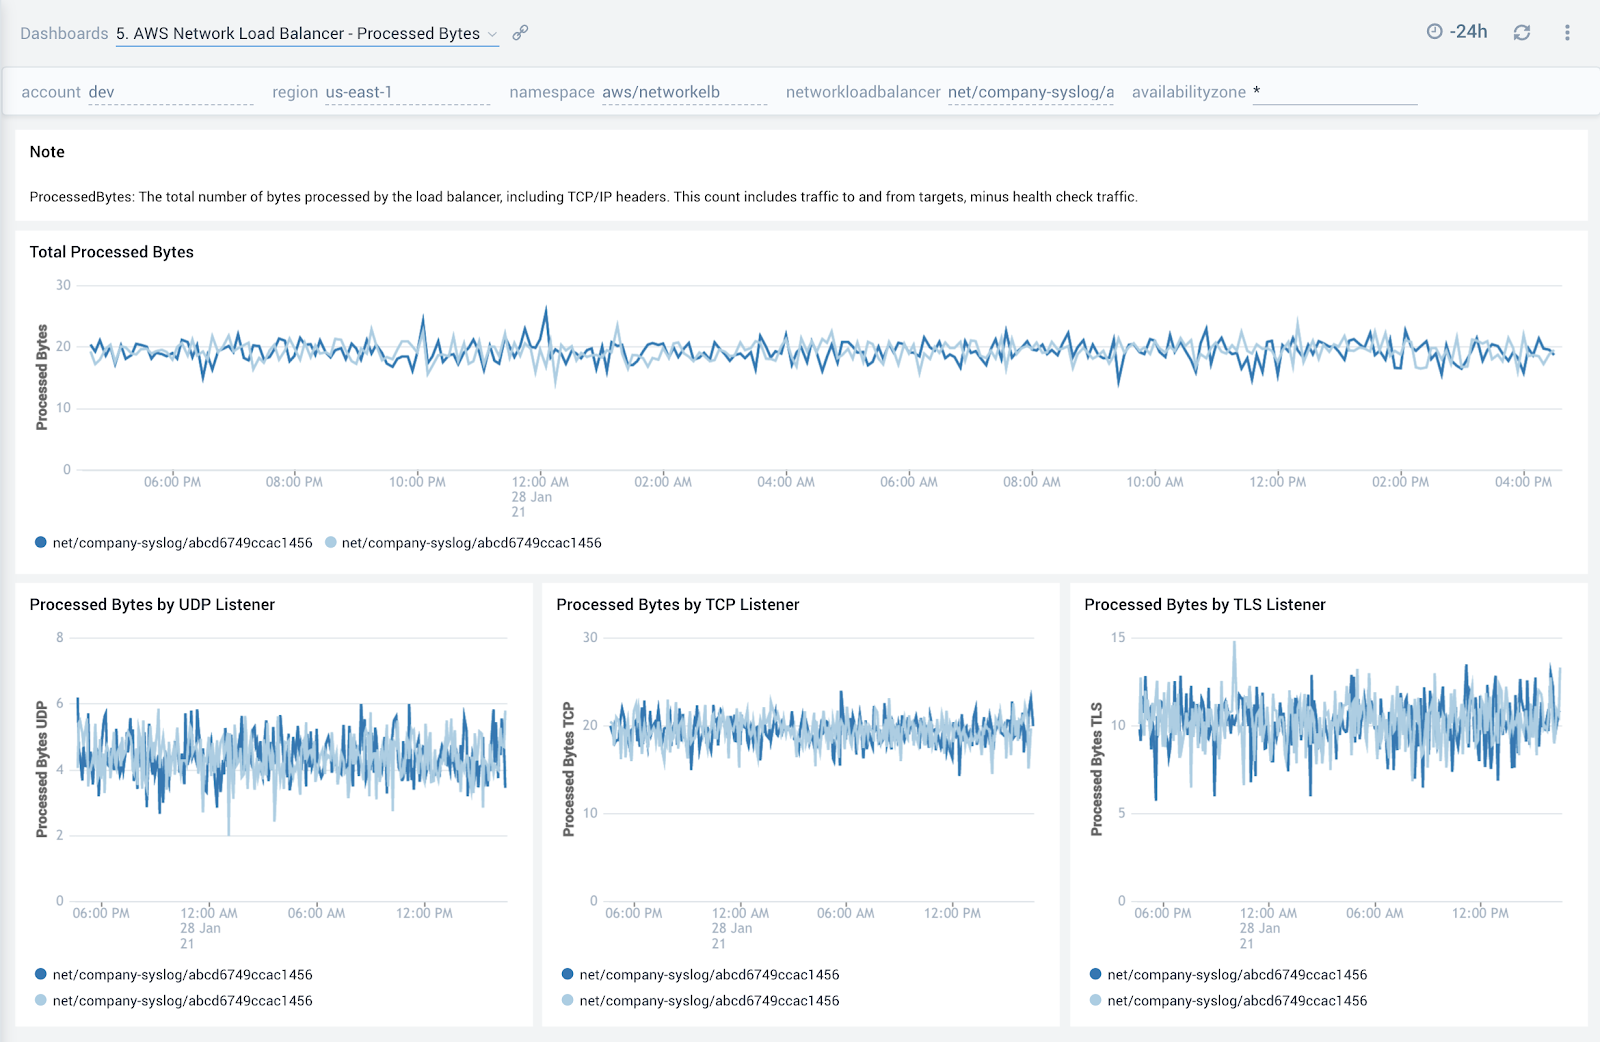
Processed Bytes
The AWS Network Load Balancer - Processed Bytes dashboard provides detailed insights into the amount of bytes processed by the load balancer for total, UDP, TCP and TLS traffic. Use this dashboard to monitor trends around processed bytes to make sure they line up with expectations and then use that information to scale up or scale down backend hosts.
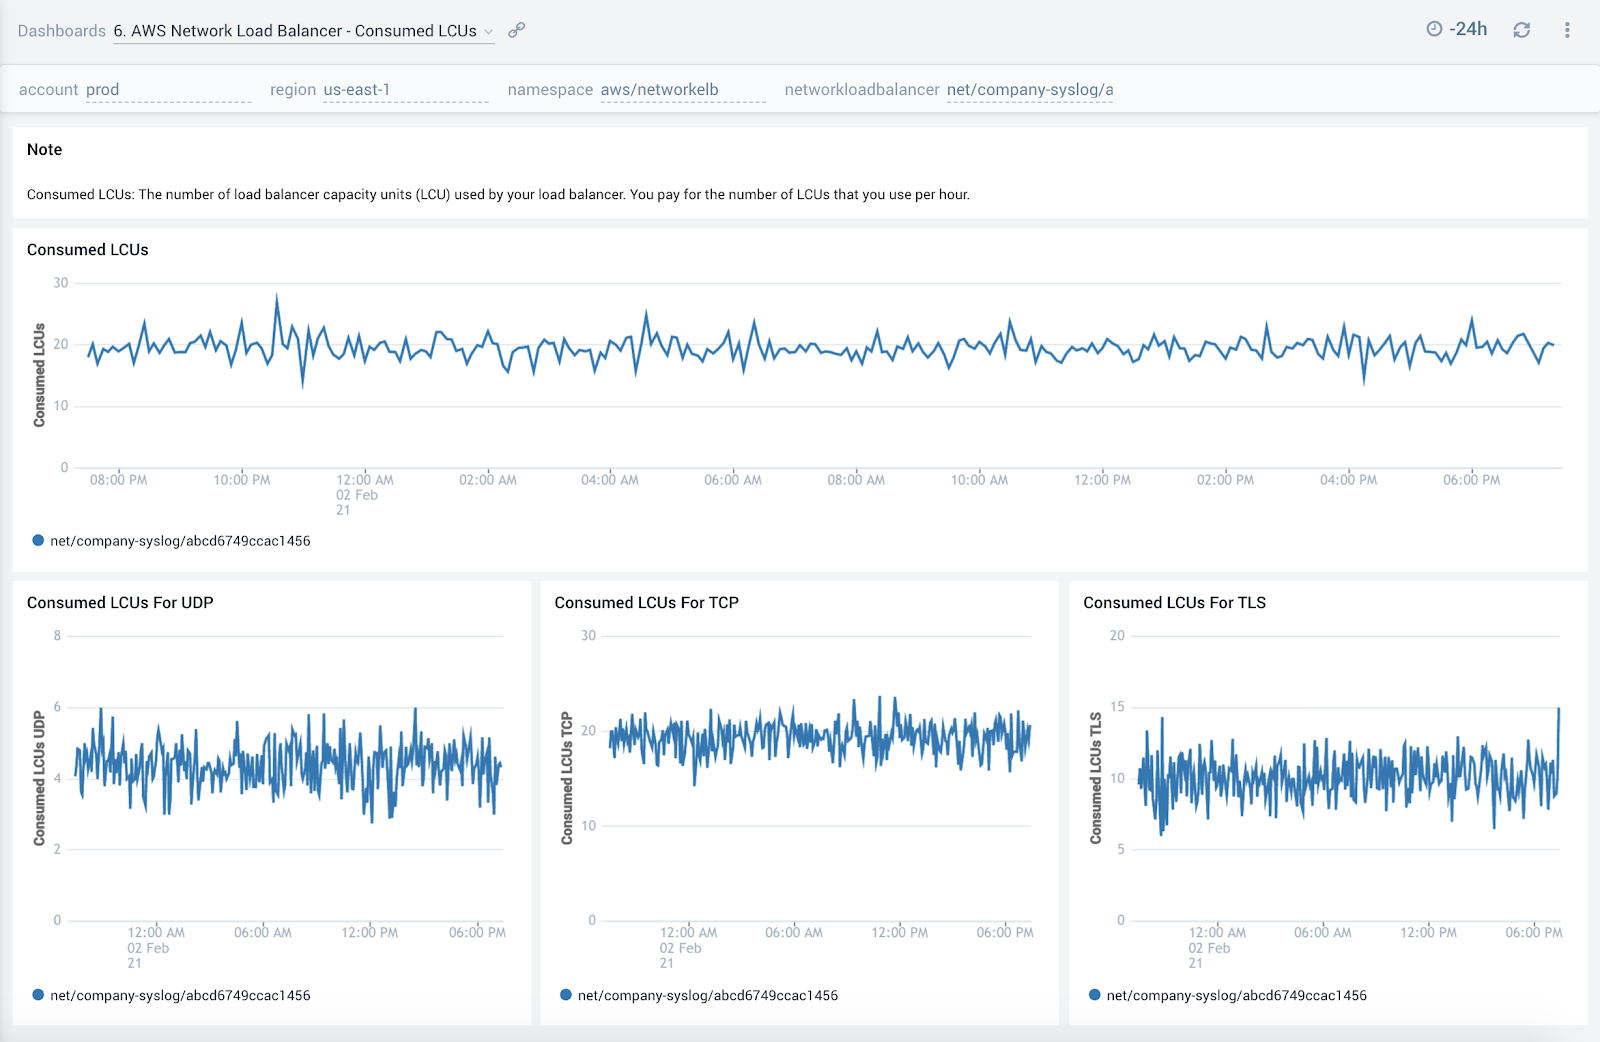
Consumed LCUs
The AWS Network Load Balancer - Consumed LCUs dashboard shows you the total number of load balancer capacity units (LCU) used by your load balancer by network protocol. Use this dashboard to optimize load balancer costs by monitoring trends around the number of load balancer capacity units (LCU) used by network protocol.
You pay for the number of LCUs that you use per hour.
CloudTrail Audit
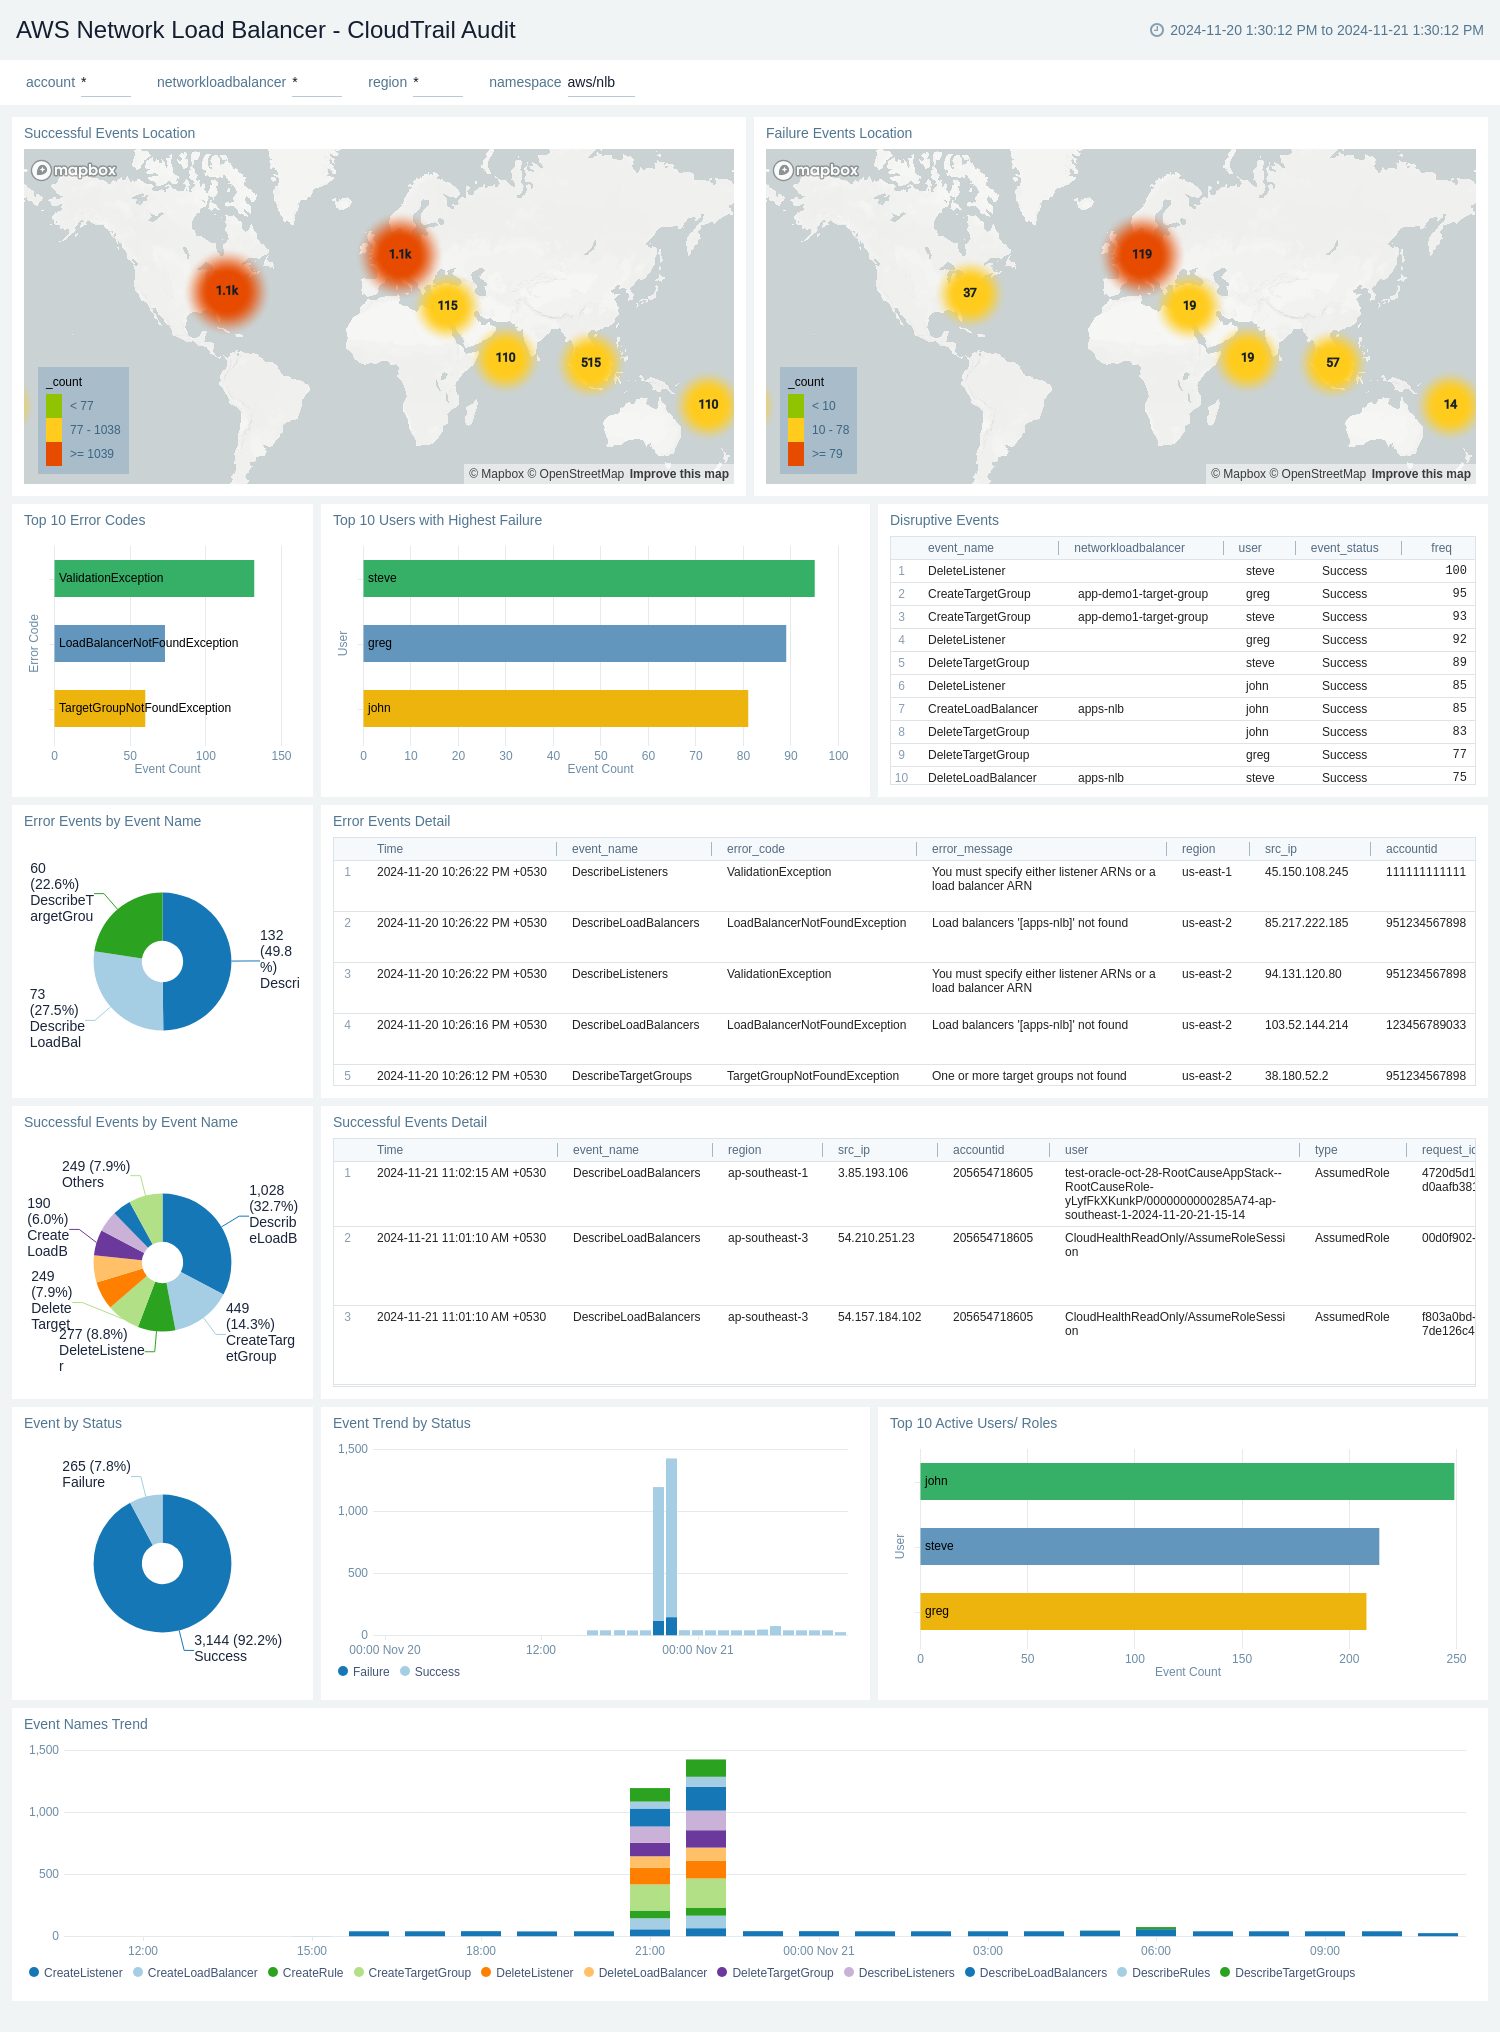
The AWS Network Load Balancer - CloudTrail Audit dashboard provides a comprehensive overview of AWS Network Load Balancer activities through CloudTrail audit logs. It visualizes successful and failed events globally, event trends, error details, and user activities, offering insights into load balancer performance, security, and usage patterns.
Use this dashboard to:
- Monitor the geographical distribution of successful and failed load balancer events, allowing for quick identification of regions with high activity or potential issues.
- Track the overall success rate of load balancer events and analyze trends over time, helping to identify any sudden changes or patterns in performance.
- Investigate specific error events, including their details, frequency, and associated users, enabling faster troubleshooting and resolution of issues.
- Identify the most common error types and the users experiencing highest failure rates, facilitating targeted improvements and user support.