Amazon Redshift ULM

Amazon Redshift is Amazon’s data warehousing service. The Sumo Logic app for Amazon Redshift ULM helps you monitor activity in Amazon Redshift. The app is a unified logs and metrics application with preconfigured dashboards provide insight into database connections, SQL command and statement execution, database user account events, CloudTrail events, and resource utilization by node and cluster.
Log types
The Amazon Redshift app uses the following log types:
- Amazon Redshift Audit Logs
- Amazon CloudTrail Event Logs
- Amazon Redshift Metrics
Sample log messages
dir="ltr">authenticated |Mon, 21 May 2018 01:38:01:601|::ffff:127.0.0.1 |32828 |15523|dev |rdsdb |password
 |0| | |0| | | |dir="ltr">authentication failure |Mon, 21 May 2018 05:20:10:123|::ffff:10.11.12.16 |66790
 |98031|vendor |himanshu |password |0|TLSv1.2 |ECDHE-RSA-AES256-SHA384 |0| | | |
'2018-05-21T06:00:09Z UTC [ db=prod_sales user=duc pid=99753 userid=95 xid=6728324 ]' LOG: create table SumoProdbackUp.organization as
 (select * from SumoProd.simpleuser)
'2018-05-21T06:00:09Z UTC [ db=vendor user=ankit pid=36616 userid=53 xid=2956702 ]' LOG: DELETE FROM SumoProd.employee WHERE id = 38;
'2018-05-21T06:20:09Z UTC [ db=dev user=himanshu pid=64458 userid=35 xid=5143208 ]' LOG: drop user testuser3
Click to expand. Amazon CloudTrail Redshift Log Sample.
{
  "eventVersion": "1.04",
  "userIdentity": {
    "type": "IAMUser",
    "principalId": "AIDA1234567890WUABG5Q",
    "arn": "arn:aws:iam::951234567838:user/Nitin",
    "accountId": "951234567838",
    "accessKeyId": "ASIA12345678UPV5IWTQ",
    "userName": "Nitin",
    "sessionContext": {
      "attributes": {
        "mfaAuthenticated": "true",
        "creationDate": "2018-05-11T14:08:12Z"
      }
    },
    "invokedBy": "signin.amazonaws.com"
  },
  "eventTime": "2018-05-11T17:37:06Z",
  "eventSource": "redshift.amazonaws.com",
  "eventName": "RebootCluster",
  "awsRegion": "us-west-1",
  "sourceIPAddress": "114.140.11.57",
  "userAgent": "signin.amazonaws.com",
  "requestParameters": {
    "clusterIdentifier": "sumologicdevbi"
  },
  "responseElements": {
    "nodeType": "dc2.large",
    "preferredMaintenanceWindow": "mon:10:00-mon:10:30",
    "clusterStatus": "rebooting",
    "clusterCreateTime": "Mar 13, 2018 4:49:17 AM",
    "vpcId": "vpc-4333942c",
    "enhancedVpcRouting": false,
    "endpoint": {
      "port": 5439,
      "address": "sumologicdev-bi.cklqobrc1234.us-west-1.redshift.amazonaws.com"
    },
    "masterUsername": "sumologicdevbi",
    "clusterSecurityGroups": [],
    "pendingModifiedValues": {},
    "dBName": "sumologicdevbi",
    "availabilityZone": "us-west-1c",
    "clusterVersion": "1.0",
    "encrypted": false,
    "publiclyAccessible": true,
    "tags": [],
    "clusterParameterGroups": [
      {
        "clusterParameterStatusList": [
          {
            "parameterApplyStatus": "pending-reboot",
            "parameterName": "spectrum_enable_enhanced_vpc_routing"
          },
          {
            "parameterApplyStatus": "pending-reboot",
            "parameterName": "enable_user_activity_logging"
          },
          {
            "parameterApplyStatus": "pending-reboot",
            "parameterName": "max_cursor_result_set_size"
          },
          {
            "parameterApplyStatus": "pending-reboot",
            "parameterName": "query_group"
          },
          {
            "parameterApplyStatus": "pending-reboot",
            "parameterName": "datestyle"
          },
          {
            "parameterApplyStatus": "pending-reboot",
            "parameterName": "extra_float_digits"
          },
          {
            "parameterApplyStatus": "pending-reboot",
            "parameterName": "search_path"
          },
          {
            "parameterApplyStatus": "pending-reboot",
            "parameterName": "statement_timeout"
          },
          {
            "parameterApplyStatus": "pending-reboot",
            "parameterName": "wlm_json_configuration"
          },
          {
            "parameterApplyStatus": "pending-reboot",
            "parameterName": "require_ssl"
          },
          {
            "parameterApplyStatus": "pending-reboot",
            "parameterName": "use_fips_ssl"
          }
        ],
        "parameterGroupName": "auditclusterparamgroup",
        "parameterApplyStatus": "pending-reboot"
      }
    ],
    "allowVersionUpgrade": true,
    "automatedSnapshotRetentionPeriod": 1,
    "numberOfNodes": 1,
    "vpcSecurityGroups": [
      {
        "status": "active",
        "vpcSecurityGroupId": "sg-1234d441"
      }
    ],
    "iamRoles": [
      {
        "iamRoleArn": "arn:aws:iam::951234567838:role/RedshiftS3ReadOnly",
        "applyStatus": "in-sync"
      }
    ],
    "clusterIdentifier": "sumologicdevbi",
    "clusterSubnetGroupName": "redshift"
  },
  "requestID": "ec7759c5-5541-11e8-947b-614ed503d341",
  "eventID": "4b0a0389-b04e-4553-8946-e71d0c3cfd46",
  "eventType": "AwsApiCall",
  "recipientAccountId": "951234567838"
}
Sample queries
dir="ltr">_sourceCategory=*/AWS/Redshift/Audit LOG
| parse regex "^\'(?<time>\d+\-\d+\-\d+T\d+:\d+:\d+Z \w+)\s+\[\s*(?<parameters>[^\]]+)\]\'\s+LOG:\s+(?<sqlstatement>[^;]*)"
| parse field=parameters "db=* user=* pid=* userid=* xid=*" as dbName, username, pid, userid, xid nodrop
| parse regex field = sqlstatement "^/\*(?:.|[\r\n])*?\*/\s+(?<command>\w+)\s*" nodrop
| parse regex field = sqlstatement "^(?<command>\w+)\s*" nodrop
| count as eventCount by username
| top 10 username by eventCount, username asc
Collecting logs and metrics for the Amazon Redshift ULM app
This section has instruction for setting up collection of logs and metrics for the Amazon Redshift ULM app.
Step 1. Plan source categories
Before you configure the log and metric sources for the Amazon Redshift app, decide on the source category you will assign to each. A hierarchical approach allows you to make use of wildcards when you perform searches. For example:
- For the AWS S3 source for Amazon Redshift Audit logs collection, you could specify a source category of
AWS/Redshift/Audit. - For the AWS CloudTrail source for Redshift CloudTrail Events, you could specify a source category of
AWS/CloudTrail. - For the AWS CloudWatch source for Redshift metrics, you could specify a source category of
AWS/Metric/Redshift.
Step 2. Enable Amazon Redshift Audit logging
In this step, you enable audit logging for Amazon Redshift.
-
Enable database audit logging. For background information, see Database Audit Logging. For instructions on enabling audit logging, see Configuring Auditing Using the Console.
-
Enable user activity logging. For the user activity log, you must also enable the
enable_user_activity_loggingdatabase parameter. If you enable only the audit logging feature, but not the associated parameter, the database audit logs will log information for only the connection log and user log, but not for the user activity log. Theenable_user_activity_loggingparameter is disabled (false) by default, but you can set it to true to enable the user activity log. For more information, see Amazon Redshift Parameter Groups.Create a new parameter group with required parameter values and then modify cluster to use the new parameter group. If you want to use an existing parameter group, you can modify it with AWS CLI. For more information, see Amazon Redshift Parameter Groups.
For information about connection logs and user logs, see STL_CONNECTION_LOG and STL_USERLOG in AWS help.
Step 3: Configure Amazon S3 source for Amazon Redshift Audit logs collection
- Configure a Hosted Collector.
- To your Hosted Collector, add an Amazon S3 Source.
- Name. Enter a name to display for the new Source.
- Description. Enter an optional description.
- S3 Region. Select the Amazon Region for your Redshift Audit Log S3 bucket.
- Bucket Name. Enter the exact name of your Redshift Audit Log S3 bucket.
- Path Expression. Enter the string that matches the S3 objects you'd like to collect. You can use a wildcard (*) in this string. (DO NOT use a leading forward slash. See Amazon Path Expressions.) The S3 bucket name is not part of the path. Don’t include the bucket name when you are setting the Path Expression.
- Source Category. AWS/Redshift/Audit
- Access Key ID and Secret Access Key. Enter your Amazon Access Key ID and Secret Access Key.
- Scan Interval. Use the default of 5 minutes. Alternately, enter the frequency Sumo Logic will scan your S3 bucket for new data.
- Enable Timestamp Parsing. Select the Extract timestamp information from log file entries check box.
- Time Zone. Select Ignore time zone from the log file and instead use, and select UTC from the dropdown.
- Timestamp Format. Select Automatically detect the format.
- Enable Multiline Processing. Select the Detect messages spanning multiple lines check box, and select Infer Boundaries.
- Click Save.
Step 4. Configure AWS CloudTrail source for Redshift CloudTrail Events
- Configure a Hosted Collector.
- To your Hosted Collector, add an AWS CloudTrail Source.
- Name. Enter a name to display for the new Source.
- Description. Enter an optional description.
- S3 Region. Select the Amazon Region for your CloudTrail Redshift S3 bucket.
-
- Bucket Name. Enter the exact name of your CloudTrail Redshift S3 bucket.
- Path Expression. Enter the string that matches the S3 objects you'd like to collect. You can use a wildcard (*) in this string. (DO NOT use a leading forward slash. See Amazon Path Expressions..)The S3 bucket name is not part of the path. Don’t include the bucket name when you are setting the Path Expression.
- Source Category. Enter a source category. For example, AWS/CloudTrail.
- Access Key ID and Secret Access Key. Enter your Amazon Access Key ID and Secret Access Key.
- Scan Interval. Use the default of 5 minutes. Alternately, enter the frequency Sumo Logic will scan your S3 bucket for new data.
- Enable Timestamp Parsing. Select the checkbox.
- Time Zone. Select Ignore time zone from log file and instead use, and select UTC.
- Timestamp Format. Select Automatically detect the format.
- Enable Multiline Processing. Select the checkbox, and select Infer Boundaries.
- Click Save.
Step 5: Configure AWS CloudWatch source for Redshift metrics
- Configure a Hosted Collector.
- Configure an AWS CloudTrail Source.
- Name. Enter a name to display for the new Source.
- Description. Enter an optional description.
- Regions. Select your Amazon Regions for Amazon Redshift.
- Namespaces. Select AWS/Redshift.
- Source Category. Enter a source category. For example, AWS/Metric/Redshift.
- Access Key ID and Secret Access Key. Enter your Amazon Access Key ID and Secret Access Key.
- Scan Interval. Use the default of 5 minutes, or enter the frequency Sumo Logic will scan your CloudWatch Sources for new data.
- Click Save.
Installing the Amazon Redshift ULM app
To install the app, do the following:
Next-Gen App: To install or update the app, you must be an account administrator or a user with Manage Apps, Manage Monitors, Manage Fields, Manage Metric Rules, and Manage Collectors capabilities depending upon the different content types part of the app.
- Select App Catalog.
- In the 🔎 Search Apps field, run a search for your desired app, then select it.
- Click Install App.
note
Sometimes this button says Add Integration.
- Click Next in the Setup Data section.
- In the Configure section of your respective app, complete the following fields.
- Field Name. If you already have collectors and sources set up, select the configured metadata field name (eg _sourcecategory) or specify other custom metadata (eg: _collector) along with its metadata Field Value.
- Click Next. You will be redirected to the Preview & Done section.
Post-installation
Once your app is installed, it will appear in your Installed Apps folder, and dashboard panels will start to fill automatically.
Each panel slowly fills with data matching the time range query received since the panel was created. Results will not immediately be available but will be updated with full graphs and charts over time.
Viewing Amazon Redshift ULM dashboards
All dashboards have a set of filters that you can apply to the entire dashboard. Use these filters to drill down and examine the data to a granular level.
- You can change the time range for a dashboard or panel by selecting a predefined interval from a drop-down list, choosing a recently used time range, or specifying custom dates and times. Learn more.
- You can use template variables to drill down and examine the data on a granular level. For more information, see Filtering Dashboards with Template Variables.
- Most Next-Gen apps allow you to provide the scope at the installation time and are comprised of a key (
_sourceCategoryby default) and a default value for this key. Based on your input, the app dashboards will be parameterized with a dashboard variable, allowing you to change the dataset queried by all panels. This eliminates the need to create multiple copies of the same dashboard with different queries.
Overview
See overviews of connections, user activity, CloudTrail events, and resource utilization.
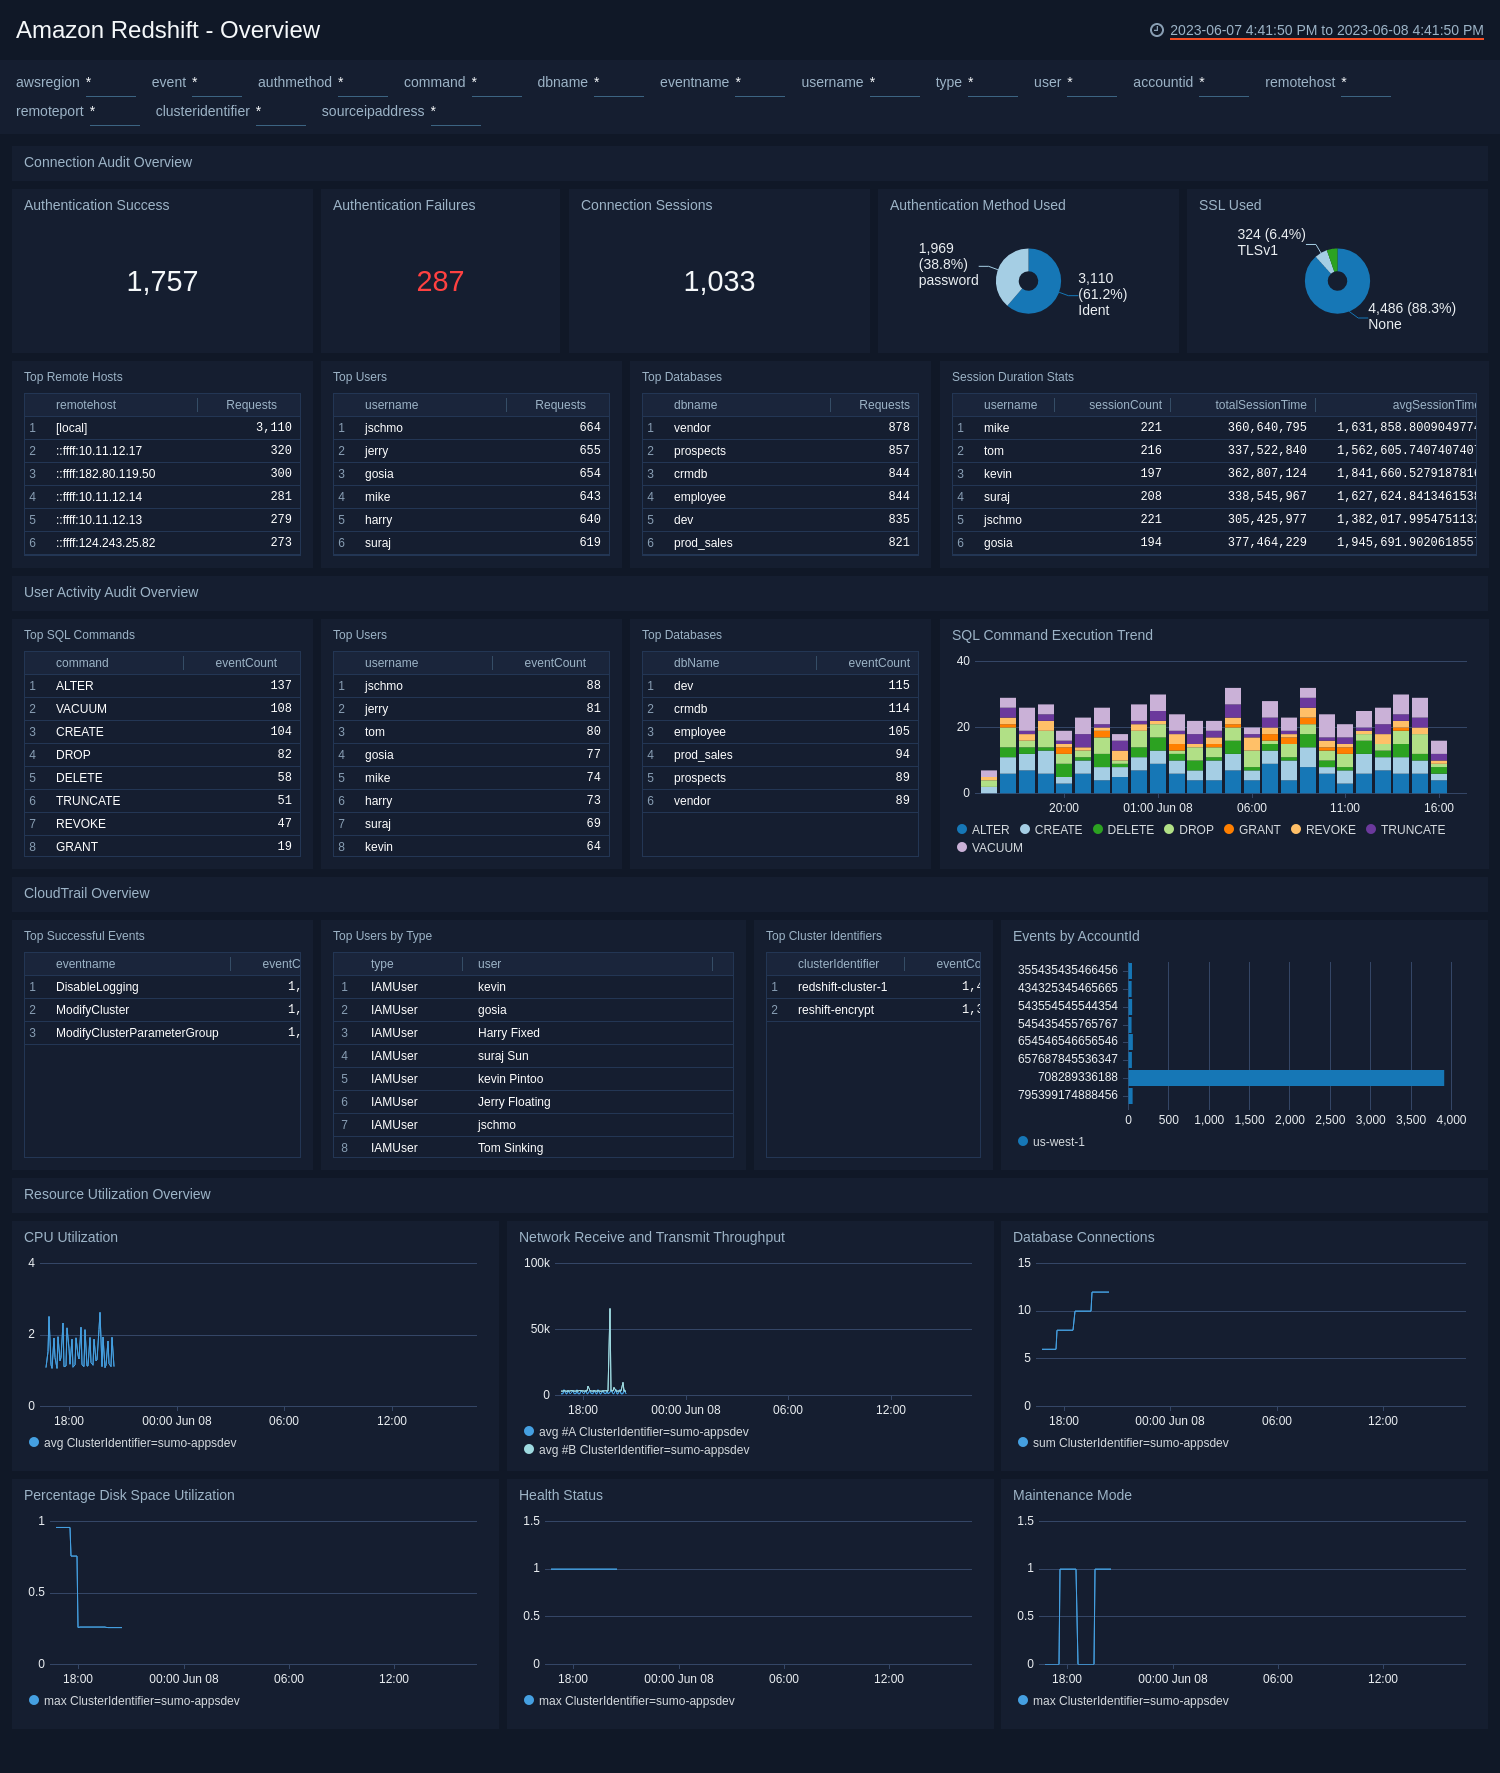
Authentication Success. Shows the total number of successful authentications in the last 24 hours.
Authentication Failures. Shows the total number of failed authentications in the last 24 hours.
Connection Sessions. Shows the total number of connection sessions in the last 24 hours.
Authentication Method Used. Shows a count of authentication methods used on a pie chart with a slice for each kind of method, for the last 24 hours.
SSL Used. Shows a count of SSLs used on a pie chart with a slice for each kind of SSL version, for the last 24 hours.
Top Remote Hosts. Shows a list of the top remote hosts along with the number of requests in the last 24 hours.
Top Users. Shows a list of the top users along with the number of requests in the last 24 hours.
Top Databases. Shows a list of the top databases along with the number of requests in the last 24 hours.
Session Duration Stats. Shows an aggregation table with statistics on the duration of sessions, along with username, session count, average session time, minimum session time, maximum session time, 90 percentile, and 95 percentile.
Top SQL Commands. Shows a list of the top SQL commands along with the number of events in the last 24 hours.
Top Users. Shows a list of the top users along with the number of events in the last 24 hours.
Top Databases. Shows a list of the top databases along with the number of events in the last 24 hours.
SQL Command Execution Trend. Shows trends in SQL commands executed on a column chart for the last 24 hours.
Top Successful Events. Shows a list of the top successful events along with the number of events in the last 24 hours.
Top Users by Type. Shows a list of the top users by type along with the type, user, number of events, and rank in the last 24 hours.
Top Cluster Identifiers. Shows a list of the top SQL commands along with the number of events in the last 24 hours.
Events by AccountId. Shows a count of events by account id on a bar chart, broken up into the type of events for the last 24 hours.
CPU Utilization. Shows trends in CPU utilization on a line chart for the last 24 hours.
Network Receive and Transmit Throughput. Shows trends in network throughput on a line chart for the last 24 hours.
Database Connections. Shows trends in database connections on a line chart for the last 24 hours.
Percentage Disk Space Utilization. Shows trends in percentage disk space utilization on a line chart for the last 24 hours.
Health Status. Shows trends in health status on a line chart for the last 24 hours.
Maintenance Mode. Shows trends in maintenance mode on a line chart for the last 24 hours.
Audit - Connection Log Analysis
See information about database connections, including authentication failure counts and trends; session statistics and details; and top remote hosts, users, databases, and applications.
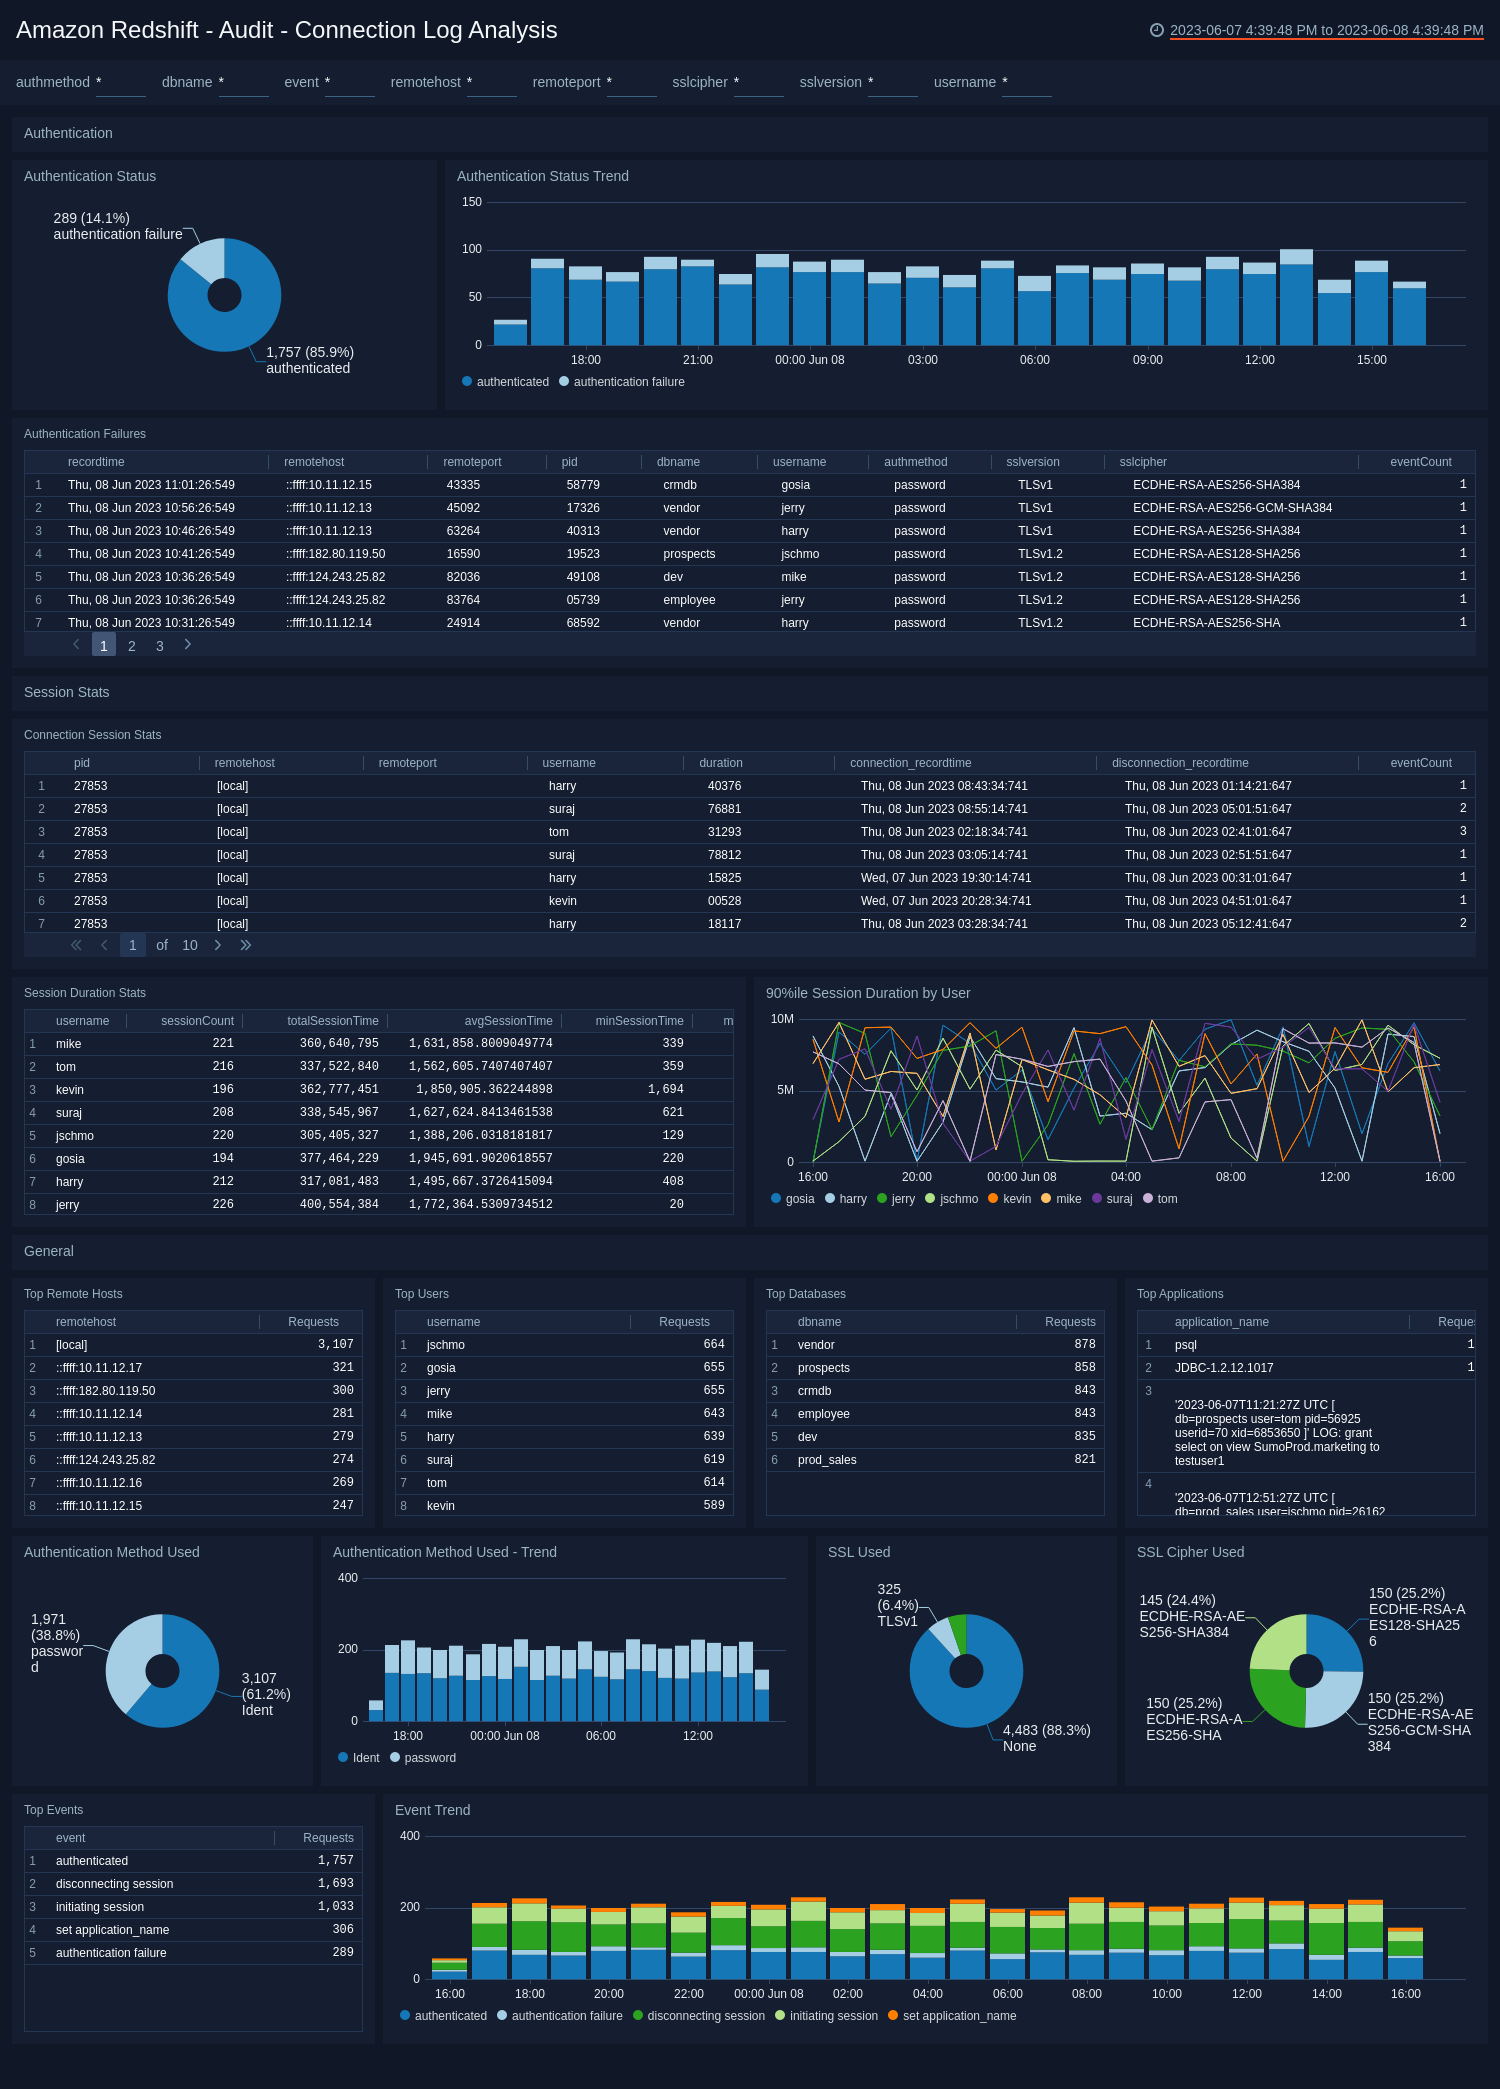
Authentication Status. Shows the statuses of authentications (successful/failed) on a pie chart for the last 24 hours.
Authentication Status Trend. Shows trends in authentication statuses (successful/failed) on a column chart for the last 24 hours.
Authentication Failures. Shows an aggregation table with failed authentications in the last three days, along with the time it was recorded, remote host, remote port, port id, database name, username, authentication method, ssl cipher, and event count.
Connection Session Stats. Shows an aggregation table with statistics on connection sessions in the last six hours, along with port id, remote host, remote port, username, duration of the connections, the time it was recorded connecting, the time it was recorded disconnecting, and the event count.
Session Duration Stats. Shows an aggregation table with statistics on the duration of sessions in the last 24 hours, along with username, sessions count, total session time, average sessions time, minimum session time, maximum session time, 90 percentile, and 95 percentile.
90%ile Session Duration by User. Shows a count of 90 percentile session time on a line chart with a different line for each user in the last 24 hours.
Top Remote Hosts. Shows a list of the top remote hosts along with the number of requests made in the last six hours.
Top Users. Shows a list of the top users along with the number of requests made in the last six hours.
Top Databases. Shows a list of the top databases along with the number of requests made in the last six hours.
Top Applications. Shows a list of the top applications along with the number of requests made in the last six hours.
Authentication Method Used. Shows a count of authentication methods used on a pie chart with a slice for each kind of method, for the last six hours.
Authentication Method Used - Trend. Shows trends in authentication methods used (password/identity) on a column chart for the last 24 hours.
SSL Used. Shows a count of SSLs used on a pie chart with a slice for each kind of SSL version, for the last six hours.
SSL Cipher Used. Shows a count of authentication methods used on a pie chart with a slice for each kind of SSL cipher used, for the last six hours.
Top Events. Shows a list of the top events along with the number of requests made in the last six hours.
Event Trend. Shows trends in events on a column chart with a count for each type of event for the last 24 hours.
Audit - User Activity Log Analysis
See information about SQL command and statement execution, including top databases, users, SQL statements and commands; and tabular listings of the top 20 delete, truncate, vacuum, create, grant, drop, revoke, and alter command executions.
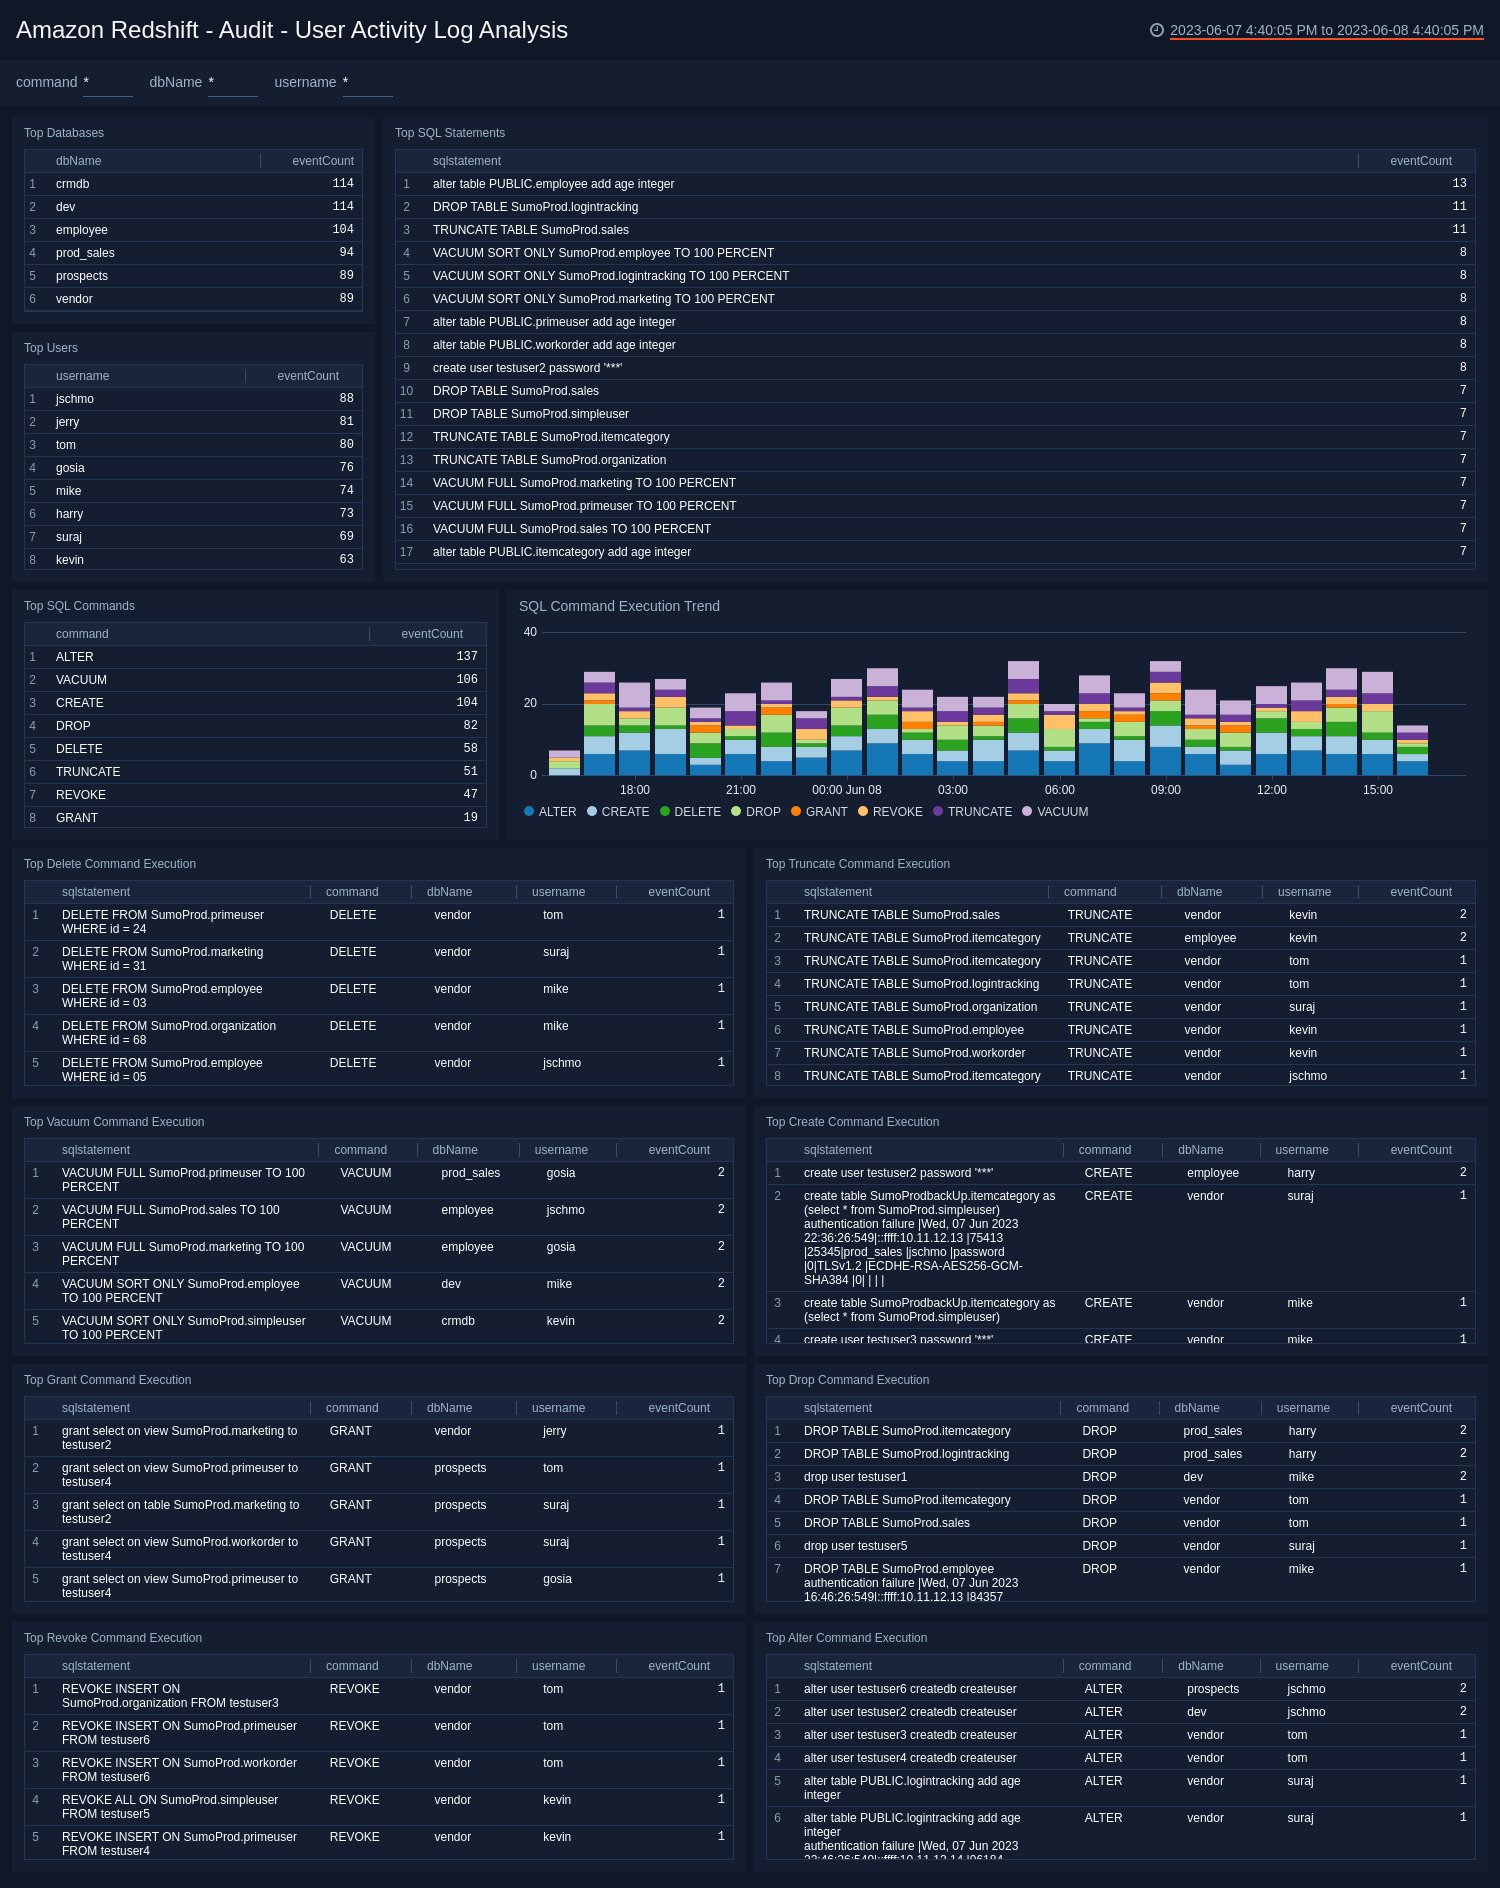
Top Databases. Shows a list of the top databases along with the number of events in the last 24 hours.
Top SQL Statements. Shows a list of the top SQL statements along with the number of events in the last 24 hours.
Top Users. Shows a list of the top users along with the number of events in the last 24 hours.
Top SQL Commands. Shows a list of the top SQL commands along with the number of events in the last 24 hours.
SQL Command Execution Trend. Shows trends in SQL commands executed on a column chart for the last 24 hours.
Top Delete Command Execution. Shows an aggregation table with the top delete commands in the last 24 hours, along with the sql statement, command, database name, and event count.
Top Truncate Command Execution. Shows an aggregation table with the top truncate commands in the last 24 hours, along with the sql statement, command, database name, and event count.
Top Vacuum Command Execution. Shows an aggregation table with the top vacuum commands in the last 24 hours, along with the sql statement, command, database name, and event count.
Top Create Command Execution. Shows an aggregation table with the top create commands in the last 24 hours, along with the sql statement, command, database name, and event count.
Top Grant Command Execution. Shows an aggregation table with the top grant commands in the last 24 hours, along with the sql statement, command, database name, and event count.
Top Drop Command Execution. Shows an aggregation table with the top drop commands in the last 24 hours, along with the sql statement, command, database name, and event count.
Top Revoke Command Execution. Shows an aggregation table with the top revoke commands in the last 24 hours, along with the sql statement, command, database name, and event count.
Top Alter Command Execution. Shows an aggregation table with the top alter commands in the last 24 hours, along with the sql statement, command, database name, and event count.
Audit - User Log Analysis
See information about database user account events, including database user database accounts that were created, dropped, or altered.
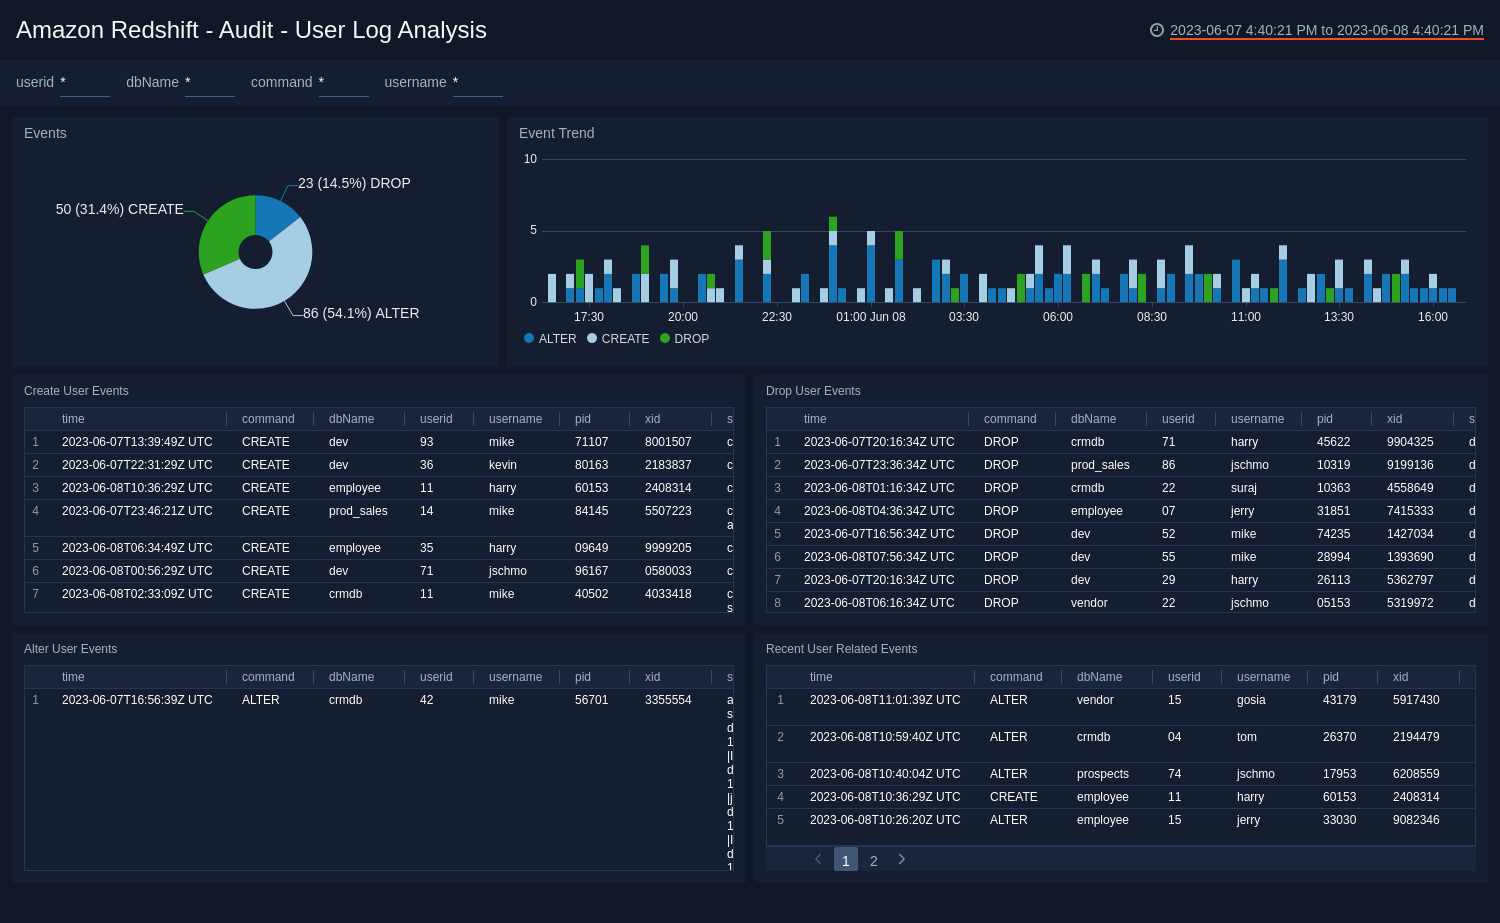
Events. Shows the events executed (drop/alter/create) on a pie chart for the last 24 hours.
Event Trend. Shows trends in events on a column chart with a count for each type of event for the last 24 hours.
Create User Events. Shows an aggregation table with user creation events in the last 24 hours, along with time, command, database name, username, port id, x id, sql statement, and a count of events.
Drop User Events. Shows an aggregation table with drop user events in the last 24 hours, along with time, command, database name, username, port id, x id, sql statement, and a count of events.
Alter User Events. Shows an aggregation table with alter user events in the last 24 hours, along with time, command, database name, username, port id, x id, sql statement, and a count of events.
Recent User Related Events. Shows an aggregation table with all user related events in the last 24 hours, along with time, command, database name, username, port id, x id, sql statement, and a count of events.
CloudTrail Events Overview
See information about CloudTrail events for Amazon Redshift, including event locations and event status and trend; event counts by event name, cluster, account ID, region, and user agent; and failed event locations, error codes, and details.
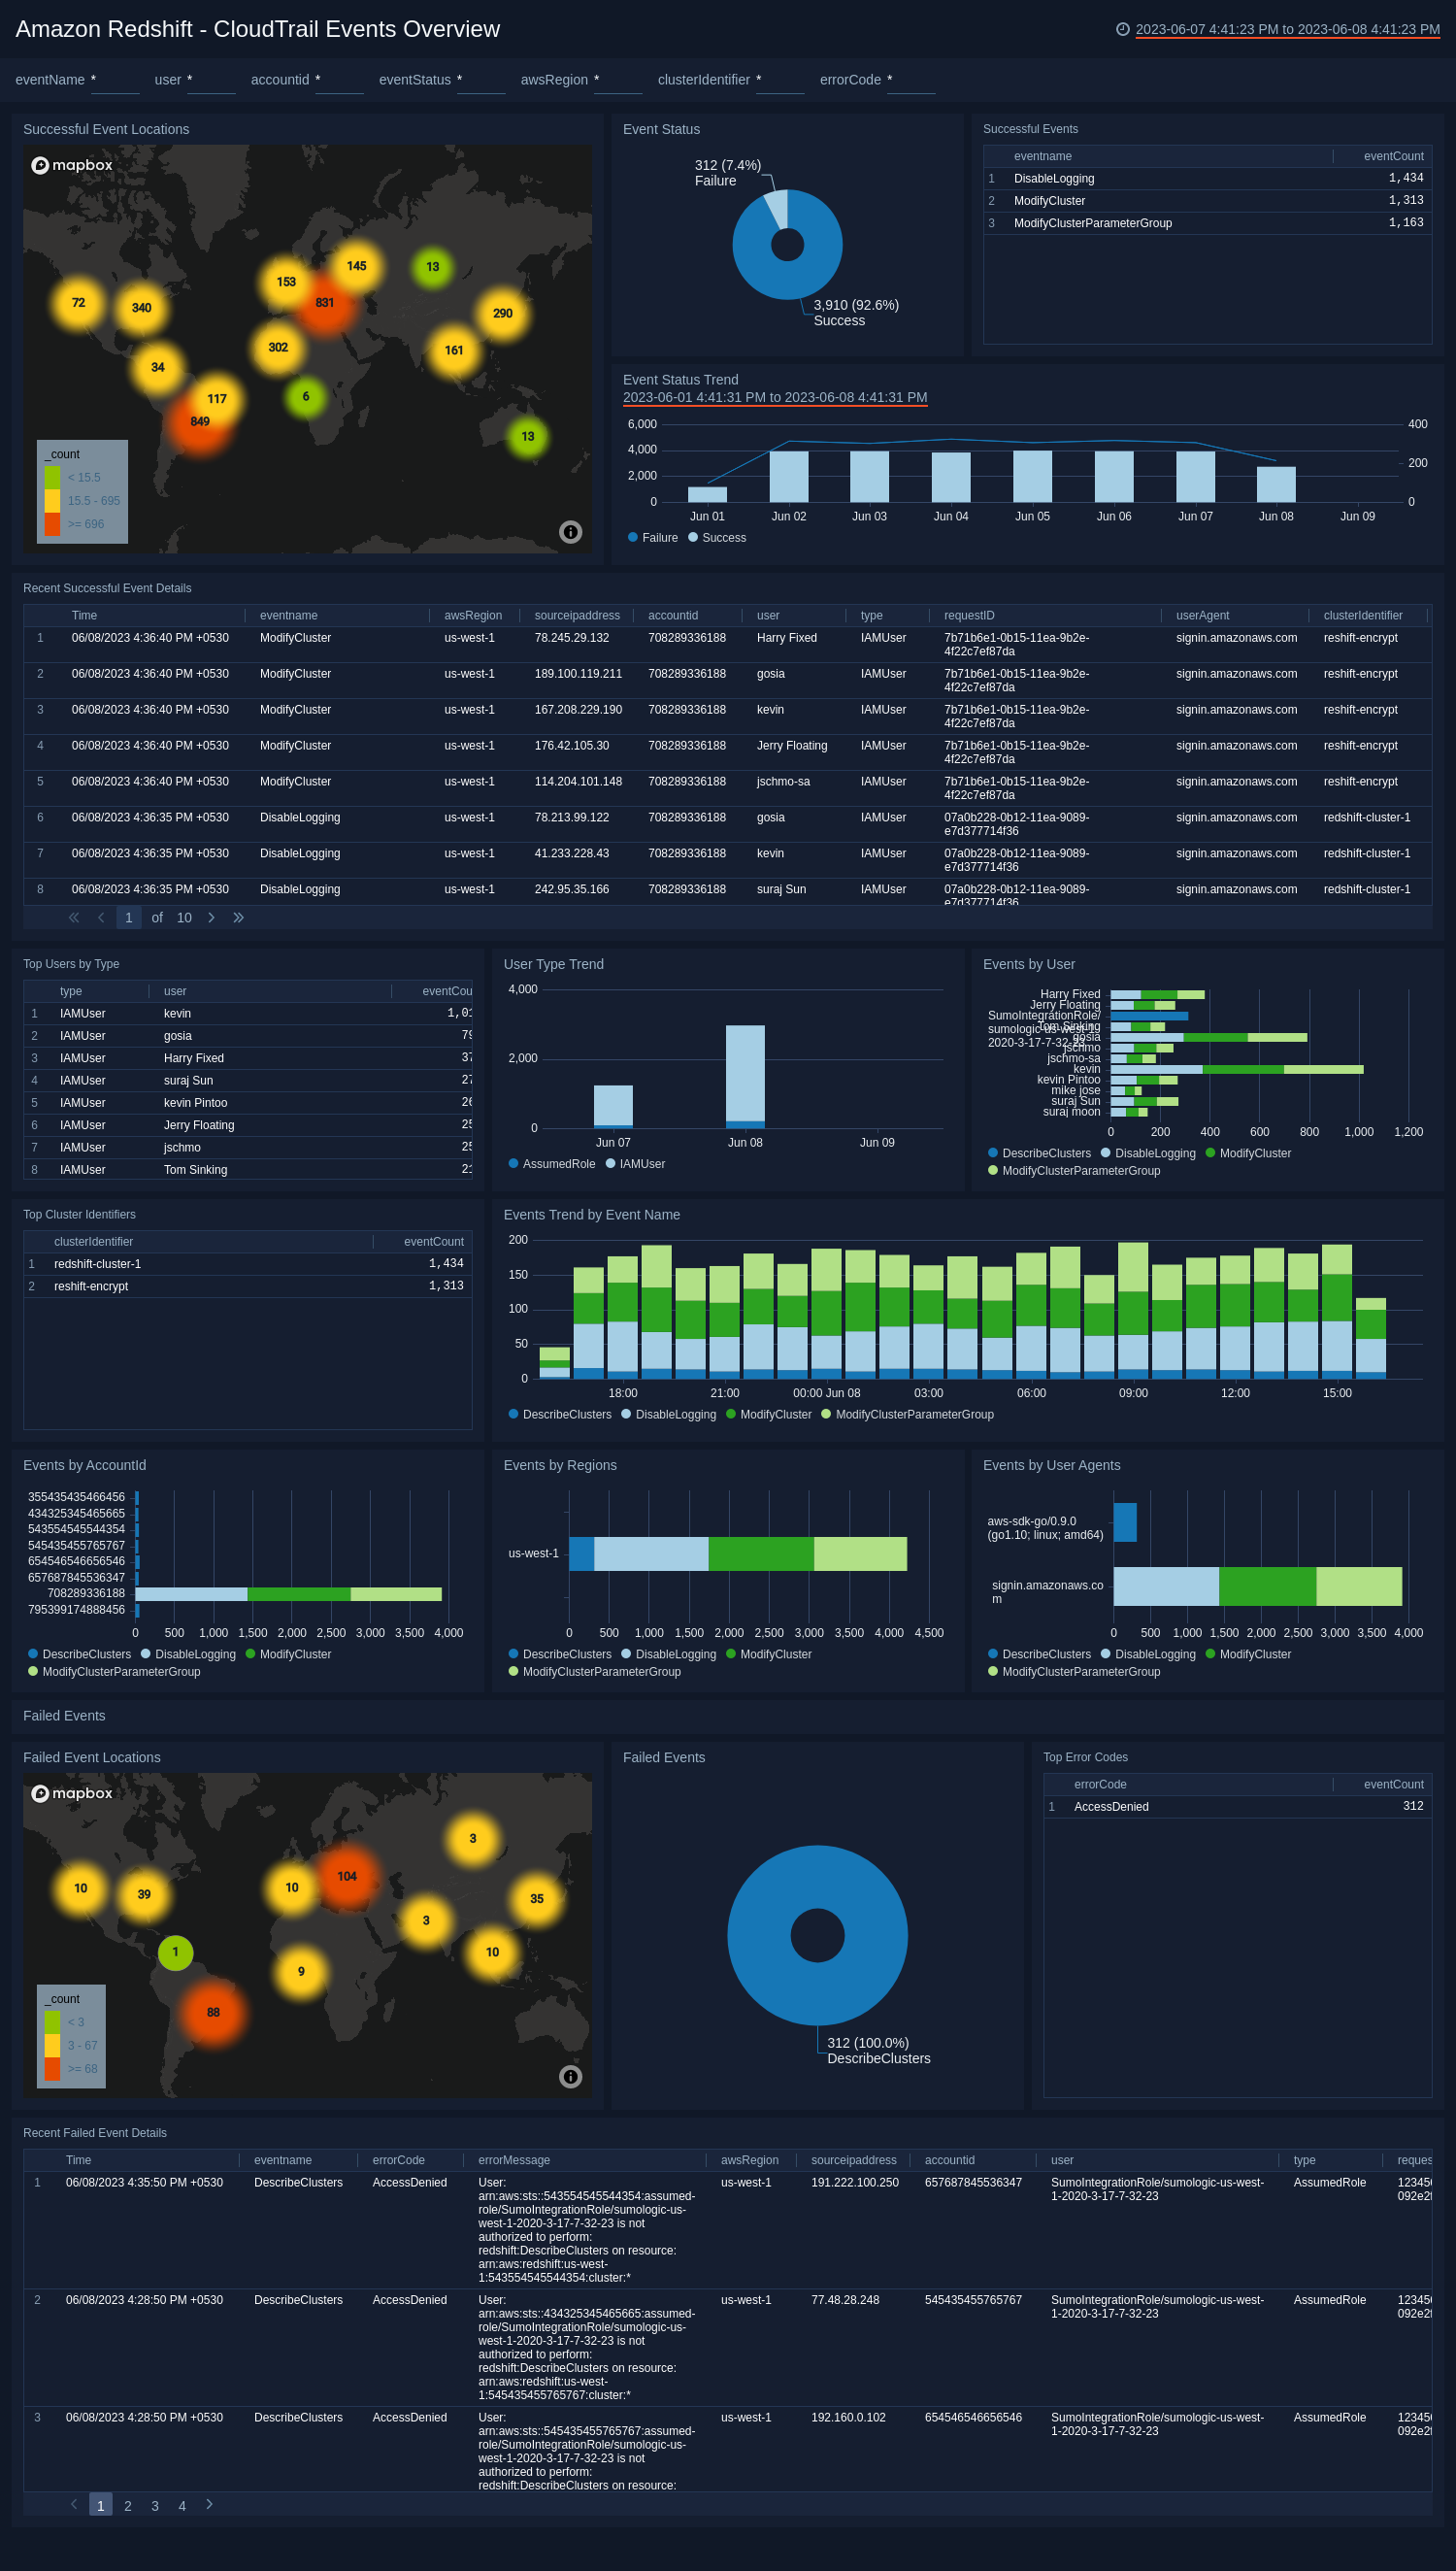
Successful Event Locations. Performs a geo lookup query and displays the location and number of successful CloudTrail events on a map of the world for the last 24 hours.
Event Status. Shows the statuses of CloudTrail events on a pie chart for the last 24 hours.
Successful Events. Shows a list of successful events along with a count of events in the last 24 hours.
Event Status Trend. Shows trends in event statuses on a column chart with a count for each type of event for the last 7 days.
Recent Successful Event Details. Shows an aggregation table with recent successful events in the last three hours, along with time, event name, aws region, source ip address, username, type, request id, user agent, cluster identifier, and a count of events.
Top Users by Type. Shows a list of the top users by type along with the type, user, number of events, and rank in the last 24 hours.
User Type Trend. Shows trends in user types on a column chart with a count for each type of user type for the last 7 days.
Events by User. Shows trends in events by users on a bar chart with a count for each type of event for the last 24 hours.
Top Cluster Identifiers. Shows a list of the top cluster identifiers along with the number of events in the last 24 hours.
Events Trend by Event Name. Shows trends in events by the event name on a column chart with a count for each event name for the last 24 hours.
Events by AccountId. Shows a count of events by account id on a bar chart, broken up into the type of events for the last 24 hours.
Events by Regions. Shows a count of events by region on a bar chart, broken up into the type of events for the last 24 hours.
Events by User Agents. Shows trends in events by user agents on a bar chart with a count for each type of event for the last 24 hours.
Failed Event Locations. Shows locations of failed events over the last 24 hours.
Failed Events. Shows failed events for the last 24 hours.
Top Error Codes. Shows top error codes in the last 24 hours.
Recent Failed Event Details. Shows a detailed list of failed events for the last 24 hours.
Resource Utilization by ClusterIdentifier
See cluster-level resource utilization metrics, including CPU, network receive and transmit throughput, database connections, and disk.
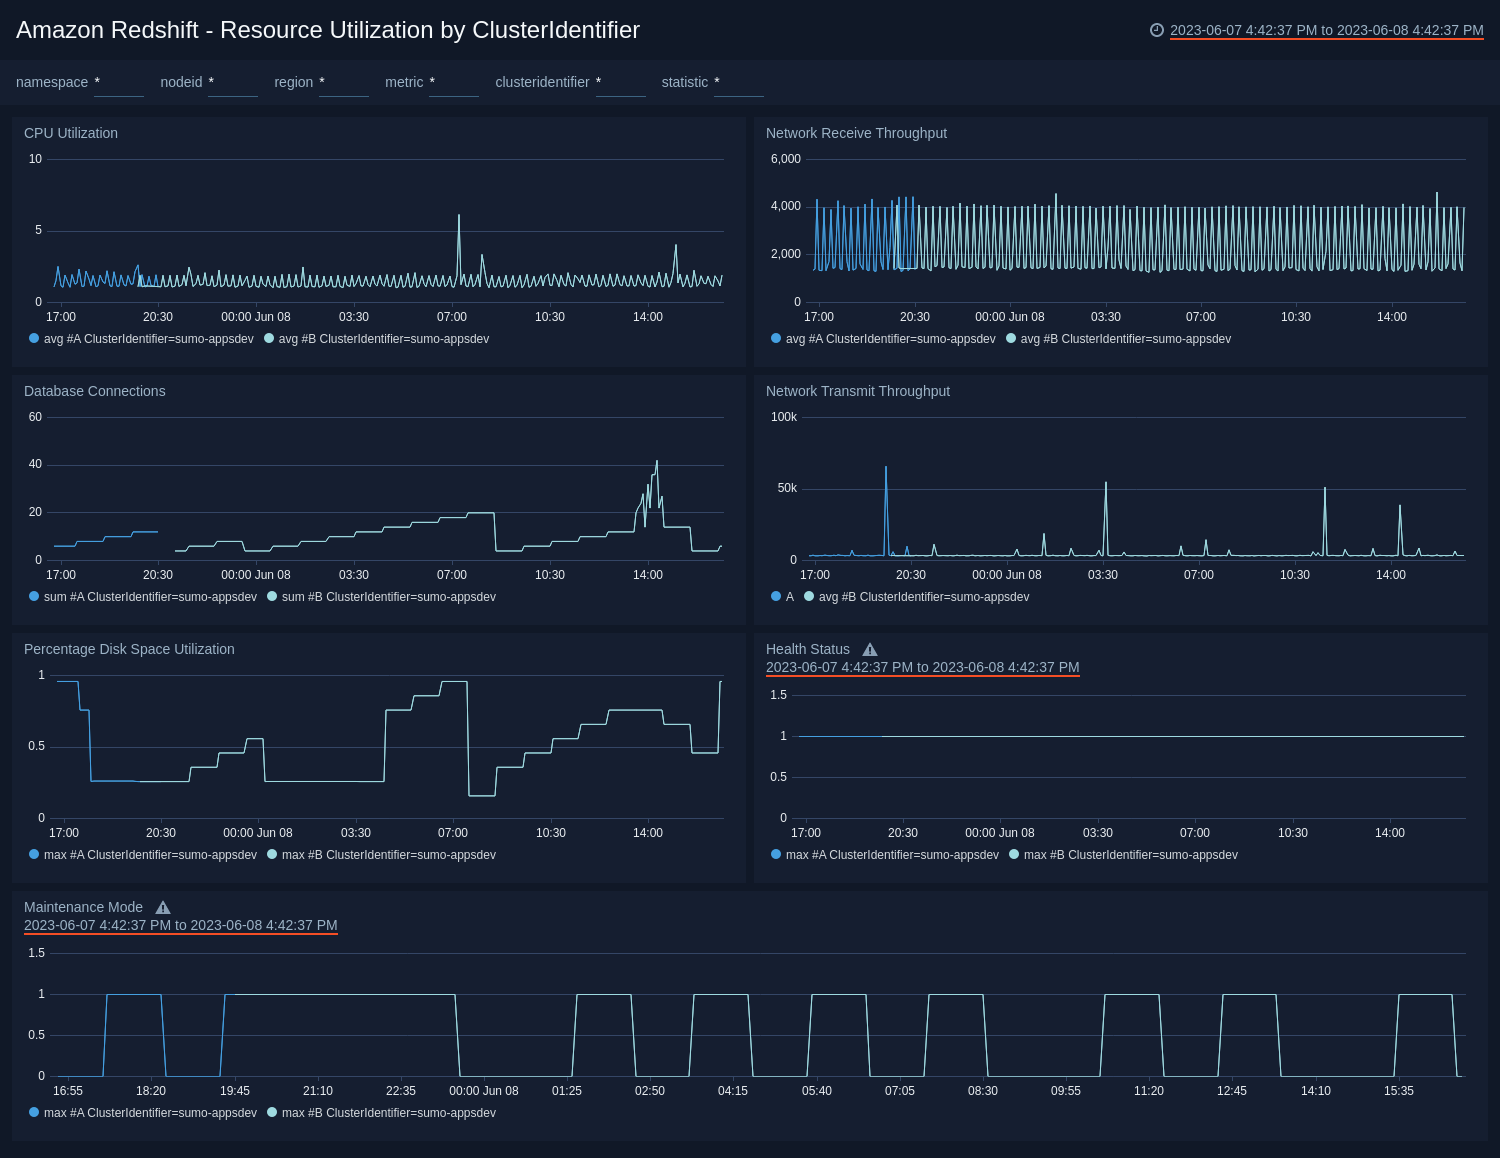
CPU Utilization. Shows trends in CPU utilization by cluster identifier on a line chart for the last 24 hours.
Network Receive Throughput. Shows trends in network received throughput by cluster identifier on a line chart for the last 24 hours.
Database Connections. Shows trends in database connections by cluster identifier on a line chart for the last 24 hours.
Network Transmit Throughput. Shows trends in network transmitted throughput by cluster identifier on a line chart for the last 24 hours.
Percentage Disk Space Utilization. Shows trends in percentage disk space utilized by cluster identifier on a line chart for the last 24 hours.
Health Status. Shows trends in health status by cluster identifier on a line chart for the last 24 hours.
Maintenance Mode. Shows trends in maintenance mode by cluster identifier on a line chart for the last 24 hours.
Resource Utilization by NodeID
See node-level resource utilization metrics, including CPU; disk; network; and read/write latency, throughput and I/O operations per second.
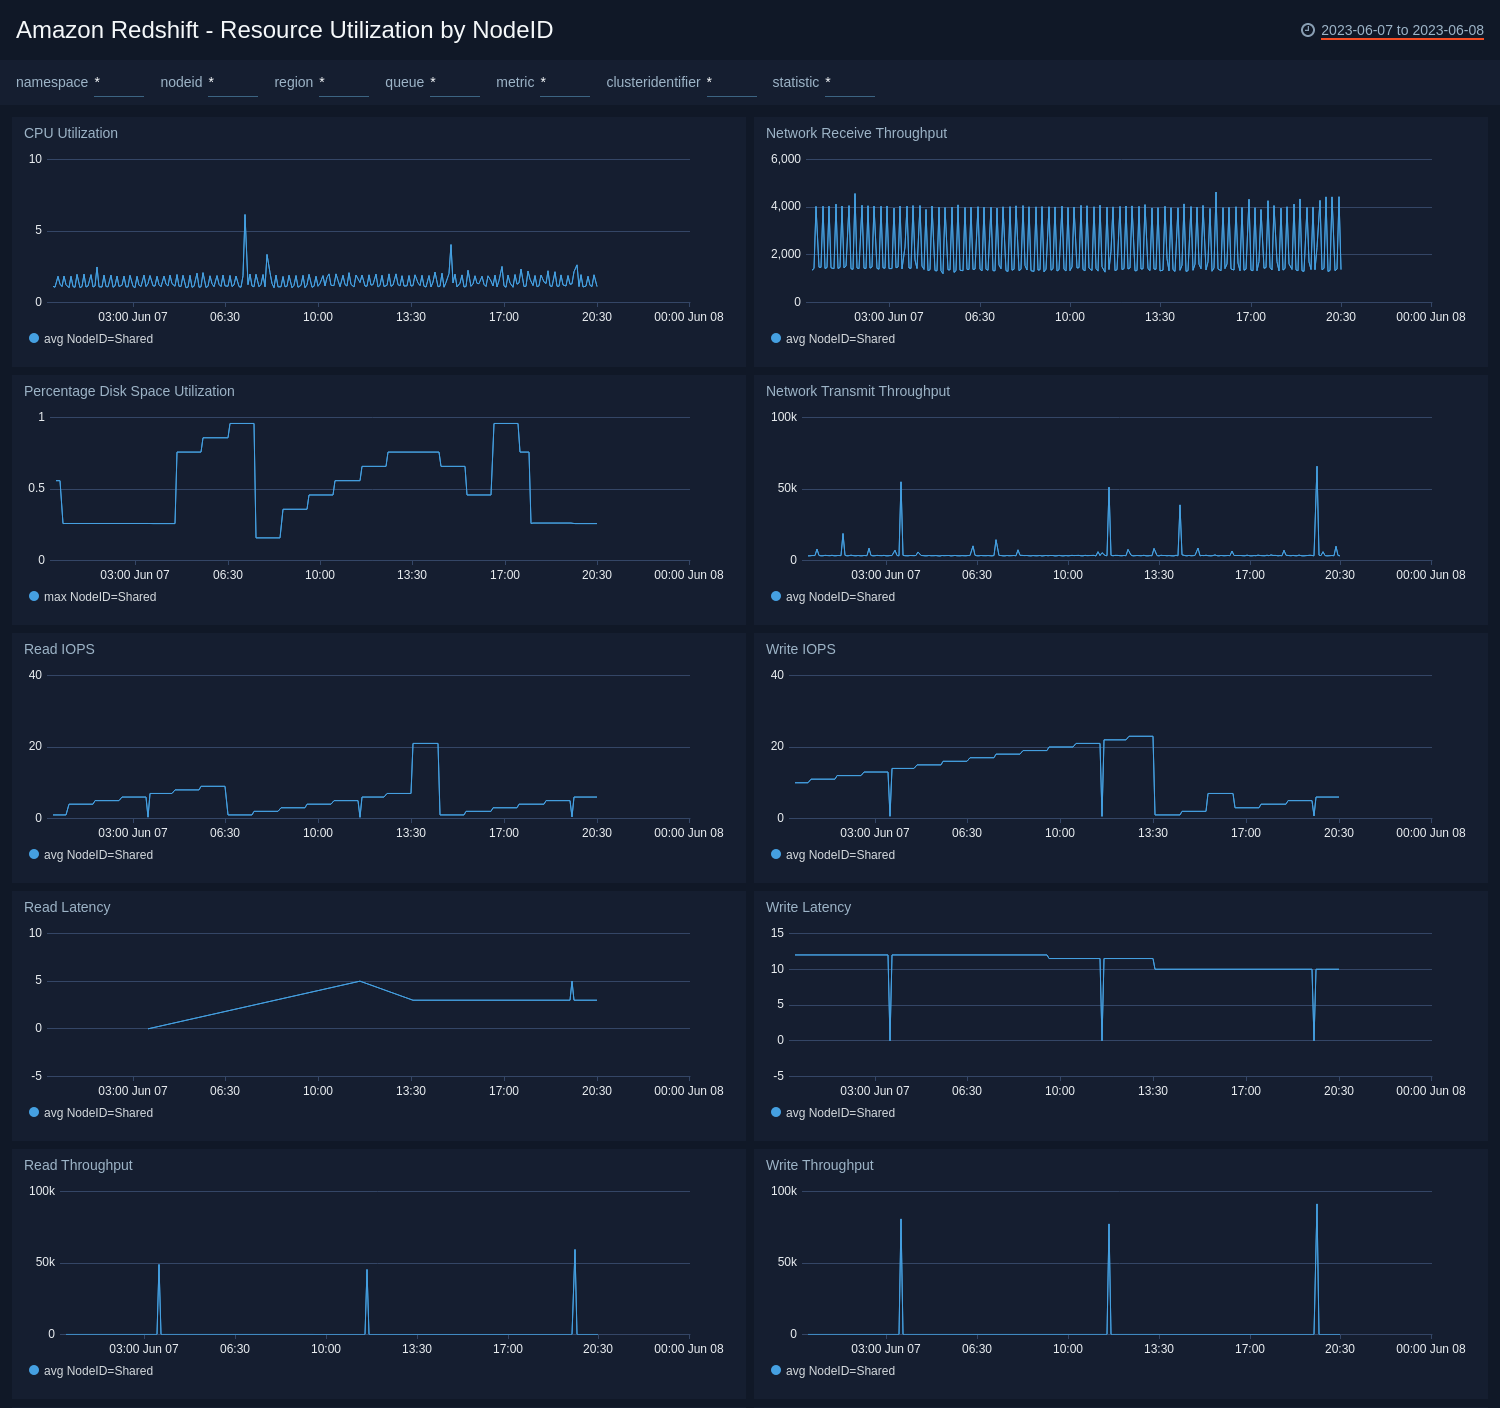
CPU Utilization. Shows trends in CPU utilization by NodeID on a line chart for the last 24 hours.
Network Receive Throughput. Shows trends in network received throughput by NodeID on a line chart for the last 24 hours.
Percentage Disk Space Utilization. Shows trends in percentage disk space utilized by NodeID on a line chart for the last 24 hours.
Network Transmit Throughput. Shows trends in network transmit throughput by NodeID on a line chart for the last 24 hours.
Read IOPS. Shows trends in read IOPS by NodeID on a line chart for the last three hours.
Write IOPS. Shows trends in write IOPS by NodeID on a line chart for the last three hours.
Read Latency. Shows trends in read latency by NodeID on a line chart for the last three hours.
Write Latency. Shows trends in write latency by NodeID on a line chart for the last three hours.
Read Throughput. Shows trends in read throughput by NodeID on a line chart for the last three hours.
Write Throughput. Shows trends in write throughput by NodeID on a line chart for the last three hours.
Commit Queue Length. Shows trends in commit queue length by NodeID on a line chart for the last three hours.
WLM Queue Length. Shows trends in WLM queue length by NodeID on a line chart for the last three hours.
Upgrade/Downgrade the Amazon Redshift ULM app (Optional)
To update the app, do the following:
Next-Gen App: To install or update the app, you must be an account administrator or a user with Manage Apps, Manage Monitors, Manage Fields, Manage Metric Rules, and Manage Collectors capabilities depending upon the different content types part of the app.
- Select App Catalog.
- In the Search Apps field, search for and then select your app.
Optionally, you can identify apps that can be upgraded in the Upgrade available section. - To upgrade the app, select Upgrade from the Manage dropdown.
- If the upgrade does not have any configuration or property changes, you will be redirected to the Preview & Done section.
- If the upgrade has any configuration or property changes, you will be redirected to the Setup Data page.
- In the Configure section of your respective app, complete the following fields.
- Field Name. If you already have collectors and sources set up, select the configured metadata field name (eg _sourcecategory) or specify other custom metadata (eg: _collector) along with its metadata Field Value.
- Click Next. You will be redirected to the Preview & Done section.
Post-update
Your upgraded app will be installed in the Installed Apps folder and dashboard panels will start to fill automatically.
See our Release Notes changelog for new updates in the app.
To revert the app to a previous version, do the following:
- Select App Catalog.
- In the Search Apps field, search for and then select your app.
- To version down the app, select Revert to < previous version of your app > from the Manage dropdown.
Uninstalling the Amazon Redshift ULM app (Optional)
To uninstall the app, do the following:
- Select App Catalog.
- In the 🔎 Search Apps field, run a search for your desired app, then select it.
- Click Uninstall.