Bitbucket

The Sumo Logic App for Bitbucket provides insights to development teams into how their software delivery pipeline components are performing. The pre-configured dashboards organize issues, builds, and deployments that require the most attention.
The Bitbucket App supports only Bitbucket Cloud.
Event types
Sumo Logic analyzes the following required types of logs for more efficient monitoring.
There are two types of events of interest from Bitbucket to Sumo Logic: Bitbucket and Deploy events. This section provides an example of Bitbucket Events and Deploy Events log messages.
Bitbucket Events
Bitbucket Events send the event request to the server URL for the Webhook whenever that event occurs.
Available Repository events
Available Issue events
Refer to the event documentation for descriptions and examples of each event payload above.
For log samples, refer to Bitbucket Event Documentation
Sample log messages
Deploy Events are triggered whenever code is pushed to test, staging, or production environments.
- Success Code Deploys
- Failed Code Deploys
{
  "buildNumber": "160",
  "deploymentEnvironment": "production",
  "gitHttpOrigin": "http://bitbucket.org/sumo/backendservice",
  "commit": "67be2cdb4db18556df9b49872d7d3945ada3cb09",
  "branch": "master",
  "tag": "",
  "prDestinationBranch": "",
  "projectKey": "",
  "repoFullName": "app-dev-sumo/backendservice",
  "repoOwner": "app-dev-sumo",
  "pr_id": "",
  "pipe_result_link": "https://bitbucket.org/sumo/backendservice/addon/pipelines/home#!/results/160",
  "deploy_status": "0",
  "commit_link": "https://bitbucket.org/sumo/backendservice/commits/67be2cdb4db18556df9b49872d7d3945ada3cb09",
  "event_date": "2020-03-23 08:07:34"
}
Sample queries
This section provides a sample from the Failed Deployments panel on the Bitbucket Deployment dashboard.
Parameters:
- Event_Date:*
- Build_Number:*
- Deploy_Status:*
- Deployment_Environment:*
- Files_Committed:*
- Repo_Full_Name:*
- Repo_Owner:*
- Source_Branch:*
- Deploy_Result:*
_sourceCategory="bitbucket" production  deploymentEnvironment pipe_result_link deploy_status commit_link
| json field=_raw "buildNumber", "deploymentEnvironment", "branch", "repoFullName", "pipe_result_link", "deploy_status", "pr_id", "commit", "tag", "projectKey", "repoOwner", "commit_link" , "event_date"
| repoFullName as repo_name
| where   repoFullName matches "*"  AND buildNumber matches "*"
| branch as source_branch
| if (deploy_status matches "0", "Success", "Failed") as deploy_status
| where deploymentEnvironment="production" and deploy_status="Failed"
| tourl (commit_link, concat("Commit # ",commit)) as files_commited
| tourl (pipe_result_link, buildNumber) as deploy_result
| count by event_date, buildNumber, deploy_status, deploymentEnvironment, files_commited, repoFullName, repoOwner, source_branch, deploy_result
| fields - _count
Collecting logs for Bitbucket App
This section provides instructions for configuring log collection for the Bitbucket App. Configuring log collection consists of the following tasks:
Step 1: Configure Hosted Collector to Receive Bitbucket events
In this step, you configure a Hosted Collector to receive Webhook Events from Bitbucket and set up an HTTP source on it.
- Configure a Hosted Collector, or select an existing hosted collector for the HTTP source.
- Configure an HTTP source on the hosted collector.
- For Source Category, specify
bitbucket/events. - Click +Add Field and provide the following:
- Field Name.
_convertHeadersToFields - Value.
true
- Field Name.
- Click Save and make note of the HTTP address for the source. You will supply it when you configure a Jira Webhook in the next step.
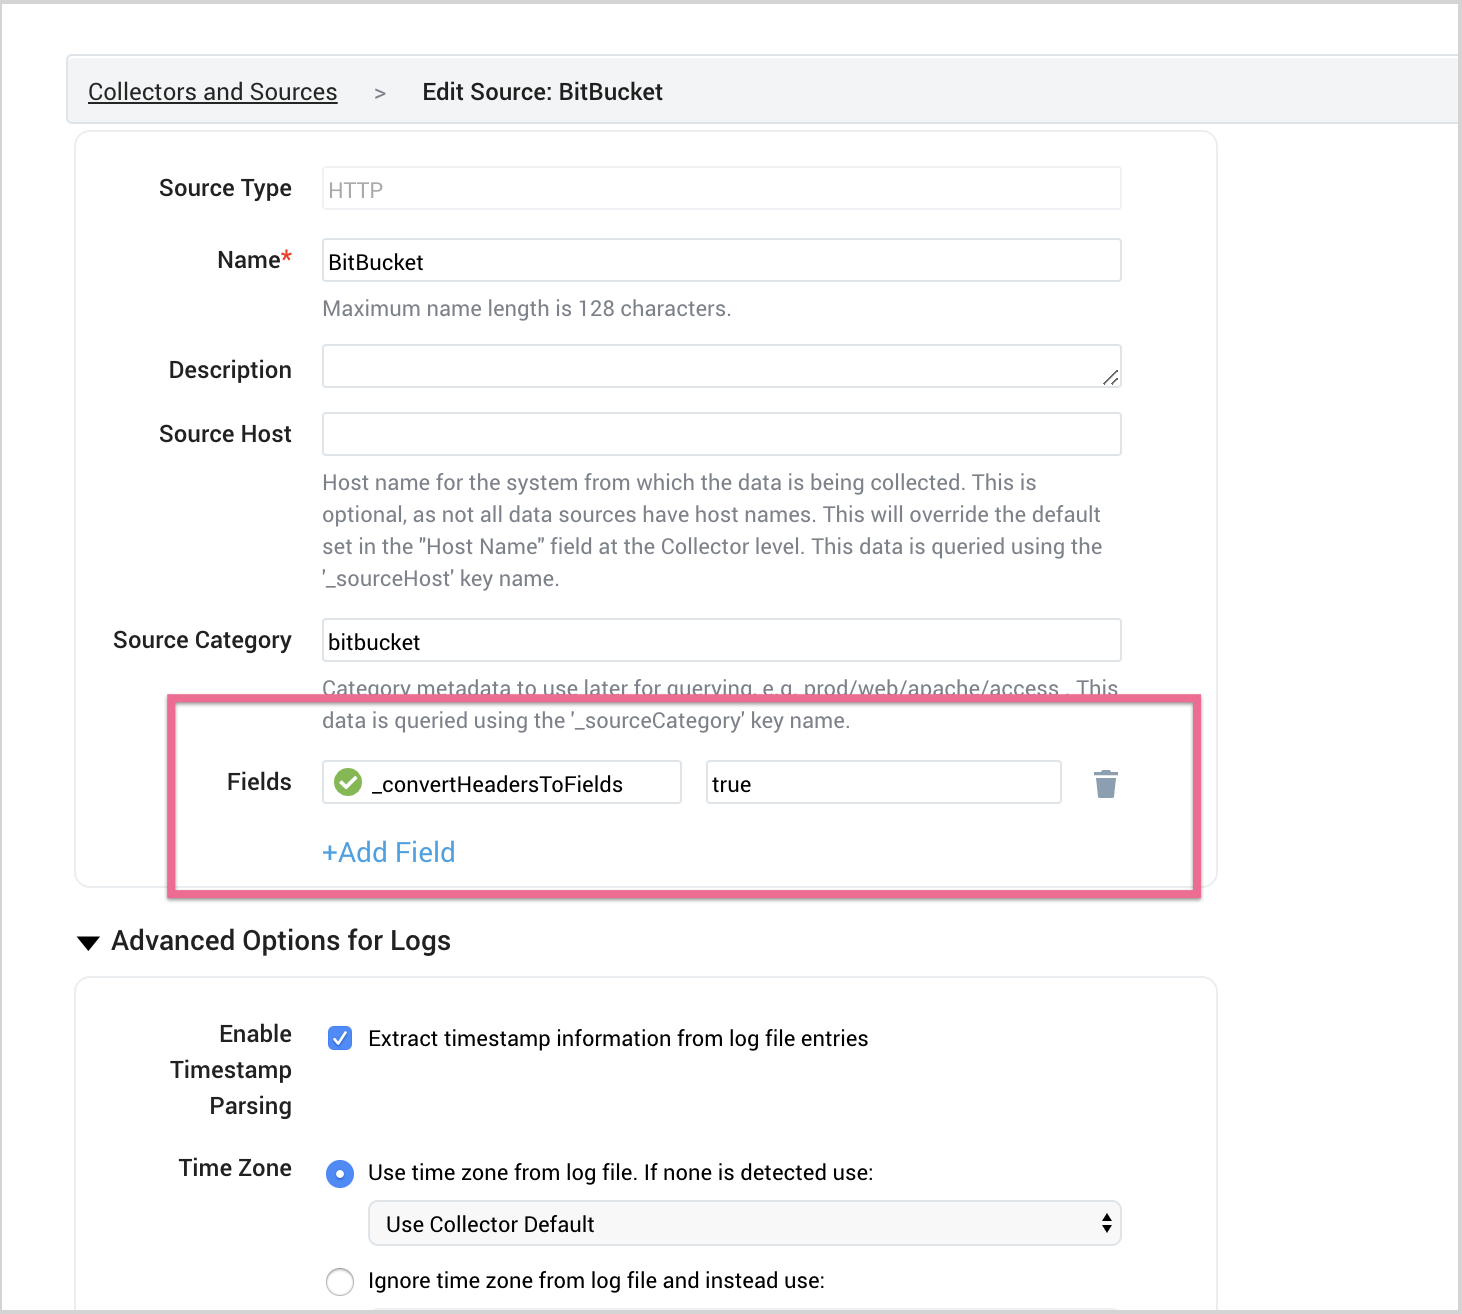
- For Source Category, specify
Step 2: Adding a Webhook in Bitbucket
- From Bitbucket, open the repository where you want to add the Webhook.
- Click the Settings link on the left side.
- From the links on the Settings page, click the Webhooks link.
- Click the Add Webhook button to create a Webhook for the repository. The Add New Webhook page appears.
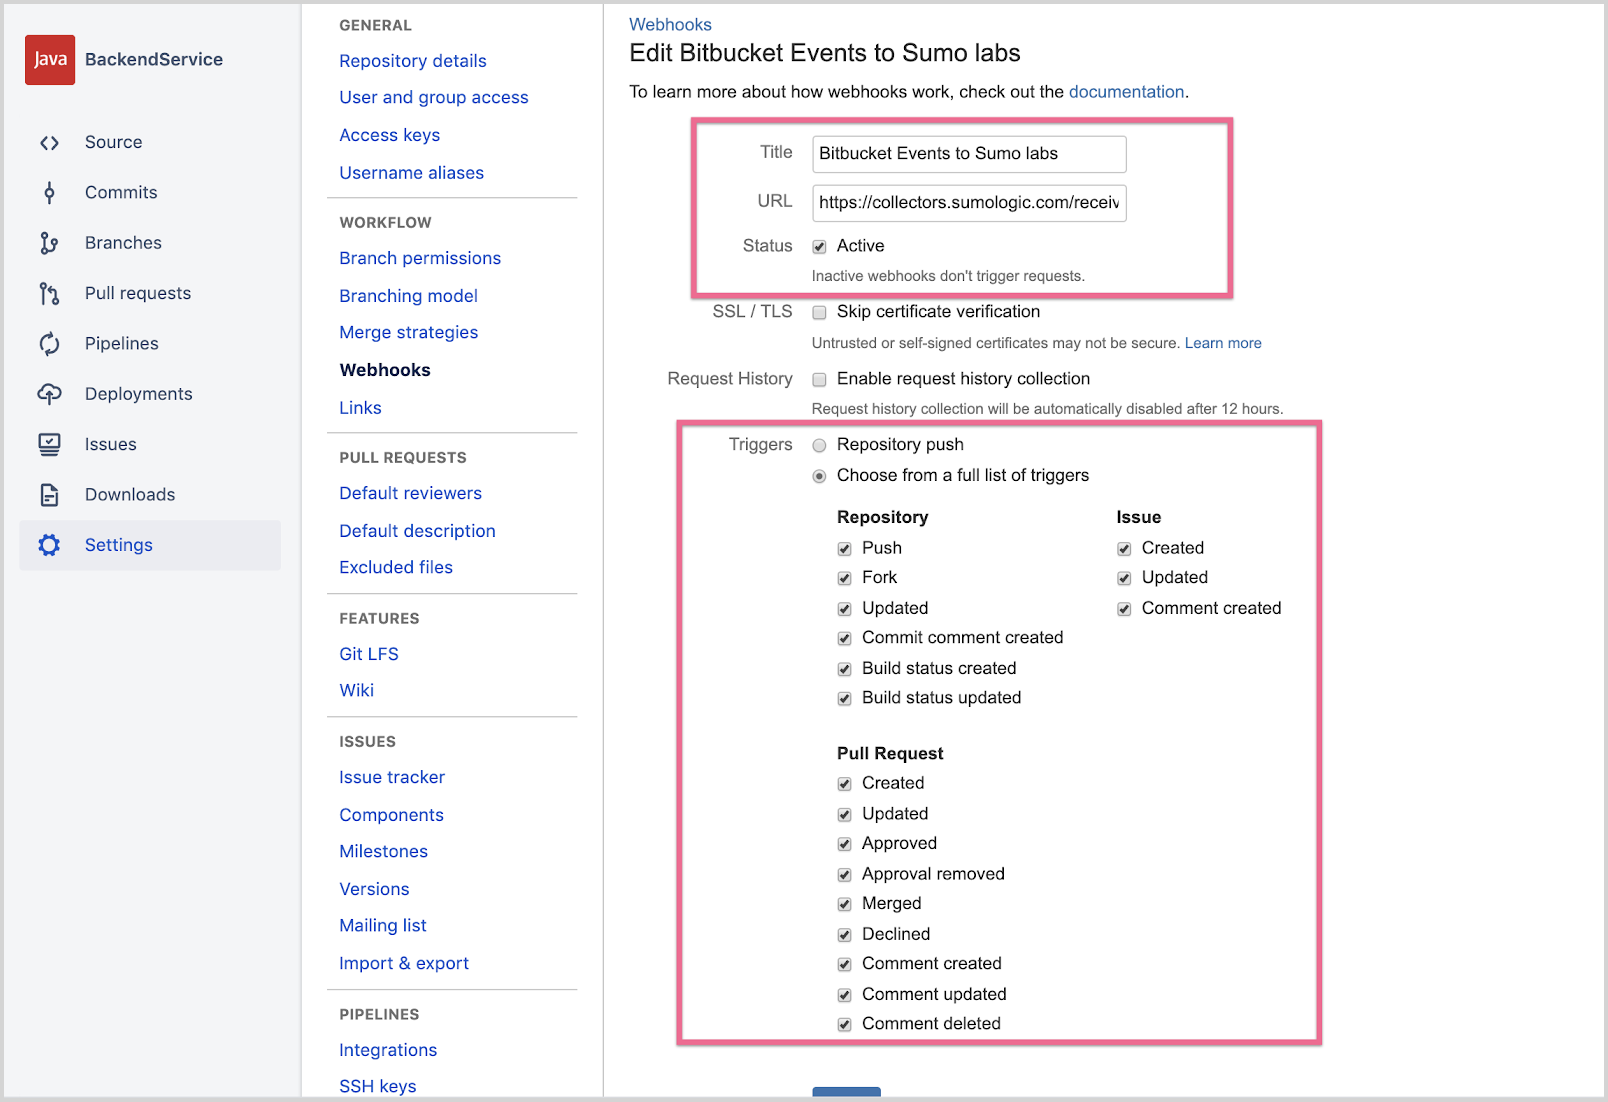
- Enter a Title with a short description.
- Enter Sumo Logic Http source URL, you configured this in Configure Hosted Collector to Receive Bitbucket events.
- Click on Status to make it Active.
- Triggers - Click on Choose from a full list of triggers, and choose all triggers under Repository, Issue and Pull Request.
- Click Save
Step 3: Configure the Bitbucket CI/CD Pipeline to Collect Deploy Events
A Bitbucket pipe needs to be configured to send code deploy status to Sumo Logic. Add the following pipe code to the step section of your deployment part of the bitbucket-pipelines.yml file. Replace SUMOLOGIC_HTTP_URL with HTTP Source URL configured in Step 1.
after-script:
    - pipe: docker://appdevsumologic/sumologic-send-event:1.15
        variables:
          SUMO_LOGIC_BASE_URL: '<SUMOLOGIC_HTTP_URL>'
If you want to deployment events to multiple Sumo Logic orgs, include a -pipe statement, as shown above, for each of the Sumo Logic endpoints.
For reference: This is how the bitbucket-pipelines.yml looks after adding deploy pipe code to our sample Bitbucket CI/CD pipeline.
Step 4: Bitbucket Event-Key tagging at Sumo Logic
To properly identify the event type for incoming events (for example, repo:push events), Sumo Logic automatically adds the X-Event-Key event type to the Fields during app installation.
Installing the Bitbucket App
To install the app, do the following:
Next-Gen App: To install or update the app, you must be an account administrator or a user with Manage Apps, Manage Monitors, Manage Fields, Manage Metric Rules, and Manage Collectors capabilities depending upon the different content types part of the app.
- Select App Catalog.
- In the 🔎 Search Apps field, run a search for your desired app, then select it.
- Click Install App.
note
Sometimes this button says Add Integration.
- Click Next in the Setup Data section.
- In the Configure section of your respective app, complete the following fields.
- Field Name. If you already have collectors and sources set up, select the configured metadata field name (eg _sourcecategory) or specify other custom metadata (eg: _collector) along with its metadata Field Value.
- Click Next. You will be redirected to the Preview & Done section.
Post-installation
Once your app is installed, it will appear in your Installed Apps folder, and dashboard panels will start to fill automatically.
Each panel slowly fills with data matching the time range query received since the panel was created. Results will not immediately be available but will be updated with full graphs and charts over time.
Viewing Bitbucket Dashboards
All dashboards have a set of filters that you can apply to the entire dashboard. Use these filters to drill down and examine the data to a granular level.
- You can change the time range for a dashboard or panel by selecting a predefined interval from a drop-down list, choosing a recently used time range, or specifying custom dates and times. Learn more.
- You can use template variables to drill down and examine the data on a granular level. For more information, see Filtering Dashboards with Template Variables.
- Most Next-Gen apps allow you to provide the scope at the installation time and are comprised of a key (
_sourceCategoryby default) and a default value for this key. Based on your input, the app dashboards will be parameterized with a dashboard variable, allowing you to change the dataset queried by all panels. This eliminates the need to create multiple copies of the same dashboard with different queries.
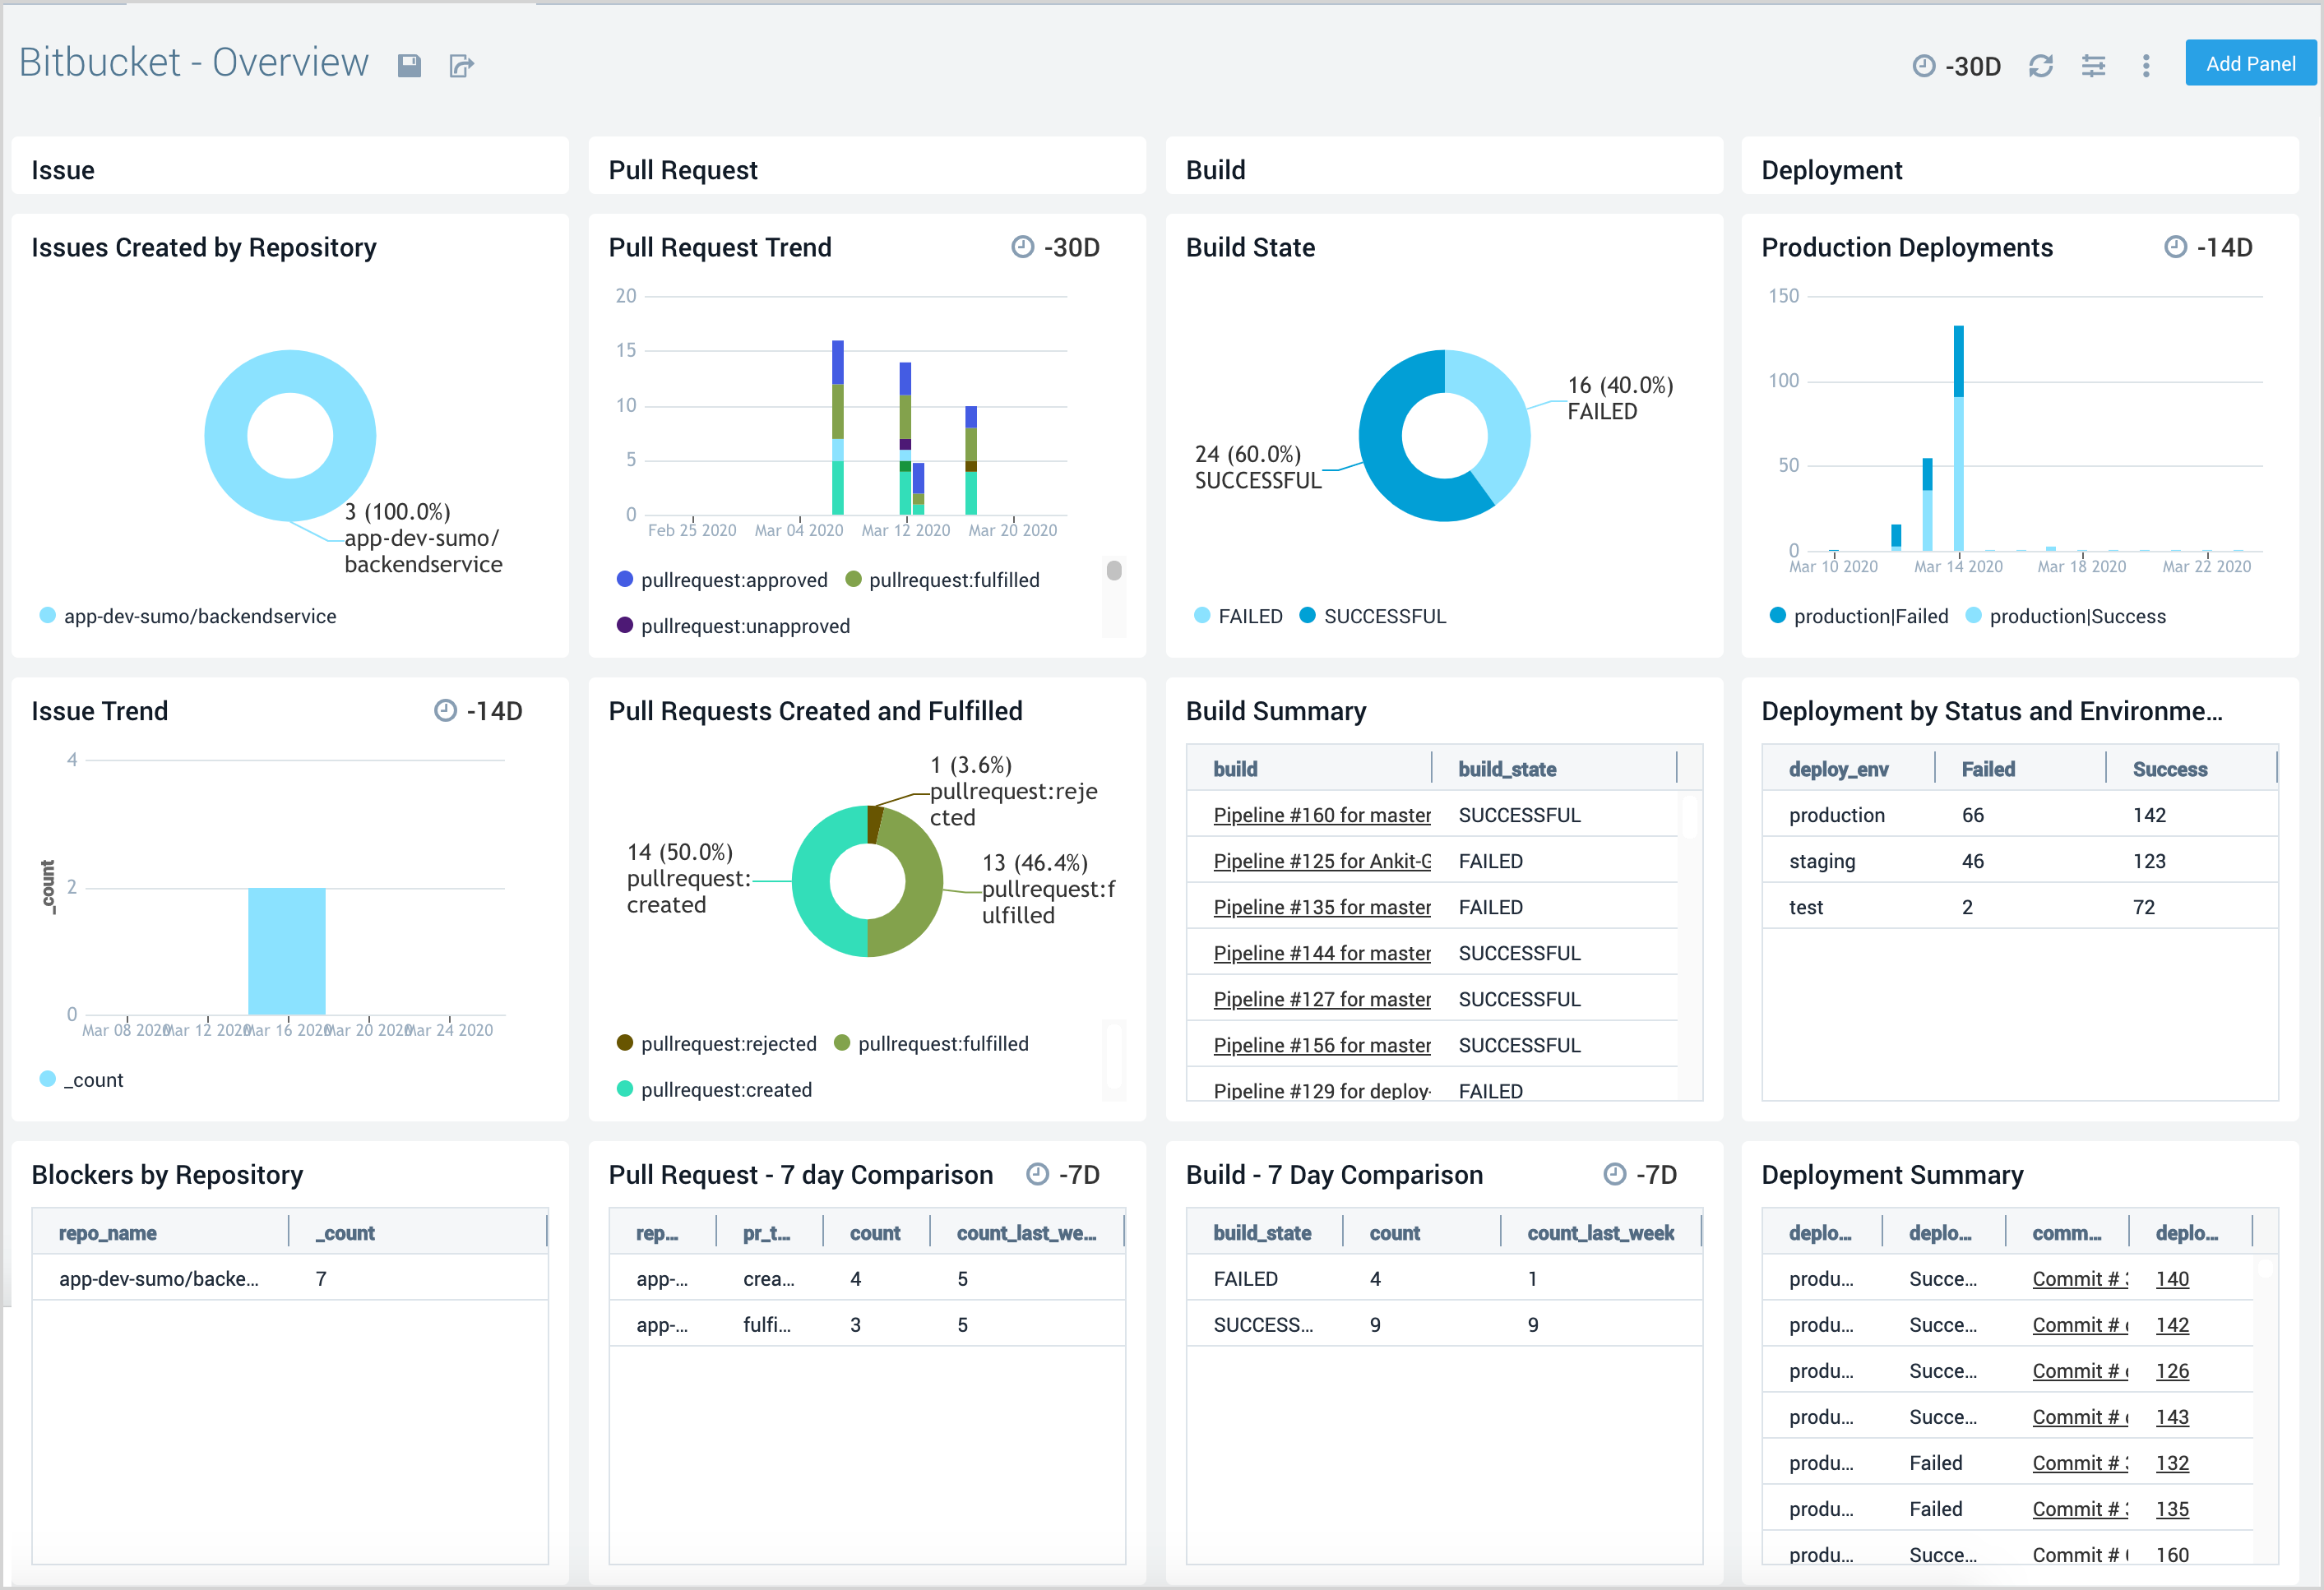
Overview
The Bitbucket - Overview dashboard provides an overview of issues by repository, pull requests, builds and deployment status. Panels identify key trends and summarize the status across each workflow.
Use this dashboard to:
- Quickly get insight around how various Bitbucket components are being used.
- Drill-down into the specifics of builds, deploy or commit events.
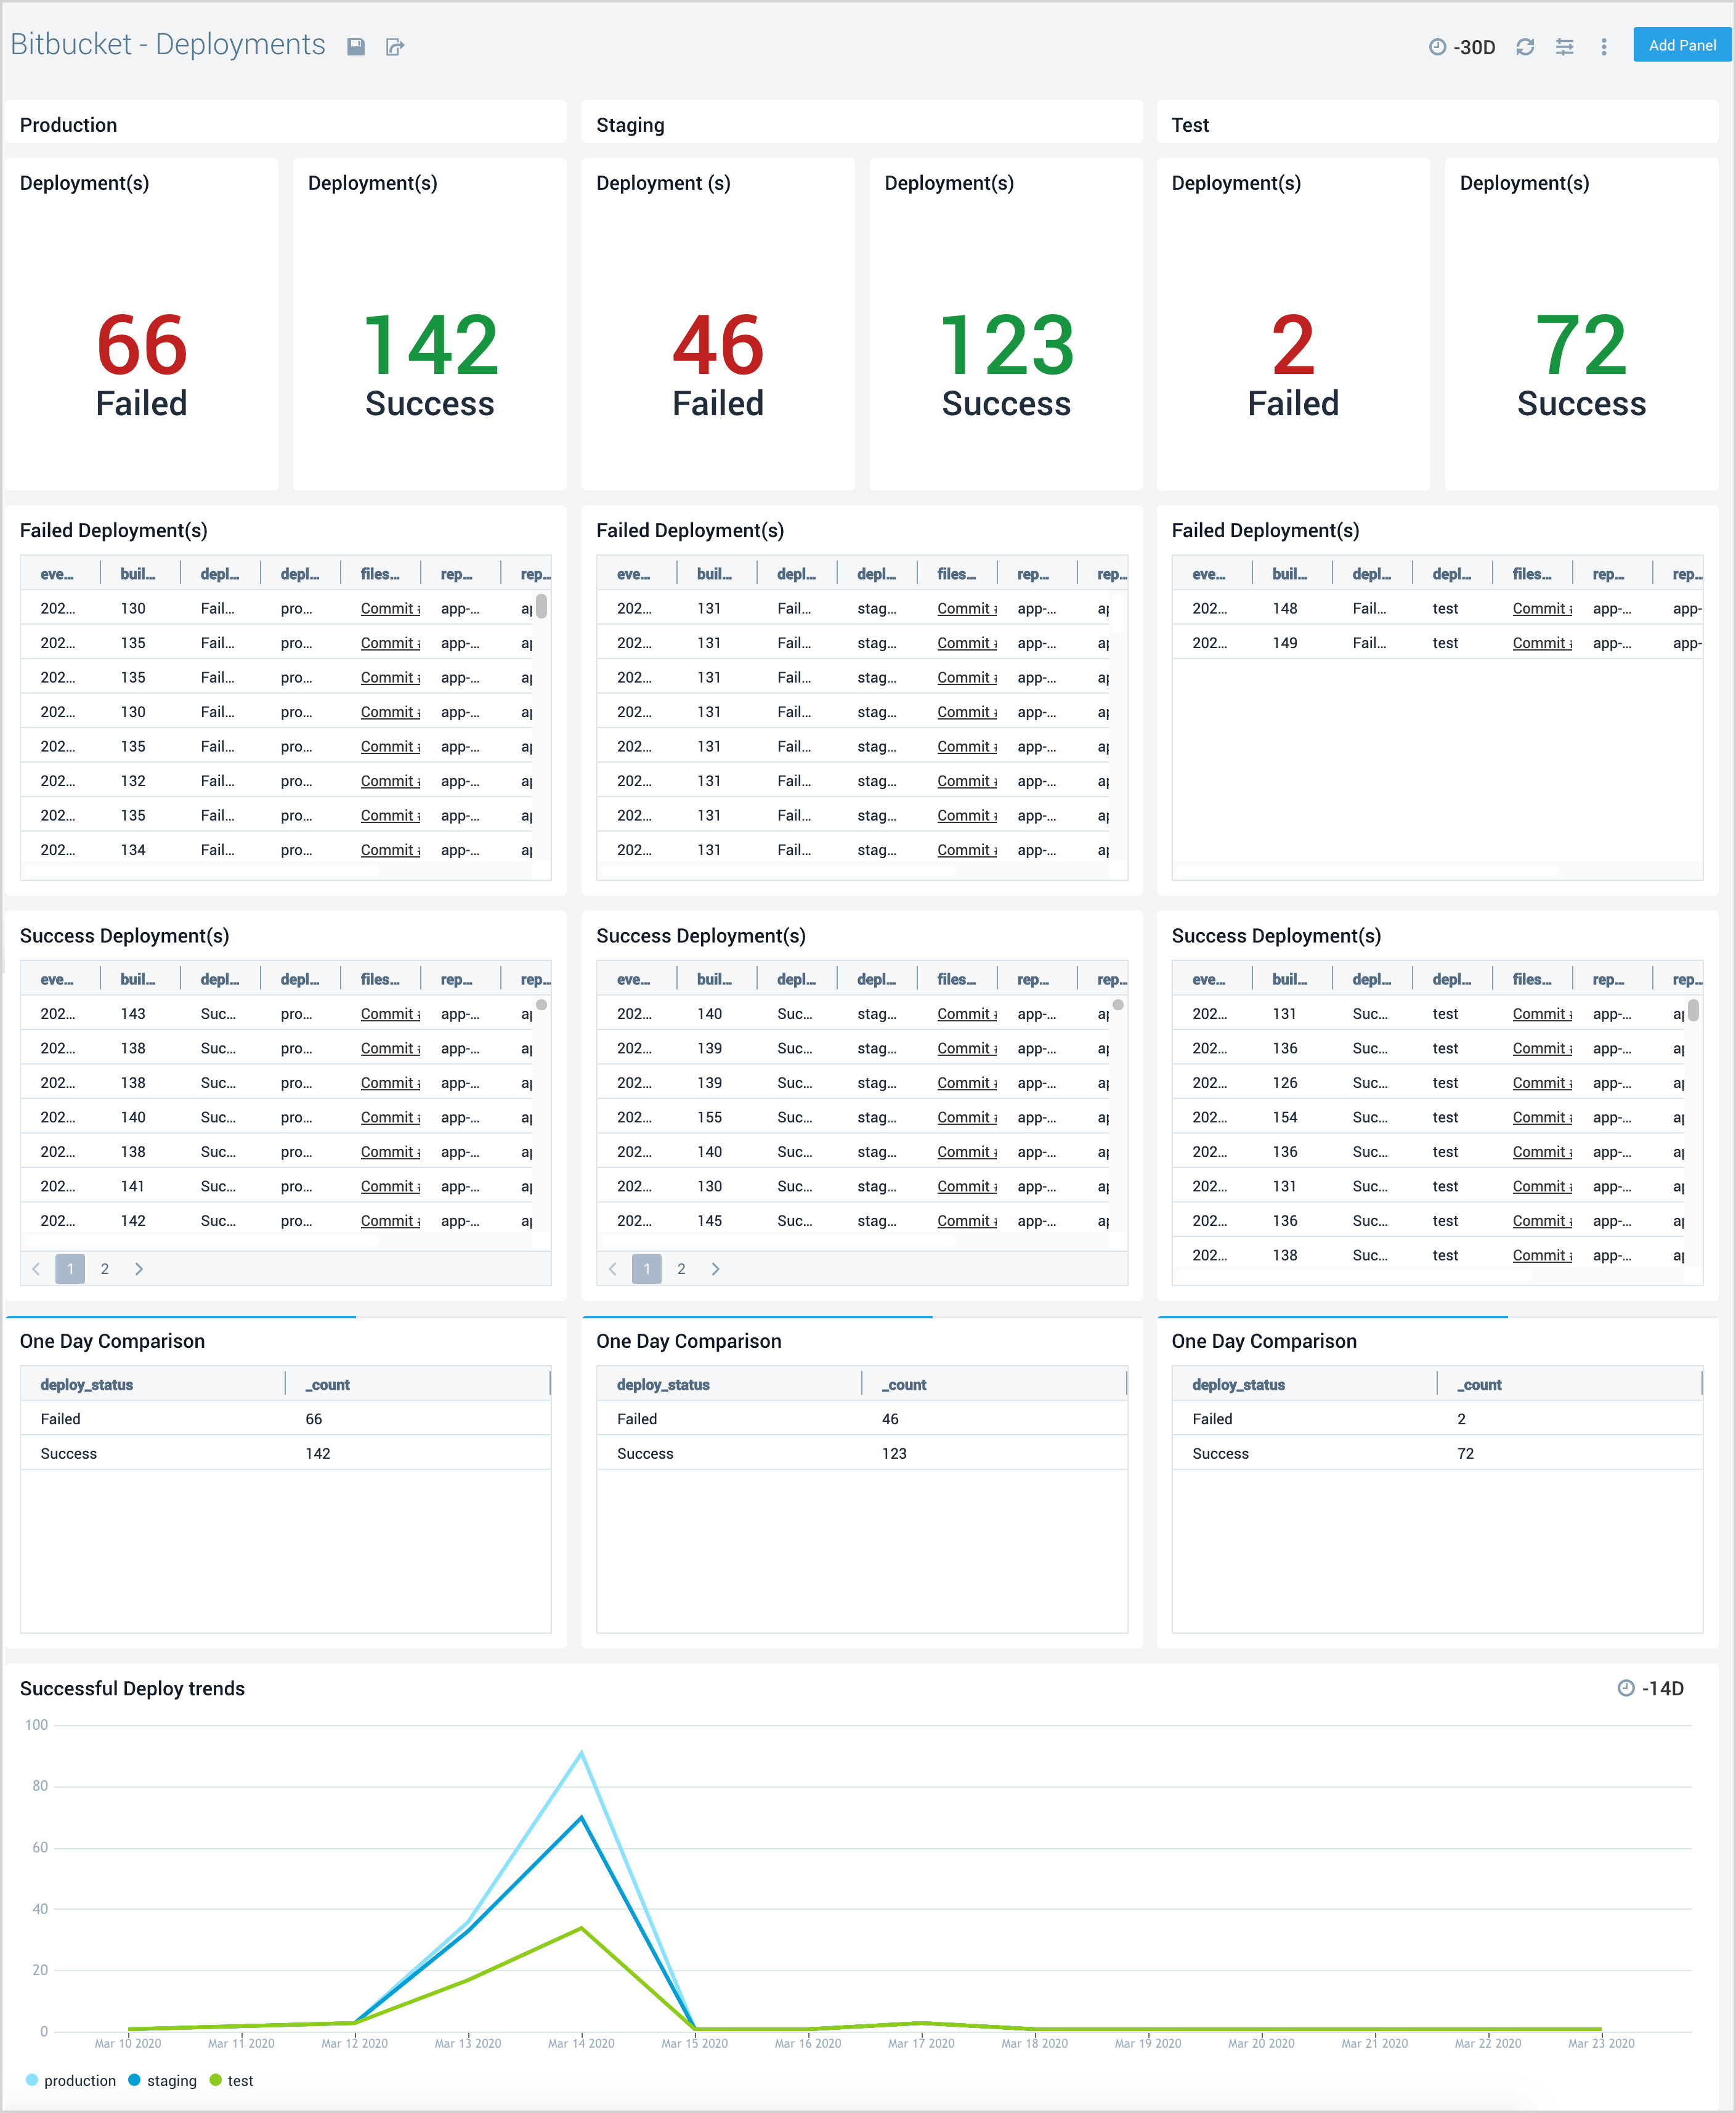
Deployments
The Bitbucket - Deployments dashboard provides details around failed and successful deployments in production, staging, and test environments
Use this dashboard to:
- To confirm whether code was successfully deployed to production.
- To understand and drill-down into commits that led to failed deployments.
- Identify and investigate deploys to various environments that led to bugs or degradation in performance.
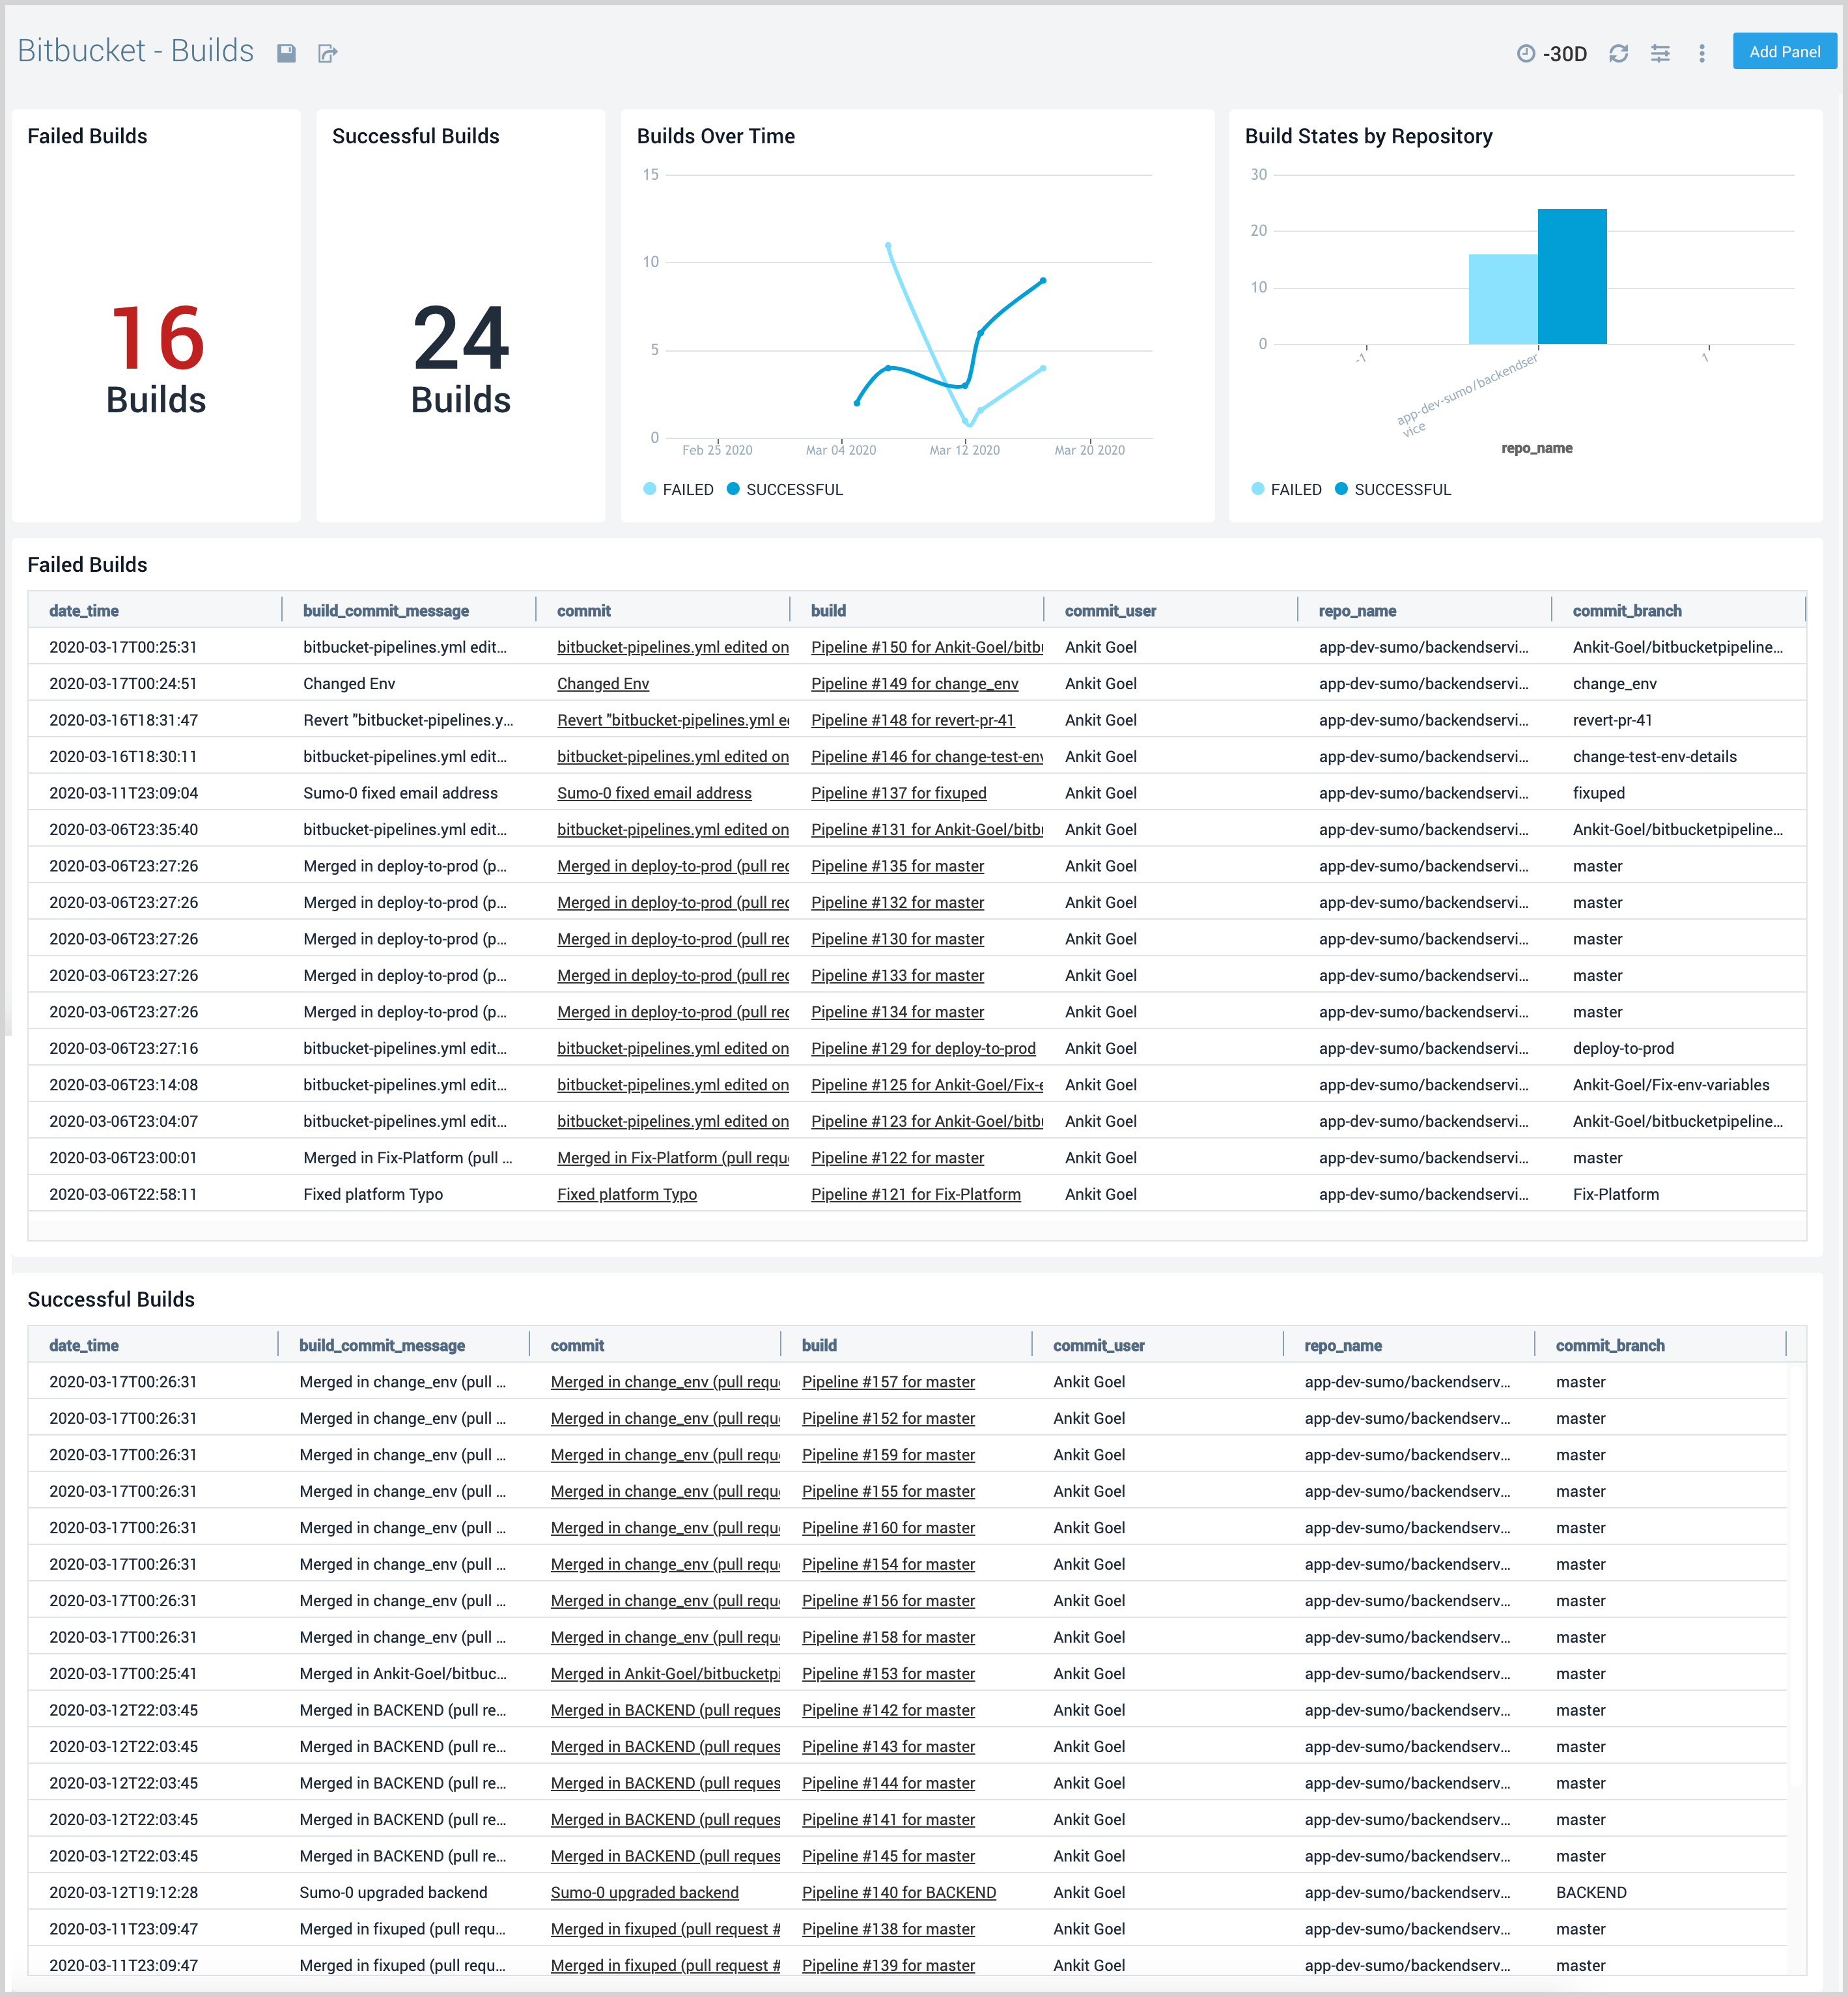
Builds
The Bitbucket - Builds dashboard provides a detailed view of the failed and successful builds overtime and by repository. It also lists the details of each build which includes the time when it was started and also identifies the changes made to the build.
Use this dashboard to:
- Speed up the overall software delivery processes by identifying bottlenecks in build failures.
- Monitor the success/failure rate of builds and identify relevant individuals, repos, and branches.
- Identify code commits that led to failed builds.
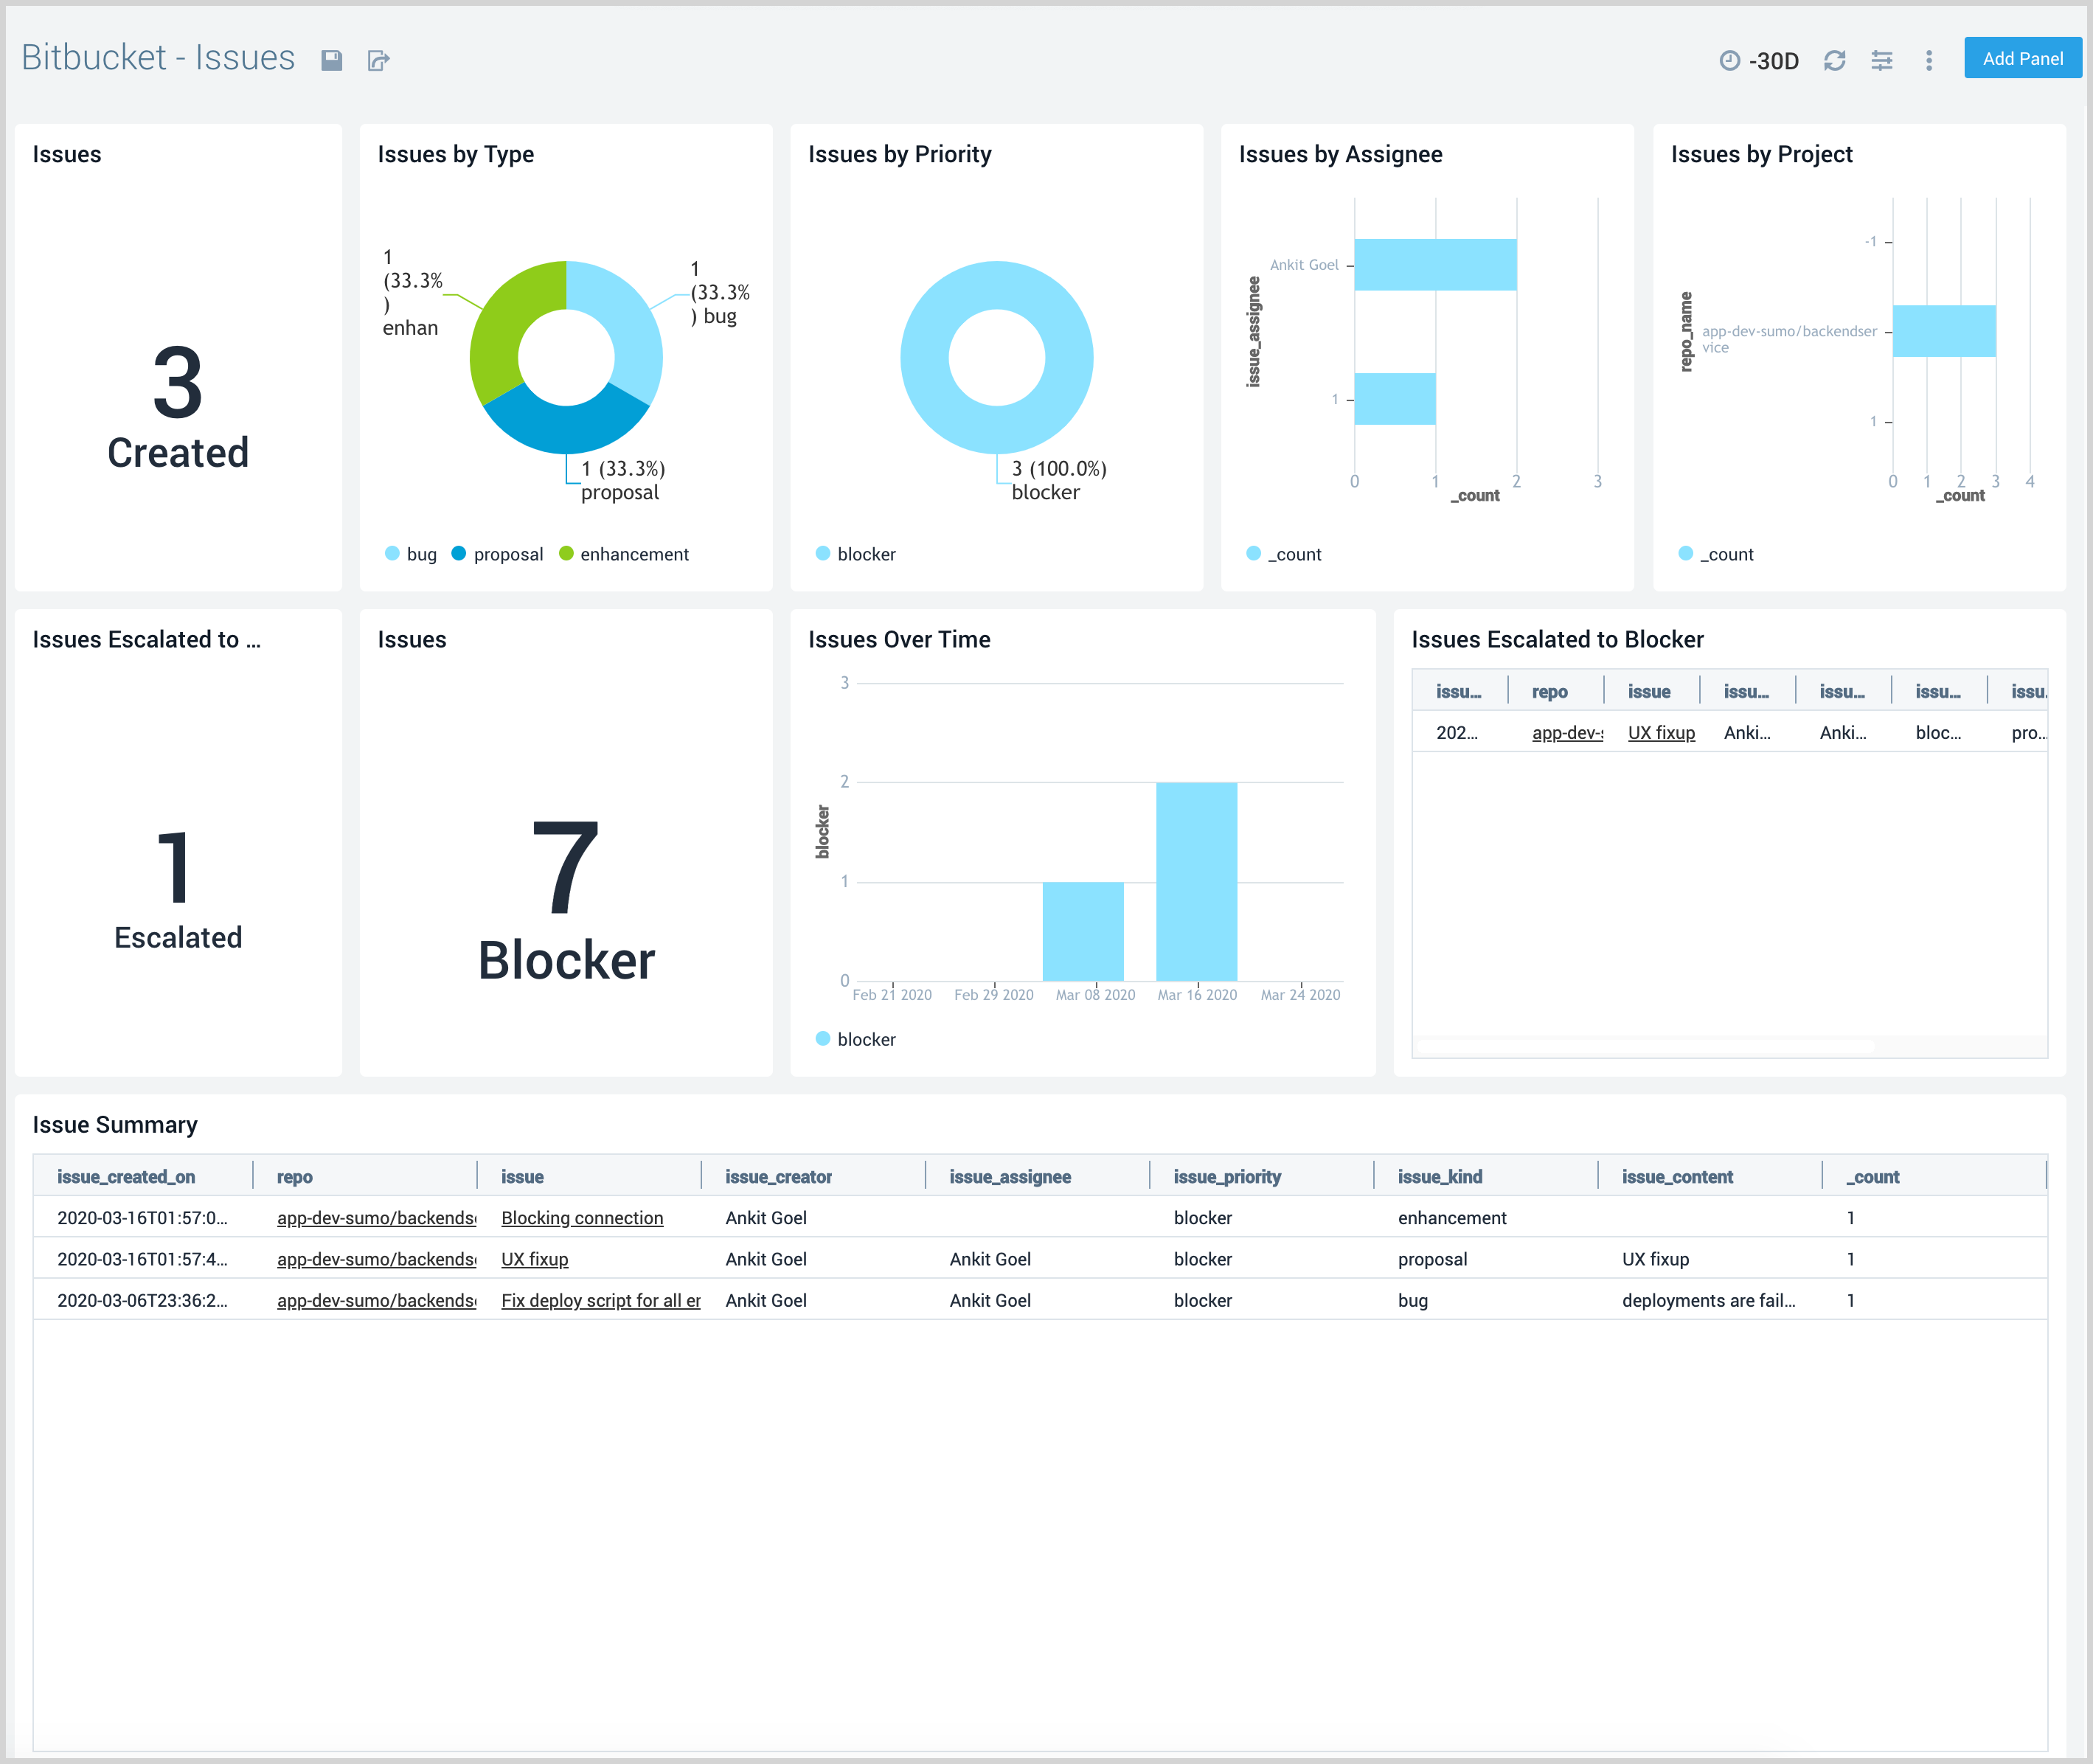
Issues
The Bitbucket - Issues dashboard provides a view of issues classified by type, priority, assignee, and project. This dashboard also provides details on issues escalated, issues summary, and issues over time.
Use this dashboard to:
- Get insights into high-level statistics around software issues.
- Improve overall software delivery processes by identifying issues by priority, projects, users, and type.
- Get insights into identifying regressions and blockers.
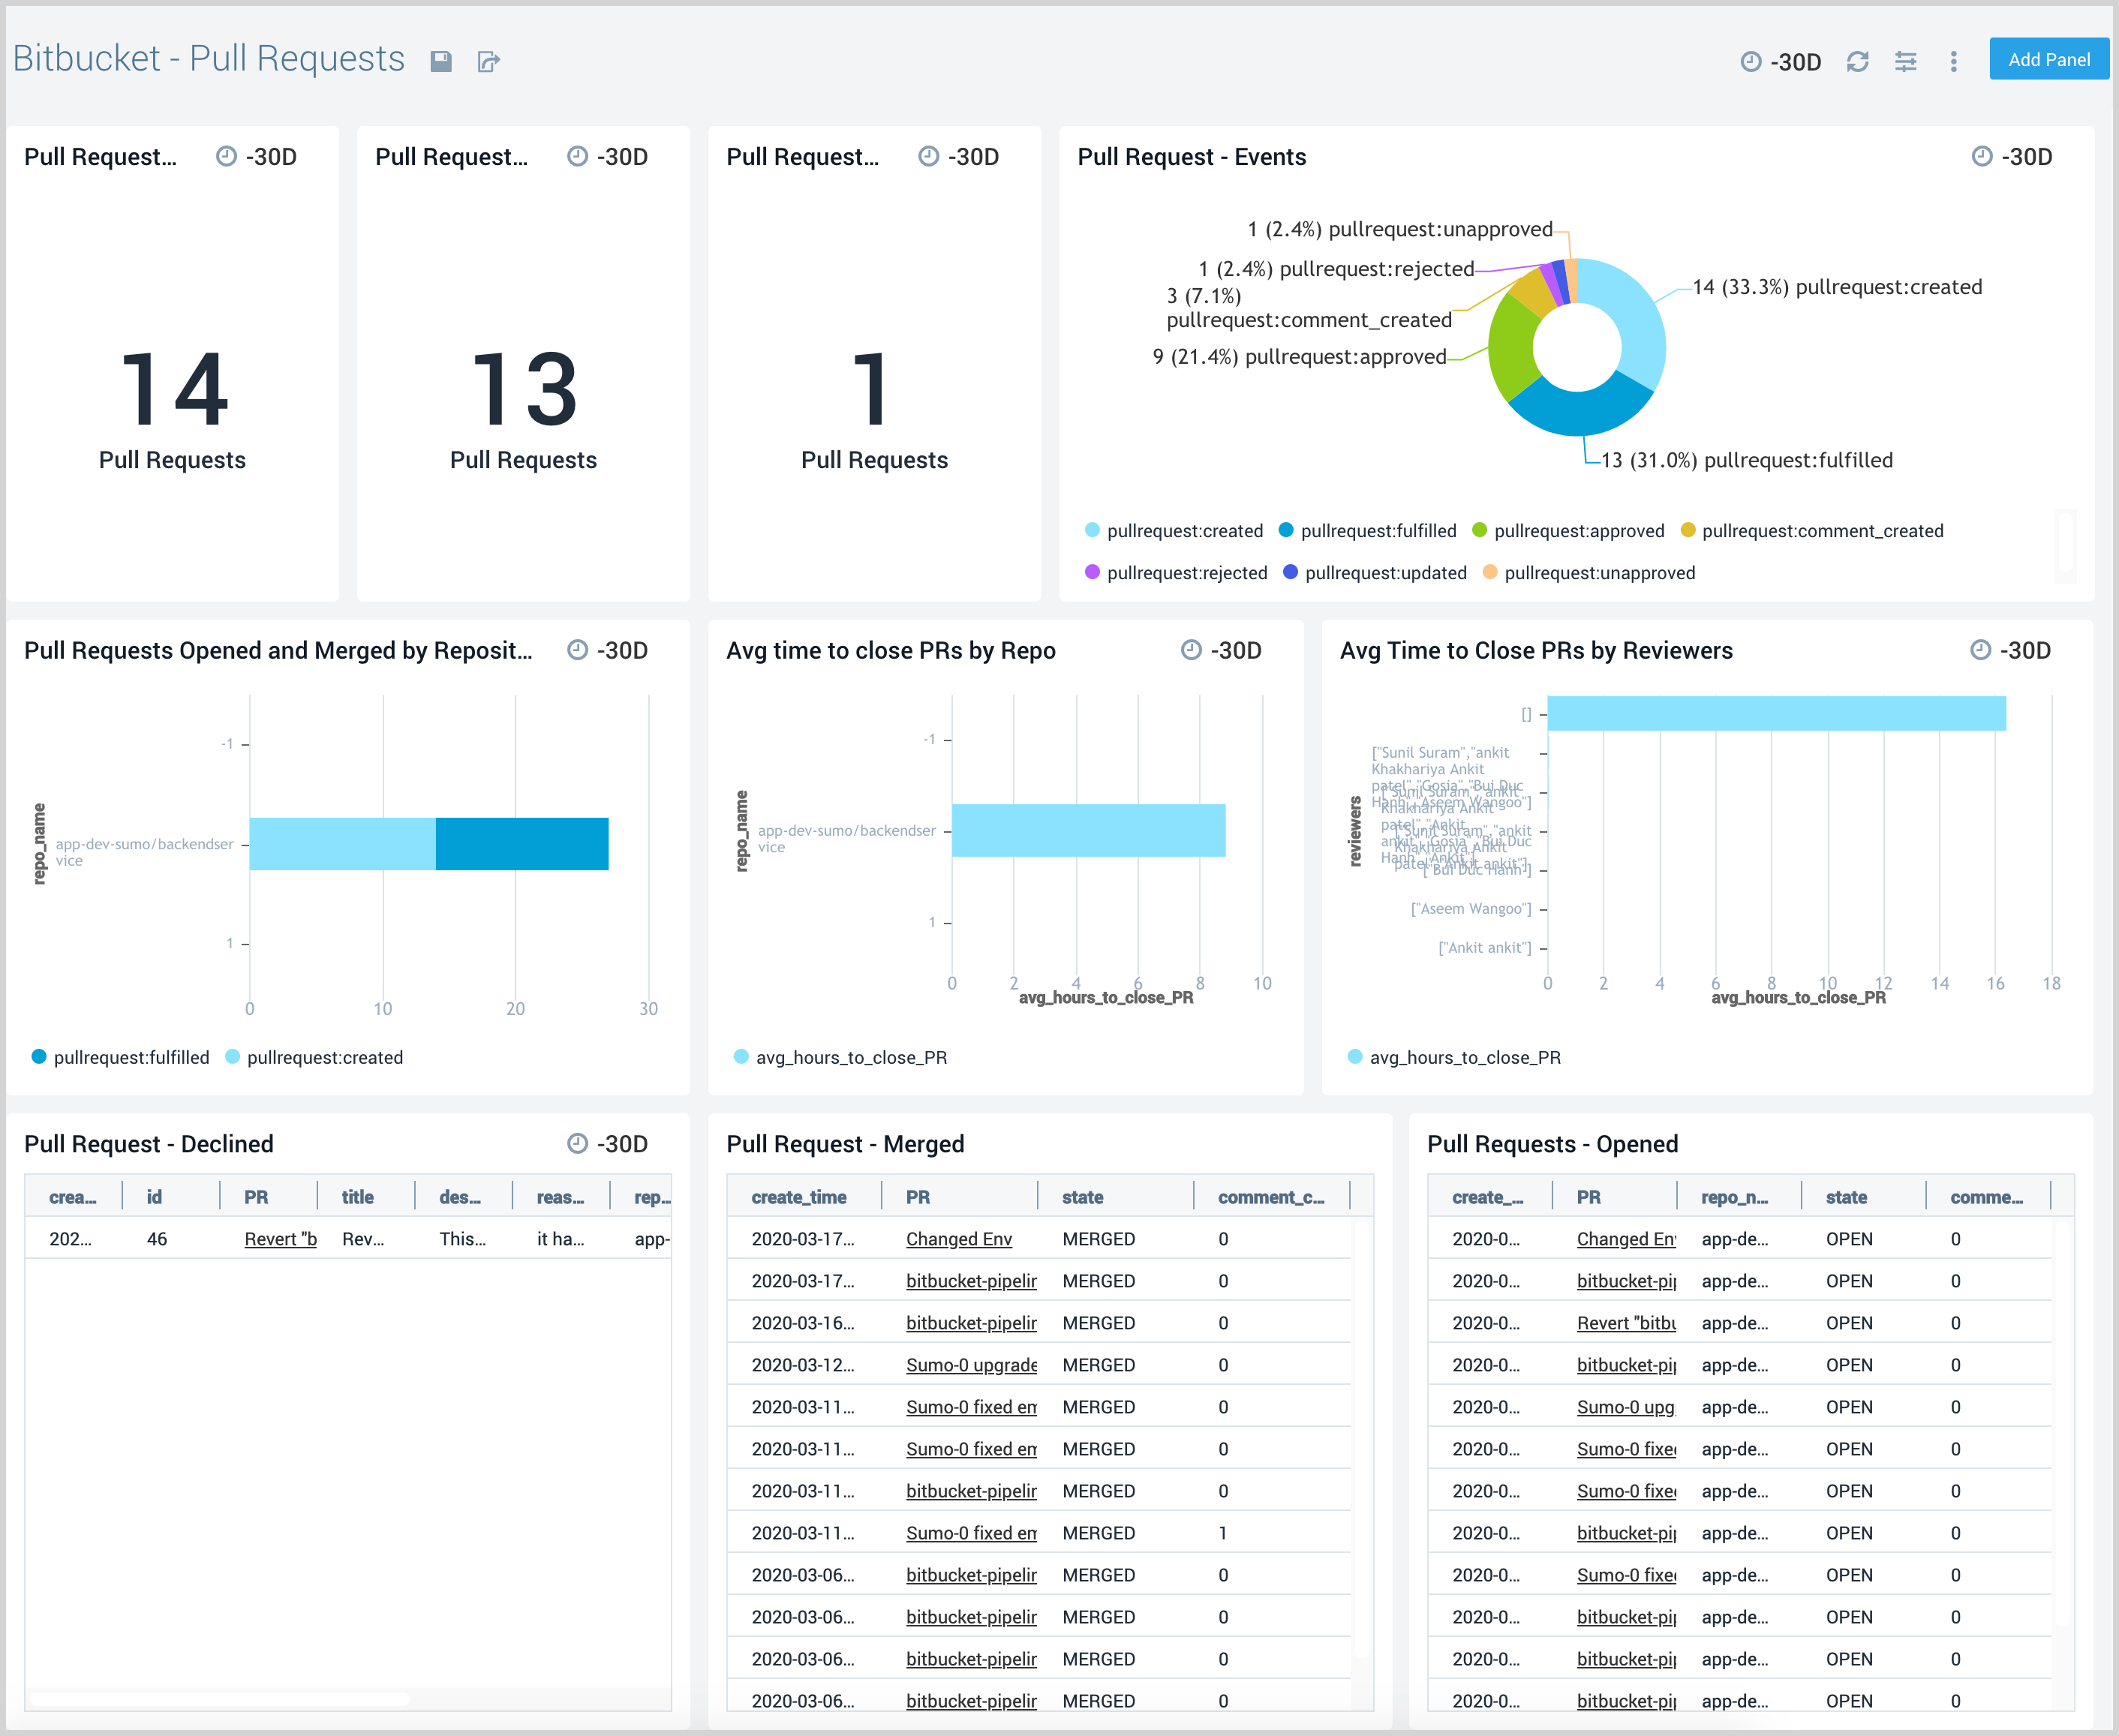
Pull Requests
The Bitbucket - Pull Request dashboard gives a view of pull requests opened, merged, and declined as well as average time taken to close the pull request by repository and by reviewers.
Use this dashboard to:
- Improve the overall software delivery processes by identifying bottlenecks in review processes.
- Identify commits and code changes.
- Identify the teams and repos that take the longest to close pull requests.