JFrog Xray

The JFrog Xray app provides visibility into the state of artifacts and components in your JFrog Artifactory repository. The pre-configured dashboards present information about issues detected in your software components in Artifactory, including vulnerable containers, artifacts and components; license and security issues; and top Common Vulnerabilities and Exposures (CVEs). The app also helps identify all incoming threats detected via Sumo Logic Threat Intel.
The Sumo Logic app for JFrog Xray and collection are tested on JFrog Xray 2.9.0 version.
Log types
The JFrog Xray app uses the following log types:
- JFrog Xray logs. JFrog Xray logs are in JSON format. For more information, see JFrog Xray Webhook payload.
- Artifactory logs. For more information, see Collecting logs.
- Kubernetes logs. For more information, see Collecting Metrics and Logs for the Kubernetes app.
Sample log messages
{
  "created": "2019-09-03 22:01:19,804 +0530",
  "top_severity": "High",
  "watch_name": "Maven_watch",
  "policy_name": "License_policy",
  "issues": [
    {
      "severity": "medium",
      "type": "License",
      "provider": "JFrog",
      "created": "2019-09-03 22:01:19,804 +0530",
      "summary": "In Libgcrypt 1.8.4, the C implementation of AES is vulnerable to a flush-and-reload side-channel attack because physical addresses are available to other processes. (The C implementation is used on platforms where an assembly-language implementation is unavailable.)",
      "description": "In Libgcrypt 1.8.4, the C implementation of AES is vulnerable to a flush-and-reload side-channel attack because physical addresses are available to other processes. (The C implementation is used on platforms where an assembly-language implementation is unavailable.)",
      "impacted_artifacts": [
        {
          "name": "mina-core-2.0.0-RC1-javadoc.jar",
          "display_name": "mina-core:2.0.0-RC1",
          "path": "/milestone/org/apache/mina/mina-core/2.0.0-RC1/mina-core-2.0.0-RC1-javadoc.jar",
          "pkg_type": "zip",
          "sha256": "ca013ac5c09f9a9f6db8370c1b759a29fe997d64d6591e9a75b71748858f7da0",
          "sha1": "4cc3661681baf84566f4e3f166127074548d4519",
          "depth": 0,
          "parent_sha": "ca013ac5c09f9a9f6db8370c1b759a29fe997d64d6591e9a75b71748858f7da0",
          "infected_files": [
            {
              "name": "SQLAlchemy-1.3.8.tar.gz",
              "path": "SQLAlchemy:1.3.8",
              "sha256": "dd1ca0d765607415523d57b7464c0bb259412cff5d9a09c281d0acfbd4eed7e3",
              "depth": 0,
              "parent_sha": "35c102085707f703de2d9eaad8752d6fe1b8f02b5d2149f1d8357c9cc7fb7d0a",
              "display_name": "/libs-milestone-local/org/springframework/spring/3.2.0.RC2/spring-framework-3.2.0.RC2-dist.zip",
              "pkg_type": "spring"
            }
          ]
        }
      ],
      "cve": "CVE-2019-12904"
    }
  ]
}
Sample queries
The sample query is from Watches Invoked panel of the JFrog Xray - Overview dashboard.
_sourceCategory = Labs/jfrog/xray
| json "top_severity", "issues", "watch_name", "policy_name" as TopSeverity, Issues, WatchName, PolicyName nodrop
| where !(TopSeverity matches "Pending Scan")
| parse regex field=Issues "(?<Issue>\{.*?(?=,\{\"severity\"|\]$))" multi
| json field=Issue "impacted_artifacts", "severity", "summary", "cve", "provider", "created", "description", "type" as Artifacts, Severity, Summary, CVE, Provider, Created, Description, PolicyType nodrop
| parse regex field=Artifacts "(?<Artifact>\{.*?(?=,\{\"sha1\"|\]$))" multi
| json field=Artifact "infected_files", "sha1", "path", "depth", "sha256", "name", "parent_sha", "display_name", "pkg_type" as Files, ArtifactSha, ArtifactPath, ArtifactDepth, ArtifactSha256, ArtifactName, ArtifactParentSha, ArtifactDisplayName, ArtifactPkgType nodrop
| parse regex field=Files "(?<File>\{[^\}]+(?:\}\}|\}))" multi
| json field=File "path", "depth", "sha256", "name", "parent_sha", "display_name", "pkg_type" as ComponentPath, ComponentDepth, ComponentSha, ComponentName, ComponentParentSha, ComponentDisplayName, ComponentPkgType nodrop
| count_distinct(WatchName) as %"Number of Watches"
Collection configuration and app installation
Choose one of the following methods to configure the JFrog Xray source and install the app:
- Cloud-to-cloud source setup and app installation
- HTTP source setup and app installation
Depending on the set up collection method, you can configure and install the app in three ways:
- Create a new collector and install the app. Create a new Sumo Logic Cloud-to-Cloud (C2C) source under a new Sumo Logic Collector and later install the app, or
- Use an existing collector and install the app. Create a new Sumo Logic Cloud-to-Cloud (C2C) source under an existing Sumo Logic Collector and later install the app, or
- Use existing source and install the app. Use your existing configured Sumo Logic Cloud-to-Cloud (C2C) source and install the app.
Use the Cloud-to-Cloud Integration for JFrog Xray to create the source and use the same source category while installing the app. By following these steps, you can ensure that your JFrog Xray app is properly integrated and configured to collect and analyze your JFrog Xray data.
Create a new collector and install the app
To set up collection and install the app, do the following:
Next-Gen App: To install or update the app, you must be an account administrator or a user with Manage Apps, Manage Monitors, Manage Fields, Manage Metric Rules, and Manage Collectors capabilities depending upon the different content types part of the app.
- Select App Catalog.
- In the 🔎 Search Apps field, run a search for your desired app, then select it.
- Click Install App.
note
Sometimes this button says Add Integration.
- In the Set Up Collection section of your respective app, select Create a new Collector.
- Collector Name. Enter a Name to display the Source in the Sumo Logic web application. The description is optional.
- Timezone. Set the default time zone when it is not extracted from the log timestamp. Time zone settings on Sources override a Collector time zone setting.
- (Optional) Metadata. Click the +Add Metadata link to add a custom log Metadata Fields. Define the fields you want to associate, each metadata field needs a name (key) and value.
 A green circle with a checkmark is shown when the field exists and is enabled in the Fields table schema.
 An orange triangle with an exclamation point is shown when the field doesn't exist, or is disabled, in the Fields table schema. In this case, an option to automatically add or enable the nonexistent fields to the Fields table schema is provided. If a field is sent to Sumo that does not exist in the Fields schema or is disabled it is ignored, known as dropped.
- Click Next.
- Configure the source as specified in the
Infobox above, ensuring all required fields are included. - In the Configure section of your respective app, complete the following fields.
- Field Name. If you already have collectors and sources set up, select the configured metadata field name (eg _sourcecategory) or specify other custom metadata (eg: _collector) along with its metadata Field Value.
- Click Next. You will be redirected to the Preview & Done section.
Post-installation
Once your app is installed, it will appear in your Installed Apps folder, and dashboard panels will start to fill automatically.
Each panel slowly fills with data matching the time range query received since the panel was created. Results will not immediately be available but will be updated with full graphs and charts over time.
Use an existing collector and install the app
To set up the source in the existing collector and install the app, do the following:
Next-Gen App: To install or update the app, you must be an account administrator or a user with Manage Apps, Manage Monitors, Manage Fields, Manage Metric Rules, and Manage Collectors capabilities depending upon the different content types part of the app.
- Select App Catalog.
- In the 🔎 Search Apps field, run a search for your desired app, then select it.
- Click Install App.
note
Sometimes this button says Add Integration.
- In the Set Up Collection section of your respective app, select Use an existing Collector.
- From the Select Collector dropdown, select the collector that you want to set up your source with and click Next.
- Configure the source as specified in the
Infobox above, ensuring all required fields are included. - In the Configure section of your respective app, complete the following fields.
- Field Name. If you already have collectors and sources set up, select the configured metadata field name (eg _sourcecategory) or specify other custom metadata (eg: _collector) along with its metadata Field Value.
- Click Next. You will be redirected to the Preview & Done section.
Post-installation
Once your app is installed, it will appear in your Installed Apps folder, and dashboard panels will start to fill automatically.
Each panel slowly fills with data matching the time range query received since the panel was created. Results will not immediately be available but will be updated with full graphs and charts over time.
Use an existing source and install the app
To skip collection and only install the app, do the following:
Next-Gen App: To install or update the app, you must be an account administrator or a user with Manage Apps, Manage Monitors, Manage Fields, Manage Metric Rules, and Manage Collectors capabilities depending upon the different content types part of the app.
- Select App Catalog.
- In the 🔎 Search Apps field, run a search for your desired app, then select it.
- Click Install App.
note
Sometimes this button says Add Integration.
- In the Set Up Collection section of your respective app, select Skip this step and use existing source and click Next.
- In the Configure section of your respective app, complete the following fields.
- Field Name. If you already have collectors and sources set up, select the configured metadata field name (eg _sourcecategory) or specify other custom metadata (eg: _collector) along with its metadata Field Value.
- Click Next. You will be redirected to the Preview & Done section.
Post-installation
Once your app is installed, it will appear in your Installed Apps folder, and dashboard panels will start to fill automatically.
Each panel slowly fills with data matching the time range query received since the panel was created. Results will not immediately be available but will be updated with full graphs and charts over time.
This section explains how to collect logs from JFrog Xray and ingest them into Sumo Logic for use with the JFrog Xray pre-defined dashboards and searches. To get the most of out this app, we recommend you also collect logs from Artifactory as well as Kubernetes.
Step 1: Collect JFrog Xray instance details
In this step you collect details for your JFrog Xray instance that you will use in the following tasks.
Collect the following details:
- HostName and Port for your JFrog Xray instance — such as: JFrog instance URL http://host-example:8000/web/#/login
- HostName = host-example
- Port = 8000
- Your Username and Password for your JFrog Xray instance
Step 2: Collect Artifactory logs
We recommend collecting data from JFrog Artifactory so as to investigate sources of vulnerable artifacts and who is using them. This is done by correlating Xray logs with Artifactory logs.
To do so, follow the instructions in Collect Logs for Artifactory.
Step 3: Collect Kubernetes logs
If you have set up a Docker repository in Artifactory and are running containers in a Kubernetes cluster, we recommend collecting data from your Kubernetes cluster so as to understand all vulnerable containers running in production.
To perform this setup, follow the instructions in Collect Logs for Kubernetes.
Step 4: Add Hosted Collector and HTTP Source
In this step you set up a hosted Sumo Logic collector and HTTP source to collect JFrog Xray logs.
Identify an existing Sumo Logic Hosted Collector you want to use, or create a new Hosted Collector as described in the following task.
When you configure the HTTP source, make sure to save the HTTP Source Address URL. You will need it when you configure the webhook in Step 5.
To add a hosted collector and HTTP source:
- Create a new Sumo Logic hosted collector by performing the steps in Configure a Hosted Collector.
- Create a new HTTP source on the hosted collector created above by following instructions in [HTTP Logs and Metrics Source]](/docs/send-data/hosted-collectors/http-source/logs-metrics).
Step 5: Set up a collection method for JFrog Xray
This section covers the various ways in which to collect logs from JFrog Xray and send them to Sumo Logic. The logs are then shown in dashboards as part of the JFrog Xray App. You can configure a Sumo Logic collector for JFrog Xray in Amazon Web Services (AWS) using AWS Lambda service, or use a script on a Linux machine with a cron job. Choose the method that best suits your environment: In this collection method, you deploy the SAM application, which creates the necessary resources in your AWS account. To deploy the Sumo Logic JFrog xray SAM Application, do the following: If you have multiple JFrog Xray instances from which you want to collect logs and send to Sumo Logic, perform the following task. To configure collection for multiple JFrog Xray instances, do the following: This section provides instructions for configuring script based collection for the Sumo Logic JFrog Xray App. The sumologic-jfrog-xray script is compatible with python 3.7 and python 2.7, and has been tested on Ubuntu 18.04 LTS. This task shows you how to install the script on a Linux machine. For Python 3 you will use pip3 install sumologic-jfrog-xray (step 3 in the following task). For systems where Python 3 is not the default - you will use /usr/bin/python3 -m sumojfrogxray.main (step 5 in the following task). To deploy the script, do the following: Optional - Configure collection for multiple projects If you have multiple projects from which you want to collect logs and send to Sumo Logic, perform the following task. To configure collection for multiple projects, do the following: Advanced configuration can be used with all JFrog Xray script-based collection configurations. This section provides a list of variables for Jfrog Xray that you can define in the configuration file.Method A: Sumo Logic JFrog Xray SAM application
Optional - Configure multiple JFrog Xray instances
Method B: Sumo Logic JFrog Xray Script-based collection
Prerequisites
sudo su <user_name>
Step 1. Configure the script on a Linux machine
pip install sumologic-jfrog-xray
pip3 install sumologic-jfrog-xray
<Variables> where indicated.
*/5 * * * * /usr/bin/python -m sumojfrogxray.main > /dev/null 2>&1
*/5 * * * * /usr/bin/python3 -m sumojfrogxray.main > /dev/null 2>&1
<DB NAME> variable in the following example.Step 2. Advanced configuration
Variable Usage BACKFILL_DAYS in Collection Section Number of days before the event collection will start. If the value is 1, then events are fetched from yesterday to today. LOG_FORMAT in Logging Section Log format used by the Python logging module to write logs in a file. ENABLE_LOGFILE in Logging Section Set to TRUE to write all logs and errors to a log file. ENABLE_CONSOLE_LOG in Logging Section Enables printing logs in a console. LOG_FILEPATH in Logging Section Path of the log file used when ENABLE_LOGFILE is set to TRUE. NUM_WORKERS in Collection Section Number of threads to spawn for API calls. MAX_RETRY in Collection Section Number of retries to attempt in case of request failure. BACKOFF_FACTOR in Collection Section A backoff factor to apply between attempts after the second try. If the backoff_factor is 0.1, then sleep() will sleep for [0.0s, 0.2s, 0.4s, ...] between retries. TIMEOUT in Collection Section Request timeout used by the requests library. HTTP_LOGS_ENDPOINT in Sumo Logic Section HTTP source endpoint URL created in Sumo Logic for ingesting logs.
Troubleshooting
This section shows you how to run the function manually and then verify that log messages are being sent from JFrog Xray.
To run the function manually, do the following:
- Do one of the following:
- For python, run this command:
python -m sumojfrogxray.main- For python3, run this command:
python3 -m sumojfrogxray.main - The script generates logs in /tmp/sumoapiclient.log by default. Check these logs to verify whether the script is getting triggered or not.
- If you get an error such as unable to execute
'gcc': No such file or directory, error: command 'gcc' failed with exit status 1, go to your AWS EC2 instance and run the following commands:
sudo yum -y install gcc
sudo yum install python-devel
Installing the JFrog Xray app
To install the app, do the following:
Next-Gen App: To install or update the app, you must be an account administrator or a user with Manage Apps, Manage Monitors, Manage Fields, Manage Metric Rules, and Manage Collectors capabilities depending upon the different content types part of the app.
- Select App Catalog.
- In the 🔎 Search Apps field, run a search for your desired app, then select it.
- Click Install App.
note
Sometimes this button says Add Integration.
- Click Next in the Setup Data section.
- In the Configure section of your respective app, complete the following fields.
- Field Name. If you already have collectors and sources set up, select the configured metadata field name (eg _sourcecategory) or specify other custom metadata (eg: _collector) along with its metadata Field Value.
- Click Next. You will be redirected to the Preview & Done section.
Post-installation
Once your app is installed, it will appear in your Installed Apps folder, and dashboard panels will start to fill automatically.
Each panel slowly fills with data matching the time range query received since the panel was created. Results will not immediately be available but will be updated with full graphs and charts over time.
Viewing JFrog Xray dashboards
All dashboards have a set of filters that you can apply to the entire dashboard. Use these filters to drill down and examine the data to a granular level.
- You can change the time range for a dashboard or panel by selecting a predefined interval from a drop-down list, choosing a recently used time range, or specifying custom dates and times. Learn more.
- You can use template variables to drill down and examine the data on a granular level. For more information, see Filtering Dashboards with Template Variables.
- Most Next-Gen apps allow you to provide the scope at the installation time and are comprised of a key (
_sourceCategoryby default) and a default value for this key. Based on your input, the app dashboards will be parameterized with a dashboard variable, allowing you to change the dataset queried by all panels. This eliminates the need to create multiple copies of the same dashboard with different queries.
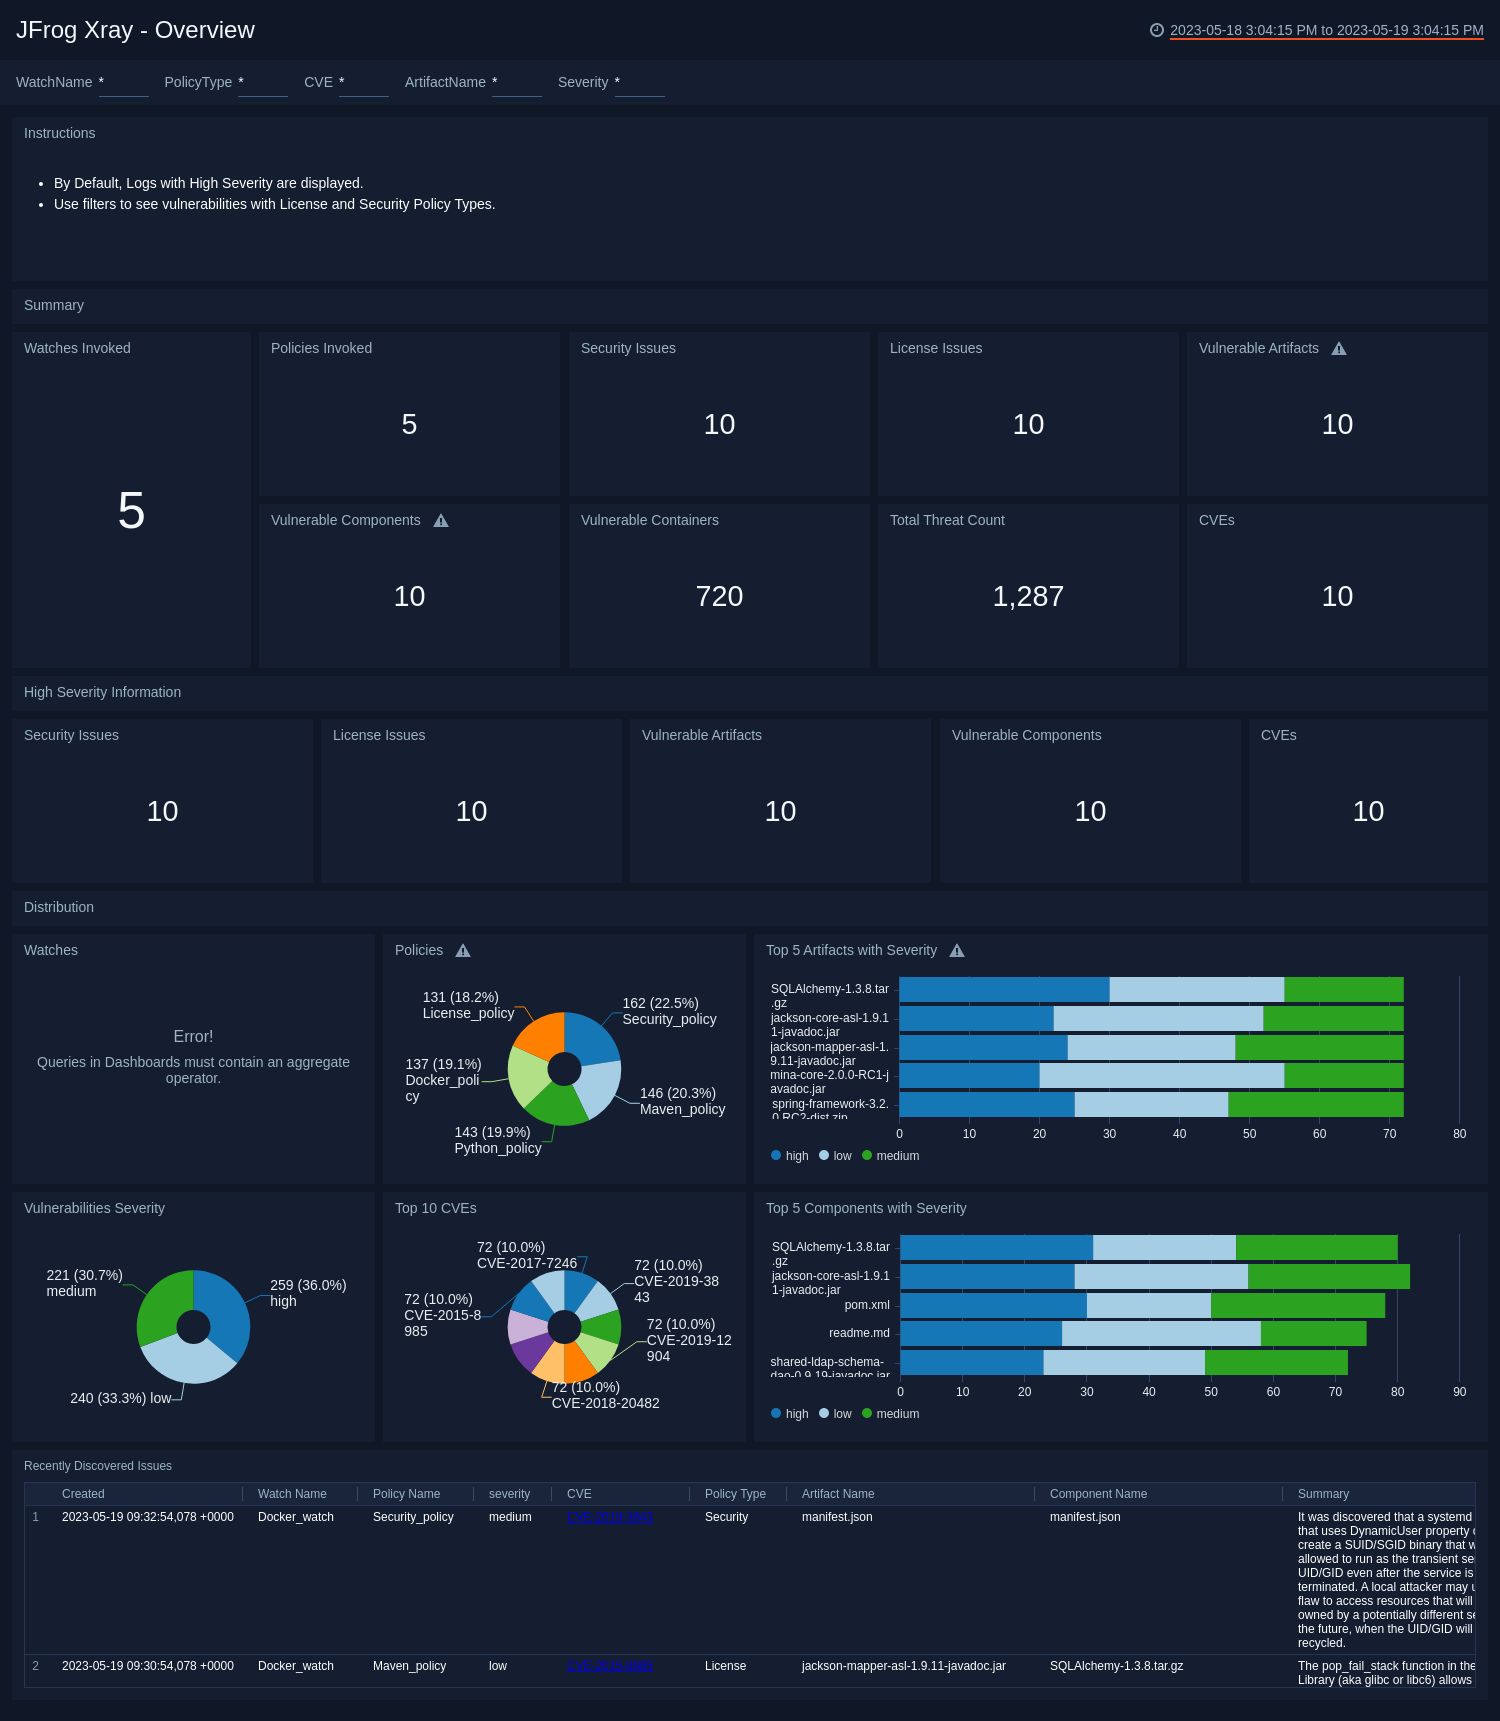
Overview
The JFrog Xray - Overview dashboard provides an at-a-glance overview of issues detected in your software components in Artifactory, including vulnerable containers, artifacts and components, as well as the top Common Vulnerabilities and Exposures (CVEs) detected.
Use this dashboard to:
- Monitor watches invoked, policies invoked, vulnerable artifacts and components.
- Monitor threats, vulnerable containers, CVEs.
- Monitor security and license vulnerabilities.
- Monitor high severity information for all artifacts.
- Identify artifacts with most severities segregated by type of severity.
- Look at the recently discovered vulnerabilities.
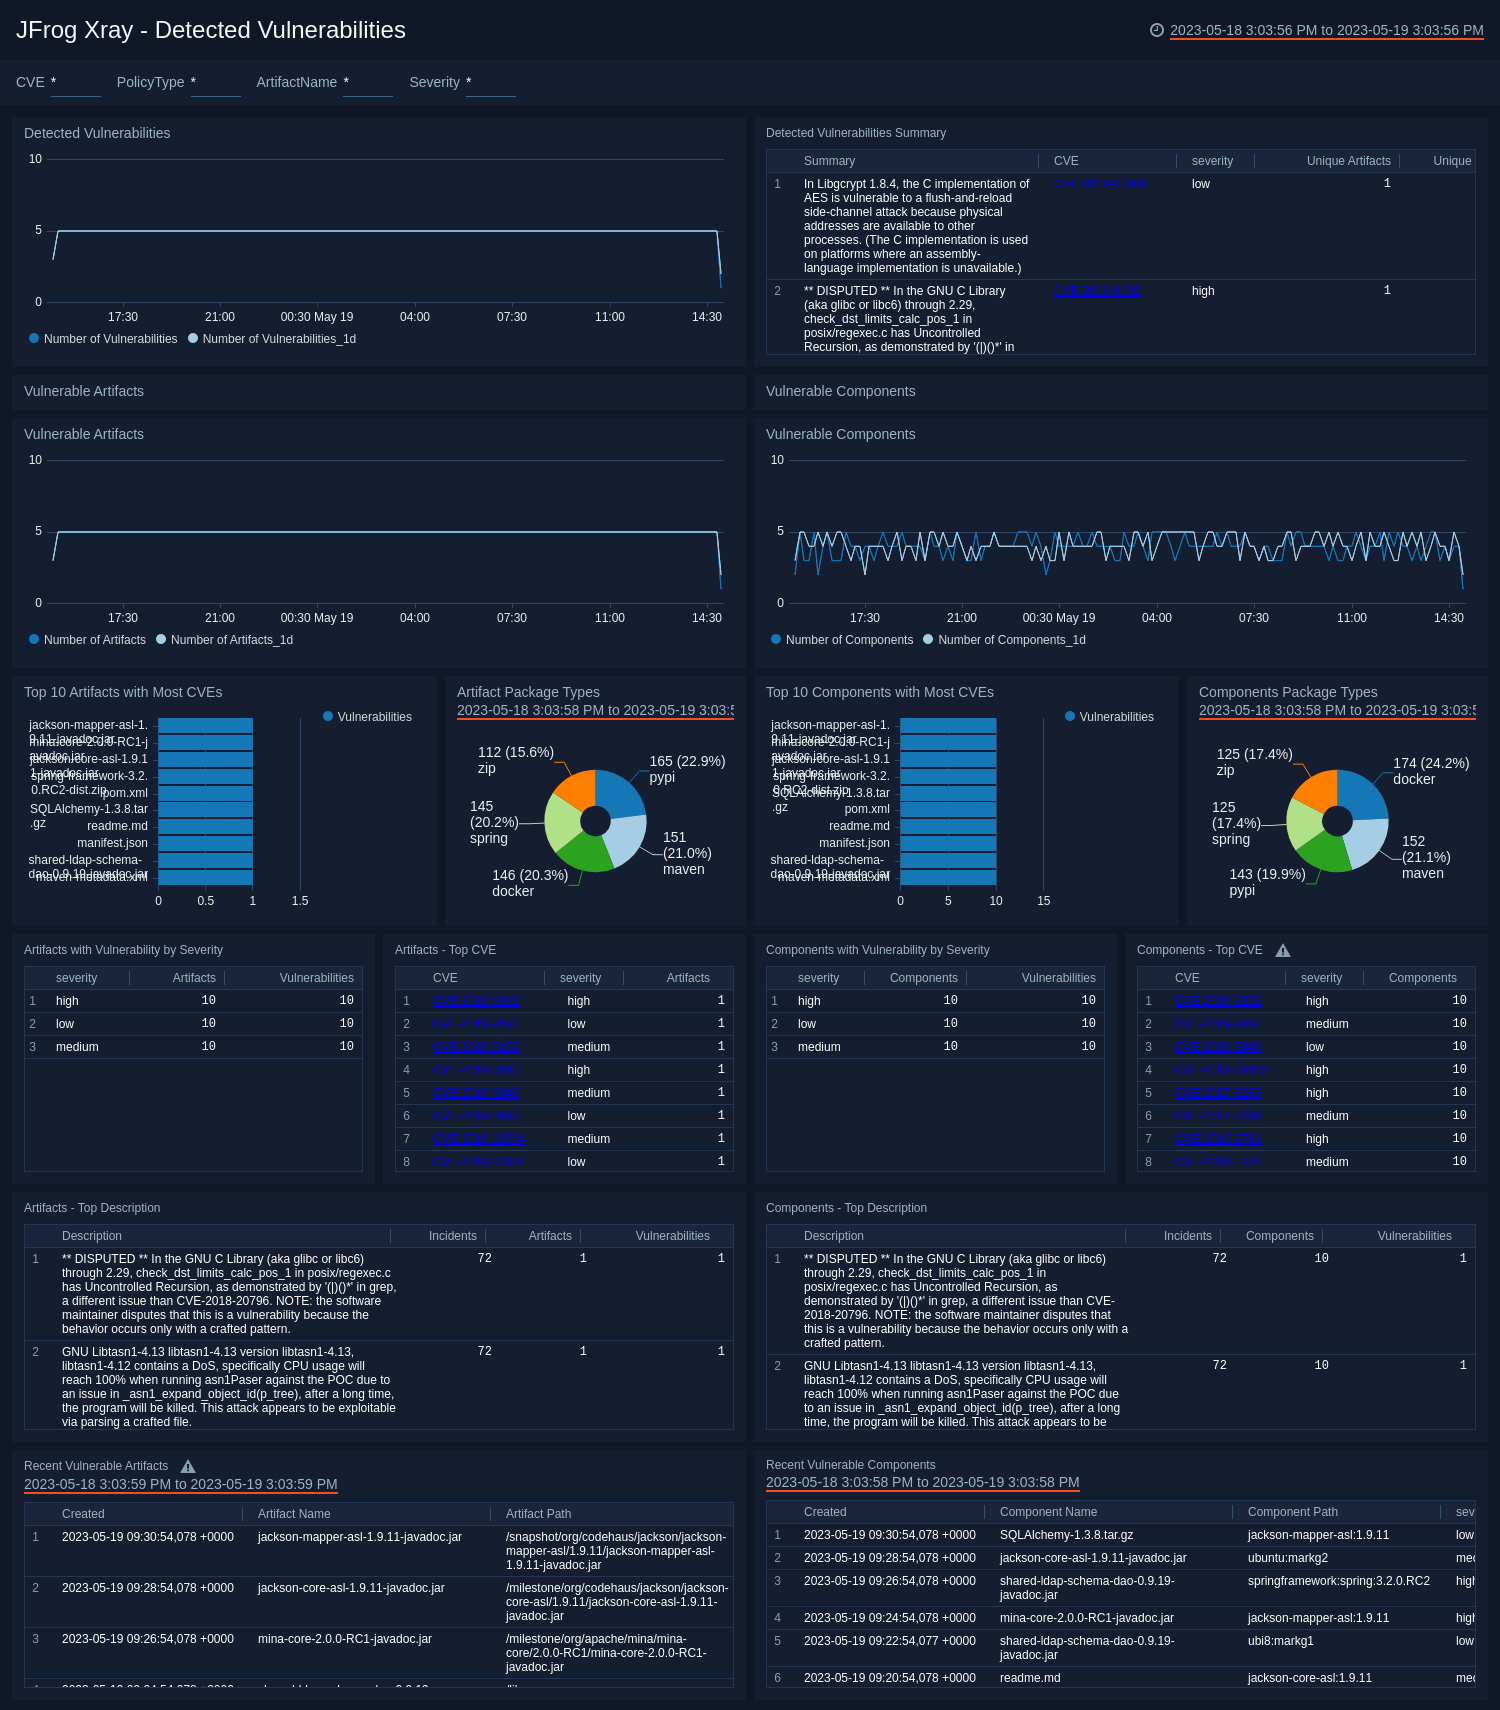
Detected Vulnerabilities
The JFrog Xray - Detected Vulnerabilities dashboard provides insight around users and client IP addresses that both uploaded and downloaded vulnerable artifacts into Artifactory.
Use this dashboard to:
- Monitor all vulnerable artifacts and components across your artifactory.
- Identify the top CVE that has affected the artifactory.
- Identify the trends for vulnerable artifacts and components.
- Identify number of artifacts and components affected by CVE along with description.
- Identify most vulnerable package types for artifacts and components.
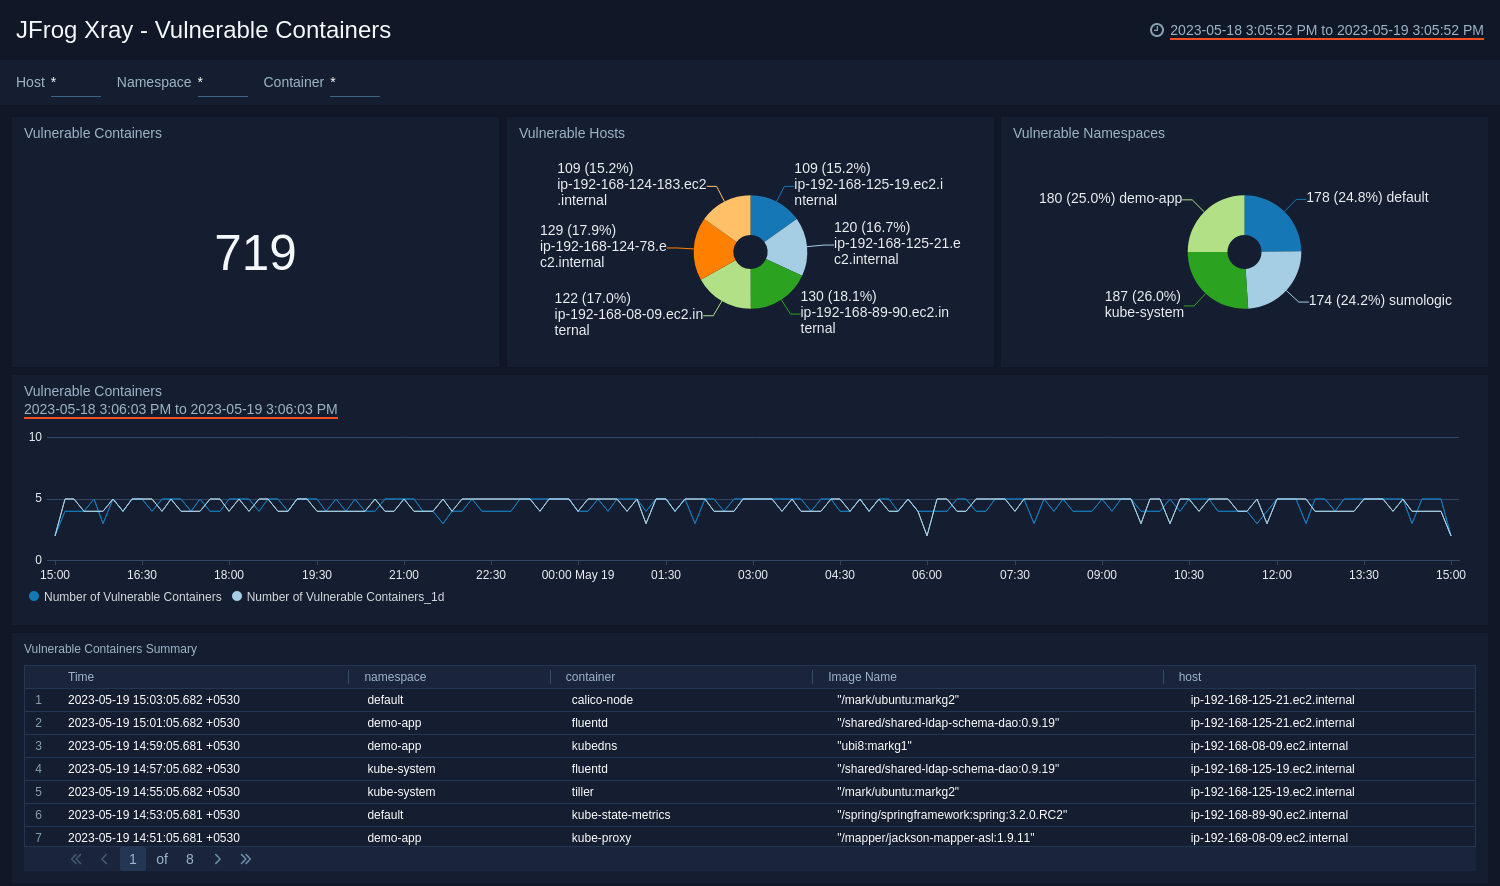
Vulnerable Containers
The JFrog Xray - Vulnerable Containers dashboard provides information on vulnerable containers as well as hosts and namespaces associated with them.
- Use this dashboard to:
- Identify vulnerable containers, hosts and namespaces.
- Identify the trend of vulnerable containers.
- Monitor recent images pulled from Artifactory by vulnerable containers.
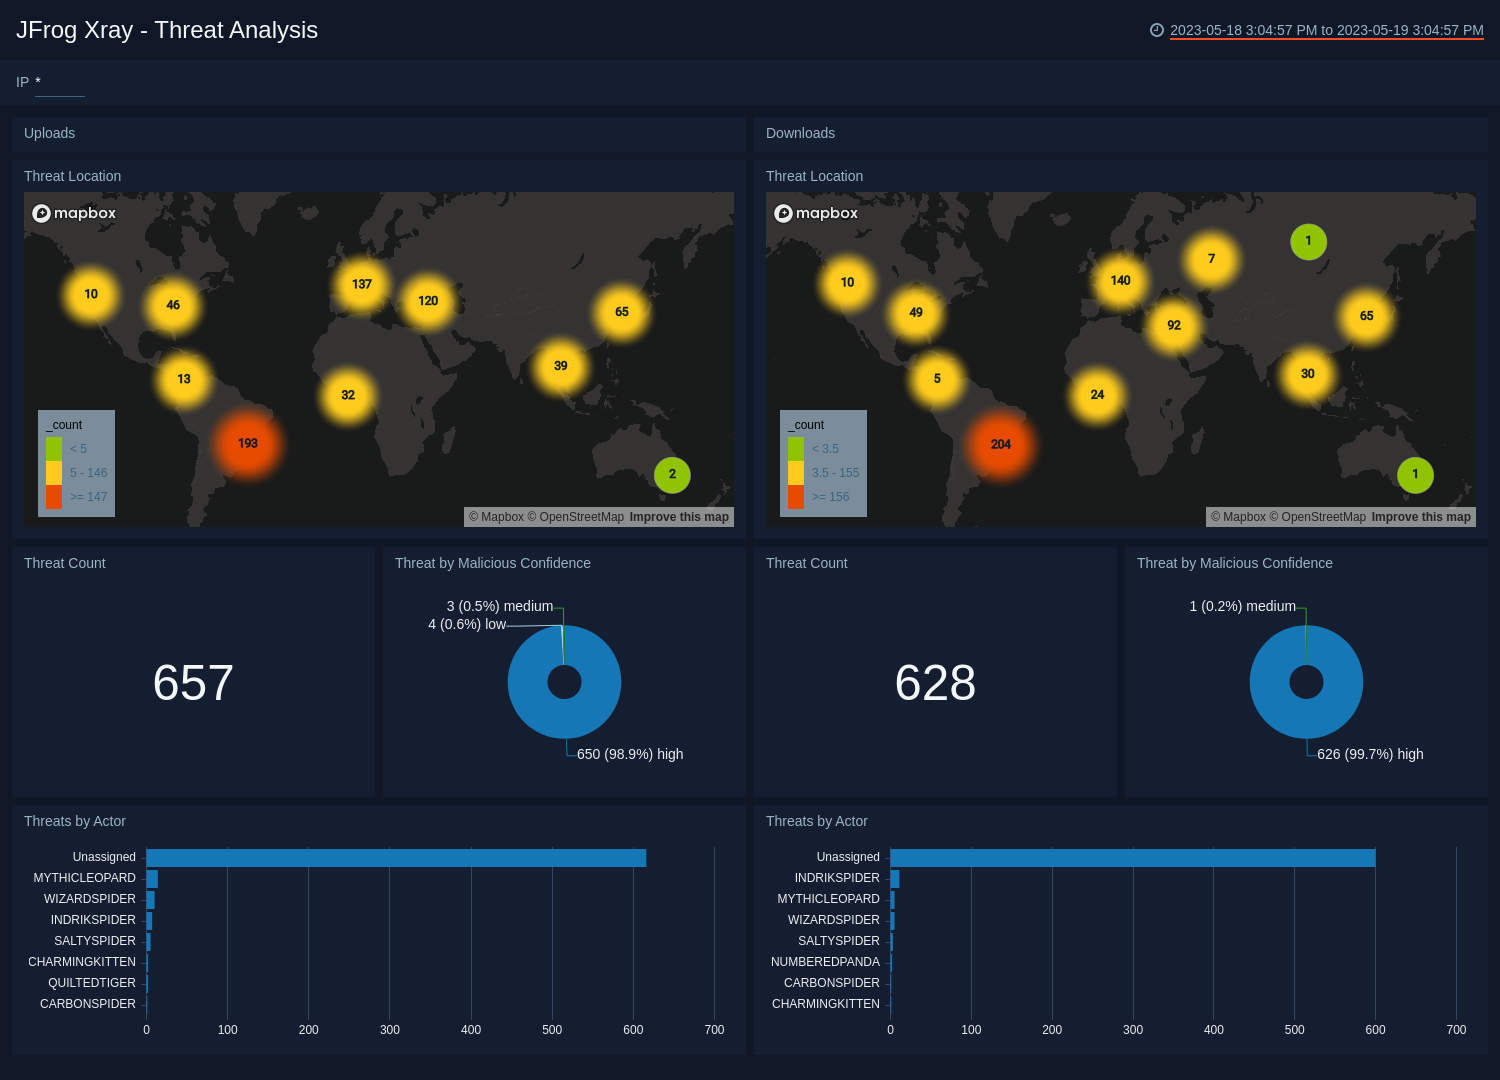
Threat Analysis
The JFrog Xray - Threat Analysis dashboard provides insight into threats and indicators of compromise of all vulnerable artifacts detected by Xray by correlating Artifactory logs with Xray logs.
Use this dashboard to:
- Identify all vulnerable artifacts that are downloaded or uploaded on Artifactory via Sumo Logic Threat intel.
- Identify locations of all vulnerable IP’s downloading or uploading artifacts.
- Monitor the malicious confidence for the threats.
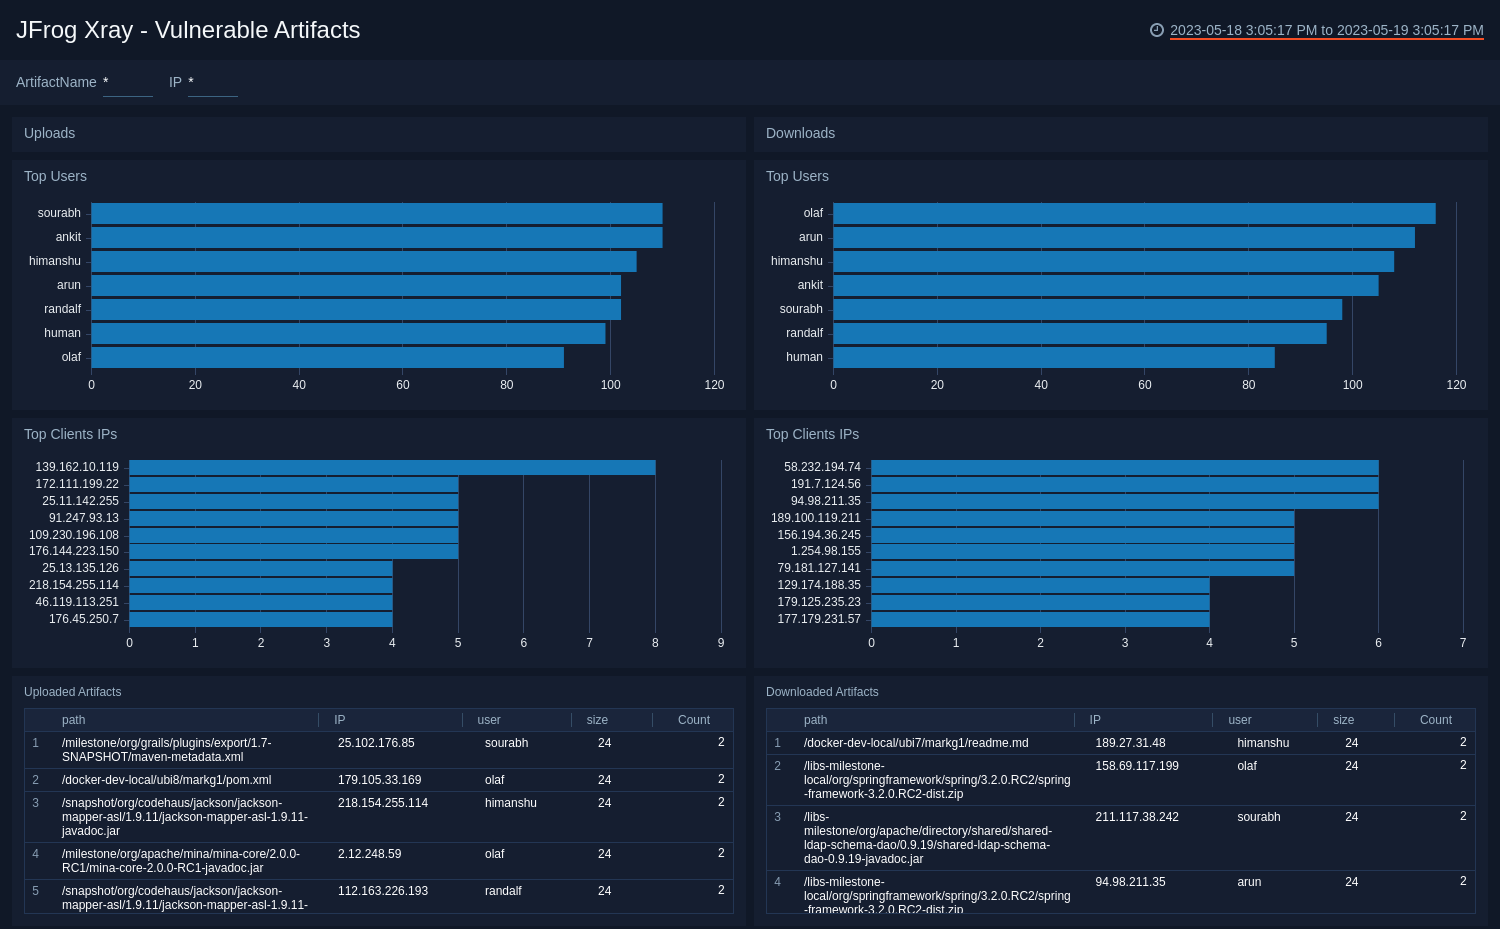
Vulnerable Artifacts
The JFrog Xray - Vulnerable Artifacts dashboard provides detailed insight into Xray issues, vulnerable artifacts and files.
Use this dashboard to:
- Identify top users uploading or downloading the vulnerable artifacts.
- Identify all the IPs uploading or downloading the vulnerable artifacts.
- Monitor recent uploaded and downloaded artifacts.
Upgrade/Downgrade the JFrog Xray app (Optional)
To update the app, do the following:
Next-Gen App: To install or update the app, you must be an account administrator or a user with Manage Apps, Manage Monitors, Manage Fields, Manage Metric Rules, and Manage Collectors capabilities depending upon the different content types part of the app.
- Select App Catalog.
- In the Search Apps field, search for and then select your app.
Optionally, you can identify apps that can be upgraded in the Upgrade available section. - To upgrade the app, select Upgrade from the Manage dropdown.
- If the upgrade does not have any configuration or property changes, you will be redirected to the Preview & Done section.
- If the upgrade has any configuration or property changes, you will be redirected to the Setup Data page.
- In the Configure section of your respective app, complete the following fields.
- Field Name. If you already have collectors and sources set up, select the configured metadata field name (eg _sourcecategory) or specify other custom metadata (eg: _collector) along with its metadata Field Value.
- Click Next. You will be redirected to the Preview & Done section.
Post-update
Your upgraded app will be installed in the Installed Apps folder and dashboard panels will start to fill automatically.
See our Release Notes changelog for new updates in the app.
To revert the app to a previous version, do the following:
- Select App Catalog.
- In the Search Apps field, search for and then select your app.
- To version down the app, select Revert to < previous version of your app > from the Manage dropdown.
Uninstalling the JFrog Xray app (Optional)
To uninstall the app, do the following:
- Select App Catalog.
- In the 🔎 Search Apps field, run a search for your desired app, then select it.
- Click Uninstall.