Jira

The Sumo Logic app for Jira provides insight into Jira usage, request activity, issues, security, sprint events, and user events.
The Jira app supports Jira Server. For Jira Cloud, please see documentation for the Jira Cloud app.
Log types
The Jira app uses the following log types:
- Jira Access Logs. Apache HTTP server log files, in
/var/log/apache2/*.log. - Jira Security Logs. Security-related information, such as logins, logouts, session creation/destruction, and security denials from
atlassian-jira-security.log. - Jira Catalina Logs. The application server log file,
logs/catalina.out, in your Jira Installation Directory. - Jira Webhooks. Webhook events of types:
- Issue
- User
- Sprint
For more information, see Webhooks in Jira help.
Sample queries
_sourceCategory=Jira/events (user_created or user_deleted or user_updated)
| json  "webhookEvent", "user.emailAddress", "user.displayName", "user.name", "timestamp" as event_name, user_email, user_name, user, timestamp nodrop
| where event_name ="user_created"
| formatDate(fromMillis(timestamp), "MM-dd-yyyy HH:mm:ss") as date_time
| count by date_time, user_email, user_name
| fields - _count
| sort by date_time desc
Sample log messages
Click to expand. See sample logs for Jira access, Jira catalina, Jira issue.
10.189.181.31 - qe@abc.com [24/Sep/2018:13:31:05 -0700] "POST /testrail/index.php?/api/v2/add_result_for_case/253843/13308563 HTTP/1.1" 200 426 "-" "Go-http-client/1.1"
24-Sep-2018 13:31:11.370 WARNING [ajp-nio-8009-exec-973] com.sun.jersey.spi.container.servlet.WebComponent.filterFormParameters A servlet request, to the URI https://jira.shoporg.com/jira/rest/b...sitory/60/sync, contains form parameters in the request body but the request body has been consumed by the servlet or a servlet filter accessing the request parameters. Only resource methods using @FormParam will work as expected. Resource methods consuming the request body by other means will not work as expected.
{
	"timestamp":1537732077661,
	"webhookEvent":"jira:issue_updated",
	"issue_event_type_name":"issue_closed",
	"user":{
		"self":"https://jira.ShopperOrg.com/jira/rest/api/2/user?username=german",
		"name":"german",
		"key":"german",
		"emailAddress":"randa@ShopperOrg.com",
		"avatarUrls":{
			"48x48":"https://jira.ShopperOrg.com/jira/secure/useravatar?ownerId=german&avatarId=10823",
			"24x24":"https://jira.ShopperOrg.com/jira/secure/useravatar?size=small&ownerId=german&avatarId=10823",
			"16x16":"https://jira.ShopperOrg.com/jira/secure/useravatar?size=xsmall&ownerId=german&avatarId=10823",
			"32x32":"https://jira.ShopperOrg.com/jira/secure/useravatar?size=medium&ownerId=german&avatarId=10823"
		},
		"displayName":"German Borbolla Flores",
		"active":true,
		"timeZone":"America/Los_Angeles"
	},
	"issue":{
		"id":"816890",
		"self":"https://jira.ShopperOrg.com/jira/rest/api/2/issue/816890",
		"key":"SUMO-96260",
		"fields":{
			"issuetype":{
				"self":"https://jira.ShopperOrg.com/jira/rest/api/2/issuetype/23",
				"id":"23",
				"description":"A required change for production",
				"iconUrl":"https://jira.ShopperOrg.com/jira/images/icons/issuetypes/documentation.png",
				"name":"System Change",
				"subtask":false
			},
			"customfield_13260":null,
			"customfield_11360":"0.0",
			"timespent":null,
			"customfield_13661":null,
			"customfield_13660":null,
			"project":{
				"self":"https://jira.ShopperOrg.com/jira/rest/api/2/project/10000",
				"id":"10000",
				"key":"SUMO",
				"name":"Shopper Org",
				"avatarUrls":{
					"48x48":"https://jira.ShopperOrg.com/jira/secure/projectavatar?pid=10000&avatarId=11420",
					"24x24":"https://jira.ShopperOrg.com/jira/secure/projectavatar?size=small&pid=10000&avatarId=11420",
					"16x16":"https://jira.ShopperOrg.com/jira/secure/projectavatar?size=xsmall&pid=10000&avatarId=11420",
					"32x32":"https://jira.ShopperOrg.com/jira/secure/projectavatar?size=medium&pid=10000&avatarId=11420"
				}
			},
			"customfield_11760":{
				"self":"https://jira.ShopperOrg.com/jira/rest/api/2/customFieldOption/11331",
				"value":"false",
				"id":"11331"
			},
			"customfield_13663":null,
			"customfield_13861":null,
			"customfield_13662":null,
			"customfield_11762":[
				{
					"self":"https://jira.ShopperOrg.com/jira/rest/api/2/customFieldOption/11351",
					"value":"Long",
					"id":"11351"
				},
				{
					"self":"https://jira.ShopperOrg.com/jira/rest/api/2/customFieldOption/11352",
					"value":"Syd",
					"id":"11352"
				},
				{
					"self":"https://jira.ShopperOrg.com/jira/rest/api/2/customFieldOption/11434",
					"value":"Dub",
					"id":"11434"
				},
				{
					"self":"https://jira.ShopperOrg.com/jira/rest/api/2/customFieldOption/12935",
					"value":"Fra",
					"id":"12935"
				},
				{
					"self":"https://jira.ShopperOrg.com/jira/rest/api/2/customFieldOption/11350",
					"value":"Prod",
					"id":"11350"
				},
				{
					"self":"https://jira.ShopperOrg.com/jira/rest/api/2/customFieldOption/11645",
					"value":"US2",
					"id":"11645"
				}
			],
			"aggregatetimespent":null,
			"resolution":{
				"self":"https://jira.ShopperOrg.com/jira/rest/api/2/resolution/1",
				"id":"1",
				"description":".",
				"name":"Fixed"
			},
			"customfield_10871":{
				"self":"https://jira.ShopperOrg.com/jira/rest/api/2/customFieldOption/12736",
				"value":"Out of Window (SOP)",
				"id":"12736"
			},
			"customfield_13664":null,
			"customfield_10872":"Done before",
			"customfield_11763":[
				{
					"self":"https://jira.ShopperOrg.com/jira/rest/api/2/customFieldOption/11353",
					"value":"Long",
					"id":"11353"
				},
				{
					"self":"https://jira.ShopperOrg.com/jira/rest/api/2/customFieldOption/11354",
					"value":"Syd",
					"id":"11354"
				},
				{
					"self":"https://jira.ShopperOrg.com/jira/rest/api/2/customFieldOption/11433",
					"value":"Dub",
					"id":"11433"
				},
				{
					"self":"https://jira.ShopperOrg.com/jira/rest/api/2/customFieldOption/12936",
					"value":"Fra",
					"id":"12936"
				},
				{
					"self":"https://jira.ShopperOrg.com/jira/rest/api/2/customFieldOption/11355",
					"value":"Prod",
					"id":"11355"
				},
				{
					"self":"https://jira.ShopperOrg.com/jira/rest/api/2/customFieldOption/11646",
					"value":"US2",
					"id":"11646"
				}
			],
			"customfield_10873":"",
			"resolutiondate":"2018-09-23T12:47:57.606-0700",
			"workratio":-1,
			"lastViewed":"2018-09-23T12:47:57.591-0700",
			"watches":{
				"self":"https://jira.ShopperOrg.com/jira/rest/api/2/issue/SUMO-96260/watchers",
				"watchCount":0,
				"isWatching":false
			},
			"customfield_12480":"9223372036854775807",
			"customfield_12160":null,
			"created":"2018-09-20T11:14:03.000-0700",
			"customfield_12283":null,
			"customfield_12561":"9223372036854775807",
			"customfield_11670":null,
			"customfield_12164":null,
			"customfield_10460":null,
			"customfield_12560":"9223372036854775807",
			"customfield_12288":"N/a",
			"customfield_11671":"2018-09-20",
			"customfield_12961":"0|o01keg:",
			"customfield_12960":"1|zo09v4:",
			"customfield_12963":"0|i0jru7:",
			"customfield_12566":"9223372036854775807",
			"labels":[

			],
			"customfield_12962":"0|i0jru7:",
			"customfield_11668":"false",
			"timeestimate":null,
			"aggregatetimeoriginalestimate":null,
			"issuelinks":[

			],
			"assignee":{
				"self":"https://jira.ShopperOrg.com/jira/rest/api/2/user?username=german",
				"name":"german",
				"key":"german",
				"emailAddress":"randa@ShopperOrg.com",
				"avatarUrls":{
					"48x48":"https://jira.ShopperOrg.com/jira/secure/useravatar?ownerId=german&avatarId=10823",
					"24x24":"https://jira.ShopperOrg.com/jira/secure/useravatar?size=small&ownerId=german&avatarId=10823",
					"16x16":"https://jira.ShopperOrg.com/jira/secure/useravatar?size=xsmall&ownerId=german&avatarId=10823",
					"32x32":"https://jira.ShopperOrg.com/jira/secure/useravatar?size=medium&ownerId=german&avatarId=10823"
				},
				"displayName":"German Borbolla Flores",
				"active":true,
				"timeZone":"America/Los_Angeles"
			},
			"updated":"2018-09-23T12:47:57.653-0700",
			"status":{
				"self":"https://jira.ShopperOrg.com/jira/rest/api/2/status/6",
				"description":"The issue is considered finished, the resolution is correct. Issues which are closed can be reopened.",
				"iconUrl":"https://jira.ShopperOrg.com/jira/images/icons/statuses/closed.png",
				"name":"Closed",
				"id":"6",
				"statusCategory":{
					"self":"https://jira.ShopperOrg.com/jira/rest/api/2/statuscategory/3",
					"id":3,
					"key":"done",
					"colorName":"green",
					"name":"Done"
				}
			},
			"components":[

			],
			"customfield_12070":" ",
			"customfield_13360":null,
			"timeoriginalestimate":null,
			"description":"",
			"customfield_11462":"Data flows",
			"customfield_12479":"9223372036854775807",
			"customfield_12478":null,
			"timetracking":{

			},
			"attachment":[

			],
			"aggregatetimeestimate":null,
			"summary":"",
			"creator":{
				"self":"https://jira.ShopperOrg.com/jira/rest/api/2/user?username=german",
				"name":"german",
				"key":"german",
				"emailAddress":"randa@ShopperOrg.com",
				"avatarUrls":{
					"48x48":"https://jira.ShopperOrg.com/jira/secure/useravatar?ownerId=german&avatarId=10823",
					"24x24":"https://jira.ShopperOrg.com/jira/secure/useravatar?size=small&ownerId=german&avatarId=10823",
					"16x16":"https://jira.ShopperOrg.com/jira/secure/useravatar?size=xsmall&ownerId=german&avatarId=10823",
					"32x32":"https://jira.ShopperOrg.com/jira/secure/useravatar?size=medium&ownerId=german&avatarId=10823"
				},
				"displayName":"German Borbolla Flores",
				"active":true,
				"timeZone":"America/Los_Angeles"
			},
			"customfield_12260":null,
			"customfield_11170":null,
			"subtasks":[

			],
			"customfield_12262":null,
			"customfield_12261":null,
			"customfield_12066":null,
			"customfield_12065":null,
			"customfield_10042":{
				"self":"https://jira.ShopperOrg.com/jira/rest/api/2/customFieldOption/10022",
				"value":"Nite",
				"id":"10022"
			},
			"reporter":{
				"self":"https://jira.ShopperOrg.com/jira/rest/api/2/user?username=german",
				"name":"german",
				"key":"german",
				"emailAddress":"randa@ShopperOrg.com",
				"avatarUrls":{
					"48x48":"https://jira.ShopperOrg.com/jira/secure/useravatar?ownerId=german&avatarId=10823",
					"24x24":"https://jira.ShopperOrg.com/jira/secure/useravatar?size=small&ownerId=german&avatarId=10823",
					"16x16":"https://jira.ShopperOrg.com/jira/secure/useravatar?size=xsmall&ownerId=german&avatarId=10823",
					"32x32":"https://jira.ShopperOrg.com/jira/secure/useravatar?size=medium&ownerId=german&avatarId=10823"
				},
				"displayName":"German Borbolla Flores",
				"active":true,
				"timeZone":"America/Los_Angeles"
			},
			"customfield_10560":"9223372036854775807",
			"customfield_12067":null,
			"aggregateprogress":{
				"progress":0,
				"total":0
			},
			"customfield_12268":null,
			"customfield_10760":null,
			"customfield_10002":null,
			"customfield_10960":3.0,
			"customfield_10874":"N/aD",
			"customfield_10875":{
				"self":"https://jira.ShopperOrg.com/jira/rest/api/2/customFieldOption/10486",
				"value":"Low",
				"id":"10486"
			},
			"customfield_10876":"SOP",
			"progress":{
				"progress":0,
				"total":0
			},
			"comment":{
				"comments":[

				],
				"maxResults":0,
				"total":0,
				"startAt":0
			},
			"votes":{
				"self":"https://jira.ShopperOrg.com/jira/rest/api/2/issue/SUMO-96260/votes",
				"votes":0,
				"hasVoted":false
			}
		}
	},
	"changelog":{
		"id":"1113666",
		"items":[
			{
				"field":"status",
				"fieldtype":"jira",
				"from":"10019",
				"fromString":"Implemented",
				"to":"6",
				"toString":"Closed"
			},
			{
				"field":"resolution",
				"fieldtype":"jira",
				"from":null,
				"fromString":null,
				"to":"1",
				"toString":"Fixed"
			}
		]
	}
}
Collecting logs for the Jira app
This section has instructions for collecting logs from Jira for the Sumo app for Jira.
The Jira app supports Jira Server. For Jira Cloud, please see documentation for the Jira Cloud app.
You will configure an installed collector on your Jira host with three local file sources, for collecting Jira access, security, and catalina logs. You also configure a hosted collector with an HTTP source for receiving webhook events from Jira.
Step 1: Set up local file sources on an installed collector
- Install a collector on the Jira host. You can find the instructions for your operating system on Installed Collectors.
- Add a local file source to the collector for Jira access logs. Follow the steps on Local File Source, with these additional instructions:
- Filepath. On Linux, access logs are typically found in
/var/log/apache2/*.log. - Source Category. Set to:
Atlassian/Jira/Server/Access
- Filepath. On Linux, access logs are typically found in
- Add a local file source to the collector for Jira security logs. Follow the steps on Local File Source, with these additional instructions:
- Filepath. On Linux, security logs are typically found in
/home/jira/atlassian/application-data/jira/log/atlassian-jira-security.log. - Source Category. Set to:
Atlassian/Jira/Server/Security
- Filepath. On Linux, security logs are typically found in
- Add a local file source to the collector for Jira Catalina logs. Follow the steps on Local File Source, with these additional instructions:
- Filepath. On Linux, Catalina logs are typically found in
/home/jira/atlassian/application-data/jira/log/*.log. - Source Category. Set to:
Atlassian/Jira/Server/Catalina
- Filepath. On Linux, Catalina logs are typically found in
Step 2: Configure hosted collector to receive Webhooks
In this step, you create a host collector to receive webhooks from Jira, and set up an HTTP source on it.
- Configure a hosted collector, or select an existing hosted collector for the HTTP source.
- Configure an HTTP source on the hosted collector.
- For Source Category, specify
Atlassian/Jira/Events - Make a note of the HTTP address for the source. You will supply it when you configure a Jira webhook in the next step.
- For Source Category, specify
Step 3: Register webhook in Jira
Follow the instructions on Webhooks in Jira help to register a webhook for the following events:
- Issue related:
- created (jira:issue_created)
- updated (jira:issue_updated)
- deleted (jira:issue_deleted)
- worklog changed (jira:worklog_updated)
- User related:
- created (user_created)
- updated (user_updated)
- deleted (user_deleted)
- Sprint related:
- created (sprint_created)
- deleted (sprint_deleted)
- updated (sprint_updated)
- started (sprint_started)
- closed (sprint_closed)
When you configure the webhook, enter the URL for the HTTP source you created in step 2 as the endpoint for the webhook.
Installing the Jira app
To install the app, do the following:
Next-Gen App: To install or update the app, you must be an account administrator or a user with Manage Apps, Manage Monitors, Manage Fields, Manage Metric Rules, and Manage Collectors capabilities depending upon the different content types part of the app.
- Select App Catalog.
- In the 🔎 Search Apps field, run a search for your desired app, then select it.
- Click Install App.
note
Sometimes this button says Add Integration.
- Click Next in the Setup Data section.
- In the Configure section of your respective app, complete the following fields.
- Field Name. If you already have collectors and sources set up, select the configured metadata field name (eg _sourcecategory) or specify other custom metadata (eg: _collector) along with its metadata Field Value.
- Click Next. You will be redirected to the Preview & Done section.
Post-installation
Once your app is installed, it will appear in your Installed Apps folder, and dashboard panels will start to fill automatically.
Each panel slowly fills with data matching the time range query received since the panel was created. Results will not immediately be available but will be updated with full graphs and charts over time.
Viewing Jira dashboards
All dashboards have a set of filters that you can apply to the entire dashboard. Use these filters to drill down and examine the data to a granular level.
- You can change the time range for a dashboard or panel by selecting a predefined interval from a drop-down list, choosing a recently used time range, or specifying custom dates and times. Learn more.
- You can use template variables to drill down and examine the data on a granular level. For more information, see Filtering Dashboards with Template Variables.
- Most Next-Gen apps allow you to provide the scope at the installation time and are comprised of a key (
_sourceCategoryby default) and a default value for this key. Based on your input, the app dashboards will be parameterized with a dashboard variable, allowing you to change the dataset queried by all panels. This eliminates the need to create multiple copies of the same dashboard with different queries.
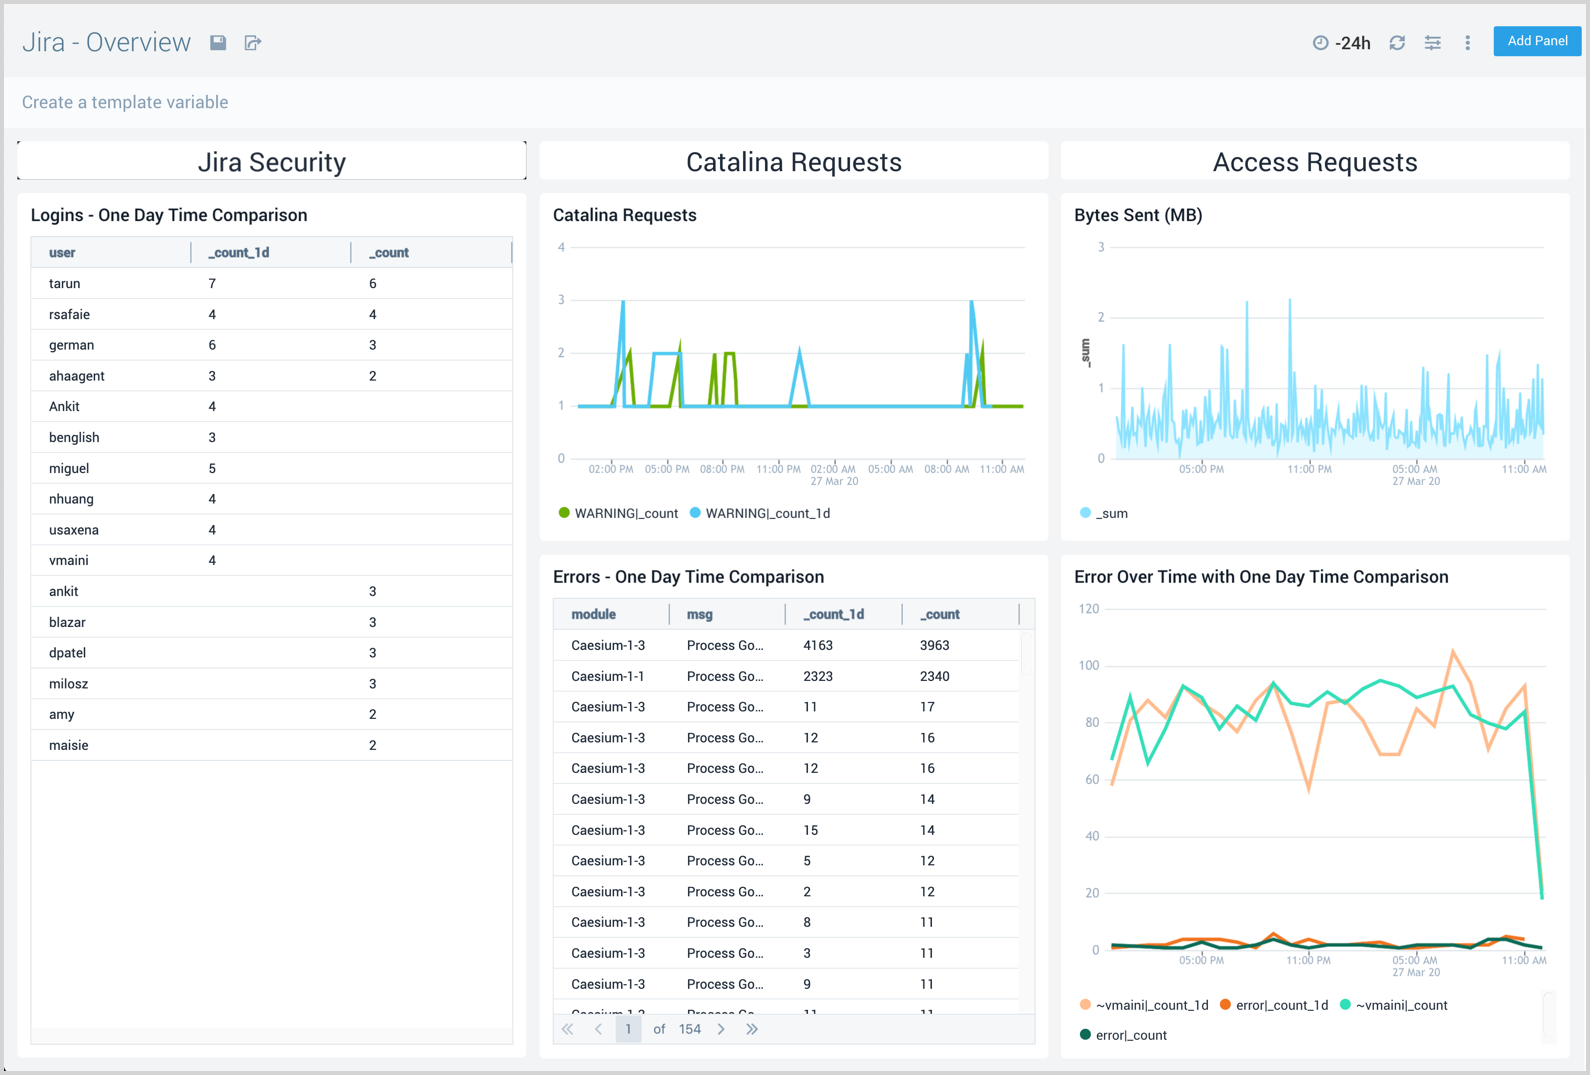
Overview
The Jira - Overview dashboard provides a high-level view of Jira activities, including the location of event authentications, login comparisons, Jira requests, errors and error trends, and data usage.
Use this dashboard to:
- Monitor Jira activity.
- Compare today's activity with yesterday's.
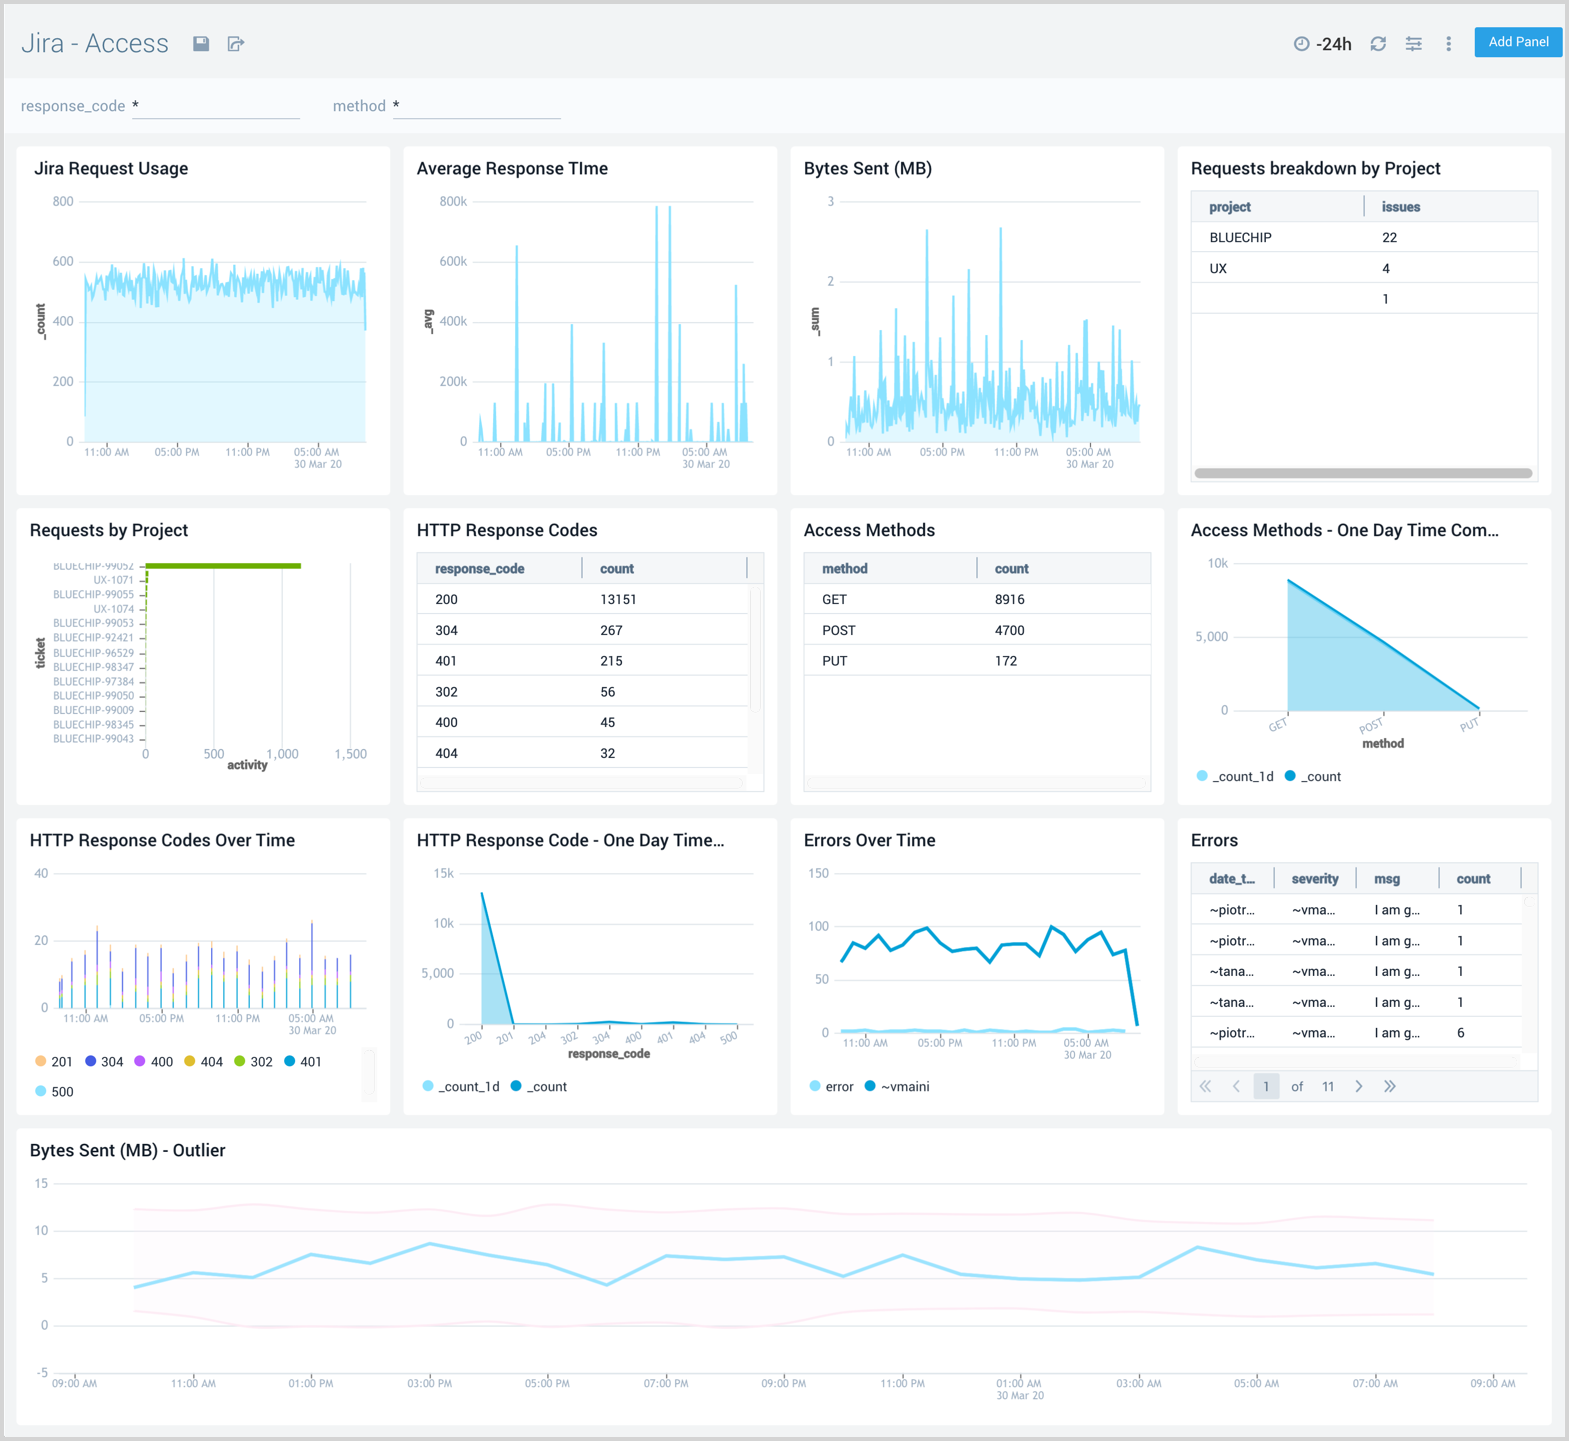
Access
The Jira - Access dashboard provides information about Jira user access, including request trends, average response times, issues by project, response codes, and errors.
Use this dashboard to:
- Track requests received by Jira.
- Identify spikes in request volume.
- Monitor current and recent data usage (bytes transferred) and HTTP response codes.
- Drill down by a specific protocol or response codes.
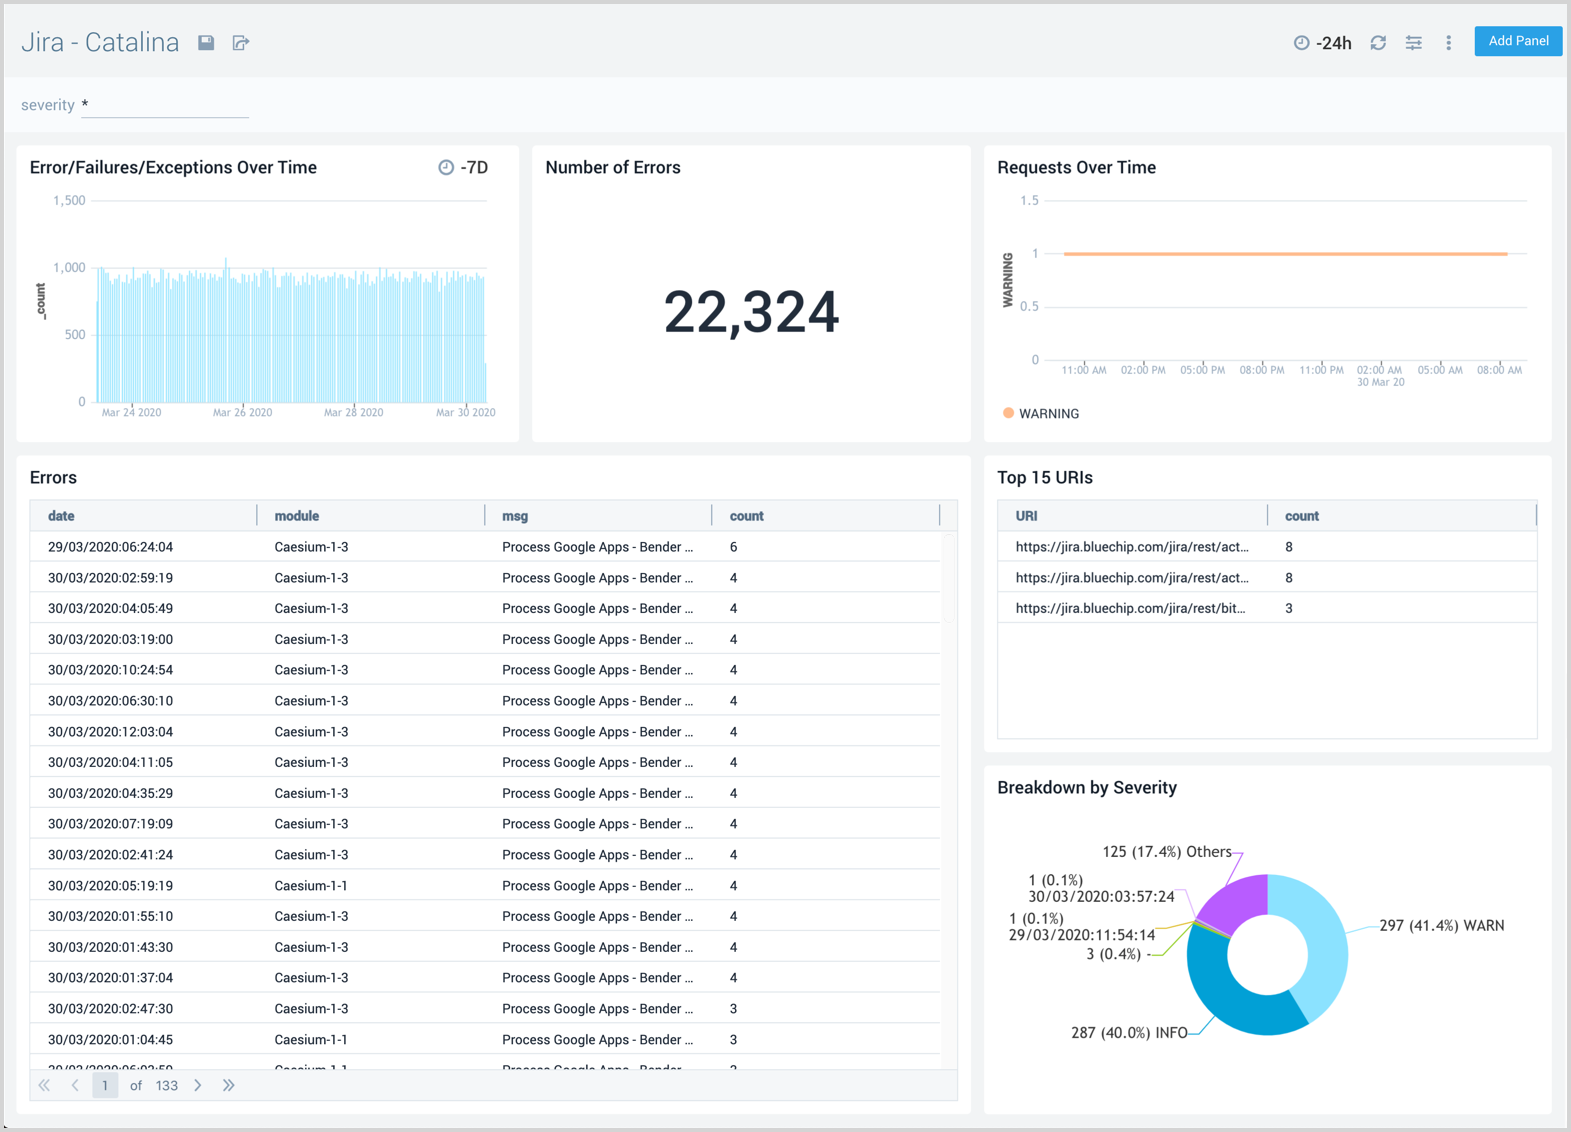
Catalina
The Jira - Catalina dashboard provides information on the Jira internal web server. Panels display analytics for errors, failures, exceptions, request trends, and top ranked URLs.
Use this dashboard to:
- Find and debug unexpected errors in Jira.
- Monitor the number requests received over time.
Issue Overview
The Jira - Issue Overview dashboard provides a high-level view of Jira issue activities, so you can monitor work from creation to completion. The panels display analytics for issues that have been created, closed, reopened, and still in progress.
Use this dashboard to:
- Understand the high-level statistics of your software delivery cycle.
- Identify and monitor work that is in progress.
- Determine work that is affecting, or will soon affect, software services.

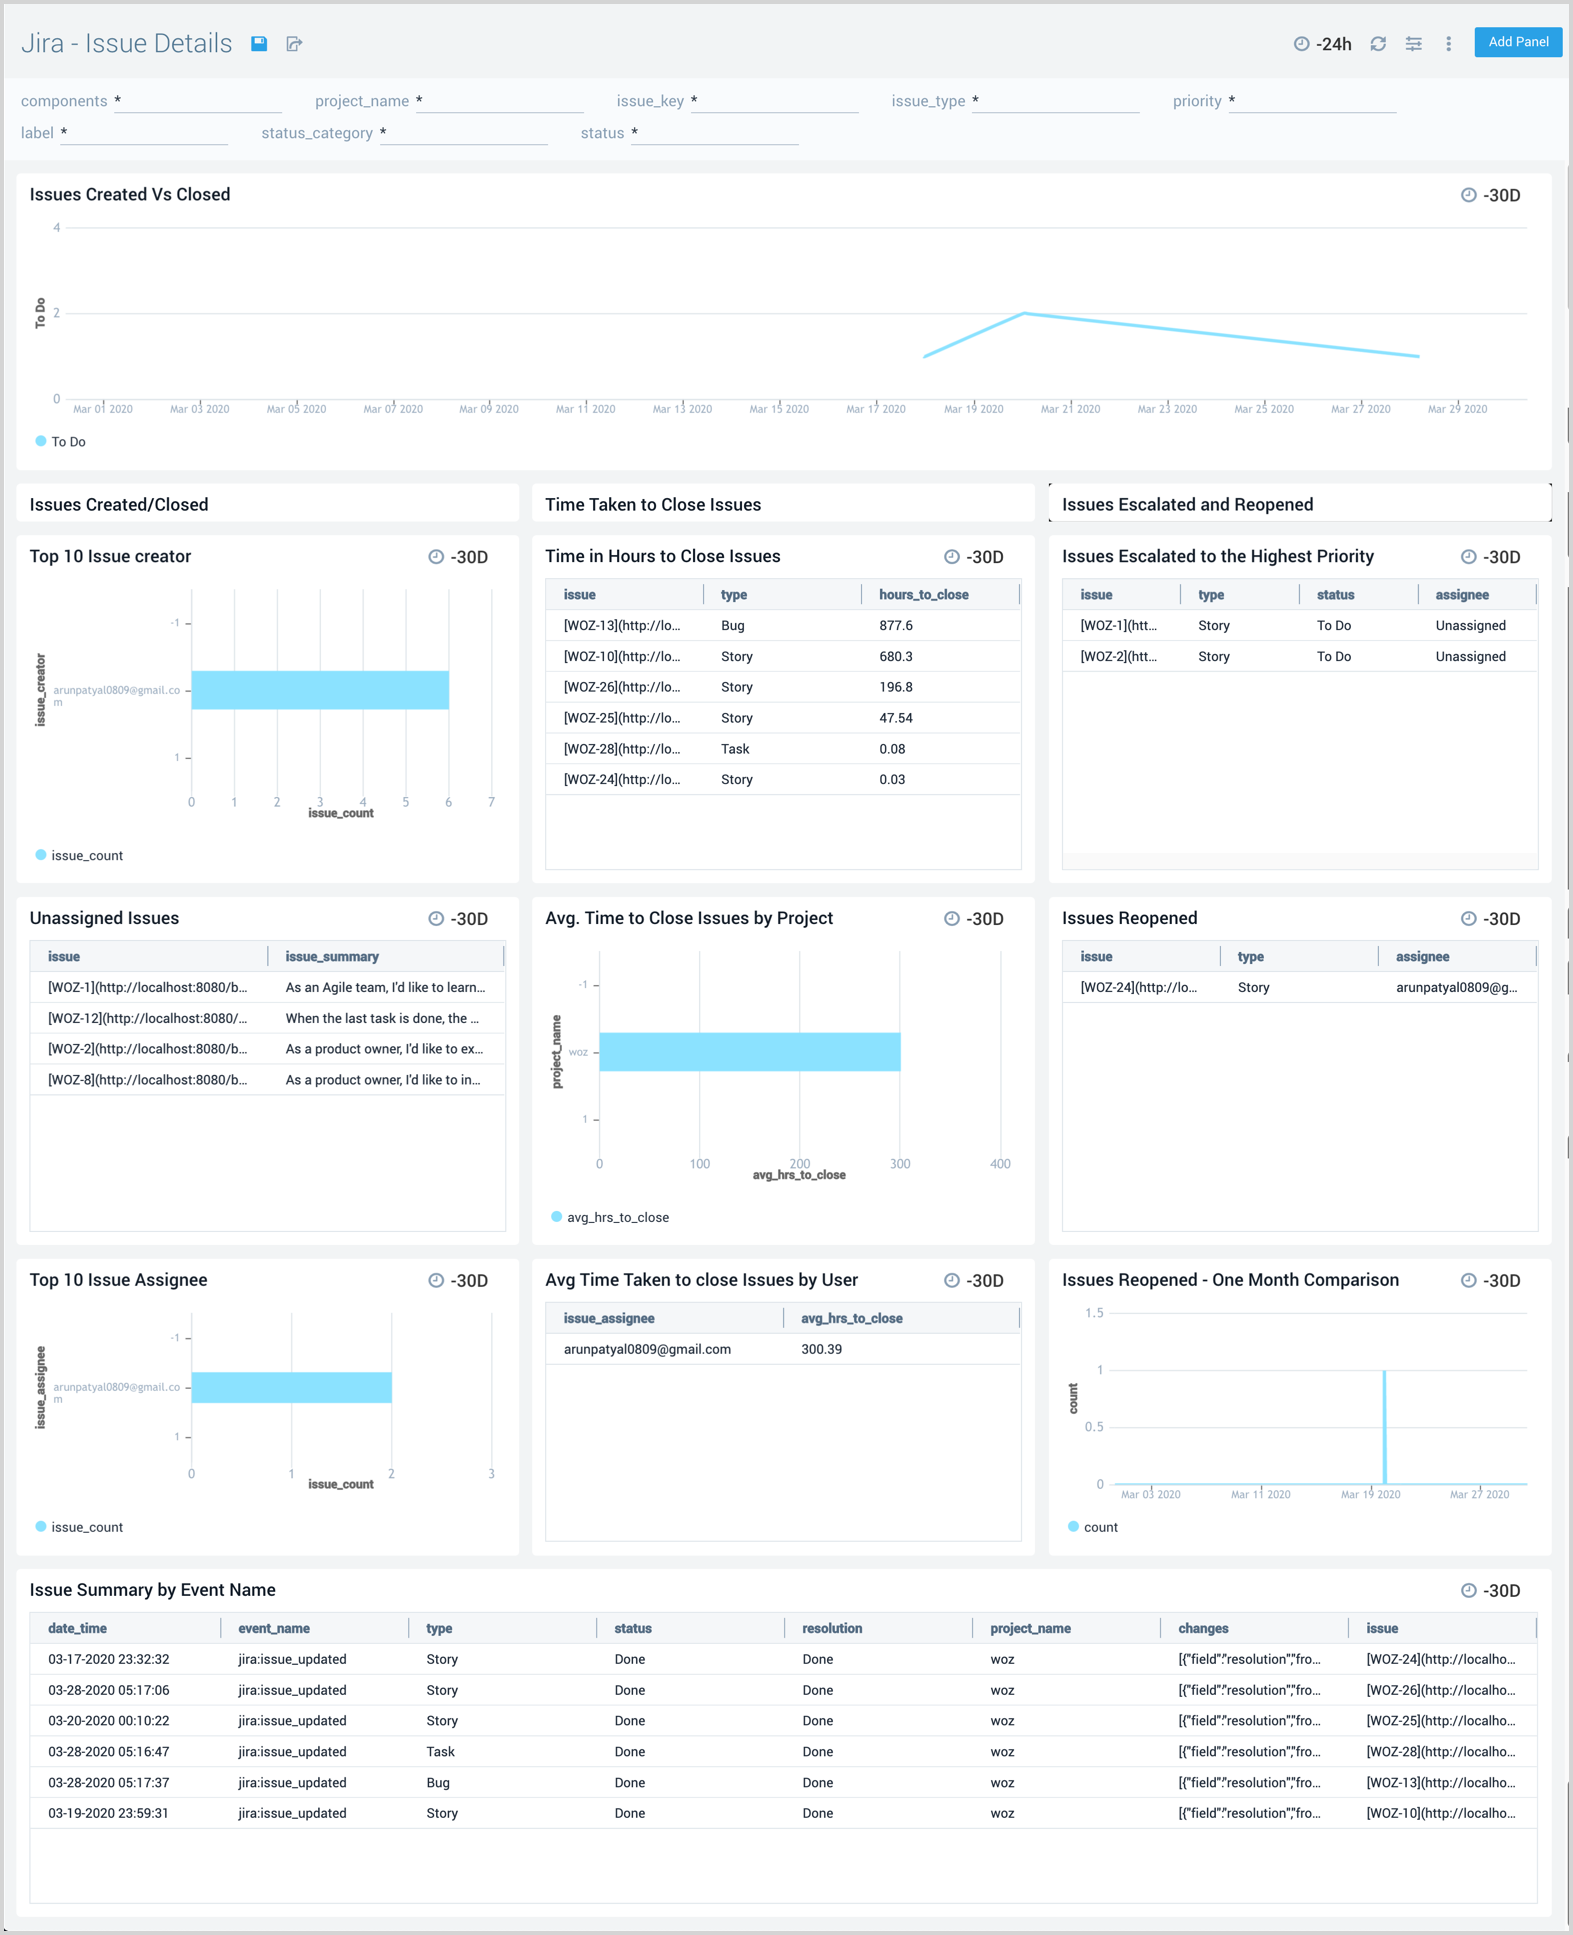
Issues Details
The Jira - Issues Details dashboard provides insights into Jira issues, showing analytics on open, closed, and reopened issues. Panels also display details on issue assignments and escalations and the average time to close issues, allowing you to prioritize and strategize issue management.
Use this dashboard to:
- Improve the performance of your software delivery process.
- Identify issues, components, teams, and initiatives that require the most attention.
- Determine the time taken to close issues by different teams and users, thereby facilitating project delivery on time and on budget.
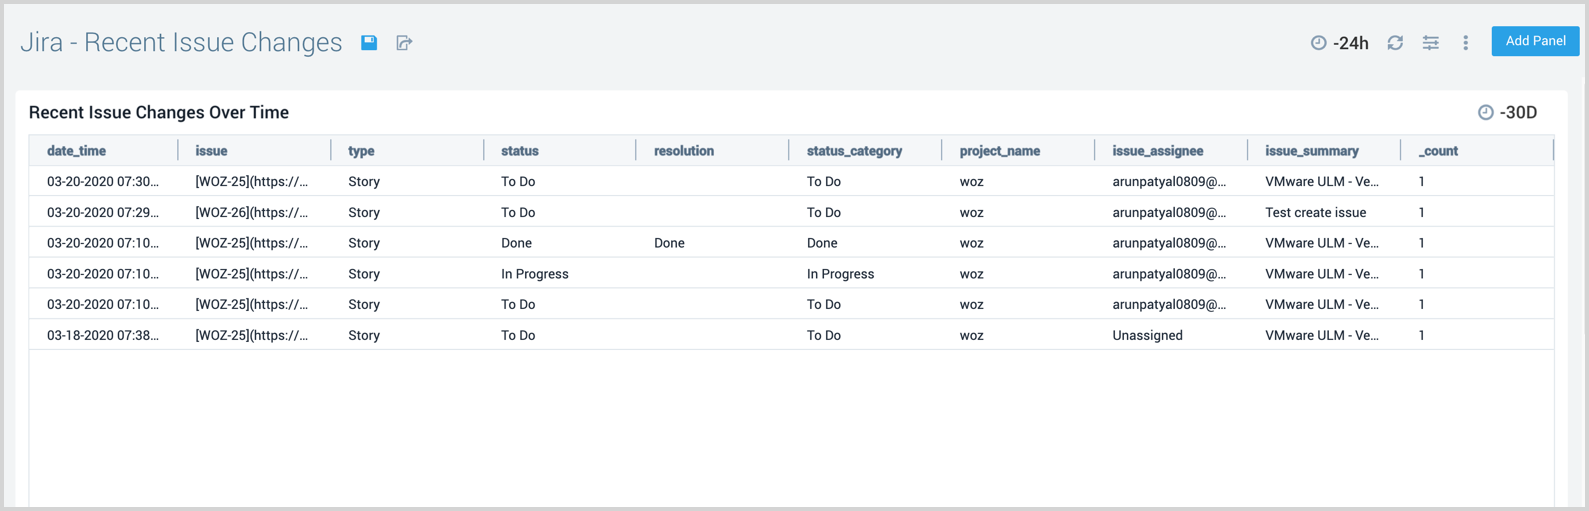
Recent Issue Changes
The Jira - Recent Issue Changes dashboard tracks recent progress of Jira issues. You can view detailed information on the type of issue, including when it was created, its status, assignee, and a summary of the issue.
Use this dashboard to:
- Track issues that have changed recently.
- Monitor the progress of issues.
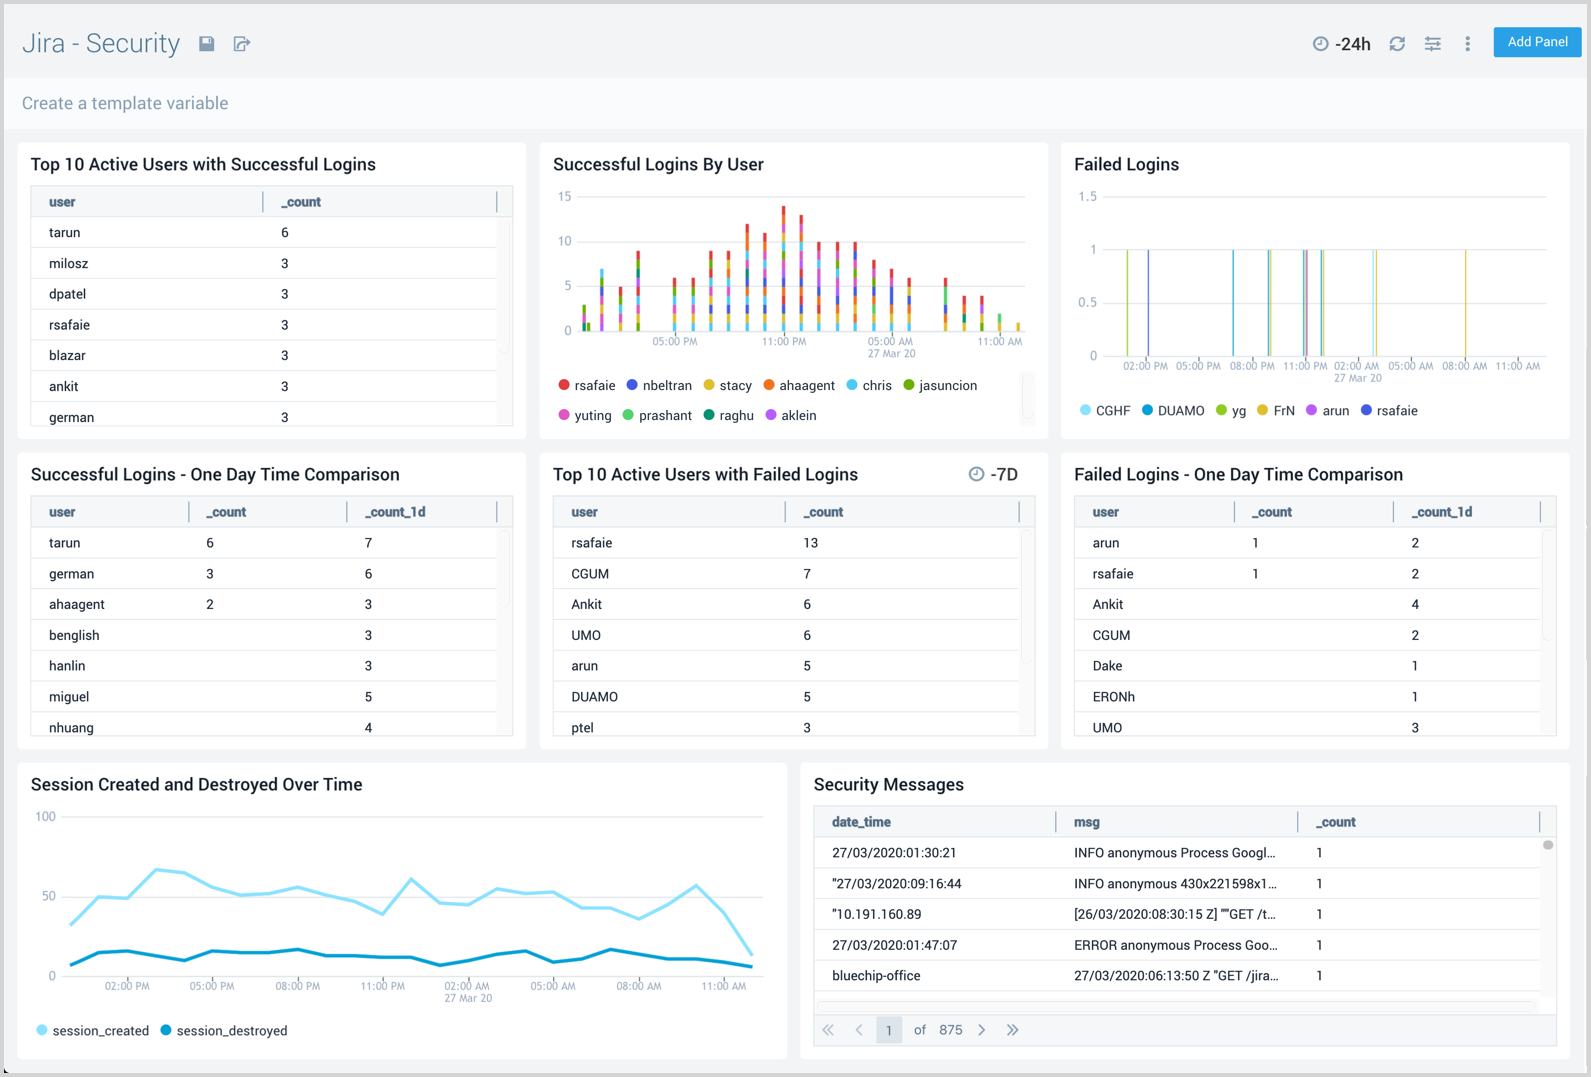
Security
The Jira - Security dashboard provides information on security in Jira. The panels show analytics for the location of successful and failed logins, successful and failed logins for active users, comparisons of successful and failed logins, and session trends.
Use this dashboard to:
- Identify the locations os Jira user authentications.
- Identify logins from unexpected locations, then drill down for details on those logins.
- Identify unusual patterns in failed or passed logins by comparing today's login pattern with the previous day's.
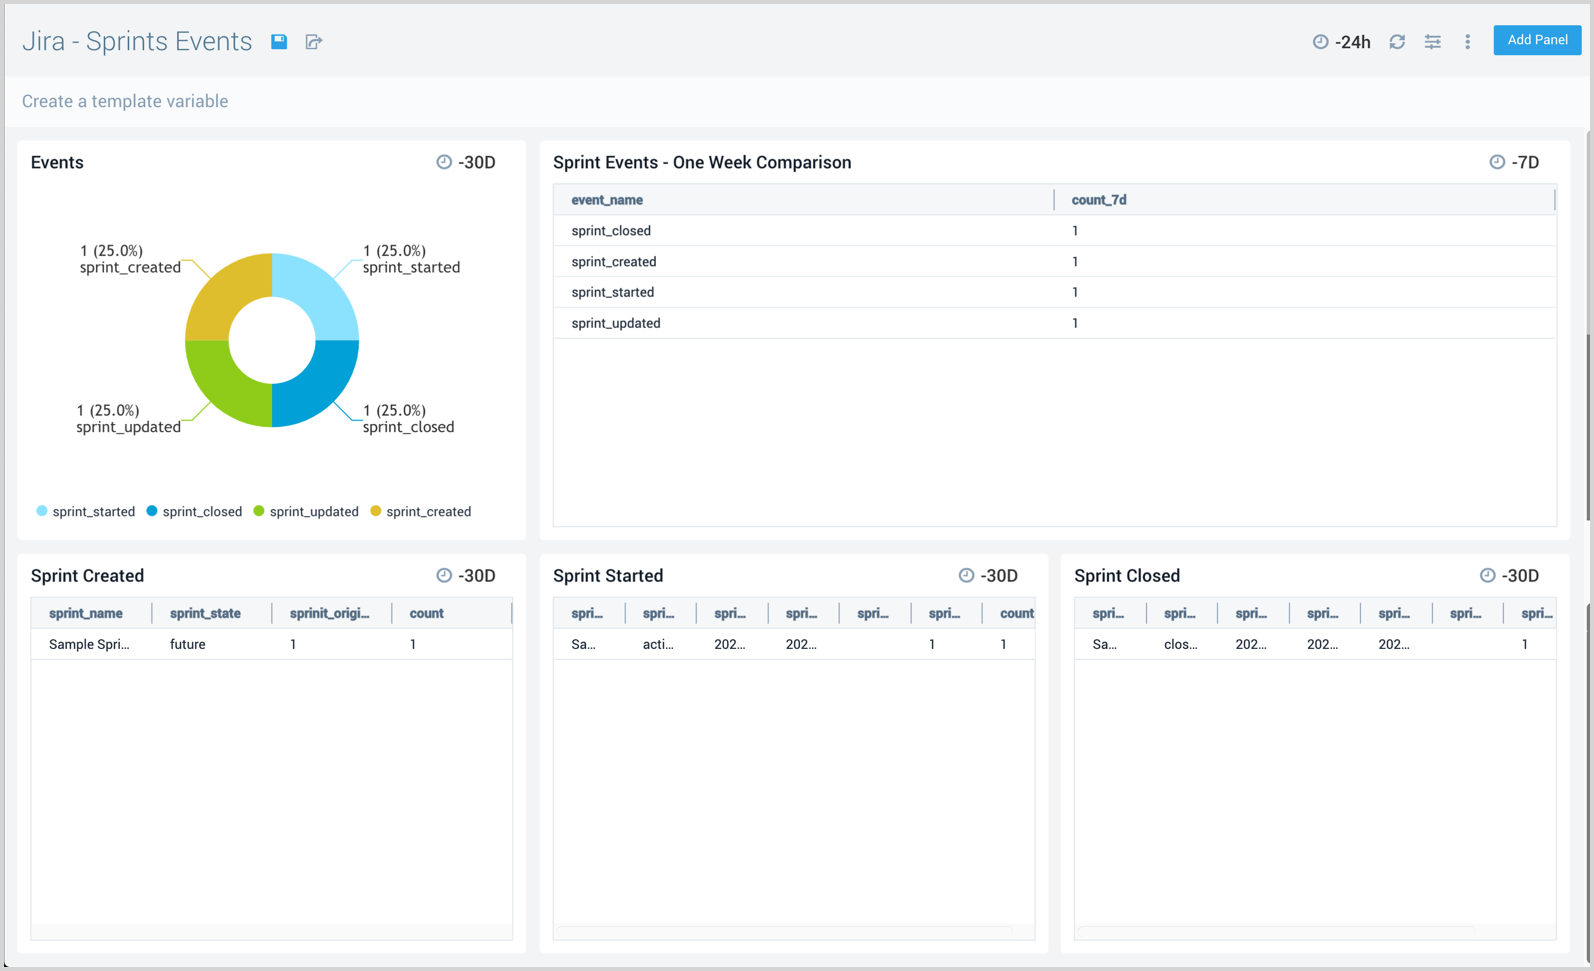
Sprints Events
The Jira - Sprints Events dashboard provides insights on sprint events in Jira, including the number of sprint events, event trends, and sprints closed and created.
Use this dashboard to:
- Monitor sprints in your development cycle.
- Track active sprints and their start and end dates.
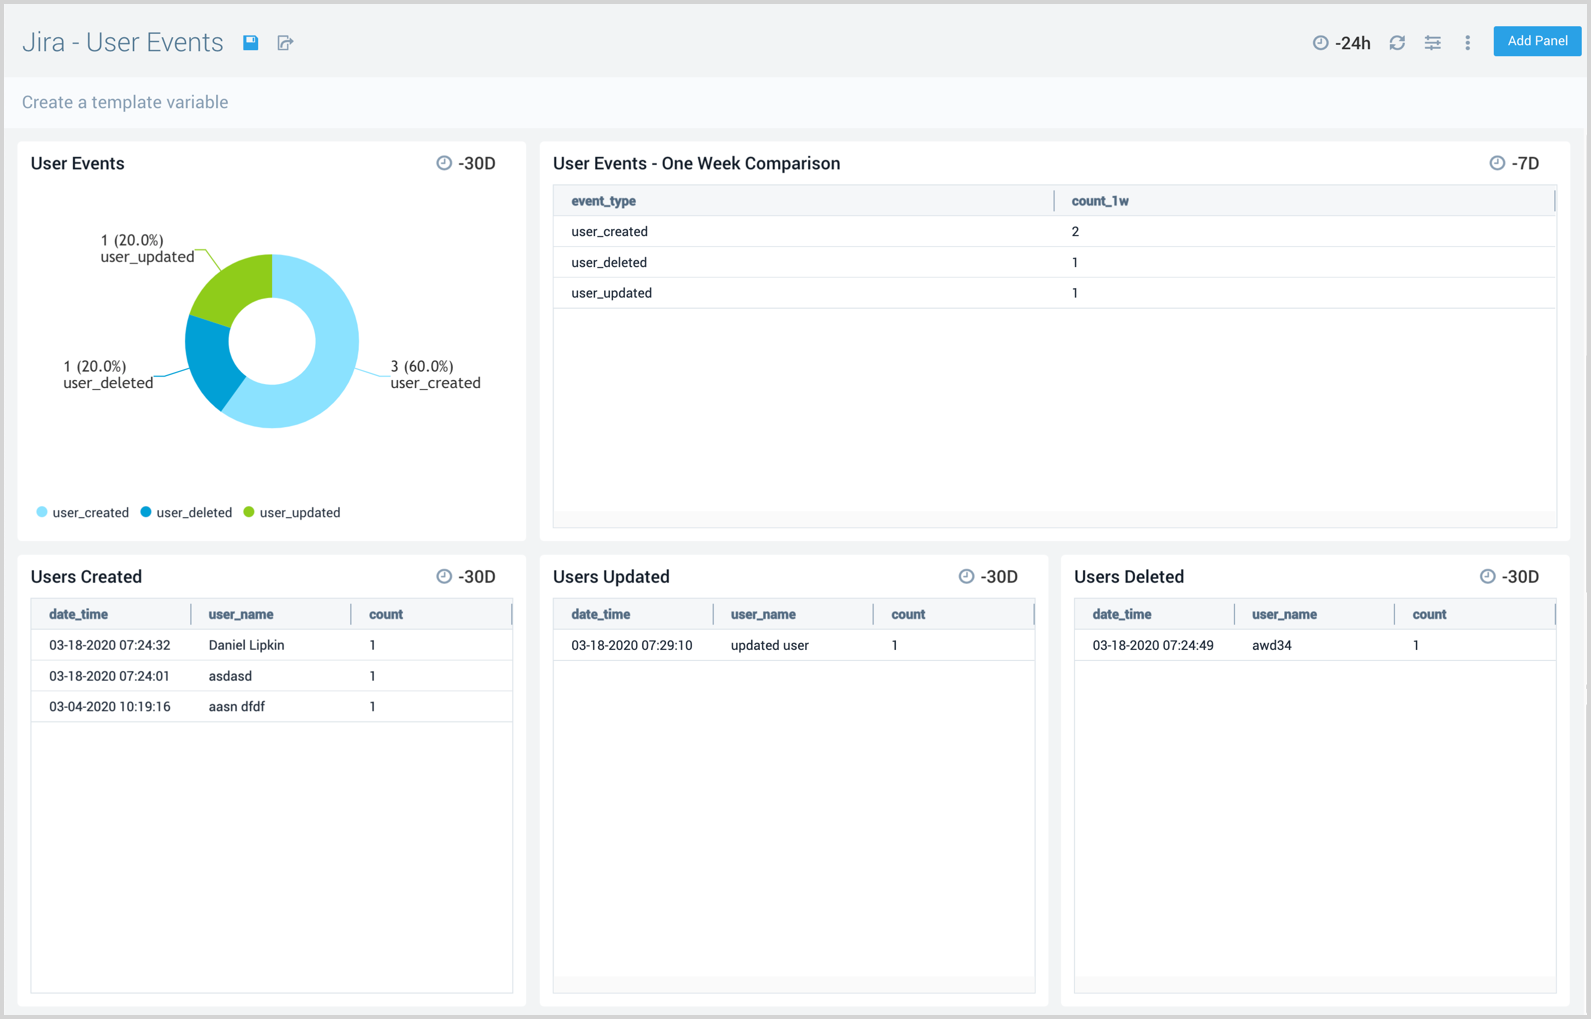
User Events
The Jira - User Events dashboard provides information about user events in Jira, including the number of user events, trends, and users that have been updated, created, and deleted.
Use this dashboard to:
- Monitor Jira users and their activities.
- Identify unusual user activity and closely monitor those users.
Upgrade/Downgrade the Jira app (Optional)
To update the app, do the following:
Next-Gen App: To install or update the app, you must be an account administrator or a user with Manage Apps, Manage Monitors, Manage Fields, Manage Metric Rules, and Manage Collectors capabilities depending upon the different content types part of the app.
- Select App Catalog.
- In the Search Apps field, search for and then select your app.
Optionally, you can identify apps that can be upgraded in the Upgrade available section. - To upgrade the app, select Upgrade from the Manage dropdown.
- If the upgrade does not have any configuration or property changes, you will be redirected to the Preview & Done section.
- If the upgrade has any configuration or property changes, you will be redirected to the Setup Data page.
- In the Configure section of your respective app, complete the following fields.
- Field Name. If you already have collectors and sources set up, select the configured metadata field name (eg _sourcecategory) or specify other custom metadata (eg: _collector) along with its metadata Field Value.
- Click Next. You will be redirected to the Preview & Done section.
Post-update
Your upgraded app will be installed in the Installed Apps folder and dashboard panels will start to fill automatically.
See our Release Notes changelog for new updates in the app.
To revert the app to a previous version, do the following:
- Select App Catalog.
- In the Search Apps field, search for and then select your app.
- To version down the app, select Revert to < previous version of your app > from the Manage dropdown.
Uninstalling the Jira app (Optional)
To uninstall the app, do the following:
- Select App Catalog.
- In the 🔎 Search Apps field, run a search for your desired app, then select it.
- Click Uninstall.