Java Management Extensions (JMX) - OpenTelemetry Collector

Java Management Extensions (JMX) is a standard component of the Java Platform. JMX gives developers a standard and simple way to manage resources, including services, devices, and applications. JMX is dynamic, so you can manage and monitor resources as soon as they are created, implemented, or installed.
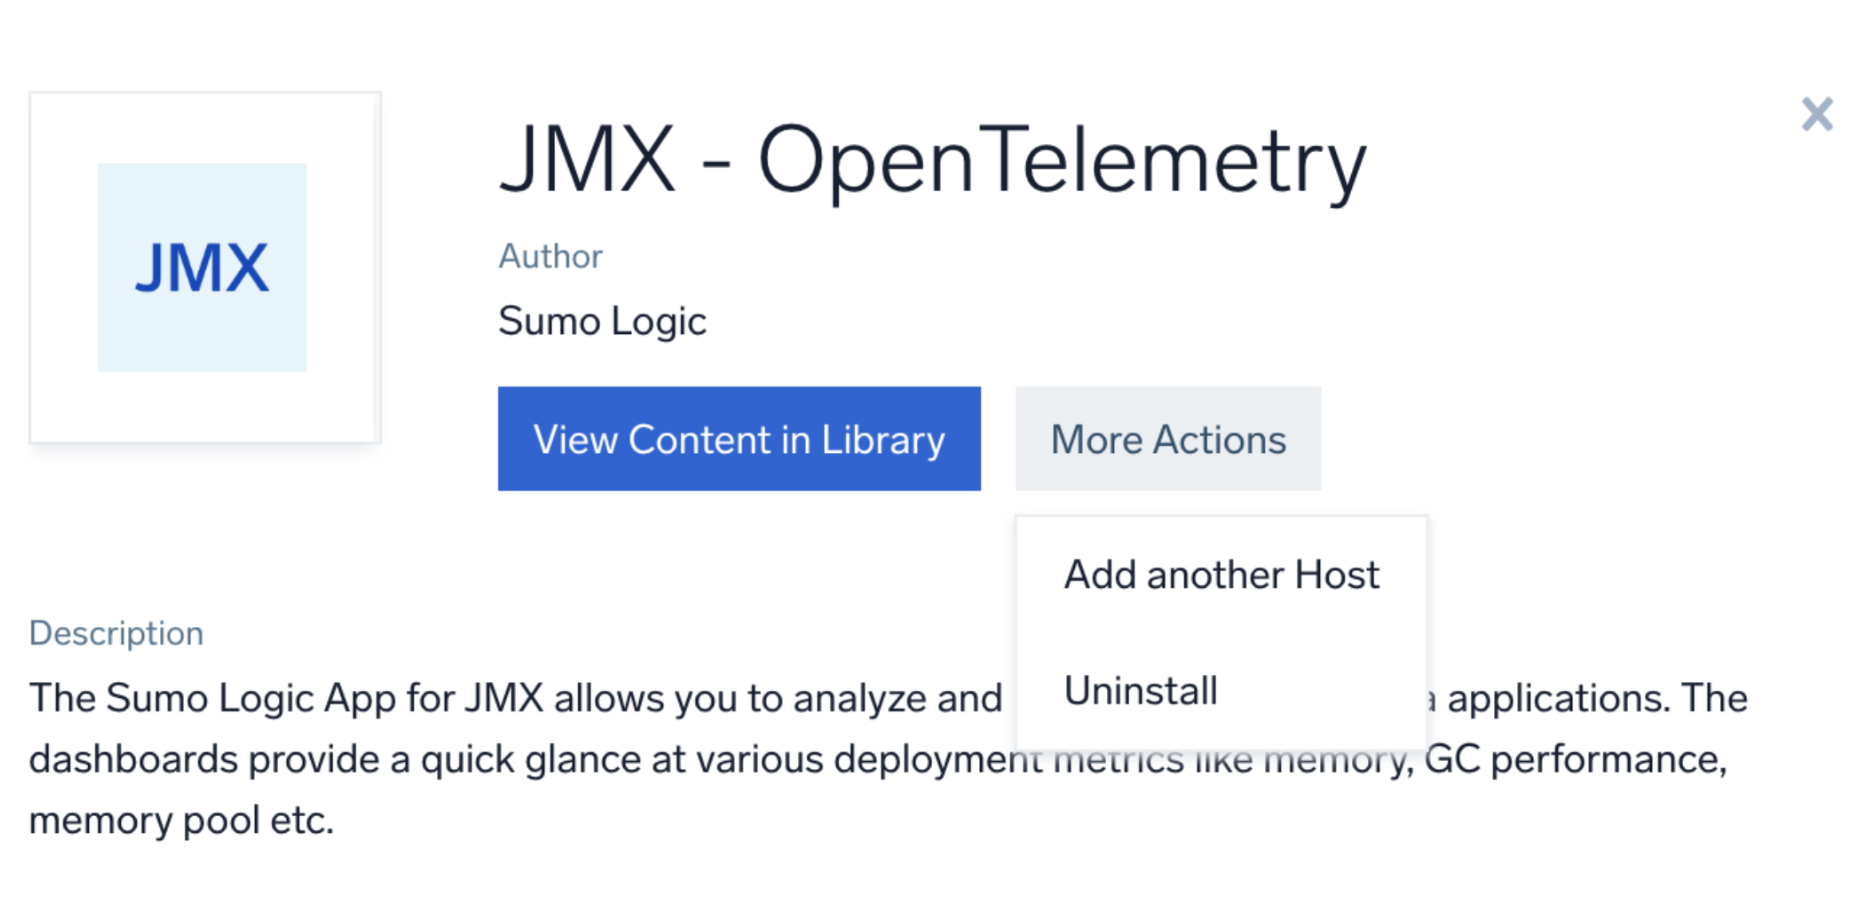
The Sumo Logic app for JMX allows you to analyze and gain insights about Java applications. The dashboards provide a quick glance at various deployment metrics like memory, GC performance, and thread behavior, so you can troubleshoot unexpected behavior in your Java environment and the applications running in it.
This app includes built-in monitors. For details on creating custom monitors, refer to Create monitors for JMX app.
Metrics types
The Sumo Logic app for JMX collects metrics from Java applications via the JMX Receiver for OpenTelemetry.
The following types of metrics are collected from JMX:
- Garbage Collection
- Memory
- Memory Pool
- Threads
- ClassLoader
For more information on different metrics collected, refer to the JMX receiver docs.
Sample metrics query
sumo.datasource=jmx metric=jvm.memory.heap.used
Fields creation in Sumo Logic for JMX
sumo.datasource. Has fixed value ofjmx.jmx.endpoint. The endpoint in the form oflocalhost:portused by JMX Metric Gatherer.
Prerequisites
The JMX Receiver uses the OpenTelemetry JMX Metric Gatherer. For more details, see their docs.
- Download the jar from releases and place it in
/opt/or inC:\ProgramData. Remember the path of the jar, which you'll use to configure the JMX app. - Make sure the see the
opentelemetry-java-contrib-jmx-metricsversion is supported in the OpenTelemetry version you are using by going through the releases section and searching for jmxreceiver in that page. You can also check supported jars code. - JMX Metric Gatherer metric extension supports Java 8+, though SASL is only supported where
com.sun.security.sasl.Provideris available. - Configure your java application to enable JMX. In most cases, you'll need to set below system variables in your applications's startup script.
-Dcom.sun.management.jmxremote.port=11099
-Dcom.sun.management.jmxremote.authenticate=false - If you want to set up authentication, set the below system variables:
-Dcom.sun.management.jmxremote.authenticate=true
-Dcom.sun.management.jmxremote.password.file=<application conf directory>/jmx.password
-Dcom.sun.management.jmxremote.access.file=<application conf directory>/jmx.access
Collection configuration and app installation
As part of data collection setup and app installation, you can select the App from App Catalog and click on Install App. Follow the steps below.
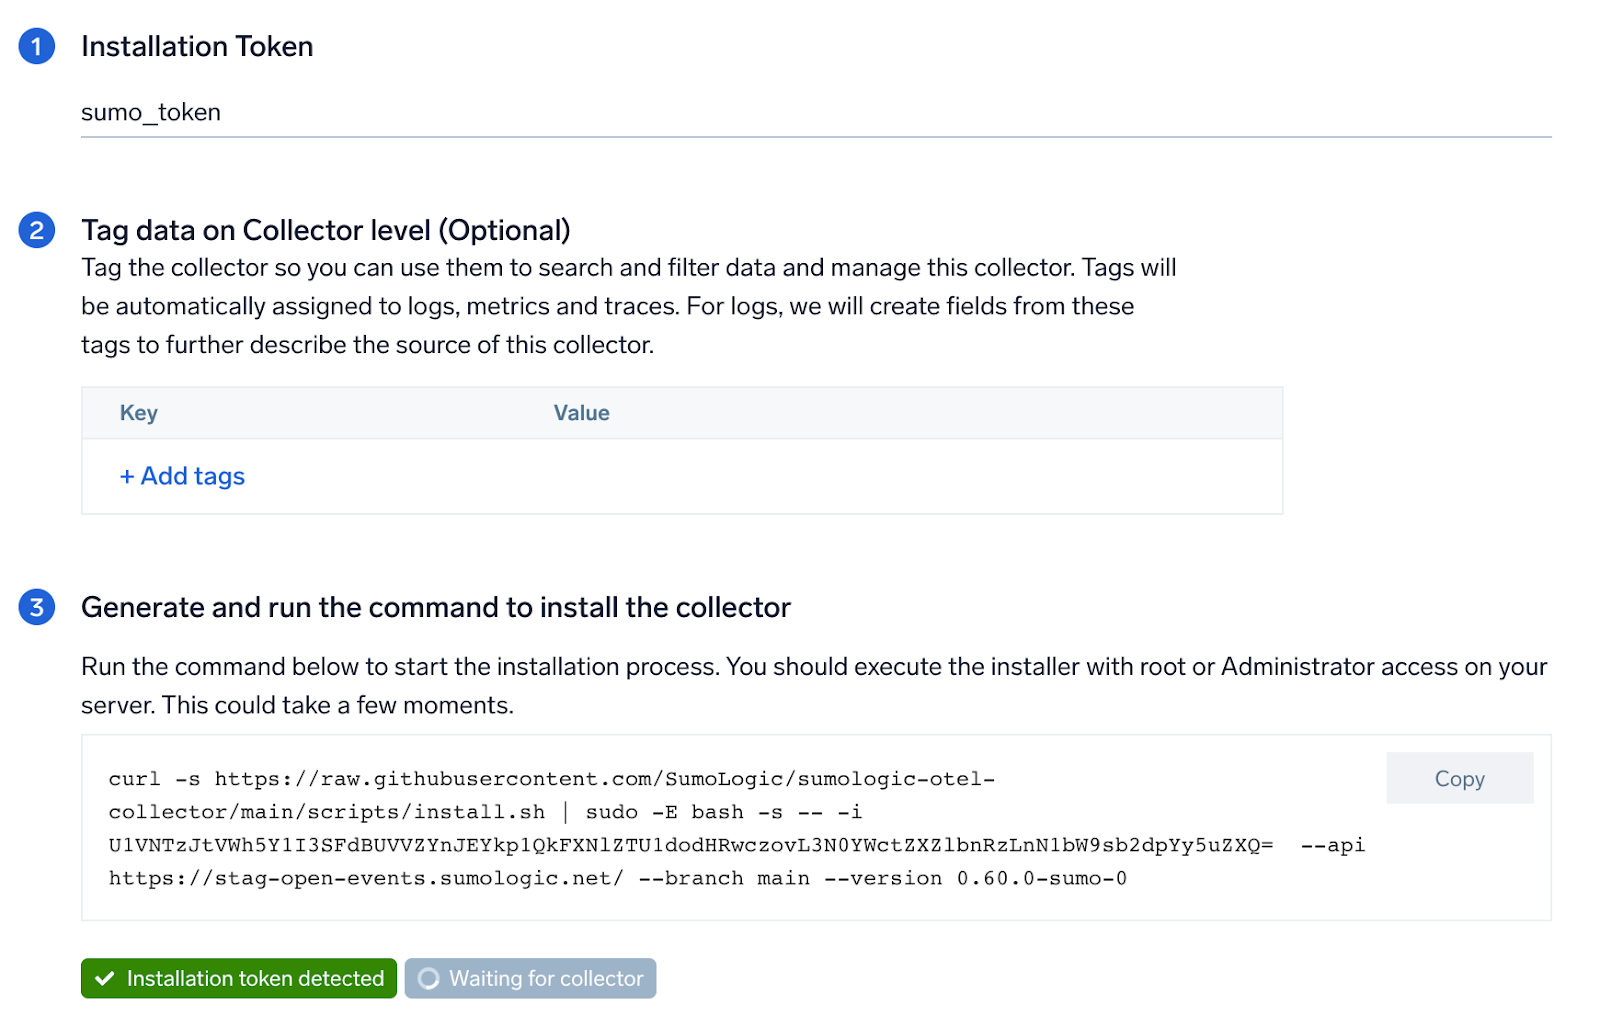
Step 1: Set up OpenTelemetry Collector
If you want to use an existing OpenTelemetry Collector, you can skip this step by selecting the Use an existing Collector option.
To create a new Collector:
- Select the Add a new Collector option.
- Select the platform where you want to install the Sumo Logic OpenTelemetry Collector.
This will generate a command that you can execute in the machine environment you need to monitor. Once executed, it will install the Sumo Logic OpenTelemetry Collector.
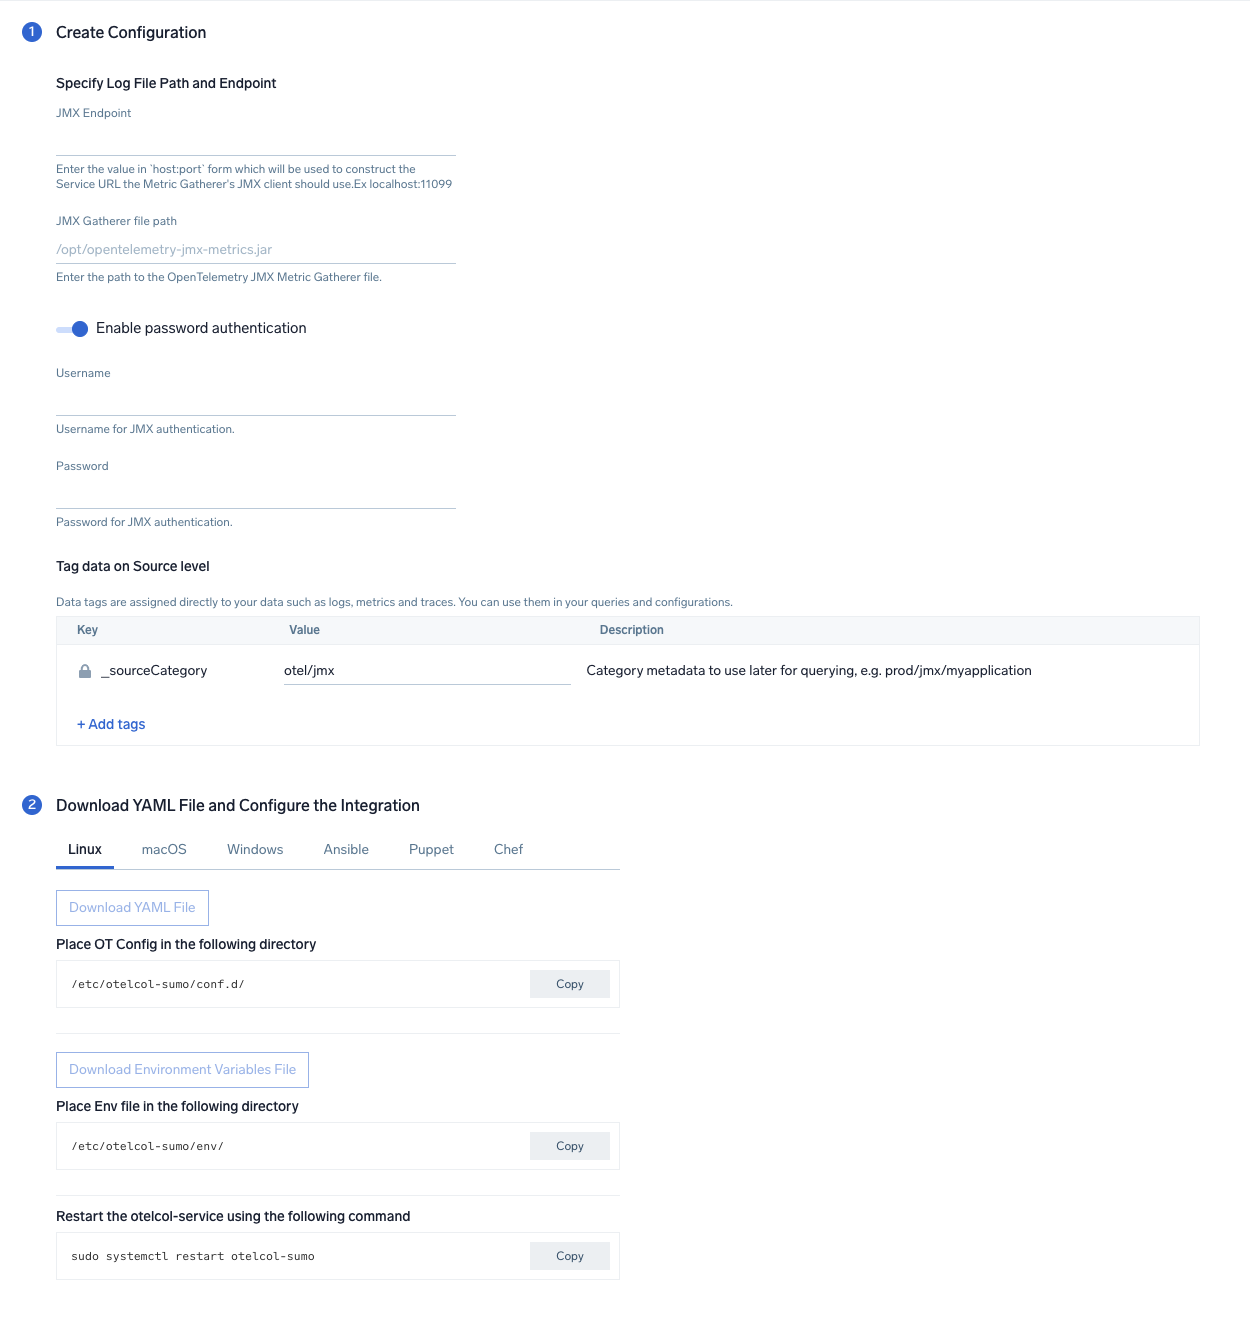
Step 2: Configure integration
In this step, we'll configure the yaml required for JMX Collection.
Below is the input required:
- JMX Endpoint. Enter the value in
host:portform which will be used to construct the Service URL, the Metric Gatherer's JMX client should use. - JMX Gatherer file path. Enter the path to the OpenTelemetry JMX Metric Gatherer file configured in the prerequisites section.
- Enable password authentication. Toggle this if you are using password based jmx authentication.
- Username. Username for JMX authentication, if applicable.
- Password. Password for JMX authentication, if applicable.
Click on the Download YAML File button to get the yaml file.
For OpenTelemetry Collector version ≥ 0.104, we recommend using the downloaded config with an environment variable, for example: ${environment_variable}.
On Linux, click Download Environment Variables File to get a file that includes the password, which should be set as an environment variable (if you're using one).
Step 3: Send logs and metrics to Sumo Logic
Once you have downloaded the YAML file as described in the previous step, follow the below steps based on your platform.
- Linux
- Windows
- macOS
- Chef
- Ansible
- Puppet
- Copy the yaml to the
/etc/otelcol-sumo/conf.d/folder for the Java application which needs to be monitored. - Restart the collector using:
sudo systemctl restart otelcol-sumo
- Copy the yaml to the
C:\ProgramData\Sumo Logic\OpenTelemetry Collector\config\conf.dfolder in the machine that needs to be monitored. - Restart the collector using:
Restart-Service -Name OtelcolSumo
- Copy the yaml to the
/etc/otelcol-sumo/conf.d/folder in the Java application which needs to be monitored. - Restart the otelcol-sumo process using the below command:
otelcol-sumo --config /etc/otelcol-sumo/sumologic.yaml --config "glob:/etc/otelcol-sumo/conf.d/*.yaml"
- Copy the yaml file into your Chef cookbook files directory
files/<downloaded_yaml_file>.` - Use a Chef file resource in a recipe to manage it.
cookbook_file '/etc/otelcol-sumo/conf.d/<downloaded_yaml_file>' do
	mode 0644
    notifies :restart, 'service[otelcol-sumo]', :delayed
end - Use a Chef file resource in a recipe to manage it.
cookbook_file '/etc/otelcol-sumo/env/<downloaded_env_file>' do
    mode 0600
    notifies :restart, 'service[otelcol-sumo]', :delayed
end - Add the recipe to your collector setup to start collecting. Every team typically has their established way of applying the Chef recipe. The resulting Chef recipe should look something like:
cookbook_file '/etc/otelcol-sumo/conf.d/<downloaded_yaml_file>' do
    mode 0644
    notifies :restart, 'service[otelcol-sumo]', :delayed
end

cookbook_file '/etc/otelcol-sumo/env/<downloaded_env_file>' do
    mode 0600
    notifies :restart, 'service[otelcol-sumo]', :delayed
end
- Place the file into your Ansible playbook files directory.
- Run the Ansible playbook using:
ansible-playbook -i inventory install_sumologic_otel_collector.yaml
-e '{"installation_token": "<YOUR_TOKEN>", "collector_tags": {<YOUR_TAGS>}, "src_config_path": "files/conf.d", "src_env_path": "files/env"}'
- Place the file into your Puppet module files directory
modules/install_otel_collector/files/<downloaded_yaml>. - Use a Puppet file resource to manage it
file { '/etc/otelcol-sumo/conf.d/<downloaded_yaml_file>':
    ensure => present,
    source => 'puppet:///modules/install_otel_collector/<downloaded_yaml_file>',
    mode => '0644',
    notify => Service[otelcol-sumo],
} - Use a Puppet file resource to manage it
file { '/etc/otelcol-sumo/env/<downloaded_env_file>'
    ensure => present,
    source => 'puppet:///modules/install_otel_collector/<downloaded_env_file>',
    mode => '0600',
    notify => Service[otelcol-sumo],
} - Apply the Puppet manifest. Every team typically has their established way of applying the Puppet manifes. The resulting Puppet manifest should look something like:
node 'default' {
    class { 'install_otel_collector'
      installation_token => '<YOUR_TOKEN>',
      collector_tags => { <YOUR_TAGS> },
    }

    service { 'otelcol-sumo':
      provider => 'systemd',
      ensure => running,
      enable => true,
      require => Class['install_otel_collector'],
    }

    file { '/etc/otelcol-sumo/conf.d/<downloaded_yaml_file>':
      ensure => present,
      source => 'puppet:///modules/install_otel_collector/<downloaded_yaml_file>',
      mode => '0644',
      notify => Service[otelcol-sumo],
    }

    file { '/etc/otelcol-sumo/env/<downloaded_env_file>':
      ensure => present,
      source => 'puppet:///modules/install_otel_collector/<downloaded_env_file>',
      mode => '0600',
      notify => Service[otelcol-sumo],
    }
  }
After successfully executing the above command, Sumo Logic will start receiving data from your host machine.
Click Next. This will install the app (dashboards and monitors) to your Sumo Logic Org.
Dashboard panels will start to fill automatically. It's important to note that each panel fills with data matching the time range query and received since the panel was created. Results won't immediately be available, but within 20 minutes, you'll see full graphs and maps.
If you have multiple Java processes running on the same host, then you need to select Add another Host option under More Actions when installing an app to generate a new YAML configuration file for each of the Java process.
Viewing JMX dashboards
All dashboards have a set of filters that you can apply to the entire dashboard. Use these filters to drill down and examine the data to a granular level.
- You can change the time range for a dashboard or panel by selecting a predefined interval from a drop-down list, choosing a recently used time range, or specifying custom dates and times. Learn more.
- You can use template variables to drill down and examine the data on a granular level. For more information, see Filtering Dashboards with Template Variables.
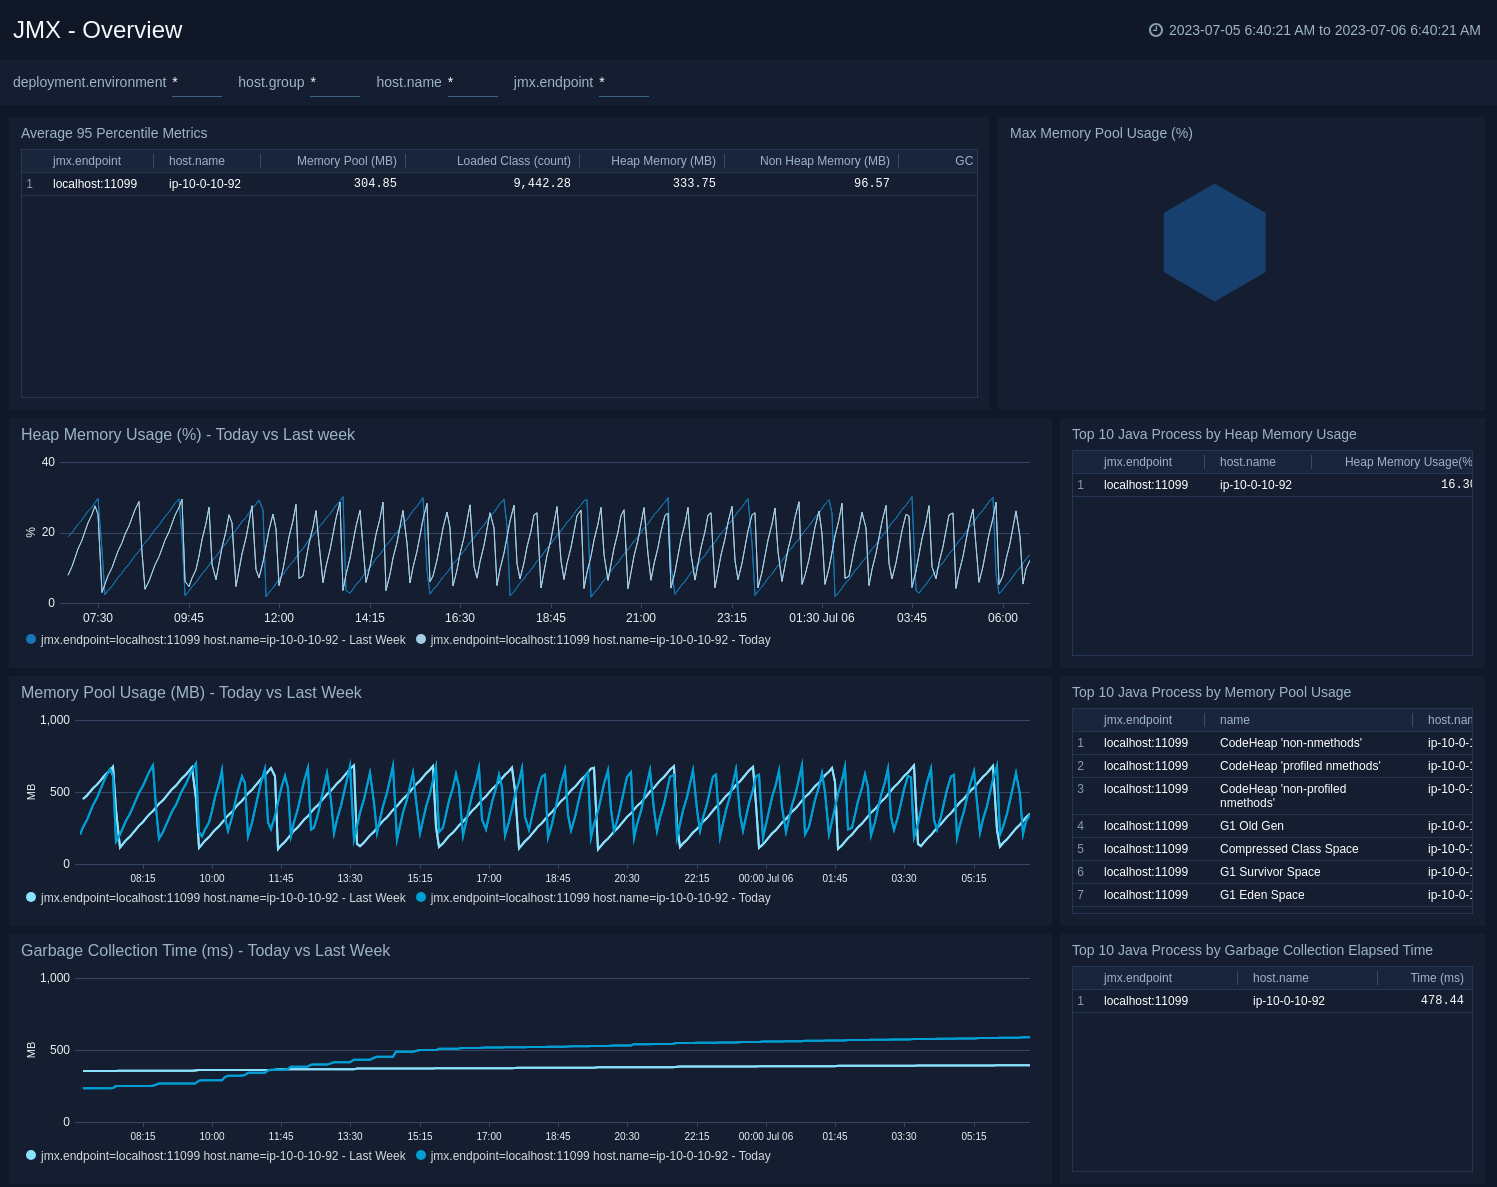
Overview
The JMX - Overview dashboard provides a quick summary of Heap Memory, Memory Pool and Garbage Collection time by different java processes.
Use this dashboard to:
- Identify the java processes using maximum heap memory and memory pool.
- Monitor the Percentage Heap Usage and Percentage Memory Pool Usage to avoid OOM errors.
- Compare the Heap Memory, Memory Pool and Garbage Collection time with last week's trends.
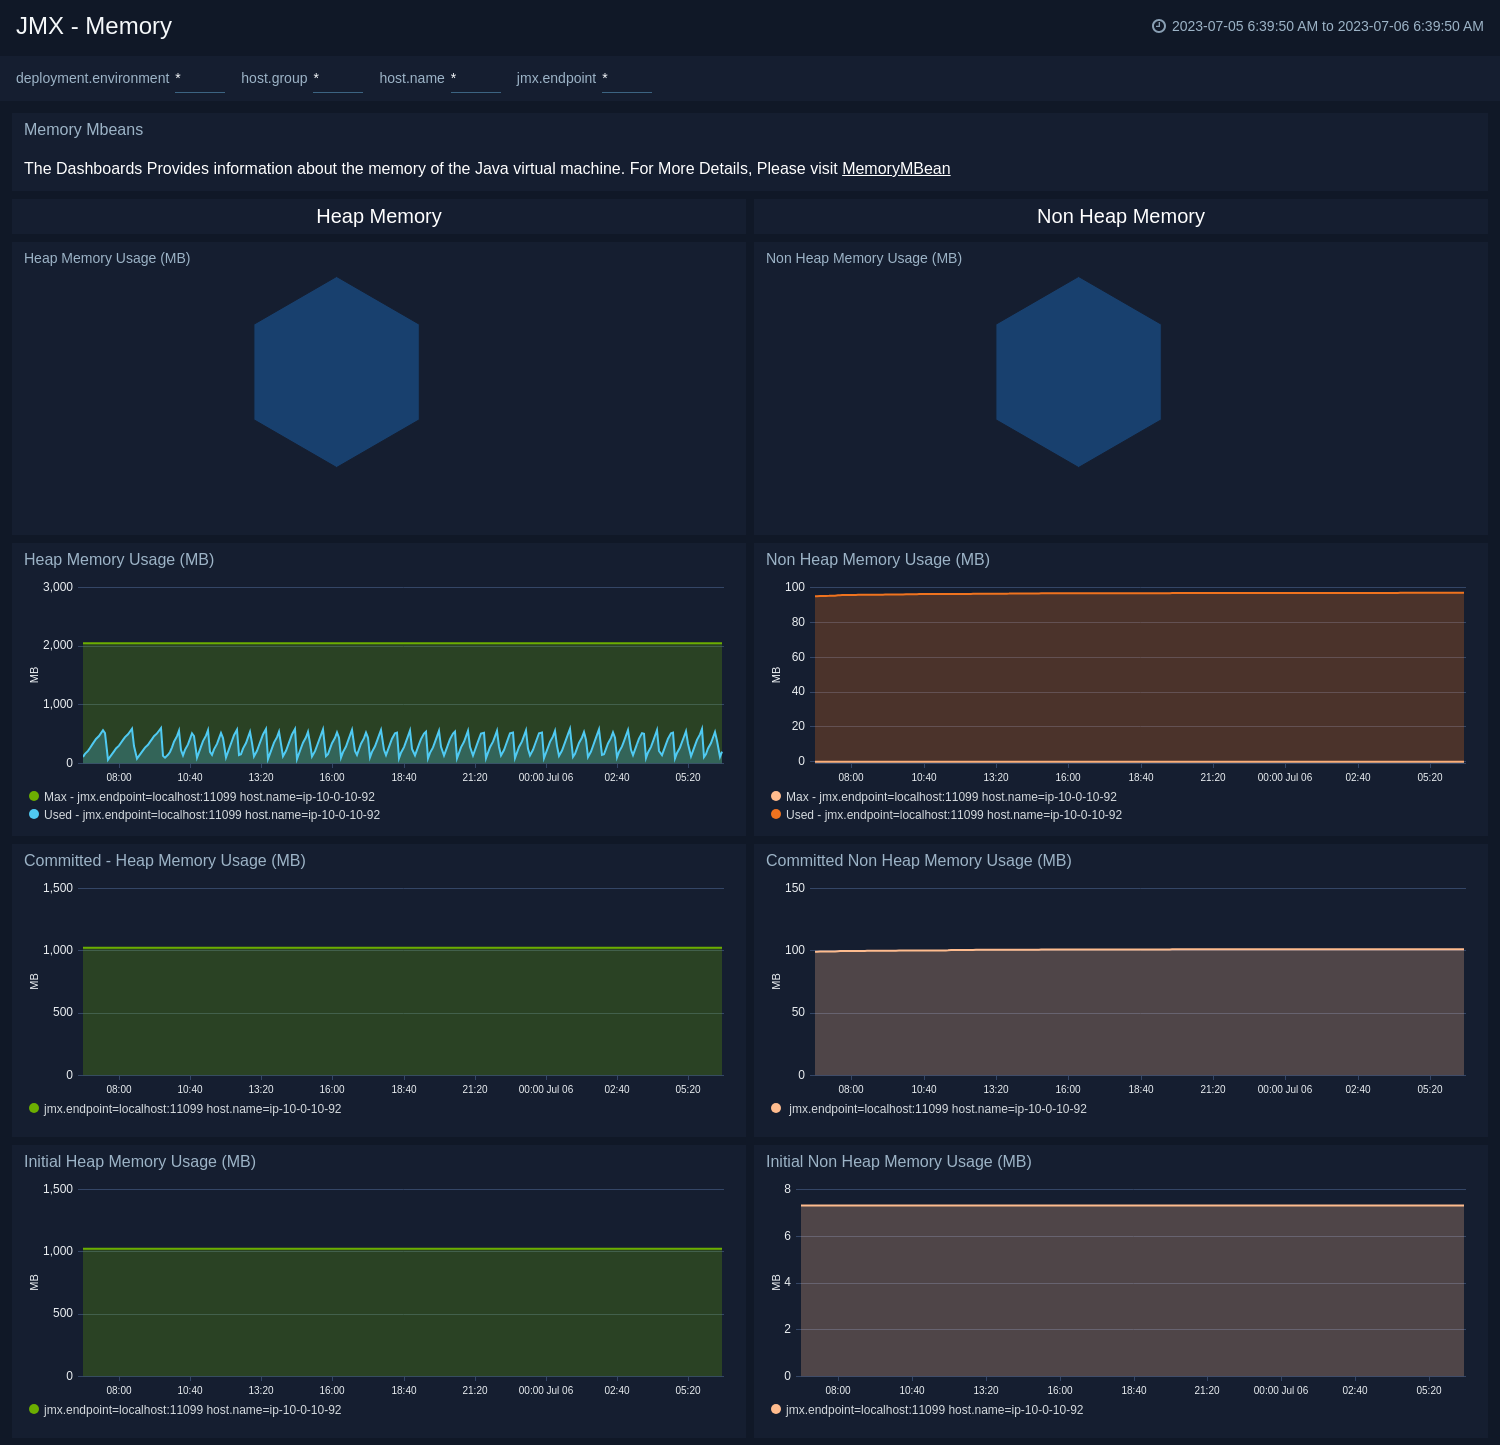
Memory
The JMX - Memory dashboard shows the percentage of the heap and non-heap memory used, physical and swap memory usage of your java virtual machine.
Use this dashboard to:
- Gain insights into Heap and Non-Heap memory usage.
- Identify the Max Heap and Initial Heap size configured for your application to set the appropriate memory switches.
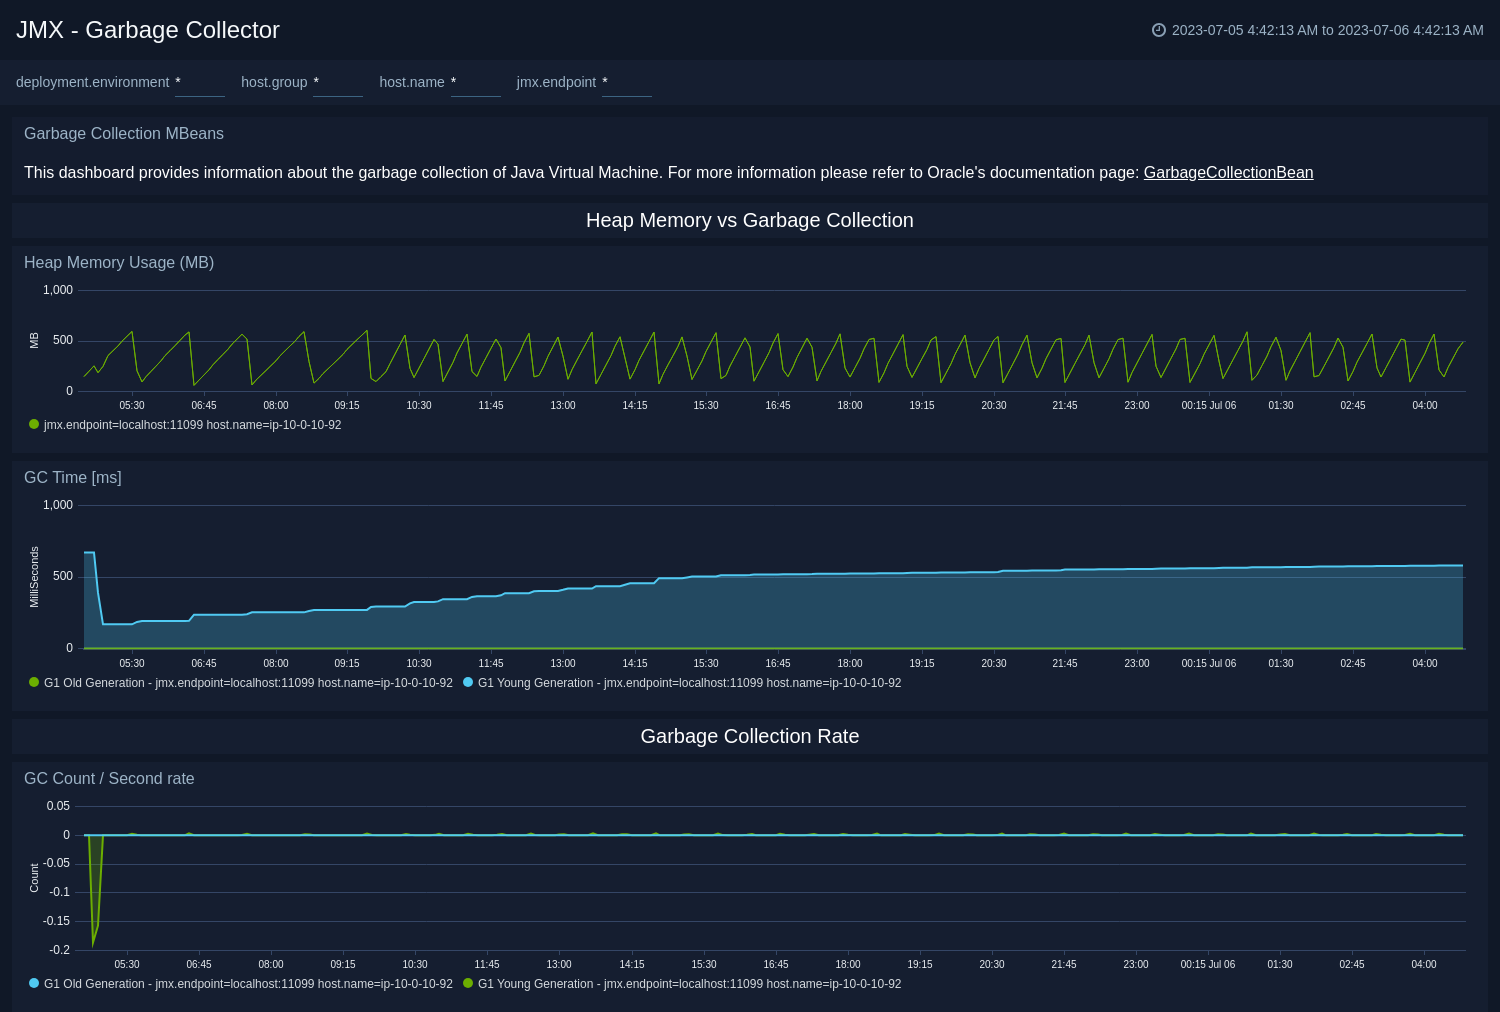
Garbage Collector
The JMX - Garbage Collector dashboard shows key Garbage Collector statistics like the duration of the last GC run, objects collected, threads used, and memory cleared in the last GC run of your java virtual machine.
Use this dashboard to:
- Understand the garbage collection time. If the time keeps on increasing, you may have more CPU usage.
- Understand the number of objects collected across memory pools and its impact on the Heap memory.
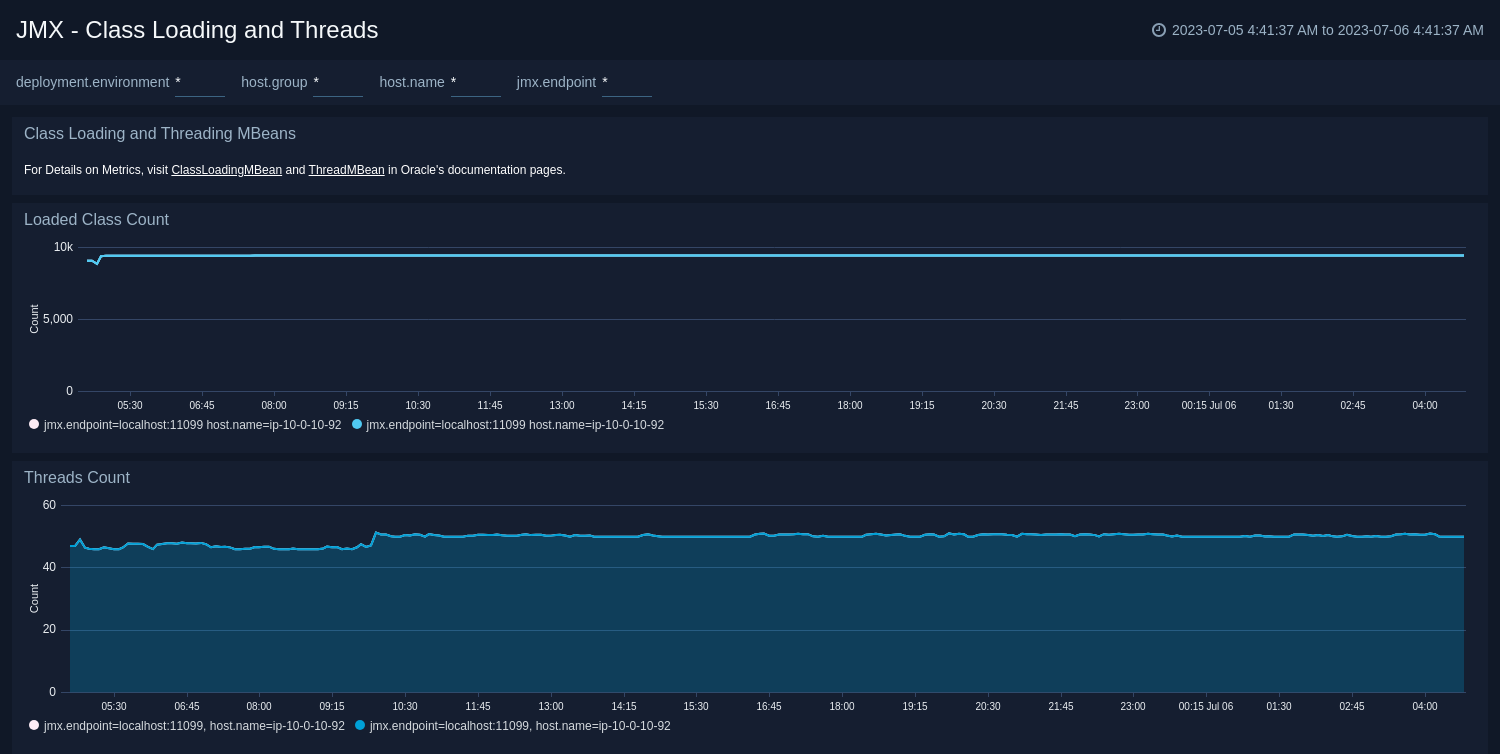
Class Loading and Threads
The JMX - Class Loading and Threads dashboard shows key information about the number and type of threads deadlocked, peak, and GC threads of your Java virtual machine running on the deployment. Use this dashboard to identify the abnormal spikes in Threads and Loaded Classes.
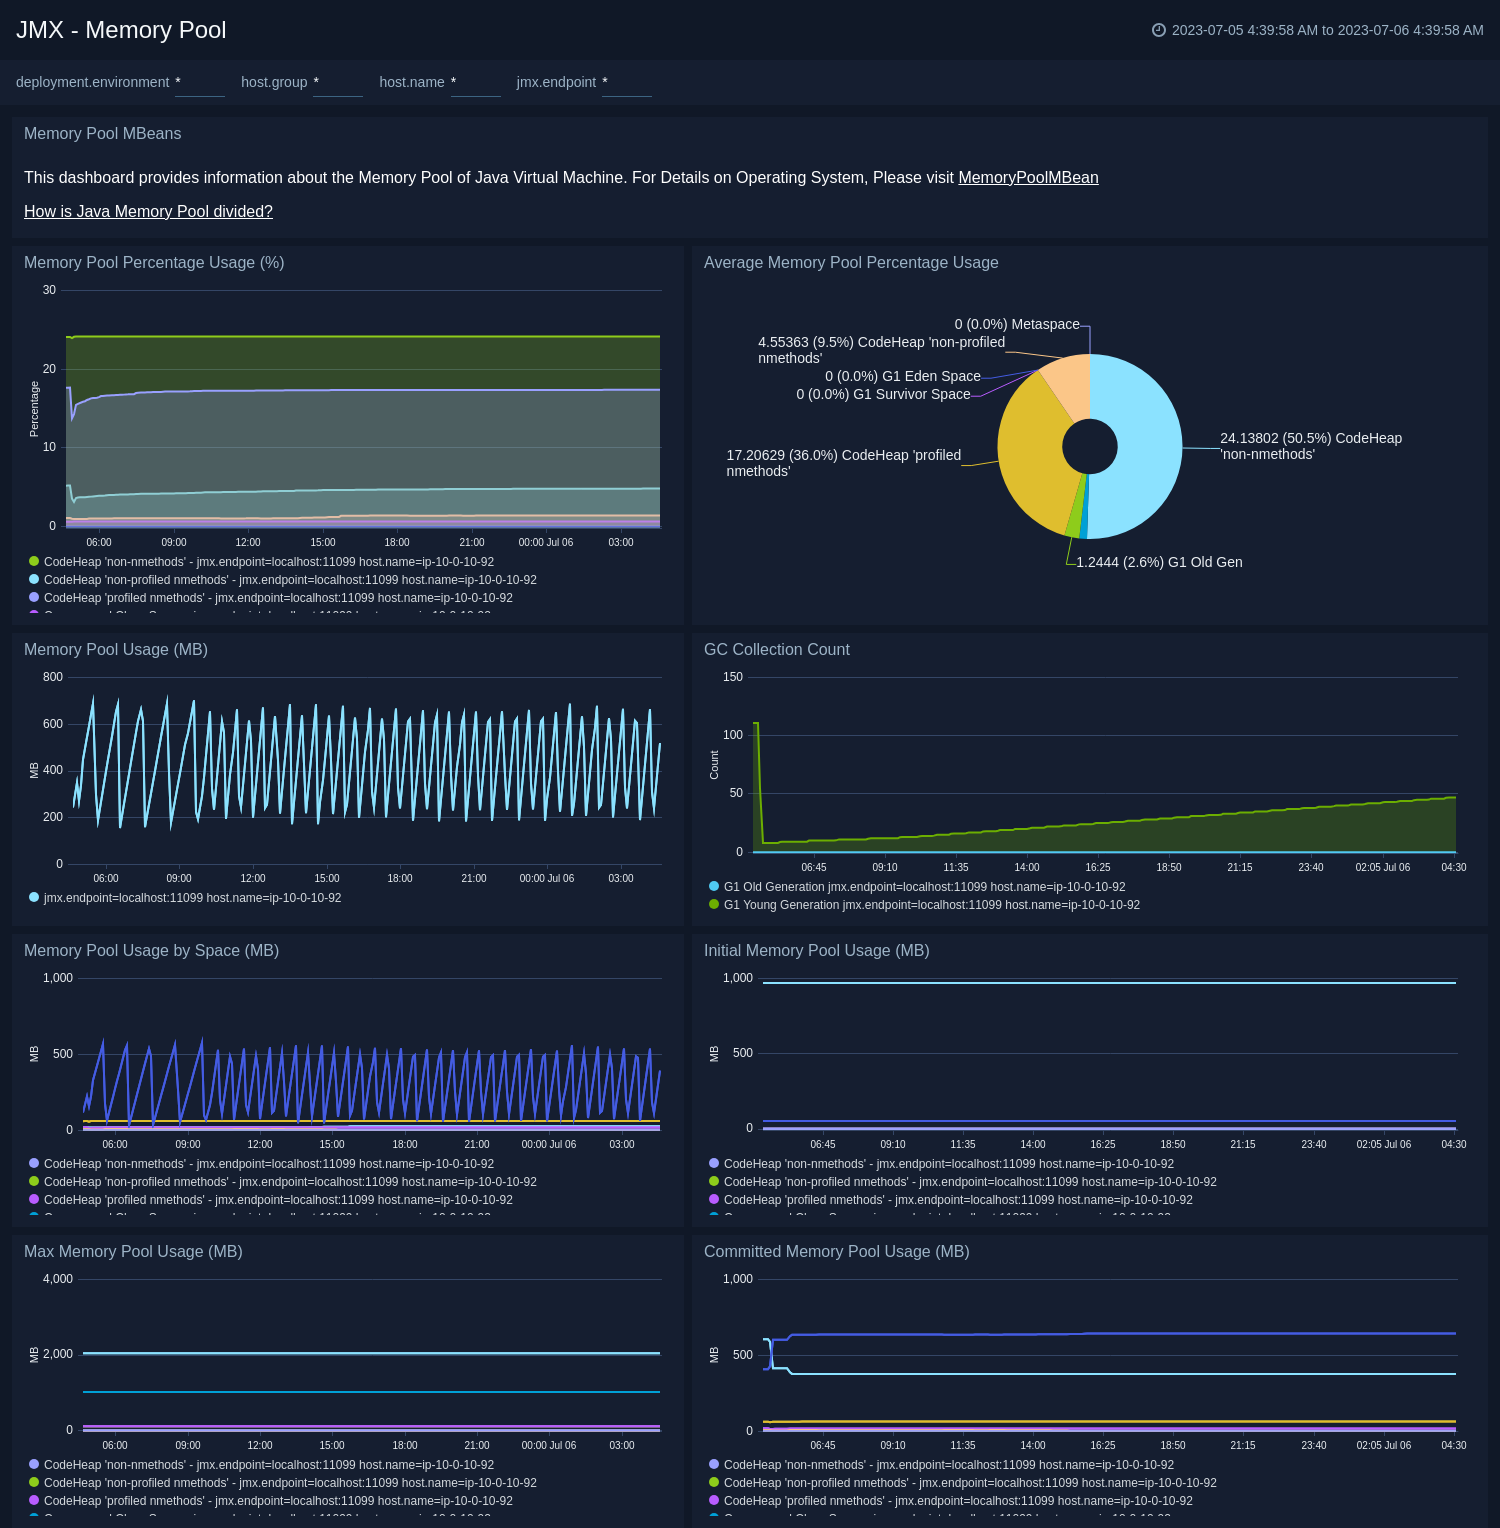
Memory Pool
The JMX - Memory Pool dashboard provides key information about the memory pool usage, peak usage, collection usage, garbage collection across various memory pools of your Java virtual machine.
Use this dashboard to:
- Gain insights into memory usage across different memory pools.
- Gain insights into garbage collection impact on different memory pools.
Create monitors for JMX app
From your App Catalog:
- From the Sumo Logic navigation, select App Catalog.
- In the Search Apps field, search for and then select your app.
- Make sure the app is installed.
- Navigate to What's Included tab and scroll down to the Monitors section.
- Click Create next to the pre-configured monitors. In the create monitors window, adjust the trigger conditions and notifications settings based on your requirements.
- Scroll down to Monitor Details.
- Under Location click on New Folder.
note
By default, monitor will be saved in the root folder. So to make the maintenance easier, create a new folder in the location of your choice.
- Enter Folder Name. Folder Description is optional.
tip
Using app version in the folder name will be helpful to determine the versioning for future updates.
- Click Create. Once the folder is created, click on Save.
JMX alerts
| Alert Name | Alert Description and conditions | Alert Condition | Recover Condition |
|---|---|---|---|
JMX - High Heap Memory Usage Alert | This alert gets triggered when heap memory usage exceeds threshold. | Count < 20 | Count >= 20 |
JMX - High Memory Pool Usage Alert | This alert gets triggered when memory pool usage exceeds threshold. | Count < 20 | Count >= 20 |
JMX - High Non Heap Memory Usage Alert | This alert gets triggered when non heap memory usage exceeds threshold. | Count < 20 | Count >= 20 |
JMX - High Number Of Classes Loaded Alert | This alert gets triggered when high number of classes are loaded. | Count > 1000 | Count <= 1000 |