Amazon CloudTrail - Cloud Security Monitoring and Analytics
This set of CloudTrail monitoring and analytics dashboards provide one dashboard for the most critical analytics. Think of this bundle of dashboards as a good starting place to see trends and outliers on specific aspects of your CloudTrail data -- including access monitoring, login activity, system monitoring, privileged activity, and threat intelligence.
Collecting logs for the AWS CloudTrail app
This section has instructions for configuring log collection for the AWS CloudTrail app.
If you intend to use the AWS CloudTrail app in multiple environments, see Configure the AWS CloudTrail App in Multiple Environments.
To configure an AWS CloudTrail Source, perform these steps:
- Configure CloudTrail in your AWS account.
- Confirm that logs are being delivered to the Amazon S3 bucket.
- Add an AWS CloudTrail Source to Sumo Logic.
- Grant Sumo Logic access to an Amazon S3 bucket.
- Generate the Role-Based Access CloudFormation template in Sumo Logic and download the template.
- Create the CloudFormation stack in AWS Management Console using the template.
- Copy the Role ARN from the Outputs tab and paste it in the Role ARN field in Sumo Logic CloudTrail Source created in step 3. For more information, see Configuring your AWS source with CloudFormation.
- Enable Sumo to track AWS Admin activity. This step is optional, but if you do not do it, the administrator activity panels in the AWS CloudTrail - User Monitoring dashboard won't be populated.
- Install the Sumo Logic App for AWS CloudTrail.
Once you begin uploading data, your daily data usage will increase. It's a good idea to check the Account page to make sure that you have enough quota to accommodate additional data in your account. If you need additional quota, you can upgrade your account at any time.
Sample log messages
{
  "eventVersion":"1.01",
  "userIdentity":{
     "type":"IAMUser",
     "principalId":"AIDAJ6IGVQ4XQZQDAYEOA",
     "arn":"arn:aws:iam::956882708938:user/Olaf",
     "accountId":"956882708938",
     "userName":"system"
  },
  "eventTime":"2017-09-27T20:00:10Z",
  "eventSource":"signin.amazonaws.com",
  "eventName":"ConsoleLogin",
  "awsRegion":"us-east-1",
  "sourceIPAddress":"65.98.119.36",
  "userAgent":"Mozilla/5.0 (Macintosh; Intel Mac OS X 10_9_5) AppleWebKit/537.36 (KHTML, like Gecko) Chrome/37.0.2062.124 Safari/537.36",
  "requestParameters":null,
  "responseElements":{
     "ConsoleLogin":"Failure"
  },
  "additionalEventData":{
     "MobileVersion":"No",
     "LoginTo":"https://console.aws.amazon.com/console/home?state\u003dhashArgs%23\u0026isauthcode\u003dtrue",
     "MFAUsed":"No"
  },
  "eventID":"f36c1d07-73cf-4ab8-84b1-04c93ac2aaeb"
}
| parse "\"sourceIPAddress\":\"*\"" as source_ipaddress
| parse "\"eventName\":\"*\"" as event_name
| parse "\"eventSource\":\"*\"" as event_source
| parse "\"awsRegion\":\"*\"" as aws_Region
| parse "\"userName\":\"*\"" as user
Sample queries
_sourceCategory=AWS_EAGLE (*Security* OR *Network*)
| parse "\"userName\":\"*\"" as user
| parse "\"eventName\":\"*\"" as event
| parse regex field=event "^(?<event_type>[A-Z][a-z]+?)[A-Z]"
| where (event matches "*Security*" OR event matches "*Network*") and event_type in ("Create","Delete")
| count by event
| sort _count
In some cases, your query results may show "HIDDEN_DUE_TO_SECURITY_REASONS" as the value of the userName field. That's because AWS does not log the user name that was entered when a sign-in failure is caused by an incorrect user name.
Installing the AWS CloudTrail app
Now that you have set up collection, install the Amazon CloudTrail - Cloud Security Monitoring and Analytics app to use the preconfigured searches and Dashboards that provide insight into your data.
To install the app, do the following:
Next-Gen App: To install or update the app, you must be an account administrator or a user with Manage Apps, Manage Monitors, Manage Fields, Manage Metric Rules, and Manage Collectors capabilities depending upon the different content types part of the app.
- Select App Catalog.
- In the 🔎 Search Apps field, run a search for your desired app, then select it.
- Click Install App.
note
Sometimes this button says Add Integration.
- Click Next in the Setup Data section.
- In the Configure section of your respective app, complete the following fields.
- Field Name. If you already have collectors and sources set up, select the configured metadata field name (eg _sourcecategory) or specify other custom metadata (eg: _collector) along with its metadata Field Value.
- Click Next. You will be redirected to the Preview & Done section.
Post-installation
Once your app is installed, it will appear in your Installed Apps folder, and dashboard panels will start to fill automatically.
Each panel slowly fills with data matching the time range query received since the panel was created. Results will not immediately be available but will be updated with full graphs and charts over time.
Viewing AWS CloudTrail dashboards
All dashboards have a set of filters that you can apply to the entire dashboard. Use these filters to drill down and examine the data to a granular level.
- You can change the time range for a dashboard or panel by selecting a predefined interval from a drop-down list, choosing a recently used time range, or specifying custom dates and times. Learn more.
- You can use template variables to drill down and examine the data on a granular level. For more information, see Filtering Dashboards with Template Variables.
- Most Next-Gen apps allow you to provide the scope at the installation time and are comprised of a key (
_sourceCategoryby default) and a default value for this key. Based on your input, the app dashboards will be parameterized with a dashboard variable, allowing you to change the dataset queried by all panels. This eliminates the need to create multiple copies of the same dashboard with different queries.
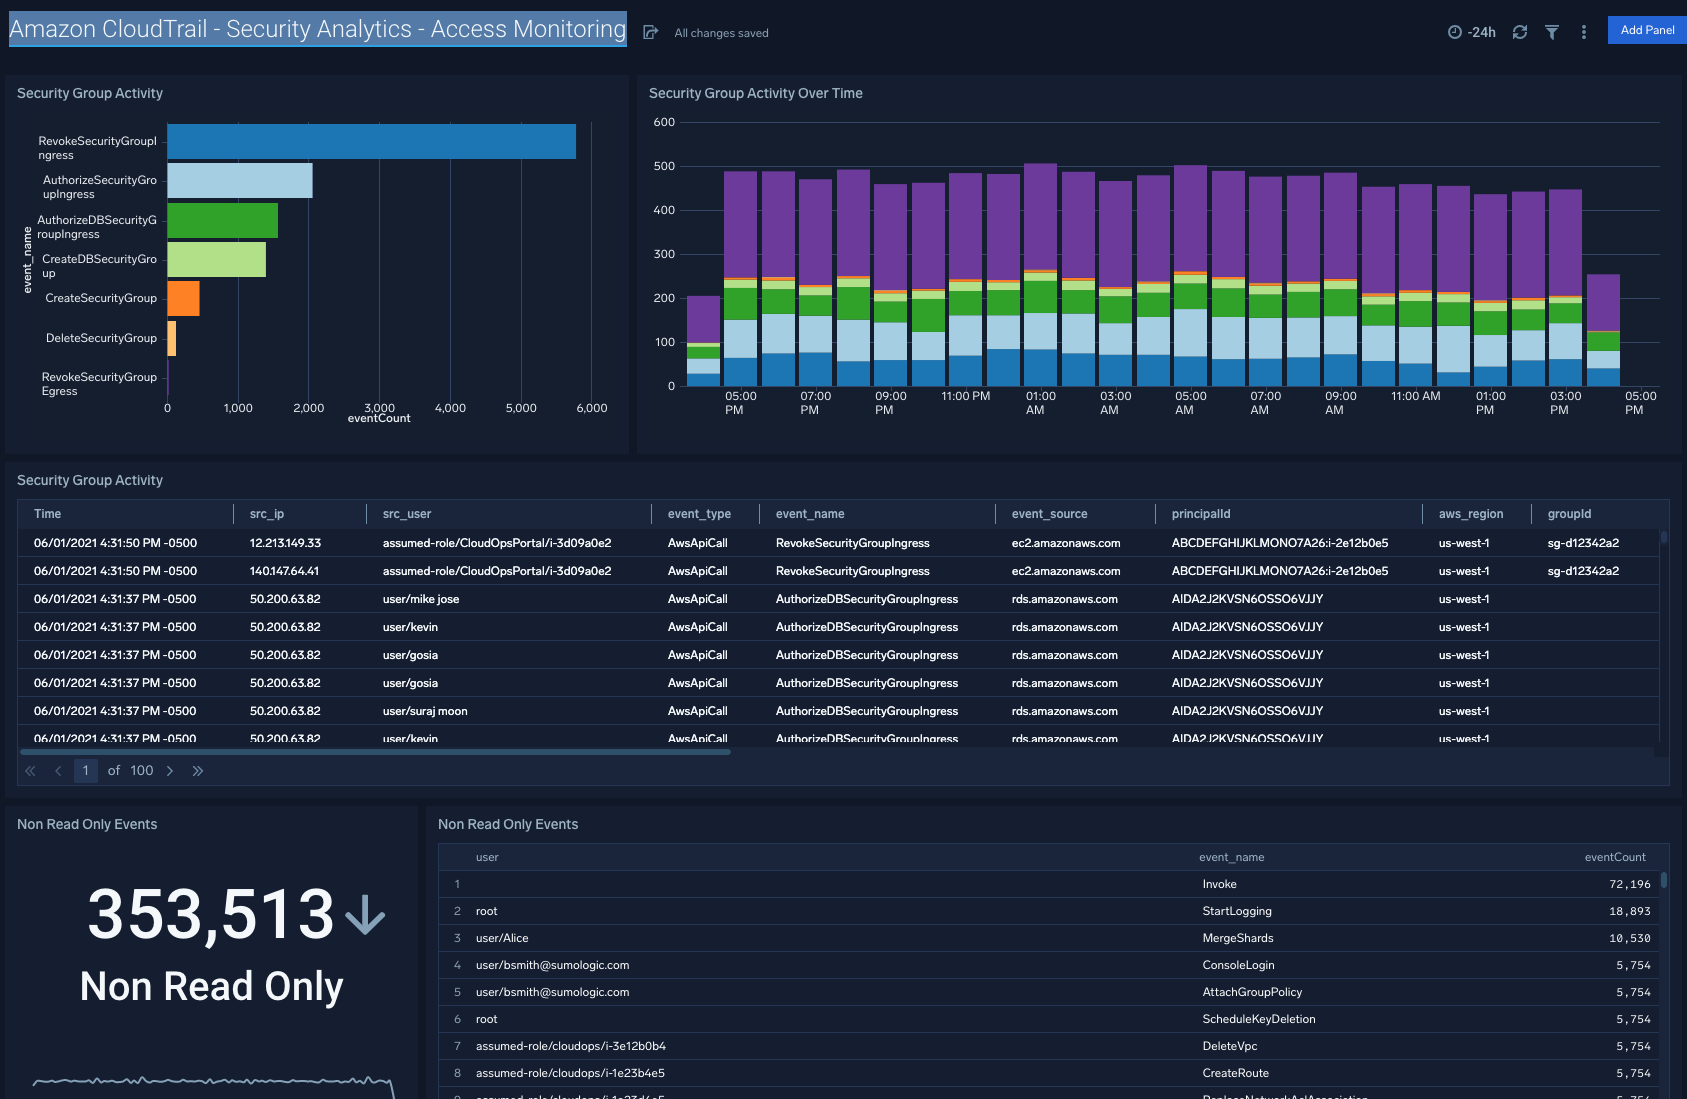
Security Analytics - Access Monitoring
Description: See the details of security group activities and all AWS activities divided by read only and non read only.
Use Case: Provides analysis of group activity events including revoking and authorizing access, creating and deleting groups, and other events.
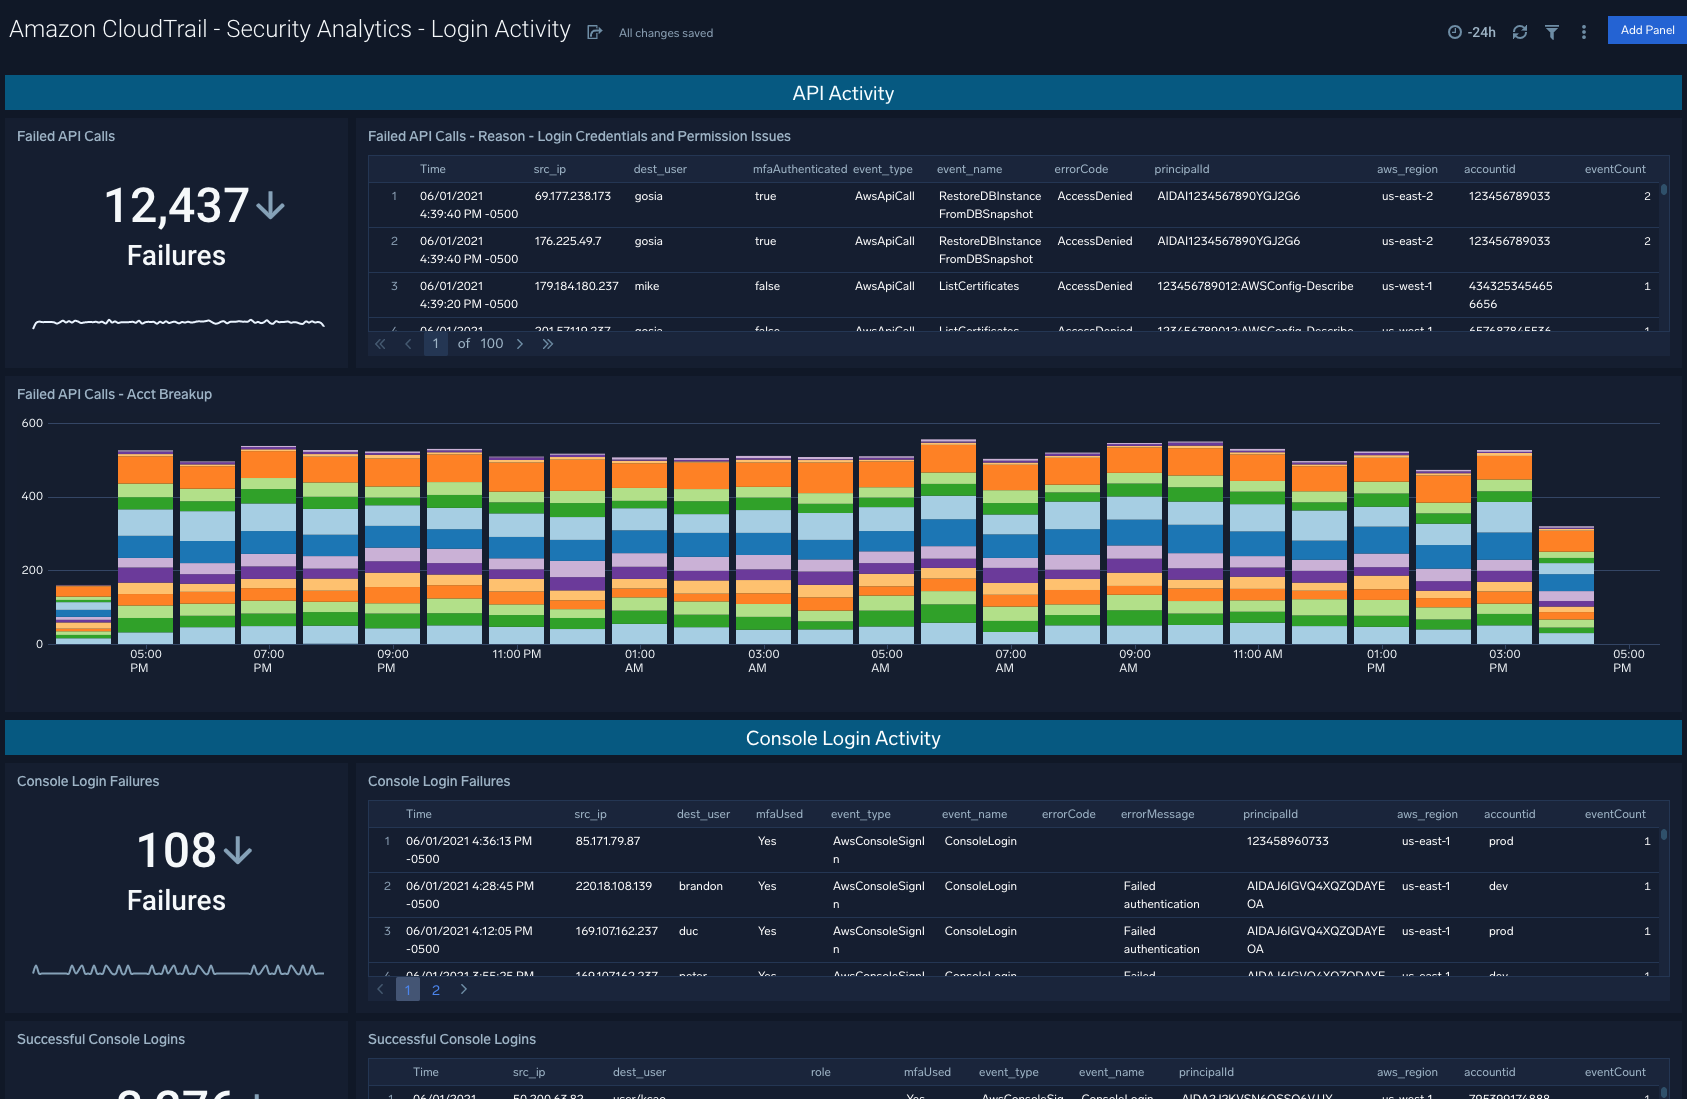
Security Analytics - Login Activity
Description: See the details of login activity successes and failures for API, console, and the root account.
Use Case: Provides analysis of login activity. For API access analysis is provided with trending failed API calls and a detailed table of the recent reasons for failure. Additionally a stacked bar chart shows the comparison of overall failed API calls broken down by account. For console and root activity success and failure are broken down with trending and a detailed table provided in each case.
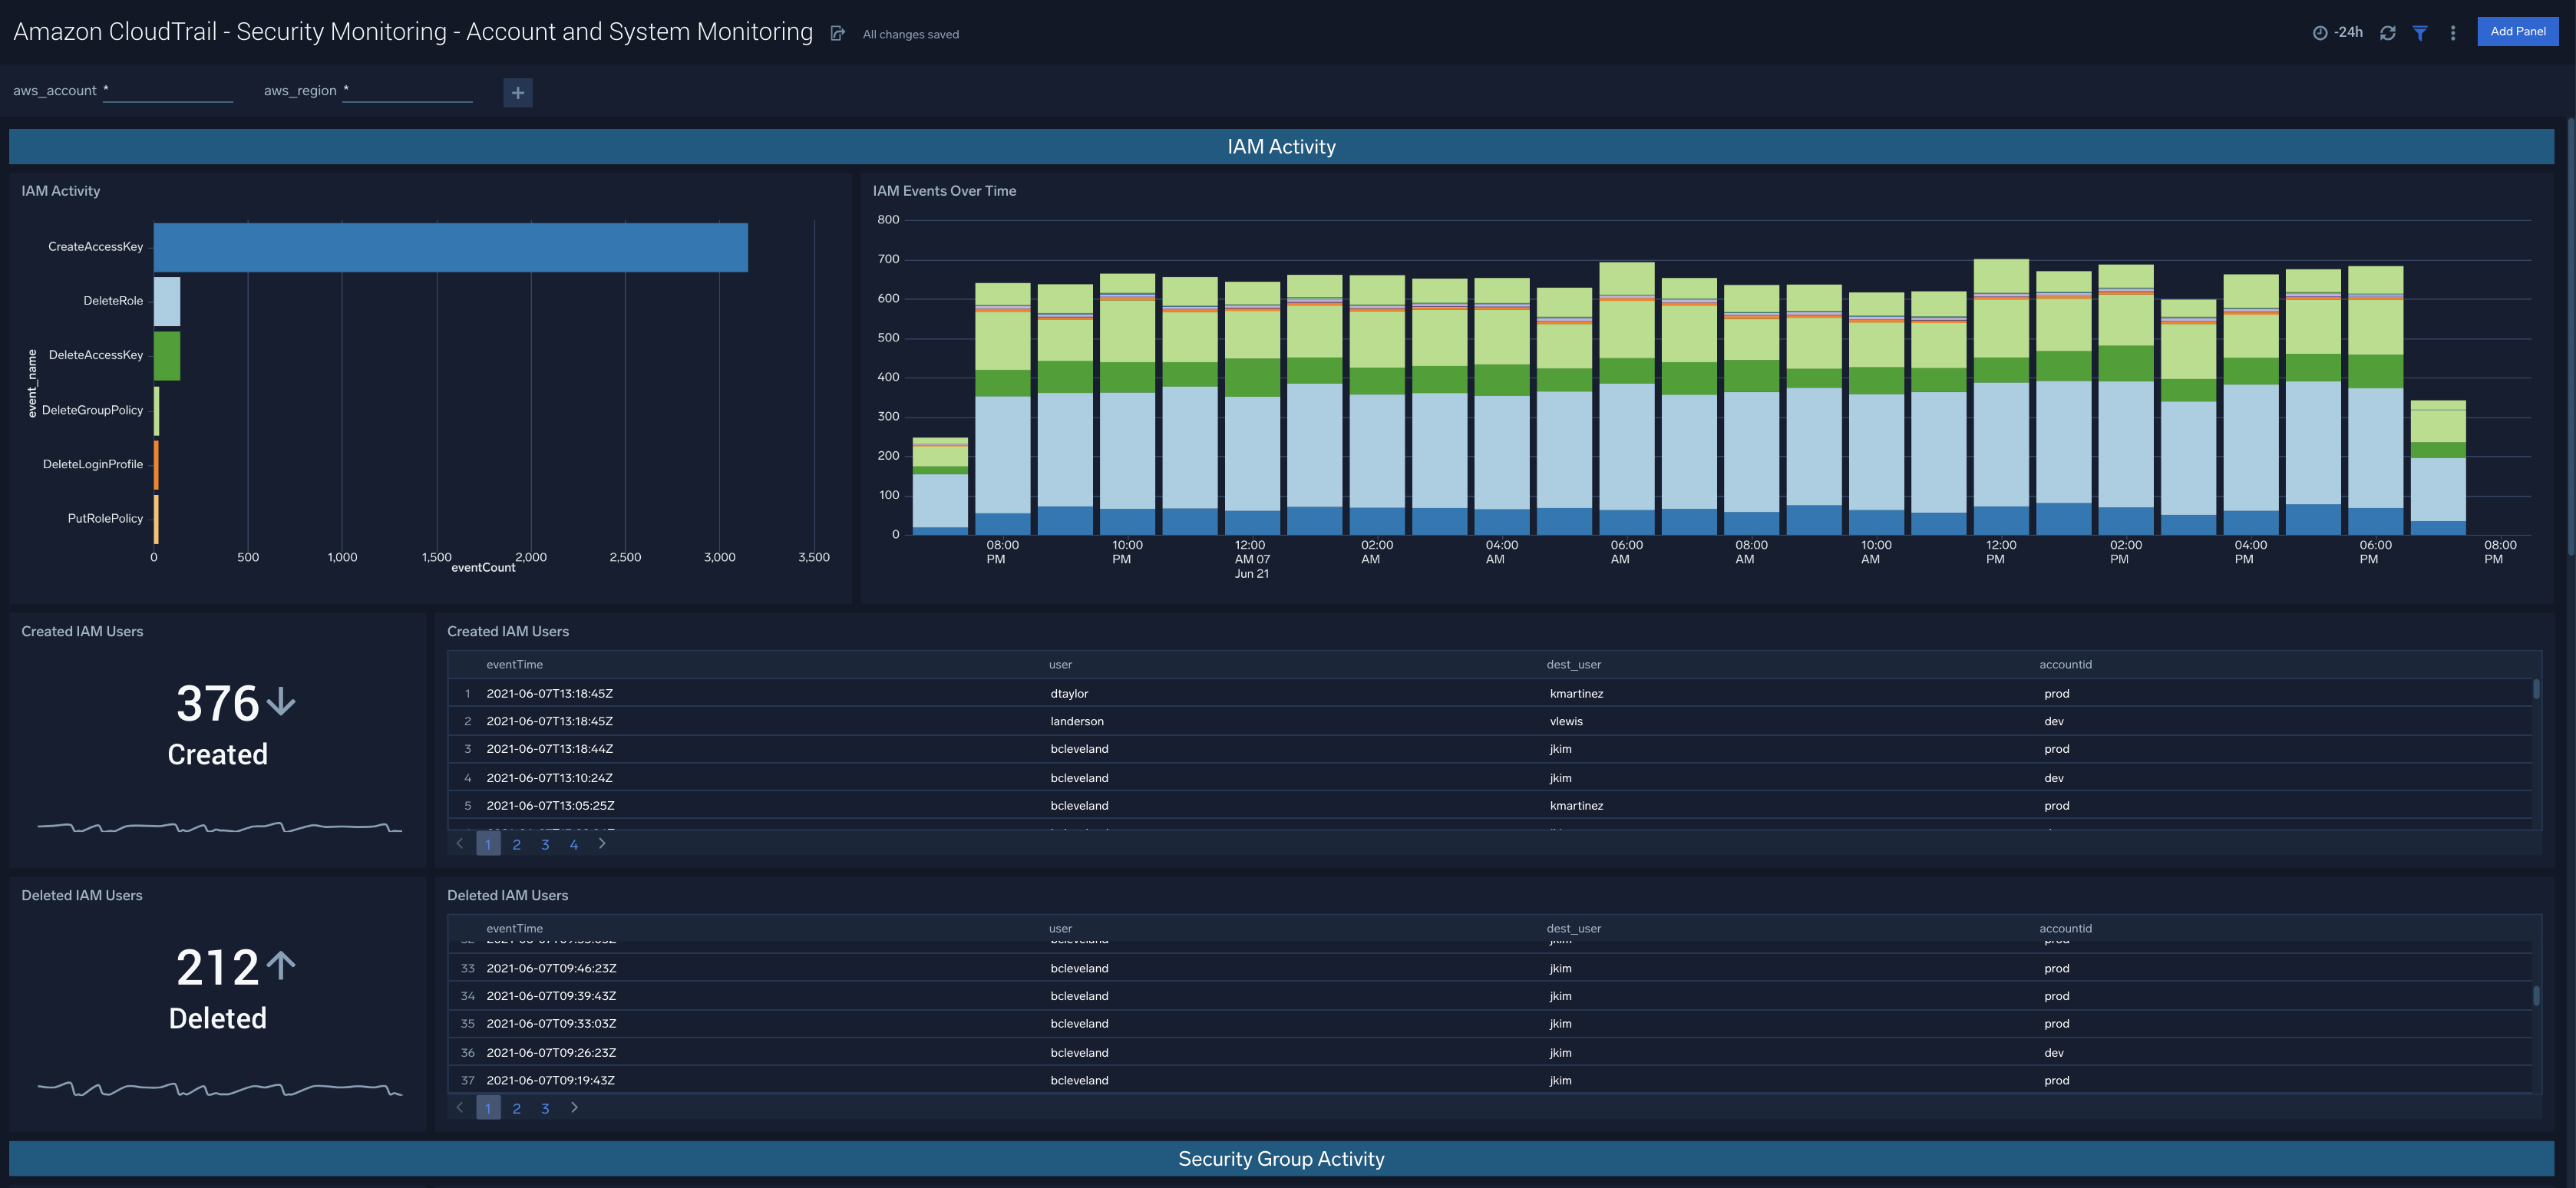
Security Monitoring - Account and System Monitoring
Description: See the details of identity and access management for users, roles, access keys and other aspects of identity.
Use Case: Provides analysis of IAM activity. Analysis of created and deleted users as well as a summary of IAM events. Created and deleted roles are evidenced. An additional set of analysis looks into password management, user changes in groups and other events.
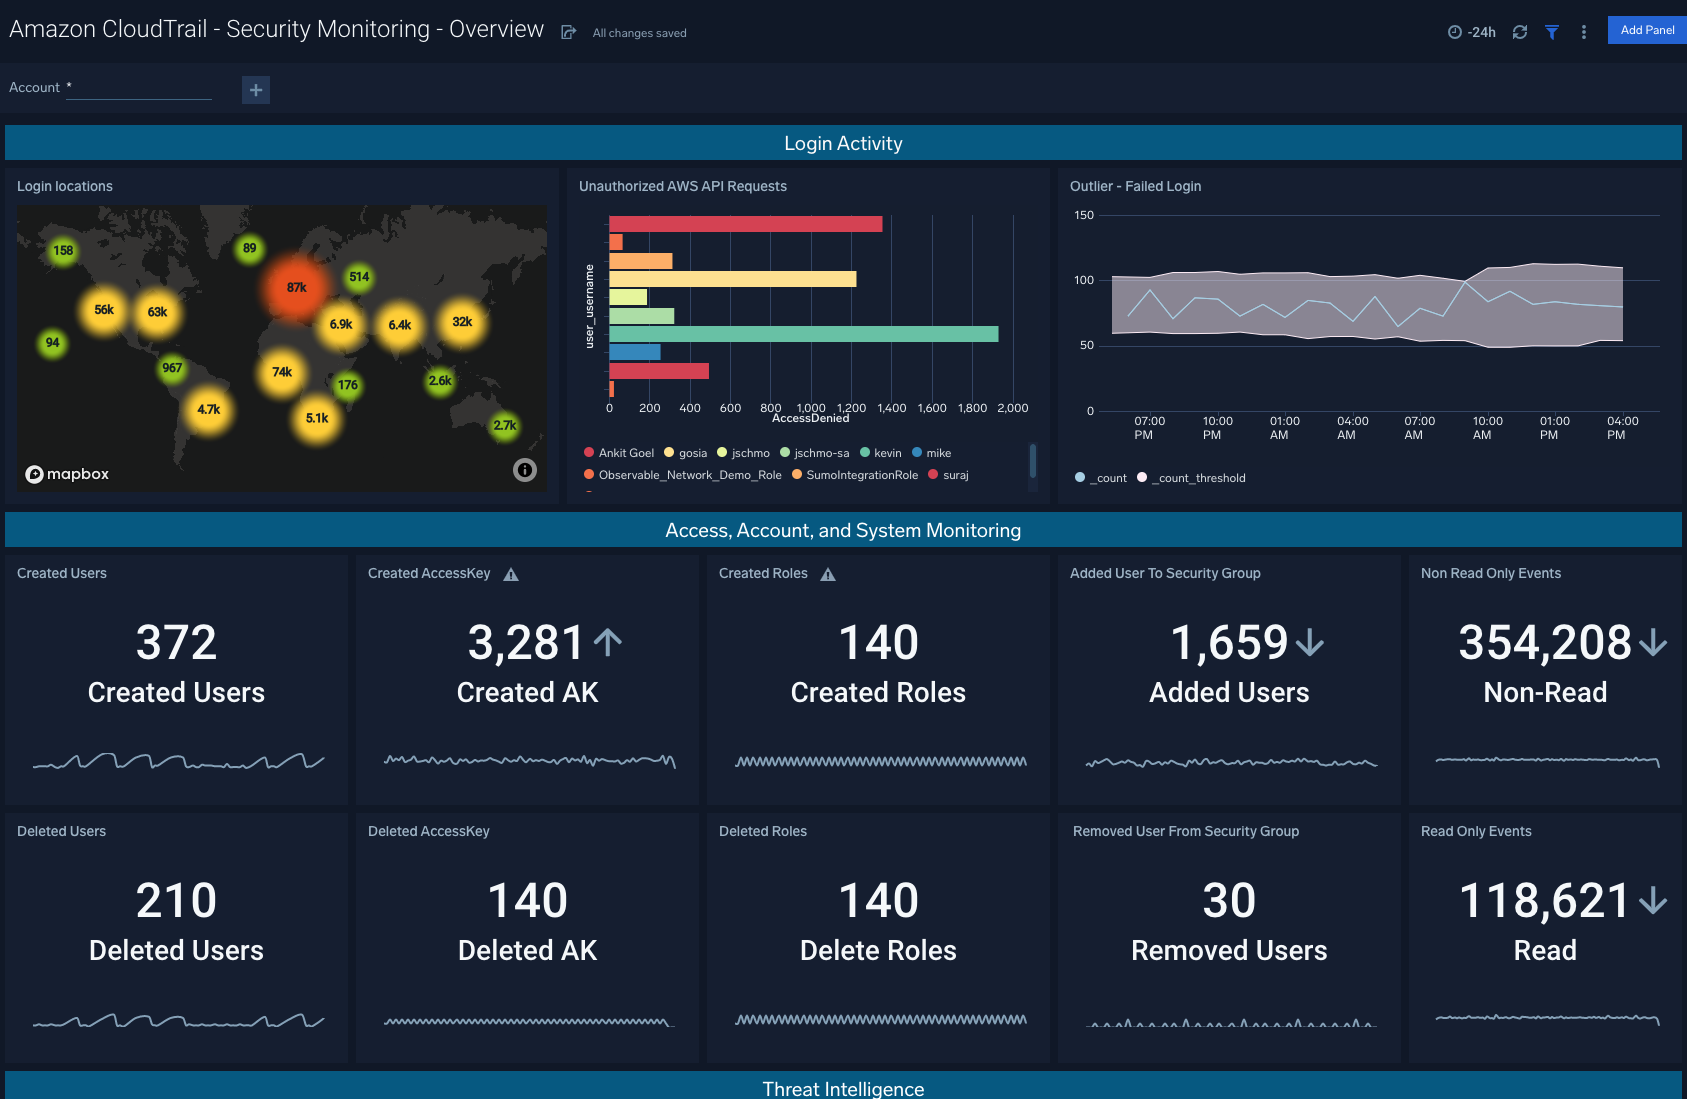
Security Monitoring - Overview
Description: Monitoring overview providing one dashboard for the most critical analytics.
Use Case: Provides summary of the dashboards in one location. A good starting place to see trends and outliers before digging into the individual analytic dashboards that will provide more detail.
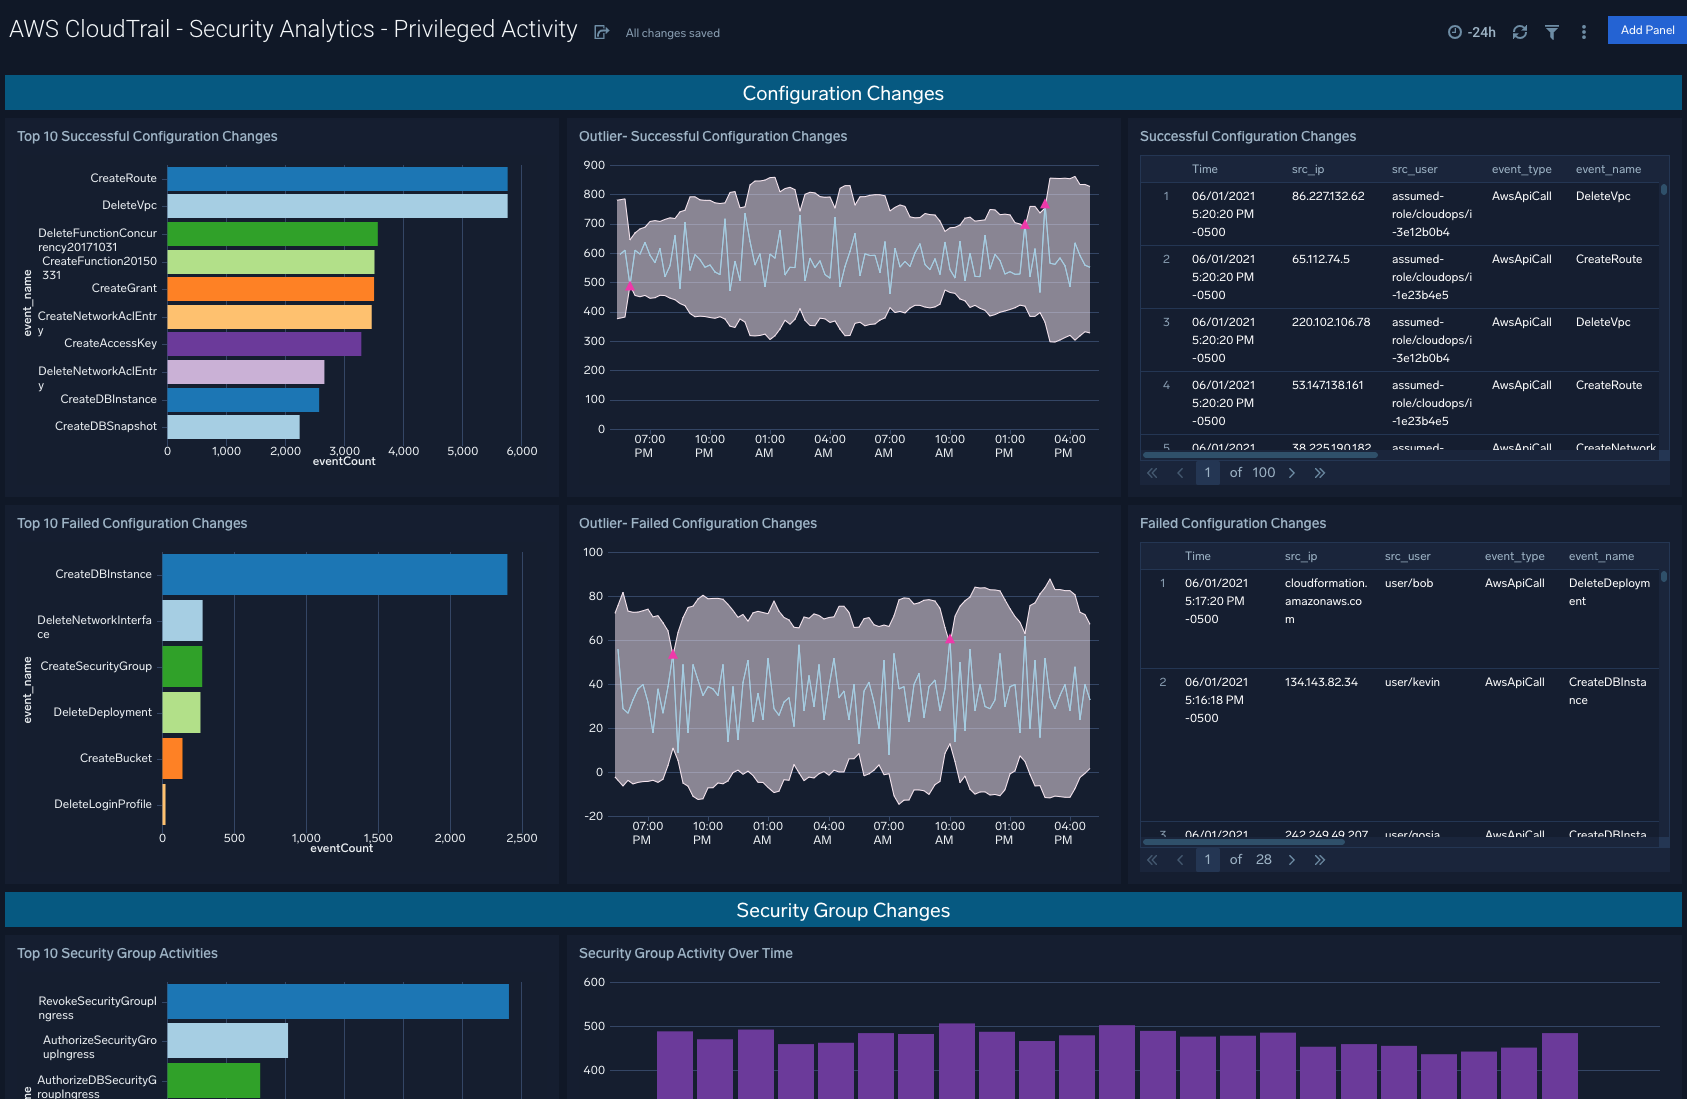
AWS CloudTrail - Security Analytics - Privileged Activity
Description: Provides analytics on events that require elevated privileges.
Use Case: Provides top events, trending and outliers on configuration changes, security group events, and security policy changes.
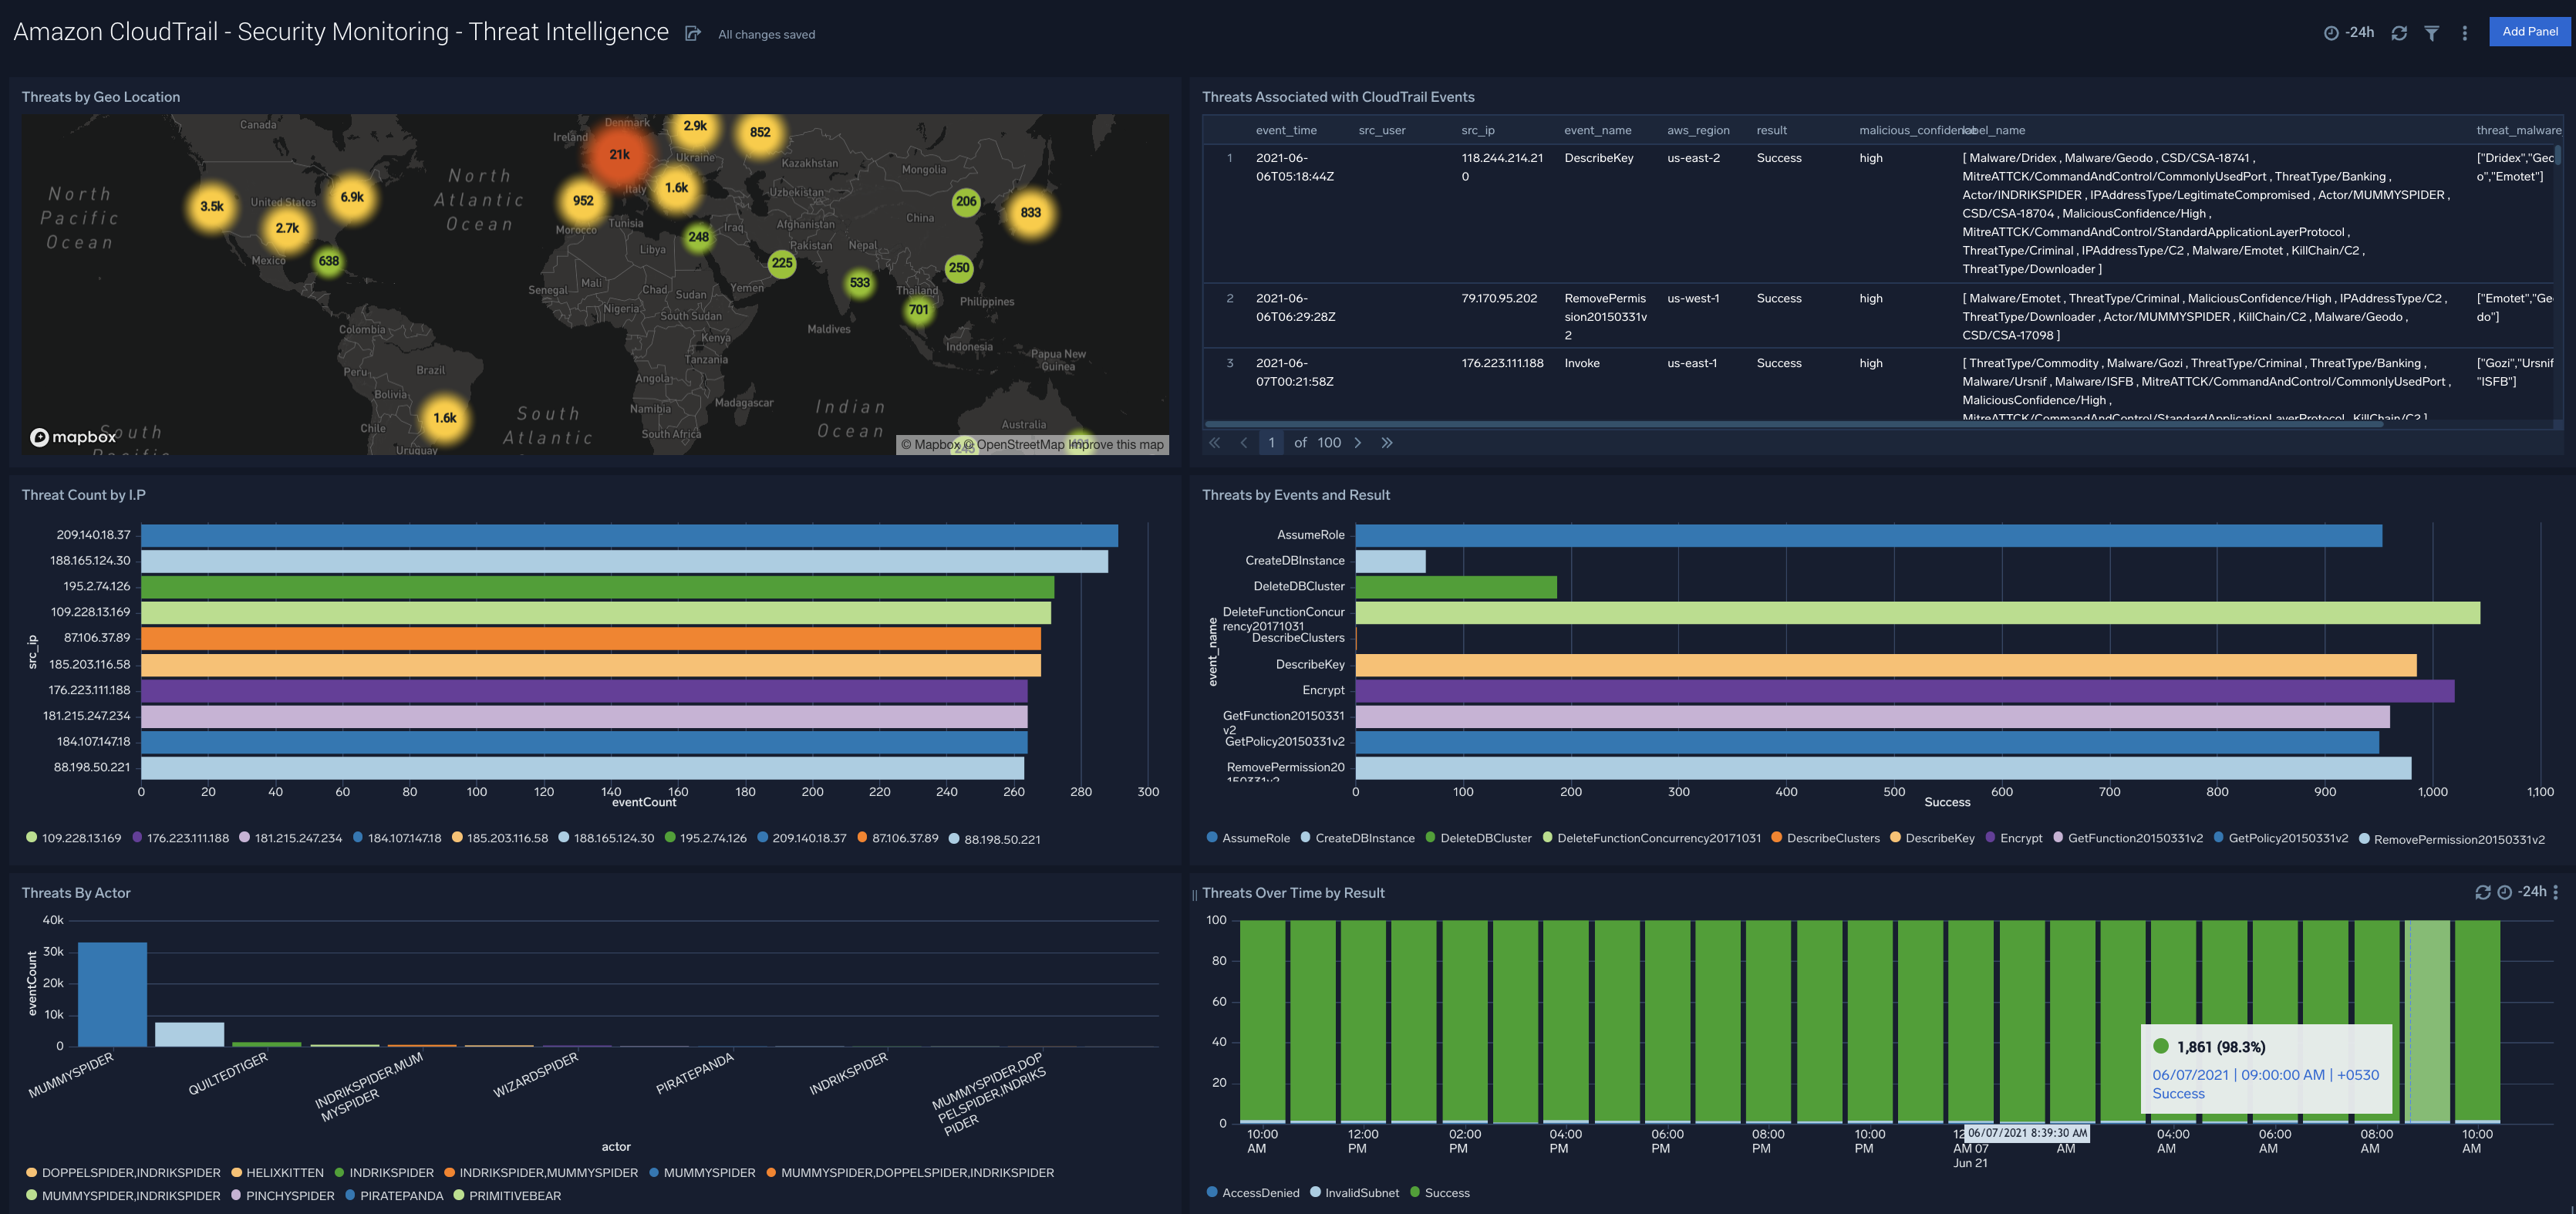
AWS CloudTrail - Security Analytics - Threat Intelligence
Description: Review this dashboard for details on potential threats and IOCs for AWS CloudTrail.
Use Case: Provides analysis on Threats Associated with CloudTrail Events, Threats By Actor, Threats by Events and I.P, Threats by Events and Result, Threats by Geo Location, Threats Over Time by Result.