AWS WAF Cloud Security Monitoring and Analytics

AWS WAF (web application firewall) data is a rich source of security findings, as it allows you to monitor the HTTP and HTTPS requests that are forwarded to CloudFront and let you control overall access to your content. Each dashboard within this application takes a different lens on AWS WAF data, from traffic patterns to threat intelligence, allowing you to truly identify the needles in the haystack that drives critical security concerns within your AWS infrastructure.
Collecting logs for AWS WAF Security Analytics
To configure Collection for AWS WAF App, follow the instructions from Collecting Logs for the AWS WAF App.
Installing the AWS WAF Security Analytics App
Now that you have set up collection for AWS WAF, install the Sumo Logic App for AWS WAF to use the pre-configured searches and dashboards.
To install the app, do the following:
Next-Gen App: To install or update the app, you must be an account administrator or a user with Manage Apps, Manage Monitors, Manage Fields, Manage Metric Rules, and Manage Collectors capabilities depending upon the different content types part of the app.
- Select App Catalog.
- In the 🔎 Search Apps field, run a search for your desired app, then select it.
- Click Install App.
note
Sometimes this button says Add Integration.
- Click Next in the Setup Data section.
- In the Configure section of your respective app, complete the following fields.
- Field Name. If you already have collectors and sources set up, select the configured metadata field name (eg _sourcecategory) or specify other custom metadata (eg: _collector) along with its metadata Field Value.
- Click Next. You will be redirected to the Preview & Done section.
Post-installation
Once your app is installed, it will appear in your Installed Apps folder, and dashboard panels will start to fill automatically.
Each panel slowly fills with data matching the time range query received since the panel was created. Results will not immediately be available but will be updated with full graphs and charts over time.
Viewing AWS WAF Security Monitoring dashboards
AWS WAF - Security Monitoring - Overview
See an overview of threats detected and traffic passing through AWS WAF.
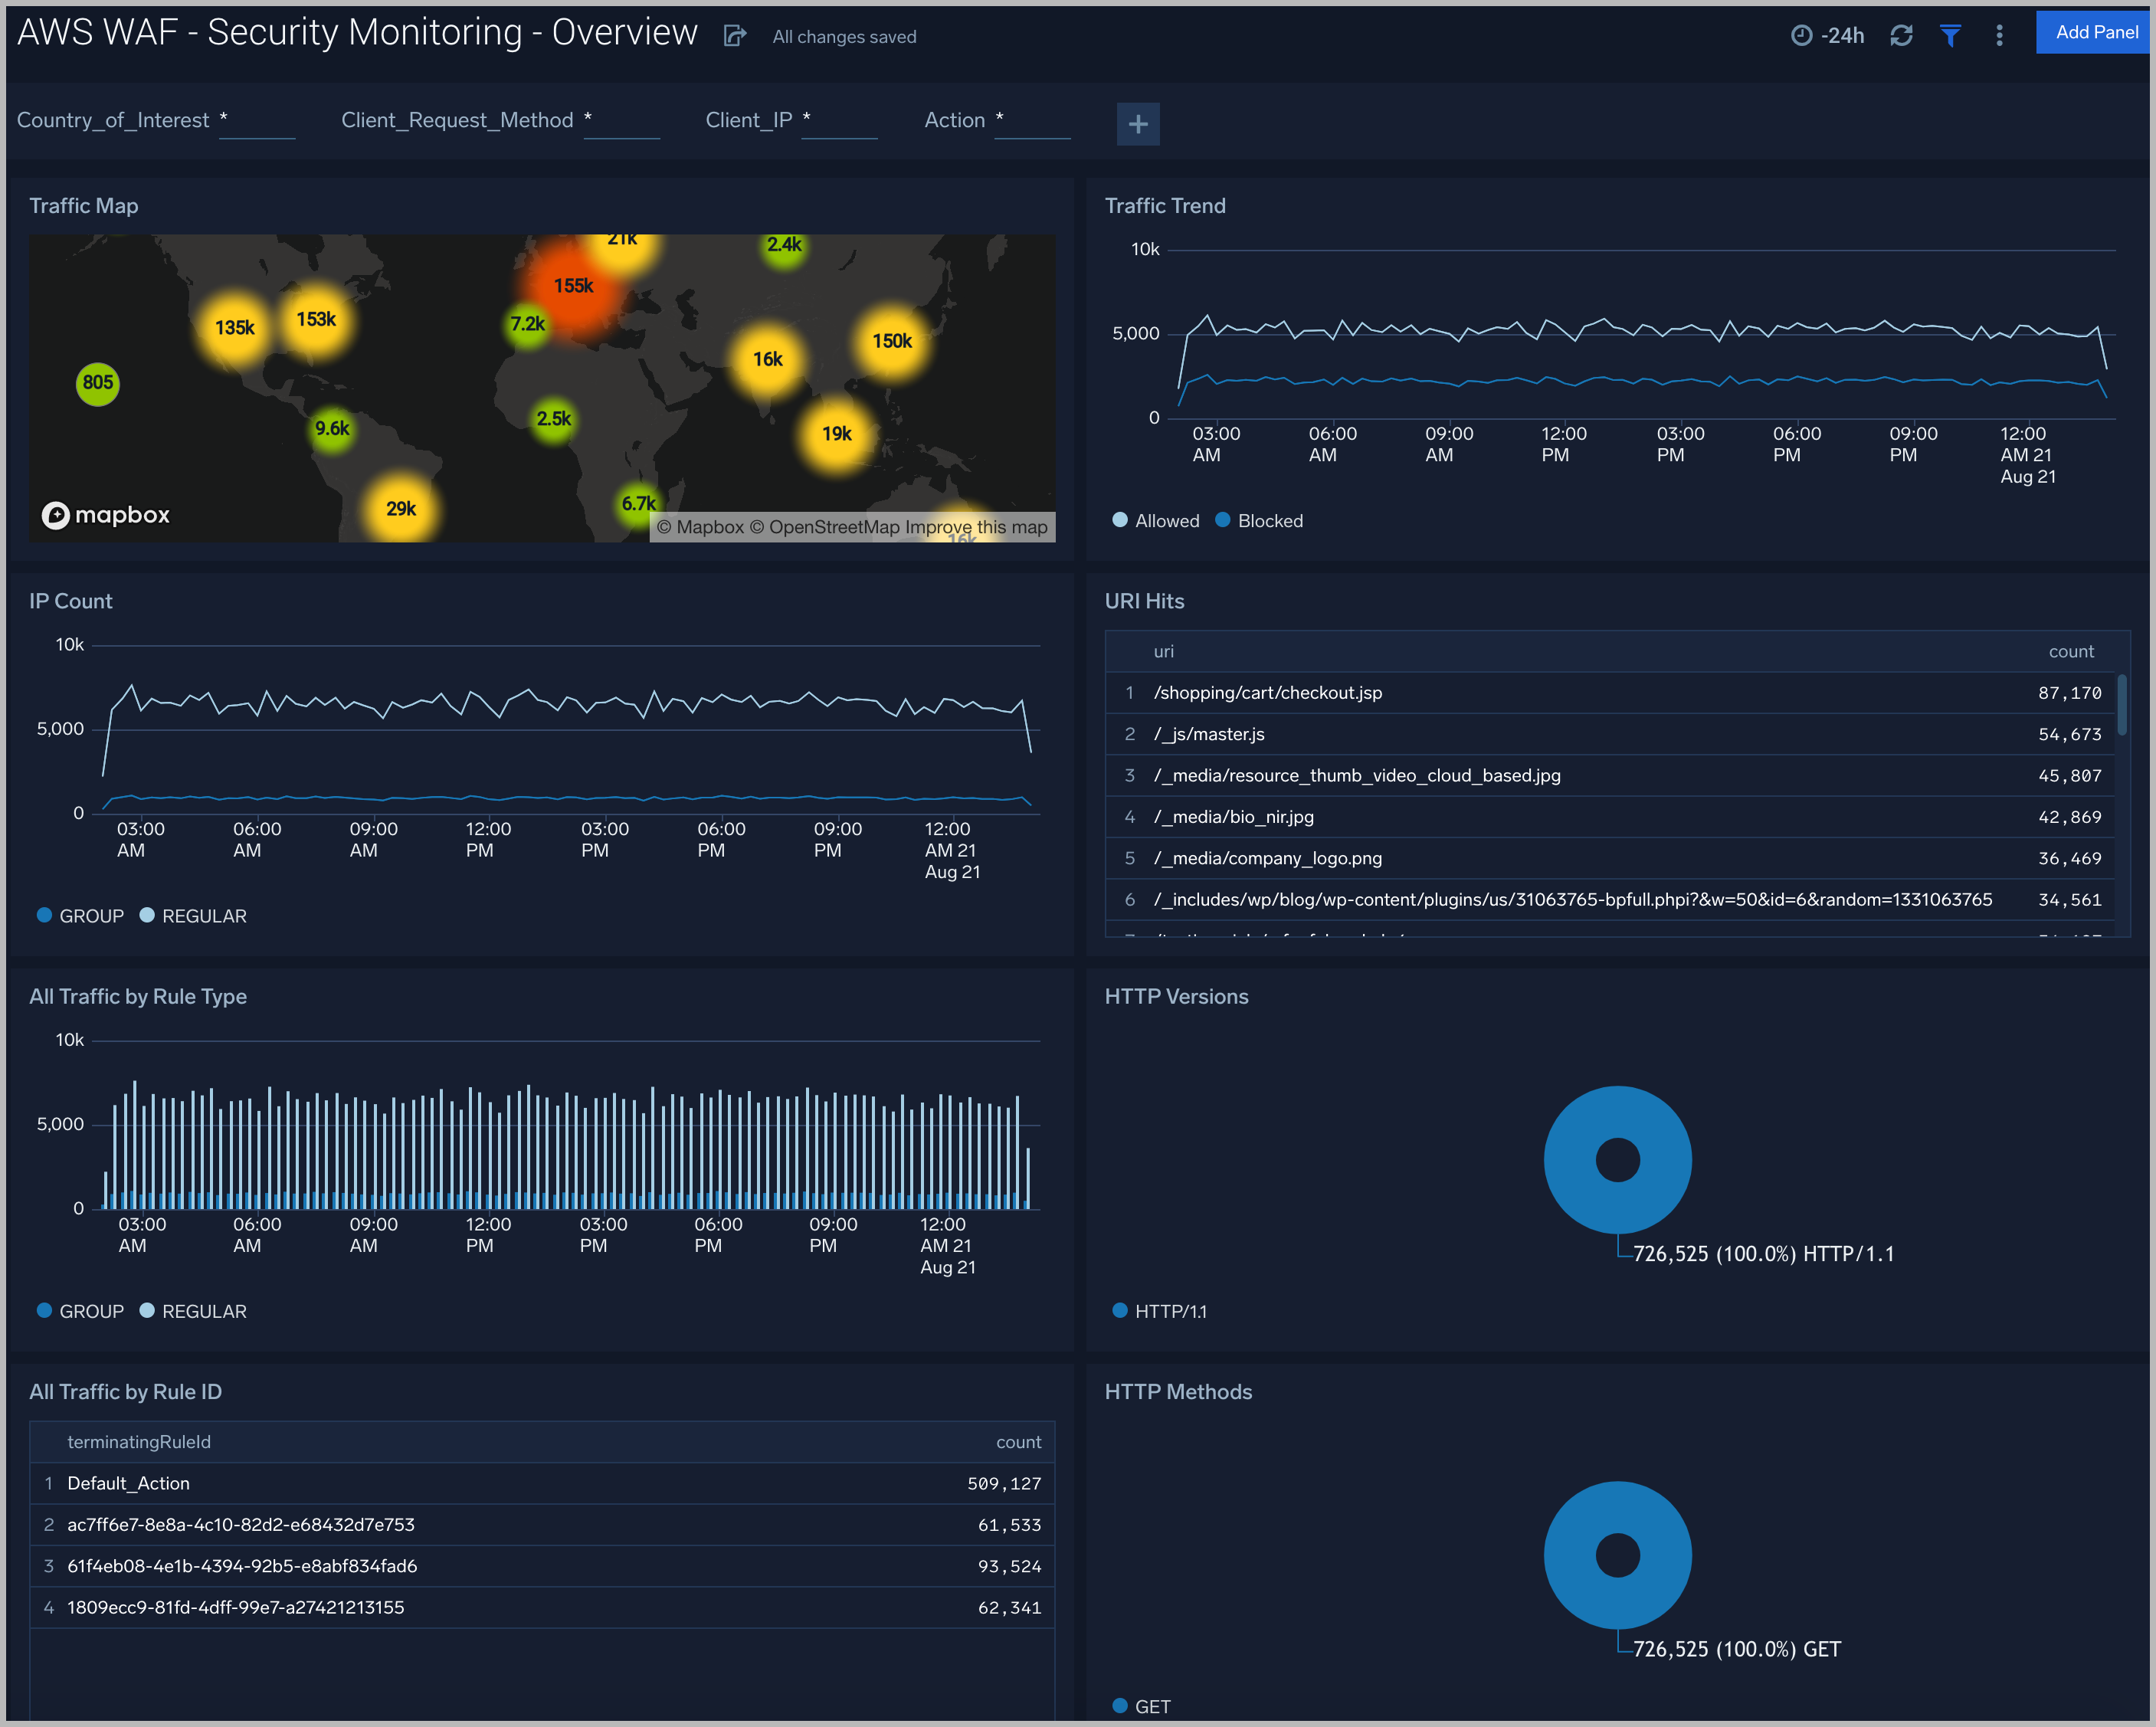
Traffic Map. Geolocation heat map of inbound and outbound traffic passing through the WAF.
Traffic Trend. Line chart comparing the volume of blocked and allowed connections.
IP Count. Line chart of unique IP addresses connecting over time.
URI Hits. Table of directory and file paths connected to sorted by frequency.
All Traffic by Rule Type. Column chart of connections by WAF rule type.
HTTP Versions. Donut chart showing the total number of connections broken down by HTTP versions.
All Traffic by Rule ID. Table showing connections sorted by most frequent rule ID.
HTTP Methods. Donut chart showing the total number of connections broken down by HTTP methods.
AWS WAF - Security Analytics - Traffic
See details of threats allowed and blocked by AWS WAF.
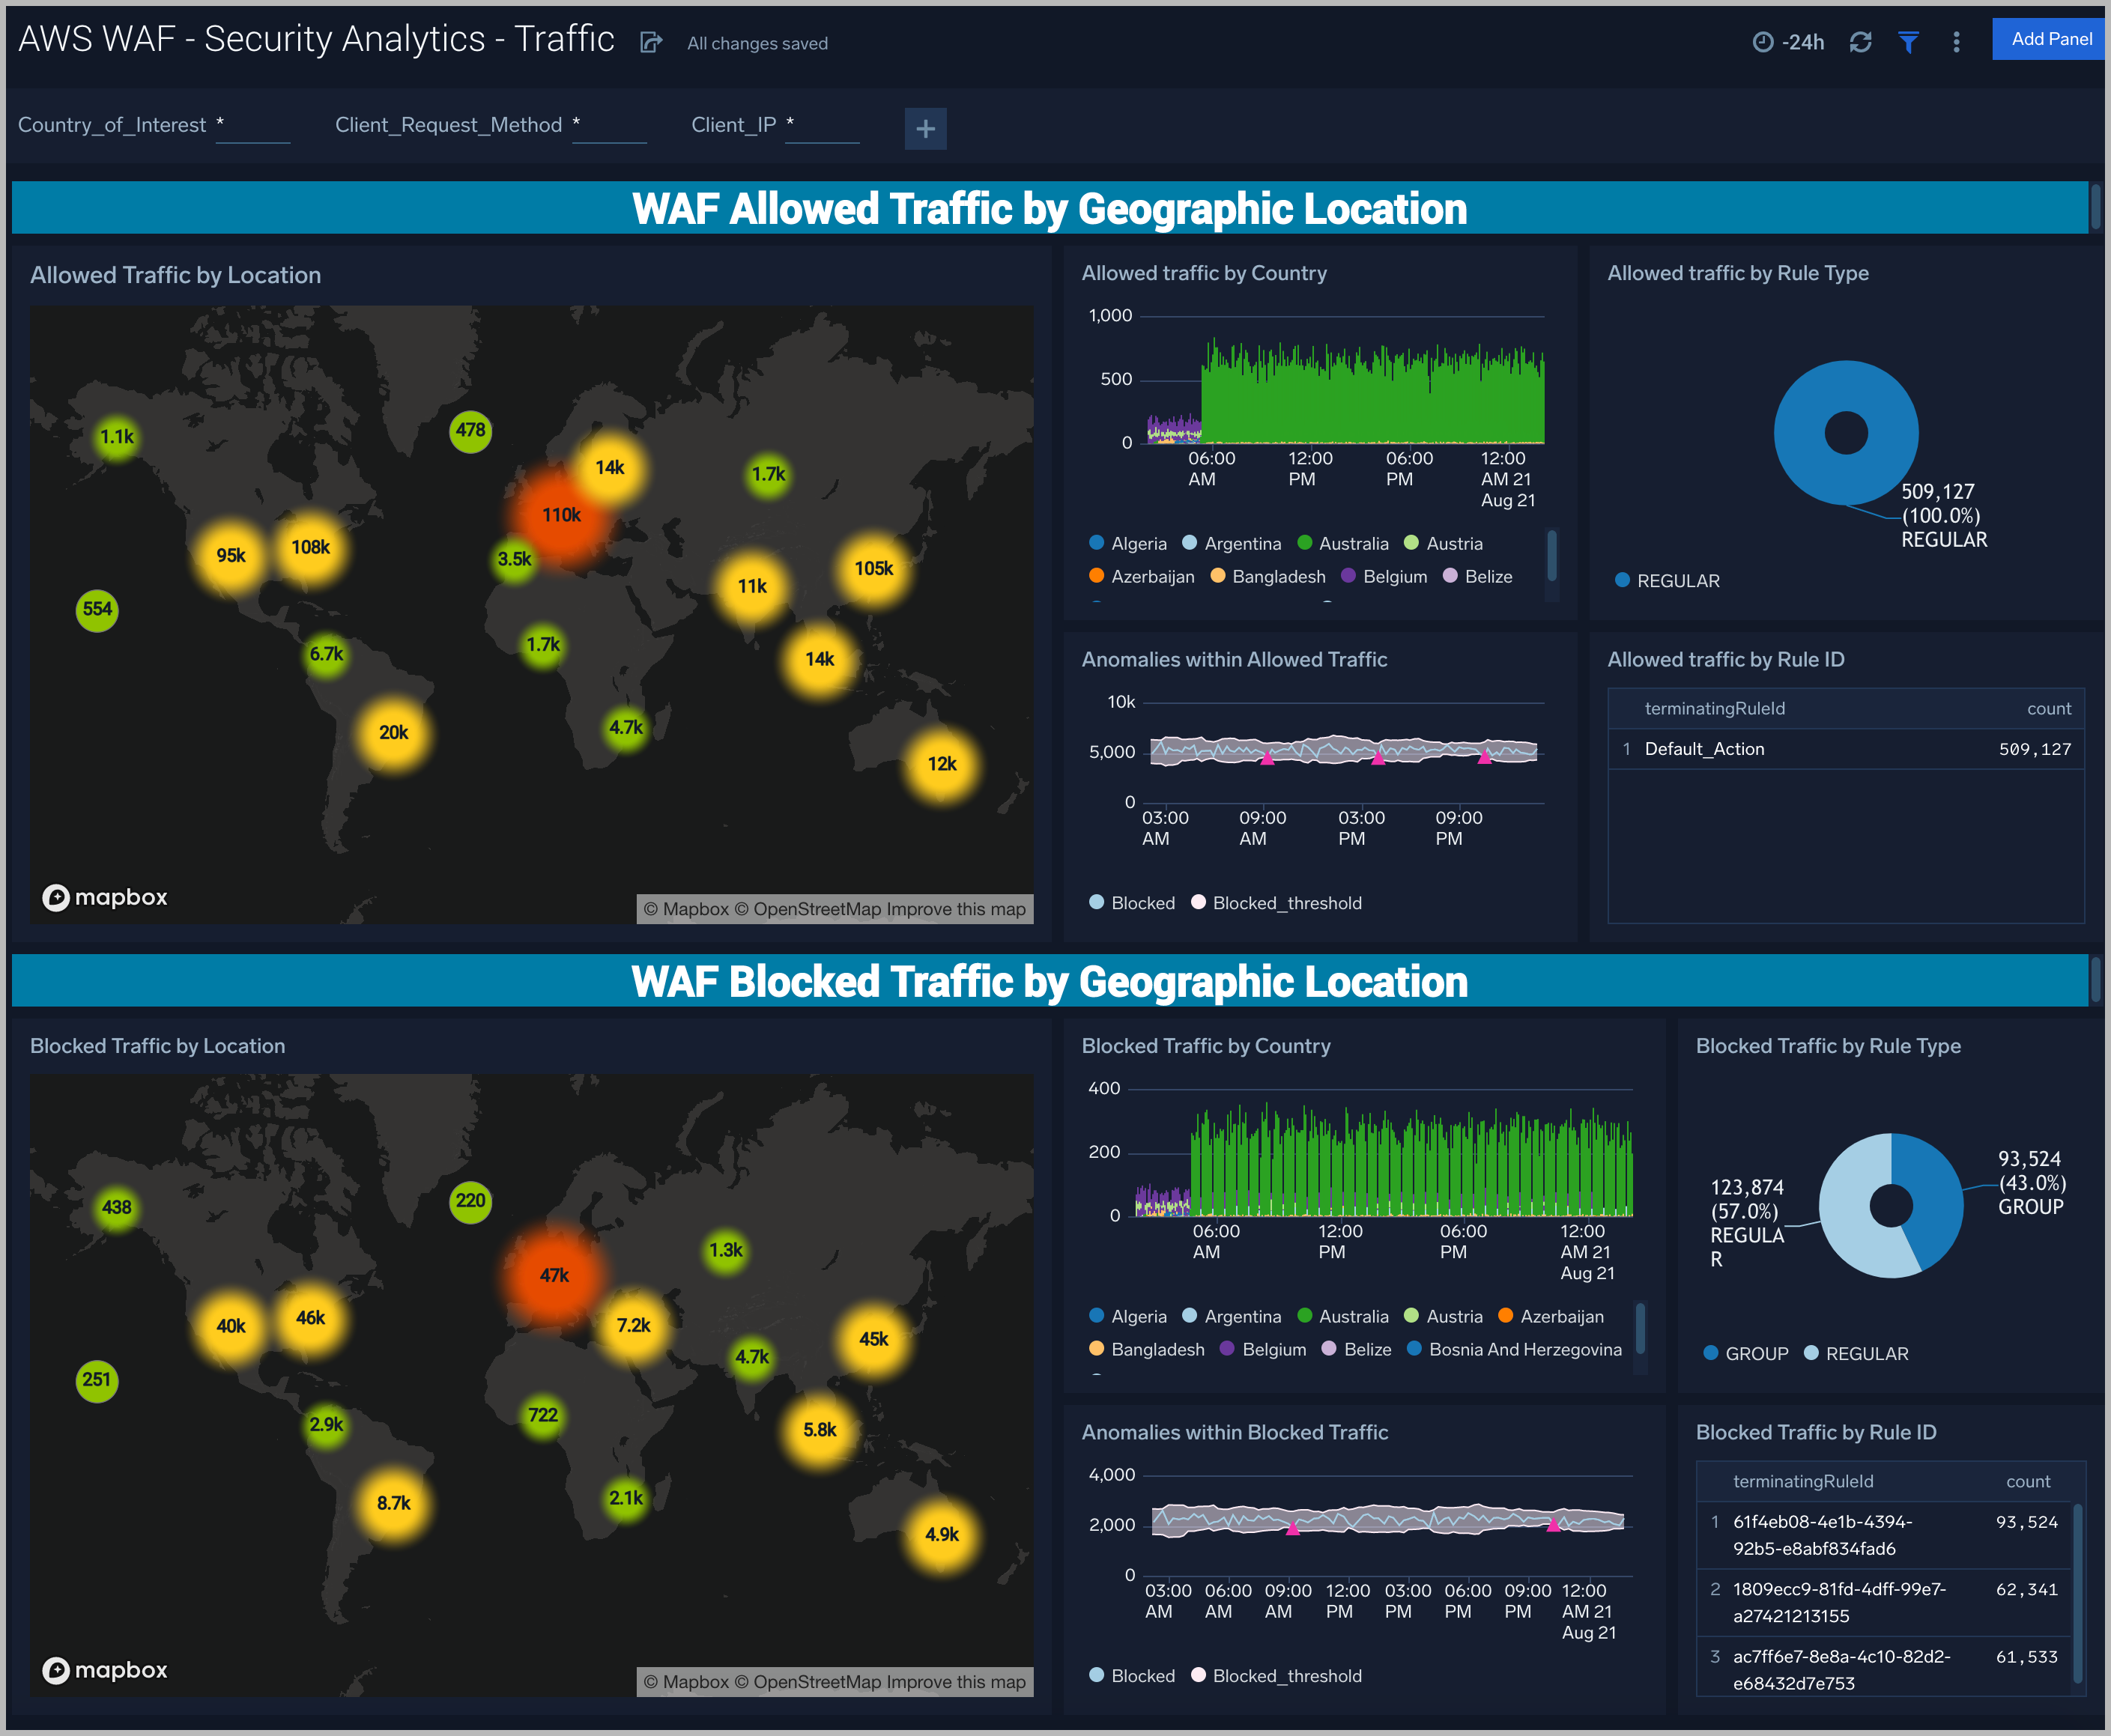
Traffic by Geographic Location. Each section contains the same panels with the only difference being traffic allowed or blocked.
Traffic by Location. Geolocation heatmap of locations. Zoom into the map for additional details of the location.
Traffic by Country. Column chart of connections by country over time. Multiple countries can be selected by clicking on one or more countries in the legend at the bottom.
Anomalies Within Traffic. Line chart of connections over time. The grey thresholds show three standard deviations based on the last ten means. Pink triangles show values outside the thresholds that represent anomalies.
Traffic by Rule Type. Donut chart of connections broken down by rule type.
Traffic by Rule ID. A table detailing rule IDs of connections sorted by frequency.
AWS WAF - Security Analytics - Threat Intelligence
See details of allowed and blocked AWS WAF traffic that matches the built-in Sumo Logic threat IP list.
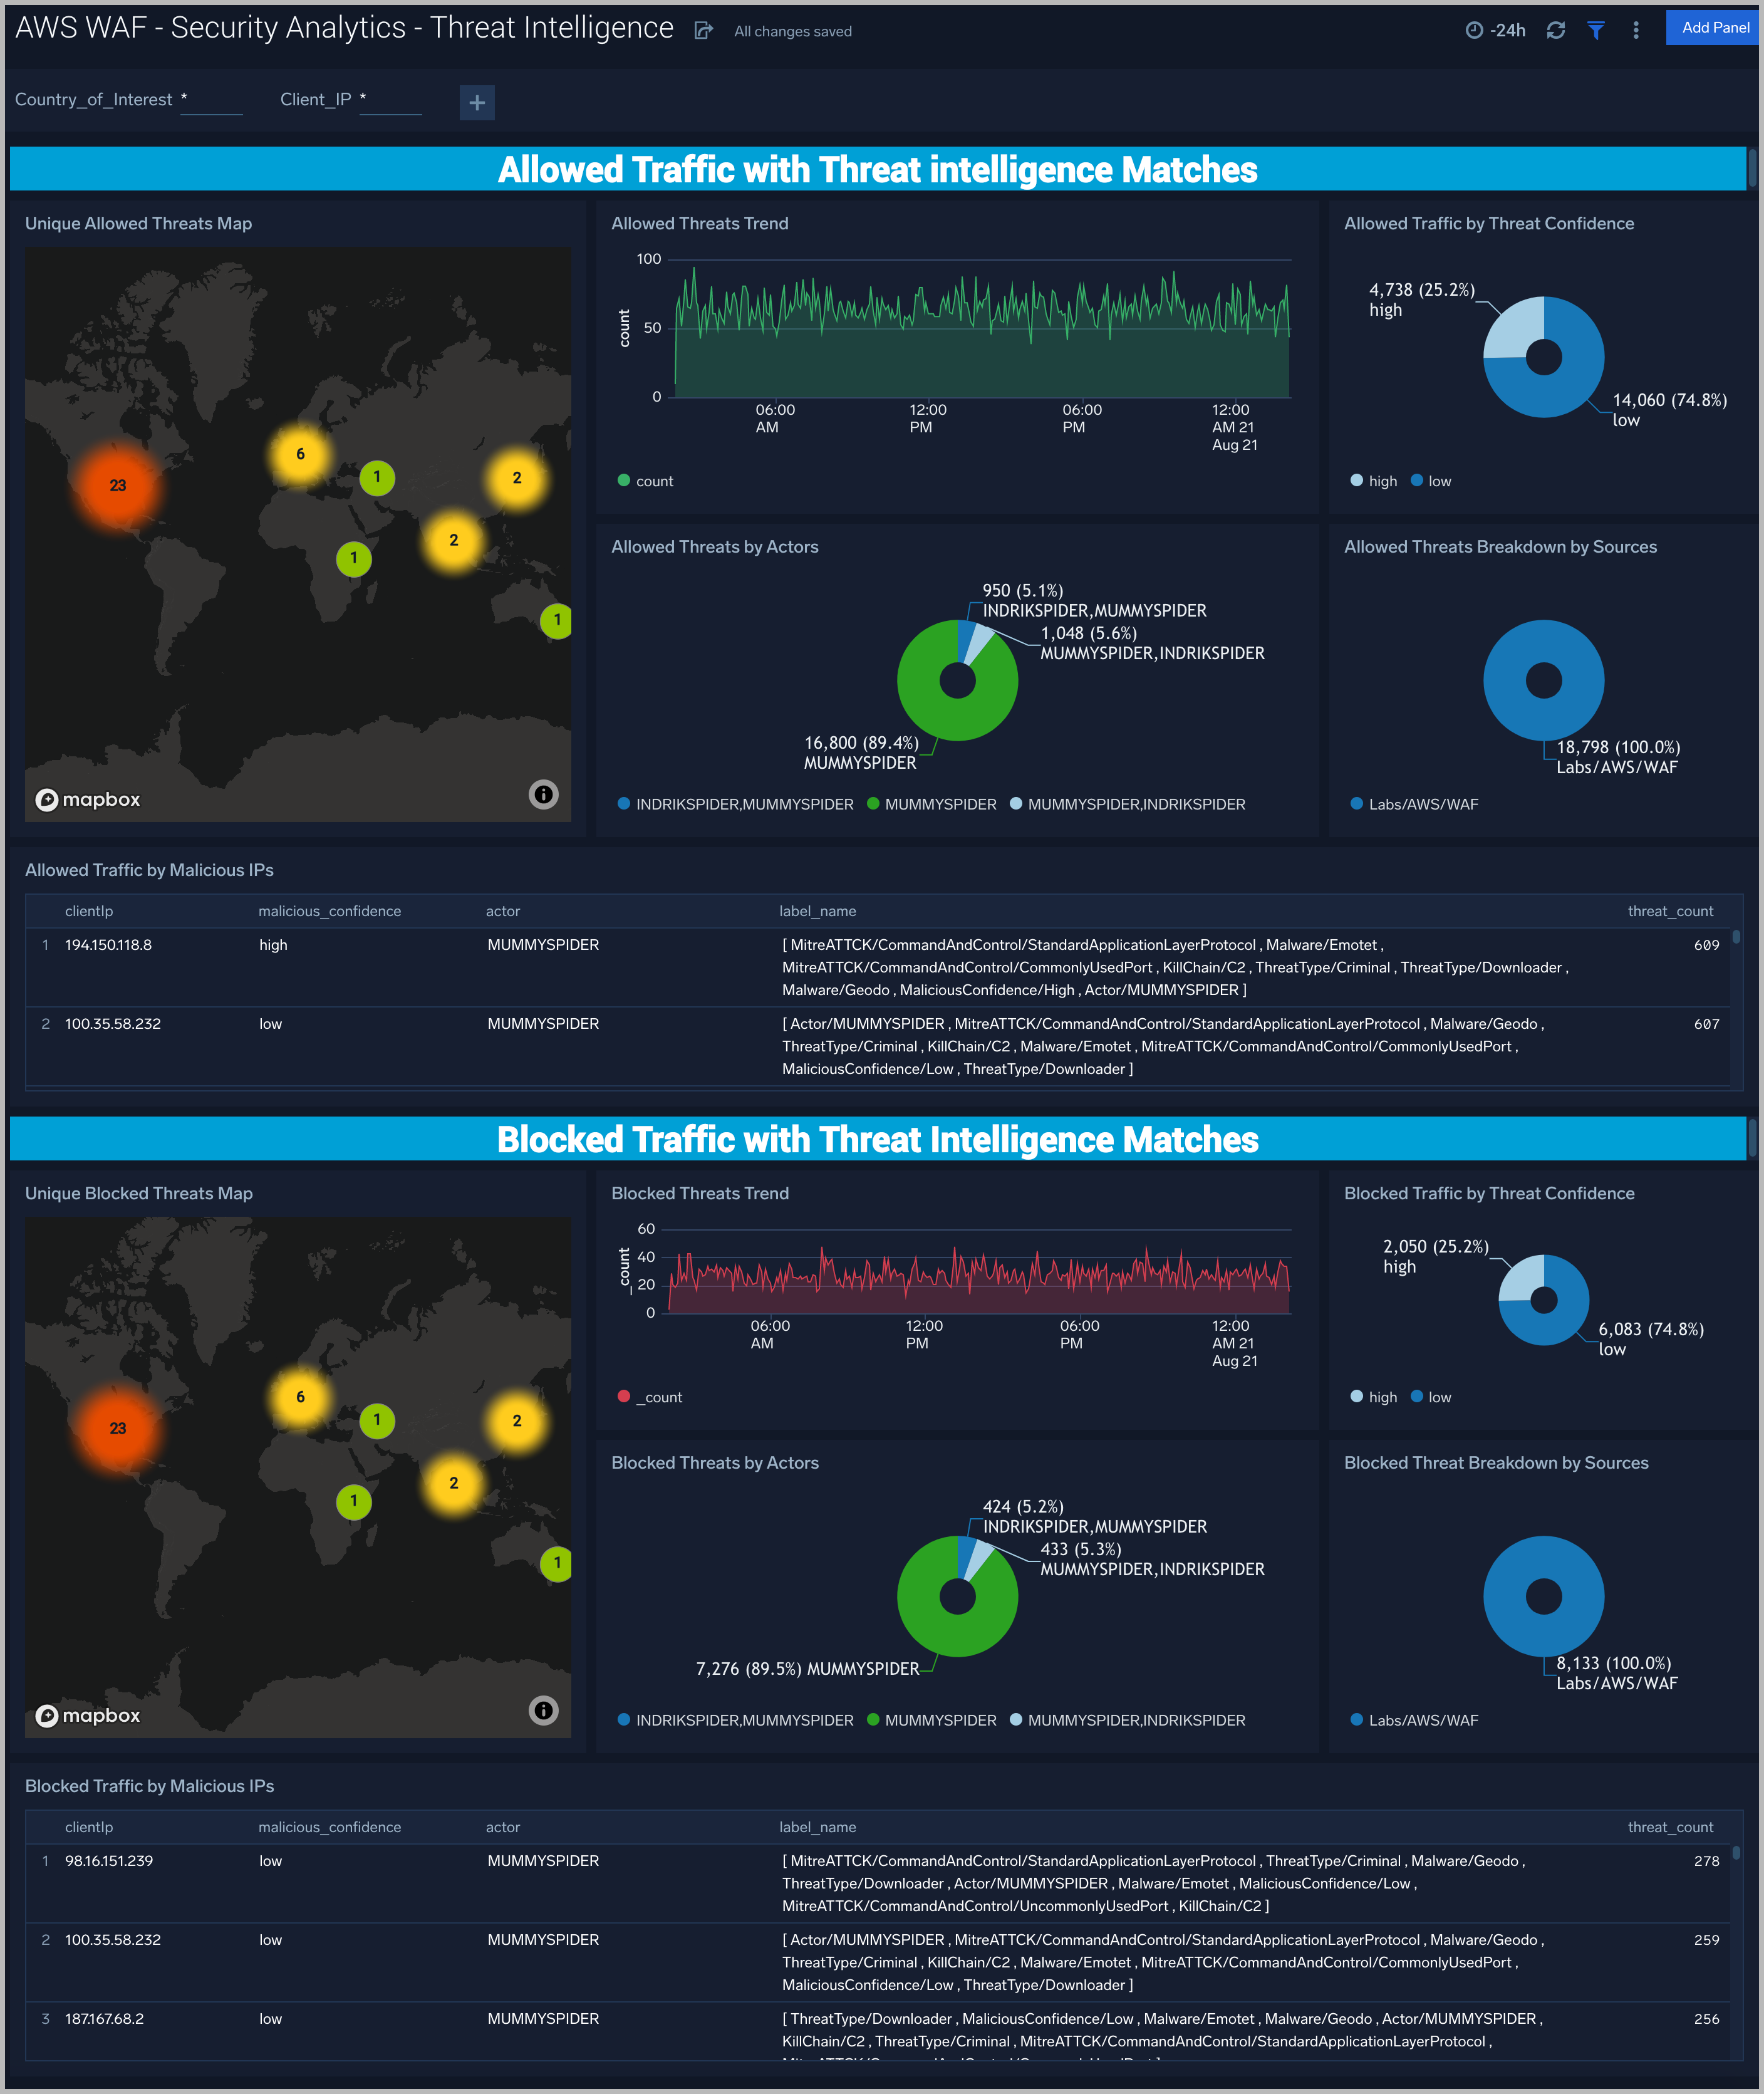
Unique Threats Map. Geolocation heatmap of connection locations.
Threats Trend. Line chart of connections over time.
Threats by Actors. Donut chart showing the ratios of connections attributed to particular threat actor groups.
Traffic by Threat Confidence. Donut chart showing the ratios of connections broken down by confidence levels.
Threat Breakdown by Sources. Donut chart showing the ratios of connections broken down by source categories.
Traffic by Malicious IPs. Table showing details of connections keyed off of remote IP address.