Palo Alto Networks 11

The Sumo Logic app for Palo Alto Networks 11 app helps you analyze traffic and understand your Palo Alto Networks environments. In addition, you can dive deeper into the data, which is broken down by threat detection indicators, malware type, and so on.
This app includes built-in monitors. For details on creating custom monitors, refer to Create monitors for Palo Alto Networks 11 app.
Log types
The Palo Alto Networks 11 app uses Traffic and Threat logs.
Sample log messages
2025-06-06*12:57:20,hcvwliycvlwivcbibib,ABC123456789,THREAT,malware,,2025-06-06T12:57:20.447Z,217.195.153.196,217.195.153.196,217.195.153.196,217.195.153.196,Block-Malware-Rule,alice,bob,Zoom,Prod-VSYS,Internal,External,eth0,eth1,Alert,,7654321,3,443,80,1000,2000,SYN ACK,TCP,block,/malicious.pdf,Trojan.Win32.Agent,Malware,cryptocurrency,outbound,12345678,D,US,UK,,application/json,PCAP1234,fedcba1749194840fedcba1749194840,AWS,42,Mozilla/5.0,PDF,217.195.153.196,http://example.com,attacker@cavgxvolhe.com,"Suspicious Activity Detected!",victim@cavgxvolhe.com,1111,DG-Level1,DG-Level2,DG-Level3,DG-Level4,Main-VSYS,Device1,,550e8400-e29b-41d4-a716-174919484000,123e4567-e89b-12d3-a456-174919484000,GET,1749194840,1749194840,654321,2025-06-06T12:57:20.447Z,IPsec,Phishing,2023.10,,3456789,22,"Accept-Language: en-US","Shopping",44d9bc99-1111-2222-3333-5555555abcde,enabled,Marketing-Team,217.195.153.196,Smartphone,Corporate,iPhone 14,Apple,iOS,16.1,alice.device.local,00:1A:2B:3C:4D:5E,Server,Production,Linux Server,Dell,Linux,Ubuntu 20.04,server01.example.com,12:57:20:78:9A:BC,container123,finance,pod_fin01,blacklist1,whitelist1,host-9876,SN-987654321,domain1,src-group,dst-group,abc123def456,2025-06-06T12:57:20.447Z,Policy Violation,Unauthorized Application Use,enhanced mMTC,Business,collaboration,client-server,2,hdidvc,Critical,Containerized,no,no,Cloud-12345,Production-Cluster1,NonProxyTraffic
2025-06-06*12:57:20 User.Info 212.83.137.150 Jun 4 12:57:20 PAN01.AWS.us-west-2b.services01.aws.local 1,2025/06/06*12:57:20,174919484043839,TRAFFIC,end,2816,2025/06/06*12:57:20,212.83.137.150,212.83.137.150,212.83.137.150,212.83.137.150,TEMP ShipX to SDC Registration via sera LBs,,,ssl,vsys1,zone_AWS_inside,zone_AWS_inside,ethernet1/1,ethernet1/1,Global SDC_Log_Forwarding,2025/06/06*12:57:20,803248,1,58916,443,0,0,0x41a,tcp,allow,8625,3060,5565,21,2025/06/06*12:57:20,101,any,,1749194840438996180,0x0,212.83.137.150-212.83.137.150,212.83.137.150-212.83.137.150,,10,11,tcp-rst-from-client,822,824,0,0,,PAN01.AWS.us-west-2b,from-policy,,,0,,0,,N/A,0,0,0,0,7dde768e-f471-4aa4-82a4-e120c11e12a3,0,0,,,,,,,,,,,,,,,,,,,,,,,,,,,,,,,,,,,2025-06-06T12:57:20.438-07:00,,,encrypted-tunnel-3,collaboration,client-server,5,"used-by-malware,able-to-transfer-file,has-known-vulnerability,tunnel-other-application,pervasive-use",,ssl-3,yes,no,0,Explicit Proxy,cluster3
Sample queries
_sourceCategory="Lab/paloalto" THREAT
| csv _raw extract 1 as f1, 2 as Receive_Time, 3 as serialNum, 4 as type, 5 as subtype, 6 as f2, 7 as LogGenerationTime, 8 as src_ip, 9 as dest_ip, 10 as NAT_src_ip, 11 as NAT_dest_ip, 12 as ruleName, 13 as src_user, 14 as dest_user, 15 as app, 16 as vsys, 17 as src_zone, 18 as dest_zone, 19 as inbound_interface, 20 as outbound_interface, 21 as LogAction, 22 as f3, 23 as SessonID, 24 as RepeatCount, 25 as src_port, 26 as dest_port, 27 as NAT_src_port, 28 as NAT_dest_port, 29 as flags, 30 as protocol, 31 as action, 32 as urlORFileName, 33 as Threat_Content_Name, 34 as category, 35 as severity, 36 as direction, 37 as seqNum, 38 as action_flags, 39 as src_country, 40 as dest_country, 41 as f4, 42 as content_type, 43 as pcap_id, 44 as filedigest, 45 as cloud, 46 as url_idx, 47 as user_agent, 48 as filetype, 49 as xff, 50 as referer, 51 as sender, 52 as subject, 53 as recipient, 54 as reportid, 55 as Device_Group_Hierarchy_l1, 56 as Device_Group_Hierarchy_l2, 57 as Device_Group_Hierarchy_l3, 58 as Device_Group_Hierarchy_l4, 59 as vsys_name, 60 as DeviceName, 61 as f5, 62 as Source_VM_UUID, 63 as Destination_VM_UUID, 64 as method, 65 as Tunnel_ID_IMSI, 66 as Monitor_Tag_IMEI, 67 as Parent_Session_ID, 68 as parent_start_time, 69 as Tunnel, 70 as thr_category, 71 as contentver, 72 as f6, 73 as SCTP_Association_ID, 74 as Payload_Protocol_ID, 75 as http_headers, 76 as URLCategoryList, 77 as UUIDforrule, 78 as HTTP2Connection, 79 as DynamicUserGroupName, 80 as XFFAddress, 81 as SourceDeviceCategory, 82 as SourceDeviceProfile, 83 as SourceDeviceModel, 84 as SourceDeviceVendor, 85 as SourceDeviceOSFamily, 86 as SourceDeviceOSVersion, 87 as SourceHostname, 88 as SourceMACAddress, 89 as DestinationDeviceCategory, 90 as DestinationDeviceProfile, 91 as DestinationDeviceModel, 92 as DestinationDeviceVendor, 93 as DestinationDeviceOSFamily, 94 as DestinationDeviceOSVersion, 95 as DestinationHostname, 96 as DestinationMACAddress, 97 as ContainerID, 98 as PODNamespace, 99 as PODName, 100 as SourceExternalDynamicList, 101 as DestinationExternalDynamicList, 102 as HostID, 103 as UserDeviceSerialNumber, 104 as DomainEDL, 105 as SourceDynamicAddressGroup, 106 as DestinationDynamicAddressGroup, 107 as PartialHash, 108 as HighResolutionTimestamp, 109 as Reason, 110 as Justification, 111 as ASliceServiceTyp, 112 as ApplicationSubcategory, 113 as ApplicationCategory, 114 as ApplicationTechnology, 115 as ApplicationRisk, 116 as ApplicationCharacteristic, 117 as ApplicationContainer, 118 as TunneledApplication, 119 as ApplicationSaaS, 120 as ApplicationSanctionedState, 121 as v1, 122 as v2, 123 as v3
| where type matches "THREAT"
| v1 as CloudReportID
| v2 as ClusterName
| v3 as FlowType

| count
_sourceCategory="Lab/paloalto" TRAFFIC
| csv _raw extract 1 as f1, 2 as Receive_Time, 3 as serialNum, 4 as type, 5 as subtype, 6 as f2, 7 as LogGenerationTime, 8 as src_ip, 9 as dest_ip, 10 as NAT_src_ip, 11 as NAT_dest_ip, 12 as ruleName, 13 as src_user, 14 as dest_user, 15 as app, 16 as vsys, 17 as src_zone, 18 as dest_zone, 19 as inbound_interface, 20 as outbound_interface, 21 as LogAction, 22 as f3, 23 as SessonID, 24 as RepeatCount, 25 as src_port, 26 as dest_port, 27 as NAT_src_port, 28 as NAT_dest_port, 29 as flags, 30 as protocol, 31 as action, 32 as bytes, 33 as bytes_sent, 34 as bytes_recv, 35 as Packets, 36 as StartTime, 37 as ElapsedTime, 38 as Category, 39 as f4, 40 as seqNum, 41 as ActionFlags, 42 as src_Country, 43 as dest_country, 44 as f5, 45 as pkts_sent, 46 as pkts_received, 47 as session_end_reason, 48 as Device_Group_Hierarchy_l1, 49 as Device_Group_Hierarchy_l2, 50 as Device_Group_Hierarchy_l3, 51 as Device_Group_Hierarchy_l4, 52 as vsys_Name, 53 as DeviceName, 54 as action_source, 55 as Source_VM_UUID, 56 as Destination_VM_UUID, 57 as Tunnel_ID_IMSI, 58 as Monitor_Tag_IMEI, 59 as Parent_Session_ID, 60 as parent_start_time, 61 as Tunnel, 62 as SCTP_Association_ID, 63 as SCTP_Chunks, 64 as SCTP_Chunks_Sent, 65 as SCTP_Chunks_Received, 66 as UUIDforrule, 67 as HTTP2Connection, 68 as AppFlapCount ,69 as PolicyID ,70 as LinkSwitches ,71 as SDWANCluster ,72 as SDWANDeviceType ,73 as SDWANClusterType ,74 as SDWANSite ,75 as DynamicUserGroupName ,76 as XFFAddress ,77 as SourceDeviceCategory ,78 as SourceDeviceProfile ,79 as SourceDeviceModel ,80 as SourceDeviceVendor ,81 as SourceDeviceOSFamily ,82 as SourceDeviceOSVersion ,83 as SourceHostname ,84 as SourceMACAddress ,85 as DestinationDeviceCategory ,86 as DestinationDeviceProfile ,87 as DestinationDeviceModel ,88 as DestinationDeviceVendor ,89 as DestinationDeviceOSFamily ,90 as DestinationDeviceOSVersion ,91 as DestinationHostname ,92 as DestinationMACAddress ,93 as ContainerID ,94 as PODNamespace ,95 as PODName ,96 as SourceExternalDynamicList ,97 as DestinationExternalDynamicList ,98 as HostID ,99 as UserDeviceSerialNumber ,100 as SourceDynamicAddressGroup ,101 as DestinationDynamicAddressGroup ,102 as SessionOwner ,103 as HighResolutionTimestamp ,104 as ASliceServiceType ,105 as ASliceDifferentiator, 106 as ApplicationSubcategory, 107 as ApplicationCategory, 108 as ApplicationTechnology, 109 as ApplicationRisk, 110 as ApplicationCharacteristic, 111 as ApplicationContainer, 112 as TunneledApplication, 113 as ApplicationSaaS, 114 as ApplicationSanctionedState, 115 as v1, 116 as v2, 117 as v3
| where type matches "TRAFFIC"
| v1 as Offloaded
| v2 as FlowType
| v3 as ClusterName

| count
Collecting logs for the Palo Alto Networks 11 app
This section provides instructions for configuring log collection for the Sumo Logic app for Palo Alto Networks 11. You must have Palo Alto Networks Web administrative user permissions to successfully complete these tasks. Configuring log collection for Palo Alto Networks 11 includes the following tasks:
Step 1. Create a hosted collector and Cloud Syslog source
In this step you configure a hosted collector with a Cloud Syslog source that will act as Syslog server to receive logs and events from Palo Alto Networks devices.
To configure a hosted collector with a Cloud Syslog source, do the following:
- Sign in to Sumo Logic and create a Hosted Collector.
- Create a Cloud Syslog Source on the hosted collector, specifying the following:
- Enter a Source Name.
- Provide a Source Category. NW/PAN/V11.
- Click Save.
- Copy the Token, host URL, and TCP TLS Port to a safe place. You will need this information in the tasks that follow.
Step 2. Define the destination for the logs
In this step you create a server profile where you can define the log destination. This will be the host name, port and protocol (TLS) of the Sumo Logic Cloud Syslog source.
To create a server profile specifying the log destination, do the following:
- Login to the Palo Alto Networks Web interface as an administrative user.
- Select Device tab > Server Profiles > Syslog.
- Click Add at the bottom of the screen and provide endpoint details and a profile name, such as Sumo_Logs_Profile01.
- In the Syslog Server Profile window, select the Servers tab and click Add.
- In the Servers window, specify the following information:
- In the Syslog Server Profile window, select the Custom Log Format tab, and use the following custom format for the following log types.
- Traffic
,$receive_time,$serial,$type,$subtype,,$time_generated,$src,$dst,$natsrc,$natdst,$rule,$srcuser,$dstuser,$app,$vsys,$from,$to,$inbound_if,$outbound_if,$logset,,$sessionid,$repeatcnt,$sport,$dport,$natsport,$natdport,$flags,$proto,$action,$bytes,$bytes_sent,$bytes_received,$packets,$start,$elapsed,$category,,$seqno,$actionflags,$srcloc,$dstloc,,$pkts_sent,$pkts_received,$session_end_reason,$dg_hier_level_1,$dg_hier_level_2,$dg_hier_level_3,$dg_hier_level_4,$vsys_name,$device_name,$action_source,$src_uuid,$dst_uuid,$tunnelid/$imsi,$monitortag/$imei,$parent_session_id,$parent_start_time,$tunnel,$assoc_id,$chunks,$chunks_sent,$chunks_received,$rule_uuid,$http2_connection,$link_change_count,$policy_id,$link_switches,$sdwan_cluster,$sdwan_device_type,$sdwan_cluster_type,$sdwan_site,$dynusergroup_name,$xff_ip,$src_category,$src_profile,$src_model,$src_vendor,$src_osfamily,$src_osversion,$src_host,$src_mac,$dst_category,$dst_profile,$dst_model,$dst_vendor,$dst_osfamily,$dst_osversion,$dst_host,$dst_mac,$container_id,$pod_namespace,$pod_name,$src_edl,$dst_edl,$hostid,$serialnumber,$src_dag,$dst_dag,$session_owner,$high_res_timestamp,$nsdsai_sst,$nsdsai_sd,$subcategory_of_app,$category_of_app,$technology_of_app,$risk_of_app,$characteristic_of_app,$container_of_app,$tunneled_app,$is_saas_of_app,$sanctioned_state_of_app,$offloaded,$flow_type,$cluster_name <Token from Step 1> - Threat
,$receive_time,$serial,$type,$subtype,,$time_generated,$src,$dst,$natsrc,$natdst,$rule,$srcuser,$dstuser,$app,$vsys,$from,$to,$inbound_if,$outbound_if,$logset,,$sessionid,$repeatcnt,$sport,$dport,$natsport,$natdport,$flags,$proto,$action,,$threatid,$category,$severity,$direction,$seqno,$actionflags,$srcloc,$dstloc,,$contenttype,$pcap_id,$filedigest,$cloud,$url_idx,$user_agent,$filetype,$xff,$referer,$sender,$subject,$recipient,$reportid,$dg_hier_level_1,$dg_hier_level_2,$dg_hier_level_3,$dg_hier_level_4,$vsys_name,$device_name,,$src_uuid,$dst_uuid,$http_method,$tunnel_id/$imsi,$monitortag/$imei,$parent_session_id,$parent_start_time,$tunnel,$thr_category,$contentver,,,,$http_headers,$url_category_list,$rule_uuid,$http2_connection,$dynusergroup_name,$xff_ip,$src_category,$src_profile,$src_model,$src_vendor,$src_osfamily,$src_osversion,$src_host,$src_mac,$dst_category,$dst_profile,$dst_model,$dst_vendor,$dst_osfamily,$dst_osversion,$dst_host,$dst_mac,$container_id,$pod_namespace,$pod_name,$src_edl,$dst_edl,$hostid,$serialnumber,,$src_dag,$dst_dag,$partial_hash,$high_res_timestamp,$reason,$justification,$nsdsai_sst,$subcategory_of_app,$category_of_app,$technology_of_app,$risk_of_app,$characteristic_of_app,$container_of_app,$tunneled_app,$is_saas_of_app,$sanctioned_state_of_app,$cloud_reportid,$cluster_name,$flow_type <Token from Step 1>
- Traffic
- Click OK.
- Commit the changes.
Step 3. Configure syslog forwarding
To configure syslog forwarding for traffic and threat logs, follow the steps to Configure Log Forwarding as described in the Palo Networks documentation.
As of March 24, 2022, some Palo Alto Network systems have experienced troubles with validating the Sumo Logic certificate due to their OCSP checking logic. If you encounter this problem, try disabling OCSP checking logic in the firewall. If you continue to have issues, contact Palo Alto’s support, and if needed, contact Sumo Logic’s support for the related Palo Alto case number. Learn more.
Step 4. Verify logs in Palo Alto Networks
In this step, you view logs using the Palo Alto Network Web interface to confirm the logs are generated on the firewall.
To verify the logs in Palo Alto Networks, do the following:
- In the Palo Alto Networks UI, select Monitor > Logs.
- Once the setup is done, sign in to Sumo Logic.
- To validate that the logs are flowing to Sumo Logic, run a query using the source category you configured during Step 1, such as:
_sourceCategory = NW/PAN/V11
Install the Palo Alto Networks 11 app
This section provides instructions for installing the Palo Alto Networks 9 app, along with examples of each of the dashboards that provide visual insights into your data.
To install the app, do the following:
Next-Gen App: To install or update the app, you must be an account administrator or a user with Manage Apps, Manage Monitors, Manage Fields, Manage Metric Rules, and Manage Collectors capabilities depending upon the different content types part of the app.
- Select App Catalog.
- In the 🔎 Search Apps field, run a search for your desired app, then select it.
- Click Install App.
note
Sometimes this button says Add Integration.
- Click Next in the Setup Data section.
- In the Configure section of your respective app, complete the following fields.
- Field Name. If you already have collectors and sources set up, select the configured metadata field name (eg _sourcecategory) or specify other custom metadata (eg: _collector) along with its metadata Field Value.
- Click Next. You will be redirected to the Preview & Done section.
Post-installation
Once your app is installed, it will appear in your Installed Apps folder, and dashboard panels will start to fill automatically.
Each panel slowly fills with data matching the time range query received since the panel was created. Results will not immediately be available but will be updated with full graphs and charts over time.
Viewing Palo Alto Networks 11 dashboards
All dashboards have a set of filters that you can apply to the entire dashboard. Use these filters to drill down and examine the data to a granular level.
- You can change the time range for a dashboard or panel by selecting a predefined interval from a drop-down list, choosing a recently used time range, or specifying custom dates and times. Learn more.
- You can use template variables to drill down and examine the data on a granular level. For more information, see Filtering Dashboards with Template Variables.
- Most Next-Gen apps allow you to provide the scope at the installation time and are comprised of a key (
_sourceCategoryby default) and a default value for this key. Based on your input, the app dashboards will be parameterized with a dashboard variable, allowing you to change the dataset queried by all panels. This eliminates the need to create multiple copies of the same dashboard with different queries.
Communication via Critical Ports
The Palo Alto Networks 9 - Communication via Critical Ports dashboard provides analytics, including trends for outbound communications via well-known ports. Also provides additional analysis of application communications attempts across the firewall. Use this dashboard to analyze daily traffic patterns in outbound volumes of traffic for the following ports: 21, 22, 23, 53, 123, 137, 138, 389, 445, and 3389.
The graph on the left compares the current day’s traffic volumes with the volumes of the same time one, two, and three days ago. The table on the right provides a sortable list of those connections. The top of the dashboard has two tables containing analytics on known and unknown application connections using the ports listed above.

Outbound Traffic and Potential Exfiltration Activity
The Palo Alto Networks 11 - Outbound Traffic and Potential Exfiltration Activity dashboard provides outbound traffic analysis, including DNS activity for potential indicators of exfiltration activity. Use this dashboard to review volumes of outbound traffic by host, by application, and time frame comparisons with last week.
Increased and unaccounted-for increase in traffic may be the result of unauthorized exfiltration of information. Additional analysis is provided for DNS traffic alone, as large amounts of DNS traffic are not part of normal operations.

Potentially Malicious Activity
The Palo Alto Networks 11 - Potentially Malicious Activity dashboard provides information about inbound and outbound traffic IP addresses called out as potentially malicious by threat intelligence, countries on the OFAC (embargoed) list, and potential port scans. Use this dashboard to analyze attempted and successful connections to IP addresses on threat intelligence lists, both inbound and outbound. Additionally, you can view connections to geolocation IP addresses associated with countries on the OFAC list (USA embargo list). Furthermore, the bottom panel provides analysis on vertical port scans (one target scanned on multiple network ports) and horizontal port scans (same port scanned across multiple destinations).

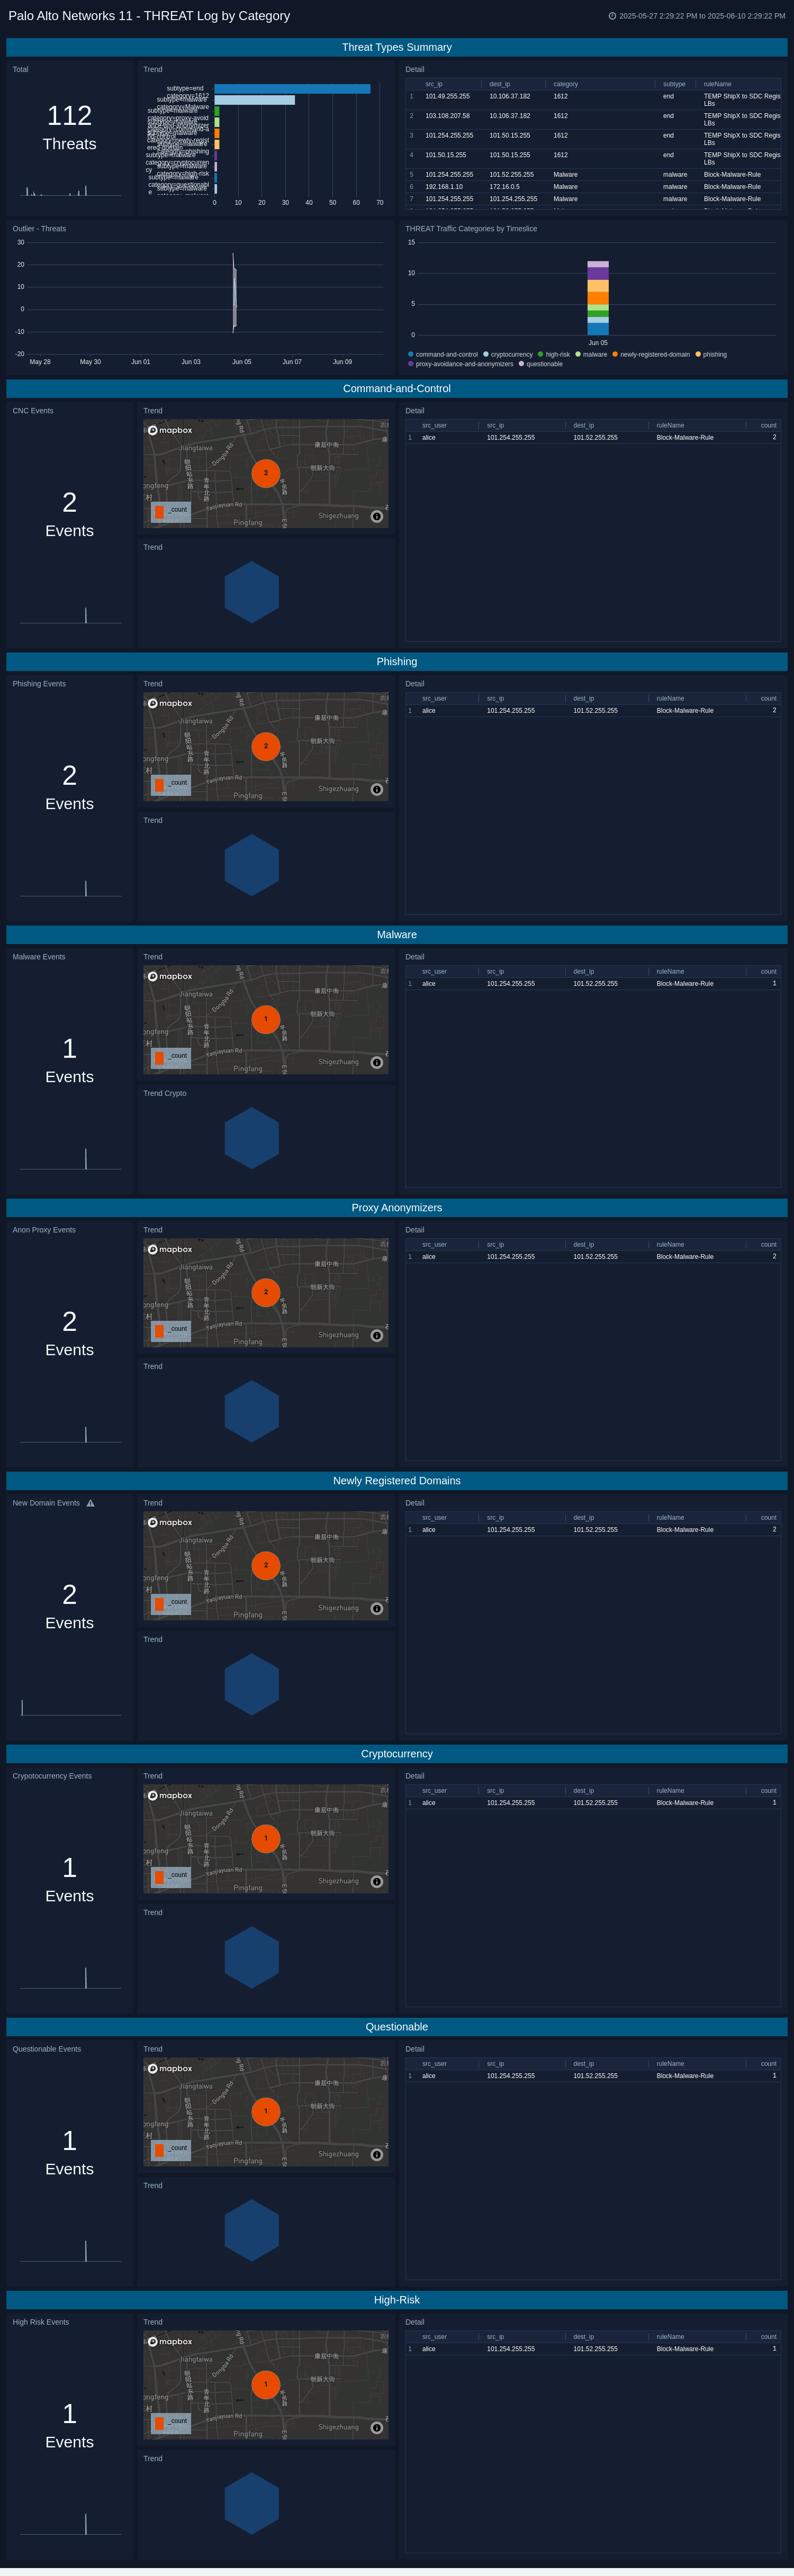
THREAT Log by Category
The Palo Alto Networks 11 - THREAT Log by Category dashboard provides analytics about the THREAT type logs provided by the firewall. These are the indications of security events detected by the firewall’s defensive measures, such as anti-malware, network intrusion detection, and the like. Use this dashboard to review THREAT events in summary or in a brkken down by category: Command-and-control, Phishing, Malware, Proxy Anonymizers, Newly Registered Domains, Cryptocurrency, Questionable, and High-Risk.
THREAT Logs by Severity
The Palo Alto Networks 11 - THREAT Logs by Severity dashboard provides analytics about the THREAT type logs provided by the firewall. These are the indications of security events detected by the firewall’s defensive measures, such as anti-malware, network intrusion detection, and the like. Use this dashboard to review THREAT events broken down by severity, allowing you to focus on the critical events first, but also providing events of lesser severity for additional triage and investigation if necessary.

TRAFFIC Log Overview
The Palo Alto Networks 11 - TRAFFIC Log Overview dashboard helps you to monitor allowed and denied traffic over time by volume and host through the firewall.

TRAFFIC Log Security
The Palo Alto Networks 11 - TRAFFIC Log Security dashboard delivers comprehensive insights into network traffic, application usage, and security alerts. It monitors traffic alert volumes, identifies top applications by usage and risk, and breaks down data by technology and SaaS status. The dashboard analyzes proxy flows, offload states, and high-risk applications while detecting tunneled apps and evasion techniques. Geo-location features track traffic to embargoed locations for compliance monitoring. This dashboard empowers IT and security teams to enhance network performance, enforce policies, mitigate risks, and improve visibility into network activity.

Threat Log Security
The Palo Alto Networks 11 - Threat Log Security dashboard provides comprehensive insights into network security by tracking threats across various application subcategories, categories, and technologies. It helps security teams prioritize risks by evaluating applications based on risk levels and compliance status. The dashboard also identifies unauthorized IT usage, tracks the flow of threats to embargoed locations, and uses geo-location data to visualize threat patterns. Real-time alerts and monitoring of high-risk applications facilitate proactive threat detection and response in both traditional and cloud-native environments.

Create monitors for Palo Alto Networks 11 app
From your App Catalog:
- From the Sumo Logic navigation, select App Catalog.
- In the Search Apps field, search for and then select your app.
- Make sure the app is installed.
- Navigate to What's Included tab and scroll down to the Monitors section.
- Click Create next to the pre-configured monitors. In the create monitors window, adjust the trigger conditions and notifications settings based on your requirements.
- Scroll down to Monitor Details.
- Under Location click on New Folder.
note
By default, monitor will be saved in the root folder. So to make the maintenance easier, create a new folder in the location of your choice.
- Enter Folder Name. Folder Description is optional.
tip
Using app version in the folder name will be helpful to determine the versioning for future updates.
- Click Create. Once the folder is created, click on Save.
Palo Alto Networks 11 alerts
| Name | Description | Trigger Type (Critical / Warning / MissingData) | Alert Condition |
|---|---|---|---|
Palo Alto Networks 11 - Monitor High-Risk Applications for Threat Logs | This alert is triggered when a high risk application for threat log is detected, helping security team track their usage and spot any anomalous behavior. By analyzing traffic patterns, this aids in proactive threat mitigation and ensures compliance with security policies. | Critical | Count > 0 |
Palo Alto Networks 11 - Monitor High-Risk Applications for Traffic Logs | This alert is triggered when a threat is detected in high risk application by analyzing traffic logs. It helps network team track application usage patterns and identify unusual real-time behavior. By monitoring traffic flows, this aids in optimizing network performance and ensuring adherence to security policies, thereby reducing potential risks and maintaining efficient operations. | Critical | Count > 1 |
Palo Alto Networks 11 - Detect Unauthorized or Shadow IT Usage for Traffic Logs | This alert is triggered when an unauthorized or shadow IT activity is detected by surveying the network traffic. By examining traffic logs, this detects unsanctioned applications that bypass formal approval processes, helping the IT team manage these applications effectively. This ensures that such applications do not disrupt network performance or compromise compliance standards, safeguarding the organization's network environment. | Critical | Count > 0 |
Palo Alto Networks 11 - Detect Unauthorized or Shadow IT Usage for Threat Logs | This alert is triggered when an unauthorized or shadow IT activity that may introduce security threats into the network is detected. By analyzing threat logs, this identifies unsanctioned applications that could potentially exploit vulnerabilities or bypass security controls. This vigilance helps security teams proactively mitigate risks, maintain network integrity, and ensure compliance with regulatory requirements. | Critical | Count > 0 |
Palo Alto Networks 11 - Detect Tunneled Applications & Evasion Attempts | This alert is triggered if applications use tunneling techniques to bypass security controls, as well as any evasion attempts are detected. This strengthens security measures by revealing hidden threats and ensuring transparent network operations. | Critical | Count > 0 |
Palo Alto Networks 11 - Alert on Traffic to Embargoed Locations | This alert is triggered when traffic directed towards embargoed or restricted locations is identified. It supports regulatory compliance and reduces the risk of inadvertently communicating with prohibited regions. | Critical | Count > 0 |
Palo Alto Networks 11 - Alert on Threats to Embargoed Locations | This alert is triggered when a potential threat targeting embargoed locations within your network is identified. It enhances protection for sensitive areas and helps maintain compliance with international and organizational policies regarding restricted locations. | Critical | Count > 0 |
Upgrade/Downgrade the Palo Alto Networks 11 app (Optional)
To update the app, do the following:
Next-Gen App: To install or update the app, you must be an account administrator or a user with Manage Apps, Manage Monitors, Manage Fields, Manage Metric Rules, and Manage Collectors capabilities depending upon the different content types part of the app.
- Select App Catalog.
- In the Search Apps field, search for and then select your app.
Optionally, you can identify apps that can be upgraded in the Upgrade available section. - To upgrade the app, select Upgrade from the Manage dropdown.
- If the upgrade does not have any configuration or property changes, you will be redirected to the Preview & Done section.
- If the upgrade has any configuration or property changes, you will be redirected to the Setup Data page.
- In the Configure section of your respective app, complete the following fields.
- Field Name. If you already have collectors and sources set up, select the configured metadata field name (eg _sourcecategory) or specify other custom metadata (eg: _collector) along with its metadata Field Value.
- Click Next. You will be redirected to the Preview & Done section.
Post-update
Your upgraded app will be installed in the Installed Apps folder and dashboard panels will start to fill automatically.
See our Release Notes changelog for new updates in the app.
To revert the app to a previous version, do the following:
- Select App Catalog.
- In the Search Apps field, search for and then select your app.
- To version down the app, select Revert to < previous version of your app > from the Manage dropdown.
Uninstalling the Palo Alto Networks 11 app (Optional)
To uninstall the app, do the following:
- Select App Catalog.
- In the 🔎 Search Apps field, run a search for your desired app, then select it.
- Click Uninstall.
Troubleshooting
- If you have any issue with Cloud Syslog collection, refer to the Cloud Source Troubleshooting.
- If you are successfully ingesting the logs and if you are unable to see any data in the app dashboards, then ensure Traffic and Threat fields are in accordance with Palo Alto Networks 11 log format as configured in the Step 2 of Collection Logs for Palo Alto.
- If you have trouble with validating the Sumo Logic certificate due to their OCSP checking logic, try disabling OCSP checking logic in the firewall. If you continue to have issues, contact Palo Alto’s support, and if needed, contact Sumo Logic’s support for the related Palo Alto case number. Learn more.