Docker Community Edition
The Docker app will be fully functional with Docker setup using cgroup v1.
The Sumo Logic app for Docker Community Edition (CE) provides operational insight into your Docker containers. This app includes dashboards that allow you to view your container performance statistics for CPU, memory, and the network. It also provides visibility into container events such as start, stop, and other important commands.
Log types
This Docker app monitors Docker container logs and metrics (stats) in log format only.
If your system handles metrics, use the Sumo Logic app for Docker ULM.
Sample log messages
{
	"status":"start",
	"id":"10adec58fa15202e06afef7b1b0b3b1464962a115ff56918444c3f22867d3f3b",
	"from":"hello-world",
	"time":1485975967
}
{
	"status":"create",
	"id":"045599bc4d589264658f5f7f4efa3f1e3af9088ba1f7383a160cf344e1055d46",
	"from":"ubuntu",
	"time":1485966852
}
Docker stats message (click to expand)
{
	"read":"2017-02-01T19:36:48.777487188Z",
	"network":{
		"rx_bytes":87977,
		"rx_dropped":0,
		"rx_errors":0,
		"rx_packets":252,
		"tx_bytes":146194,
		"tx_dropped":0,
		"tx_errors":0,
		"tx_packets":302
	},
	"cpu_stats":{
		"cpu_usage":{
			"percpu_usage":[
				9469809313
			],
			"total_usage":9469809313,
			"usage_in_kernelmode":1050000000,
			"usage_in_usermode":8410000000
		},
		"system_cpu_usage":2496992710000000,
		"throttling_data":{
			"periods":0,
			"throttled_periods":0,
			"throttled_time":0
		}
	},
	"blkio_stats":{
		"io_merged_recursive":[
		],
		"io_queue_recursive":[
		],
		"io_service_bytes_recursive":[
		],
		"io_service_time_recursive":[
		],
		"io_serviced_recursive":[
		],
		"io_time_recursive":[
		],
		"io_wait_time_recursive":[
		],
		"sectors_recursive":[
		]
	},
	"memory_stats":{
		"limit":1033252864,
		"max_usage":202858496,
		"stats":{
			"active_anon":86831104,
			"active_file":13131776,
			"cache":24981504,
			"dirty":36864,
			"hierarchical_memory_limit":9223372036854771712,
			"inactive_anon":86786048,
			"inactive_file":11849728,
			"mapped_file":6430720,
			"pgfault":63351,
			"pgmajfault":146,
			"pgpgin":68526,
			"pgpgout":20040,
			"rss":173617152,
			"rss_huge":0,
			"total_active_anon":86831104,
			"total_active_file":13131776,
			"total_cache":24981504,
			"total_dirty":36864,
			"total_inactive_anon":86786048,
			"total_inactive_file":11849728,
			"total_mapped_file":6430720,
			"total_pgfault":63351,
			"total_pgmajfault":146,
			"total_pgpgin":68526,
			"total_pgpgout":20040,
			"total_rss":173617152,
			"total_rss_huge":0,
			"total_unevictable":0,
			"total_writeback":0,
			"unevictable":0,
			"writeback":0
		},
		"usage":201818112
	}
}
Sample queries
_sourceCategory=docker  ("\"status\":\"create\"" or "\"status\":\"start\"")  id from
| parse "\"status\":\"*\"" as status, "\"id\":\"*\"" as container_id, "\"from\":\"*\"" as image
| count_distinct(container_id)
Collecting Data from Docker Containers
There are several ways you can use Sumo with Docker:
- Use Sumo Collector's Docker sources for logs and stats. With this option, you can deploy a containers collector, or use an installed collector:
- Containerized collector — Run a Docker container with a Sumo collector and the Sumo Docker log and Docker stats sources on each Docker host. This approach enables you to collect Docker container logs, events, and stats, and supports the Sumo app for Docker. This approach is good if you prefer to deploy the collector in a container. For more information, see https://github.com/SumoLogic/sumologic-collector-docker.
- Installed Collector with Docker log and stats Sources—Collect data from Docker using an installed collector and Sumo’s Docker log source and Docker stats source. This approach enables you to collect Docker container logs, events, and stats, and supports the Sumo app for Docker. For more information, see Collecting Logs and Stats from Docker.
- Use Sumo Docker logging driver plugin—Use the Sumo logging driver plugin to send Docker container logs to Sumo. Once your log data is in Sumo, you can use the Sumo web app to search and analyze your log data. This is a good option if you do not want to run a collector on your Docker hosts. The plugin is Sumo-supported. For more information, see https://github.com/SumoLogic/sumologic-docker-logging-driver.
Sumo’s Docker logs source and Docker stats source use the Docker Engine API to gather the following data from Docker:
- Docker container logs. Sumo’s Docker logs source collects container logs. For information about the API Sumo uses to collect logs, see the “Get Container Logs” topic in Docker API documentation.
- Docker engine events. Sumo’s Dockers log source collect Docker events. For information about Docker events, see the “Monitor Events” in Docker API documentation.
- Docker container stats. Sumo’s Docker stats source collects stats. For information about Docker stats, see the ”Get Container Stats Based on Resource Usage” topic in Docker API documentation.
By default, you can monitor up to 40 Docker containers on a Docker host. If you want to monitor more than 40 containers on a given host you can configure a larger number in collector.properties. The procedures below explain how. We don’t support monitoring more than 100 containers on a Docker host.
Collecting logs and metrics from Docker
Sumo supports multiple methods of collecting data from Docker. This procedure describes how to collect data from Docker using an installed collector and Sumo’s Docker logs source and Docker stats source.
The sections below provide instructions for installing a collector on a Docker host, setting up both Sumo Docker sources (log source and stats source), and installing the Sumo app for Docker. With this configuration you can collect Docker logs, events, and stats, and visualize resource performance and event data in the dashboards provided by the app.
With the method described in this topic you can collect Docker logs, stats, and events and view summaries of the data collected using the Sumo app for Docker.
Windows operating systems are not supported.
Prerequisites
- The containers you’re going to monitor must use either the
json-fileor thejournalddriver. For more information, see Configure Logging Drivers in Docker help. - The Docker Log Source uses timestamps from logs to track collection. You need to ensure your log format has a well-defined timestamp so the Source can detect it properly. If there are issues with timestamp detection and the Docker container is restarted the Source will reingest all log data since there are no timestamps to track.
Step 1: Create access keys
Follow the instructions in Access Keys to create a Sumo access ID and key. You’ll need to supply them when you set up a collector on your Docker host in the following step.
Step 2: Install collector on each Docker host
Follow the instructions for the operating system of the host where you will install the collector:
Step 3: Configure Docker log source
- Classic UI. In the main Sumo Logic menu, select Manage Data > Collection > Collection.
New UI. In the Sumo Logic top menu select Configuration, and then under Data Collection select Collection. You can also click the Go To... menu at the top of the screen and select Collection. - Navigate to the collector you installed on the Docker host, and select Add > Add Source.
- Select Docker Logs. The Docker Logs page appears.
- Configure the source fields:
- Name. (Required).
- Description. (Optional).
- URI. Enter the URI of the Docker daemon.
- If your collector runs on the same host as the Docker containers it will monitor, enter the non-networked Unix socket:
unix:///var/run/docker.sock- If your collector runs on a different machine than the Docker host, you can determine its URI from a Docker environment variable. Run the
docker-machinecommand to find the Docker environment variables.
$ docker-machine env machine-name- Take the value of the
DOCKER_HOSTvariable, change "tcp" to "https", and enter that value as the URI. For example,https://192.168.99.100:2376. For example:
$ docker-machine env default
export DOCKER_TLS_VERIFY="1"
export DOCKER_HOST="tcp://192.168.99.100:2376"
export DOCKER_CERT_PATH="/Users/sumo/.docker/machine/machines/default"
export DOCKER_MACHINE_NAME="default"
# Run this command to configure your shell:
# eval "$(docker-machine env default)" - Cert Path. (Required for remote access only) Enter the path to the certificate files on the local machine where the collector runs. In the example above, the cert path is:
/Users/sumo/.docker/machine/machines/default. - Collect From and Container Filters. If you want to collect from all containers, click the All Containers radio button. If you want to collect from selected containers, click the Specified Container Filters radio button, and specify filter expressions in the Container Filters field. For information about how to define container filters, see More about defining container filters below.
- By default, you can collect from up to 40 containers. To increase the limit, stop the Collector service, edit the
collector.propertiesfile (in theconfigsubdirectory of the collector installation directory), and add thedocker.maxPerContainerConnectionsproperty. The maximum supported value is 100. Then start the Collector service. See collector.properties for details on modifying this configuration file.
- By default, you can collect from up to 40 containers. To increase the limit, stop the Collector service, edit the
- Source Host. Enter the hostname or IP address of the source host. If not specified, it’s assumed that the host is the machine where Docker is running. The hostname can be a maximum of 128 characters. If desired, you can use Docker variables to construct the Source Host value. For more information, see Configure sourceCategory and sourceHost using variables.
- Source Category. (Required) Enter the Sumo source category (such as
prod/web/docker/logs). The source category metadata field is a fundamental building block to organize and label sources. For more information, see Metadata Naming Conventions and our Best Practices: Good Source Category, Bad Source Category. If desired, you can use Docker variables to construct the Source Category value. For more information, see Configure sourceCategory and sourceHost using variables.
- Configure the Advanced options.
- Enable Timestamp Parsing. This option is checked by default and required. See Prerequisites for details.
- Time Zone. Default is “Use time zone from log file”.
- Timestamp Format. Default is “Automatically detect the format”.
- Encoding. Default is “UTF-8”.
- Enable Multiline Processing.
- Detect messages spanning multiple lines. This option is checked by default.
- Infer Boundaries. This option is checked by default.
- Boundary Regex. If multiple processing is enabled, and Infer Boundaries is disabled, enter a regular expression for message boundaries.
- Configure processing rules. For more information, see Processing Rules.
Step 4: Add a Docker stats source
- Classic UI. In the main Sumo Logic menu, select Manage Data > Collection > Collection.
New UI. In the Sumo Logic top menu select Configuration, and then under Data Collection select Collection. You can also click the Go To... menu at the top of the screen and select Collection. - Navigate to the collector you installed on the Docker host, and select Add > Add Source.
- Select Docker Stats, then for Content Type select Logs (JSON) to collect data as JSON logs.
- Configure the following source fields:
- Name. (Required)
- Description. (Optional)
- URI. Enter the URI of the Docker daemon.
- If your collector runs on the same host as the Docker containers it will monitor, enter the non-networked Unix socket:
unix:///var/run/docker.sock - If your collector runs on a different machine than the Docker host, you can determine its URI from a Docker environment variable. Run the
docker-machinecommand to find the Docker environment variables. The command's syntax is:For example,$ docker-machine env machine-nameTake the value of the$ docker-machine env default \
export DOCKER_TLS_VERIFY="1" \
export DOCKER_HOST="tcp://192.168.99.100:2376" \
export DOCKER_CERT_PATH="/Users/sumo/.docker/machine/machines/default" \
export DOCKER_MACHINE_NAME="default" \
# Run this command to configure your shell: \
# eval "$(docker-machine env default)"DOCKER_HOSTvariable, change "tcp" to "https", and enter that value as the URI. For example,https://192.168.99.100:2376.
- If your collector runs on the same host as the Docker containers it will monitor, enter the non-networked Unix socket:
- Cert Path. (Required for remote access only) Enter the path to the certificate files on the local machine where the collector runs. In the example above, the cert path is:
/Users/sumo/.docker/machine/machines/default. - Collect From and Container Filters. If you want to collect from all containers, click the All Containers radio button. If you want to collect from selected containers, click the Specified Container Filters radio button, and specify filter expressions in the Container Filters field. For information about how to define container filters, see More about defining container filters.
- By default, you can collect from up to 40 containers. To increase the limit, stop the Collector service, edit the
collector.propertiesfile (in theconfigsubdirectory of the collector installation directory), and add thedocker.maxPerContainerConnectionsproperty. The maximum supported value is 100. Then start the Collector service. See collector.properties for details on modifying this configuration file.
- By default, you can collect from up to 40 containers. To increase the limit, stop the Collector service, edit the
- Source Host. Enter the hostname or IP address of the source host. If not specified, it’s assumed that the host is the machine where Docker is running. The hostname can be a maximum of 128 characters. If desired, you can use Docker variables to construct the Source Host value. For more information, see Configure sourceCategory and sourceHost using variables.
- Source Category. (Required) Enter the Sumo source category (such as
prod/web/docker/logs). If desired, you can use Docker variables to construct the Source Host value. For more information, see Configure sourceCategory and sourceHost using variables. - Scan Interval. This option sets how often the source is scanned. Setting a shorter frequency increases message volume, and can cause your deployment to incur additional charges. The minimum acceptable scan interval is 1 second.
Step 5: Install Sumo app for Docker
The Sumo app for Docker provides operational insight into your Docker containers. The app includes Dashboards that allow you to view your container performance statistics for CPU, memory, and the network. It also provides visibility into container events such as start, stop, and other important commands.
For installation instructions, see Install the Docker app.
Step 6: Run searches and use dashboards
At this point, Sumo should be receiving Docker data. For an example of logs collected from Docker, see Sample Docker log messages. For an example query, see Sample queries - Containers created or started.
For information about the dashboards provided by the Sumo app for Docker, see Docker app Dashboards.
Defining Container Filters
In the Container Filter field, you can enter a comma-separated list of one or more of the following types of filters:
- A specific container name, for example,
my-container - A wildcard filter, for example,
my-container-* - An exclusion (denylist) filter, which begins with an exclamation mark, for example,
!master-containeror!prod-*
For example, this filter list will cause the source to collect from all containers whose names start with prod-, except those that match prod-*-mysql. It will also collect from containers with names that match master-*-app-*, and from the sumologic-collector container:
prod-*, !prod-*-mysql, master-*-app-*, sumologic-collector
If your filter list contains only exclusions, the source will collect all containers except from those that match your exclusion filters. In the example below, it will cause the source to exclude containers whose names begin with container123 and prod-.
!container123*, !prod-*
Configure sourceCategory and sourceHost using variables
In collector version 19.216-22 and later, when you configure the sourceCategory and sourceHost for a Docker Log Source or a Docker Stats Source, you can specify the value using variables available from Docker and its host.
You build templates for sourceCategory and sourceHost specifying component variables in this form: {{NAMESPACE.VAR_NAME}}.
Where:
NAMESPACEis a namespace that indicates the variable type.VAR_NAMEis the variable name. These are case-sensitive.
The table below defines the types of variables you can use.
Docker engine events log data doesn't support the tagging with metadata.
Namespace/VAR_TYPE: container
Description: Container metadata fields provided by Docker for use in the --log-opt tag option. These are automatically added to data points. For more information, see Log tags for logging driver in Docker help.
VAR_NAME:
- ID — The first 12 characters of the container ID.
- FullID —The full container ID.
- Name —The container name.
- ImageID —The first 12 characters of the container’s image ID.
- ImageFullID — The container’s full image ID.
- ImageName — The name of the image used by the container.
Namespace/VAR_TYPE: label
Description: User-defined labels, supplied with the --label flag when starting a Docker container. This is automatically added to data points.
VAR_NAME: The name of the variable. Dot characters (.) are not supported.
Namespace/VAR_TYPE: env
Description: User-defined container environment variables that are set with --env|-e flags when starting a container.
VAR_NAME: The name of the variable. Dot characters (.) are not supported.
For example:
{{container.ID}}
You can use multiple variables, for example:
{{container.ID}}-{{label.label_name}}-{{env.var_name}}
You can incorporate text in the metadata expression, for example:
ID-{{container.ID}}-AnyTextYouWant{{label.label_name}}
The example above uses a hyphen - character to separate variable components. Separator characters are not required. Curly brackets and spaces are not allowed. Underscores and hyphens are recommended.
If a user-defined variable doesn’t exist, that portion of the metadata field will be blank.
Installing the Docker CE app
To install the app, do the following:
Next-Gen App: To install or update the app, you must be an account administrator or a user with Manage Apps, Manage Monitors, Manage Fields, Manage Metric Rules, and Manage Collectors capabilities depending upon the different content types part of the app.
- Select App Catalog.
- In the 🔎 Search Apps field, run a search for your desired app, then select it.
- Click Install App.
note
Sometimes this button says Add Integration.
- Click Next in the Setup Data section.
- In the Configure section of your respective app, complete the following fields.
- Field Name. If you already have collectors and sources set up, select the configured metadata field name (eg _sourcecategory) or specify other custom metadata (eg: _collector) along with its metadata Field Value.
- Click Next. You will be redirected to the Preview & Done section.
Post-installation
Once your app is installed, it will appear in your Installed Apps folder, and dashboard panels will start to fill automatically.
Each panel slowly fills with data matching the time range query received since the panel was created. Results will not immediately be available but will be updated with full graphs and charts over time.
Viewing Docker CE dashboards
All dashboards have a set of filters that you can apply to the entire dashboard. Use these filters to drill down and examine the data to a granular level.
- You can change the time range for a dashboard or panel by selecting a predefined interval from a drop-down list, choosing a recently used time range, or specifying custom dates and times. Learn more.
- You can use template variables to drill down and examine the data on a granular level. For more information, see Filtering Dashboards with Template Variables.
- Most Next-Gen apps allow you to provide the scope at the installation time and are comprised of a key (
_sourceCategoryby default) and a default value for this key. Based on your input, the app dashboards will be parameterized with a dashboard variable, allowing you to change the dataset queried by all panels. This eliminates the need to create multiple copies of the same dashboard with different queries.
Overview
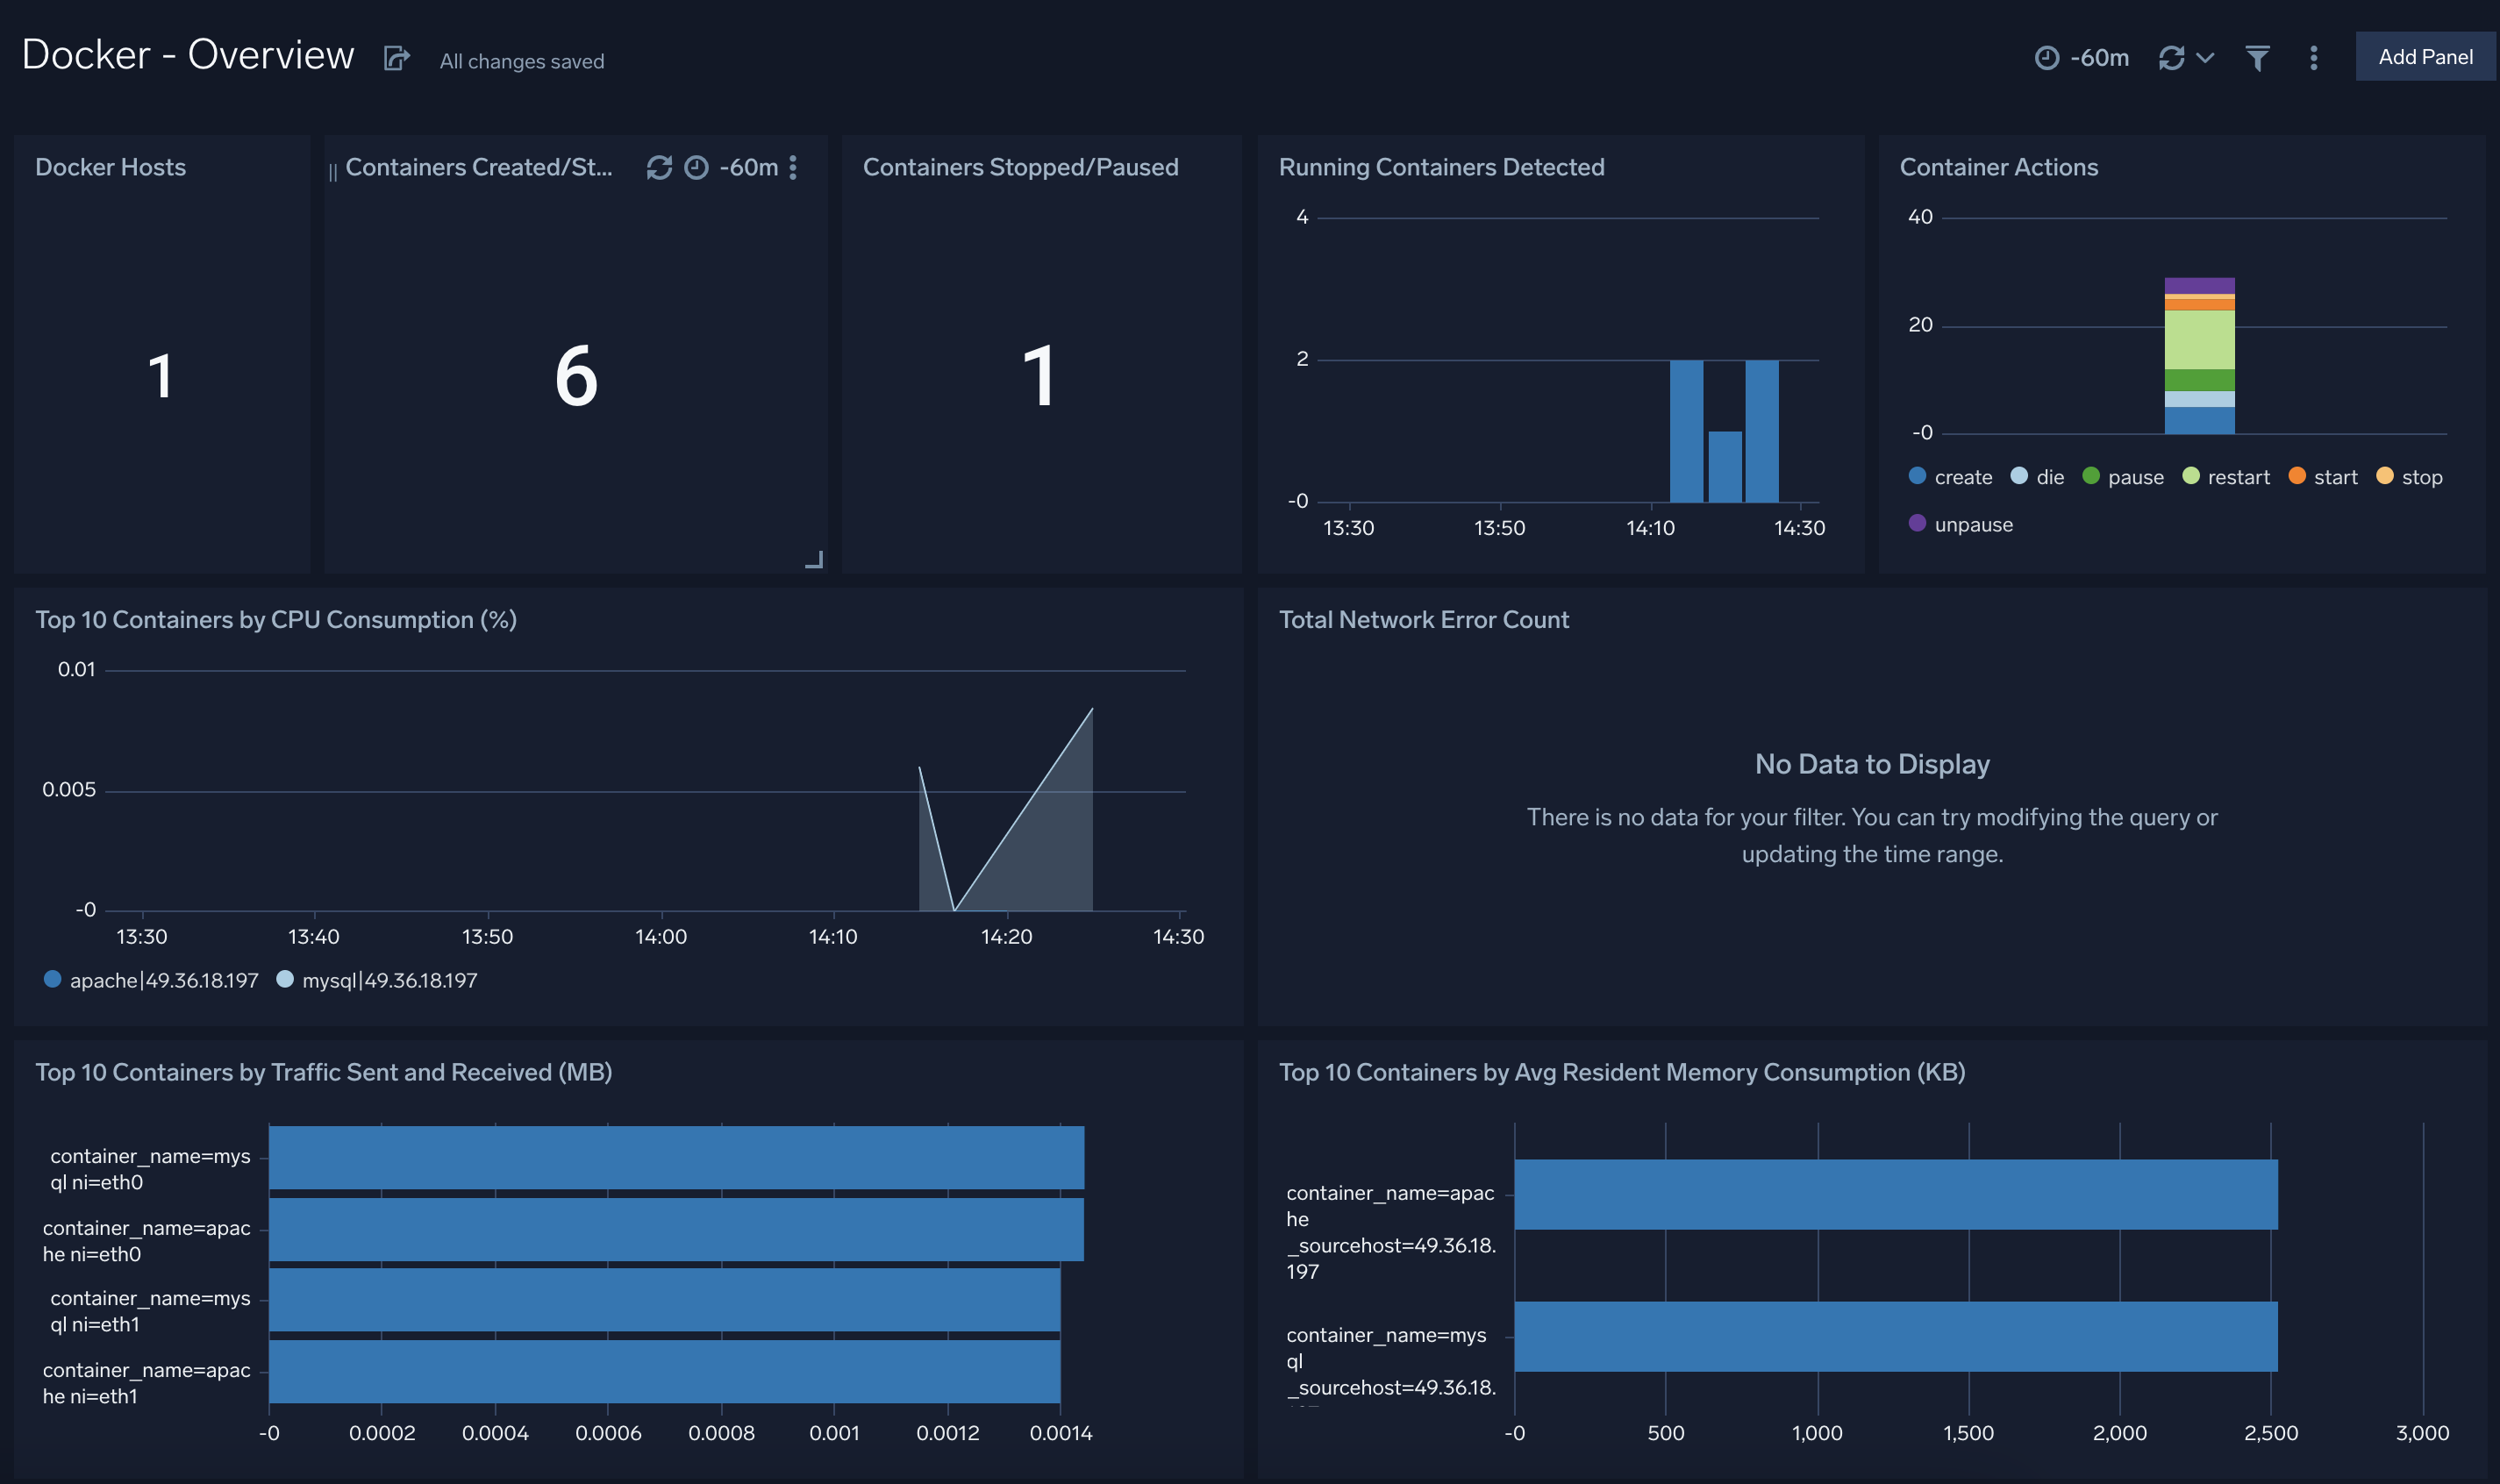
Docker Hosts. Shows the number of Docker hosts in a single value chart for the last hour.
Containers Created or Started. Provides the number of Containers created or started in a single value chart for the last seven days.
Containers Stopped or Paused. Provides the number of Containers stopped or paused in a single value chart for the last seven days.
Running Containers Detected. Displays the number of Containers detected in a column chart on a timeline for the last hour.
Top 10 Containers by CPU Consumption (%). Shows the top 10 Containers by CPU consumption in a stacked area chart on a timeline for the last hour.
Top 10 Containers by Average Resident Memory Consumption (KB). Provides a list of the top 10 Containers by average memory consumption in KB in a bar chart for the last hour.
Top 10 Containers by Traffic Sent and Received (MB). Provides information on the top 10 Containers by the amount of data sent and received in MB in a line chart for the last hour.
Total Network Error Count. Displays the total number of network errors in a column chart on a timeline for the last hour.
Container Actions. Displays the number of Container actions in a stacked column chart on a timeline for the last seven days.
CPU Performance
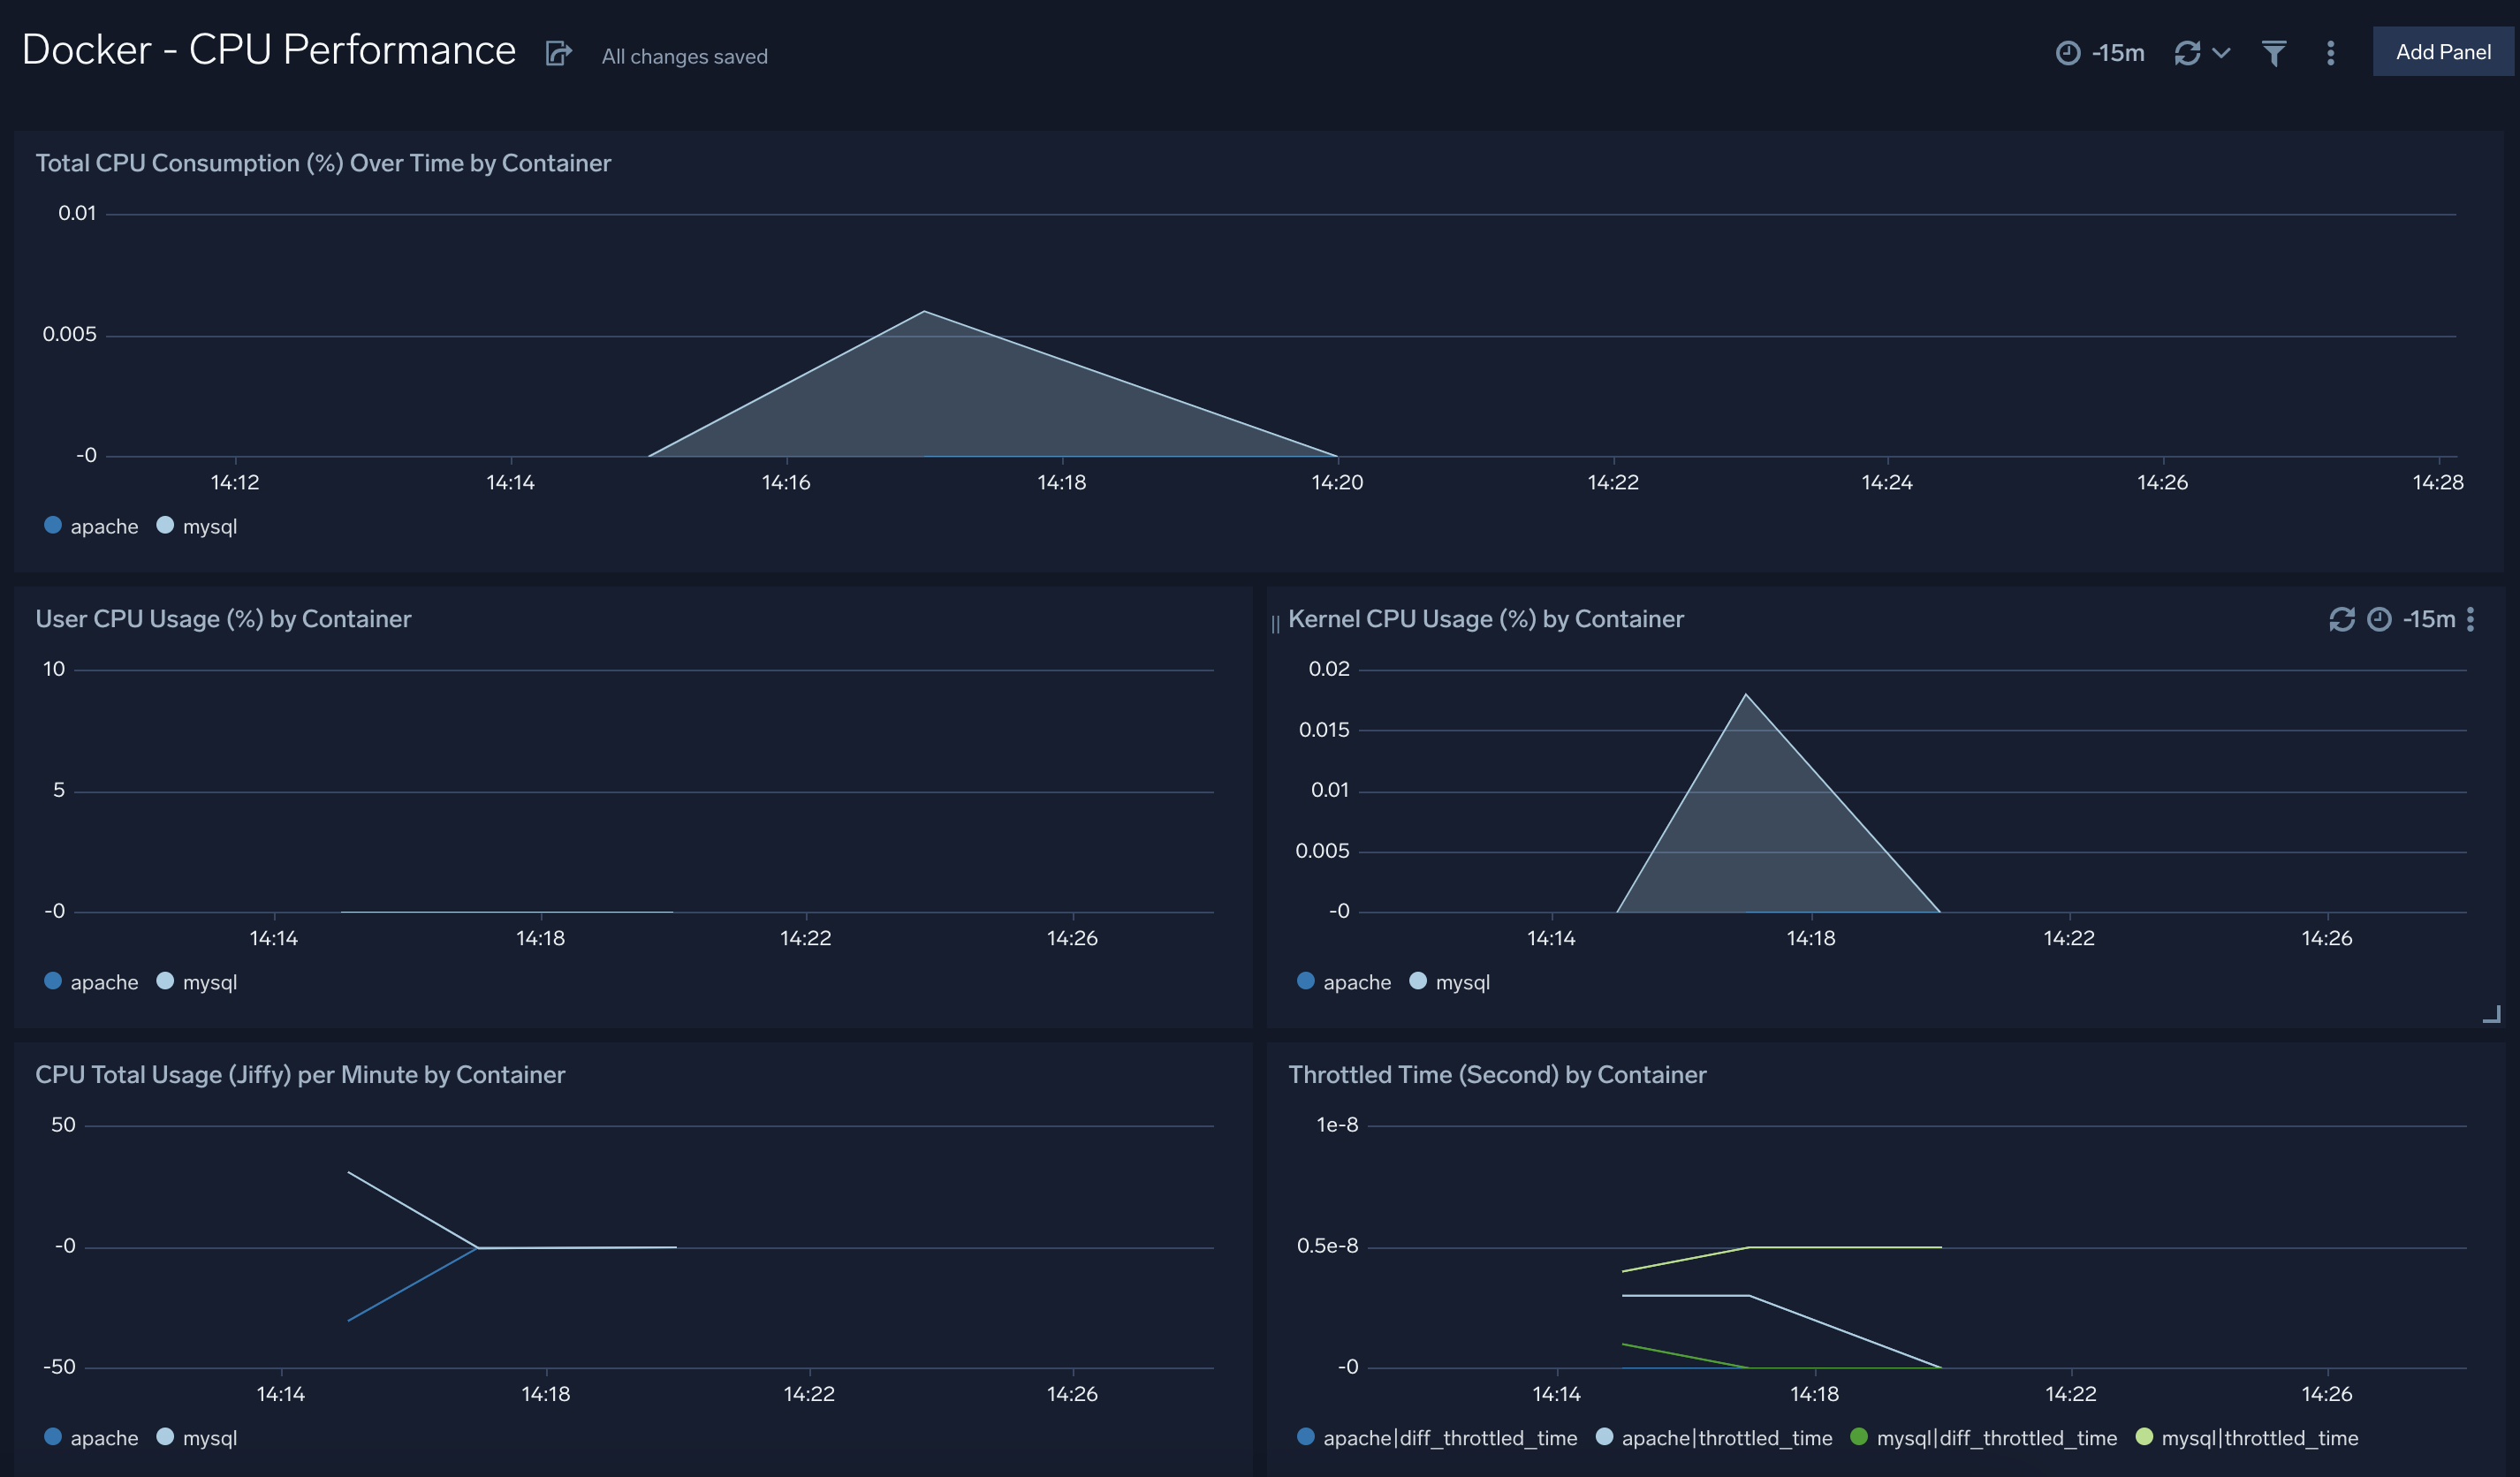
Total CPU Consumption (%) Over Time by Container. Shows the CPU consumption by percentage over time by host in a stacked area chart on a timeline for the last hour.
User CPU Usage (%) by Container. Displays the CPU usage by percentage by Container in a stacked area chart on a timeline for the last 15 minutes.
Kernel CPU Usage (%) by Container. Provides information on the kernel CPU usage by percentage by Container in a stacked area chart on a timeline for the last 15 minutes.
CPU Total Usage (Jiffy) per Minute by Container. Displays the total CPU usage in Jiffy by Container in a line chart on a timeline for the last hour.
Throttled Time (Second) by Container. Shows the throttled time per second by Container on a line chart on a timeline for the last 15 minutes.
Memory Performance
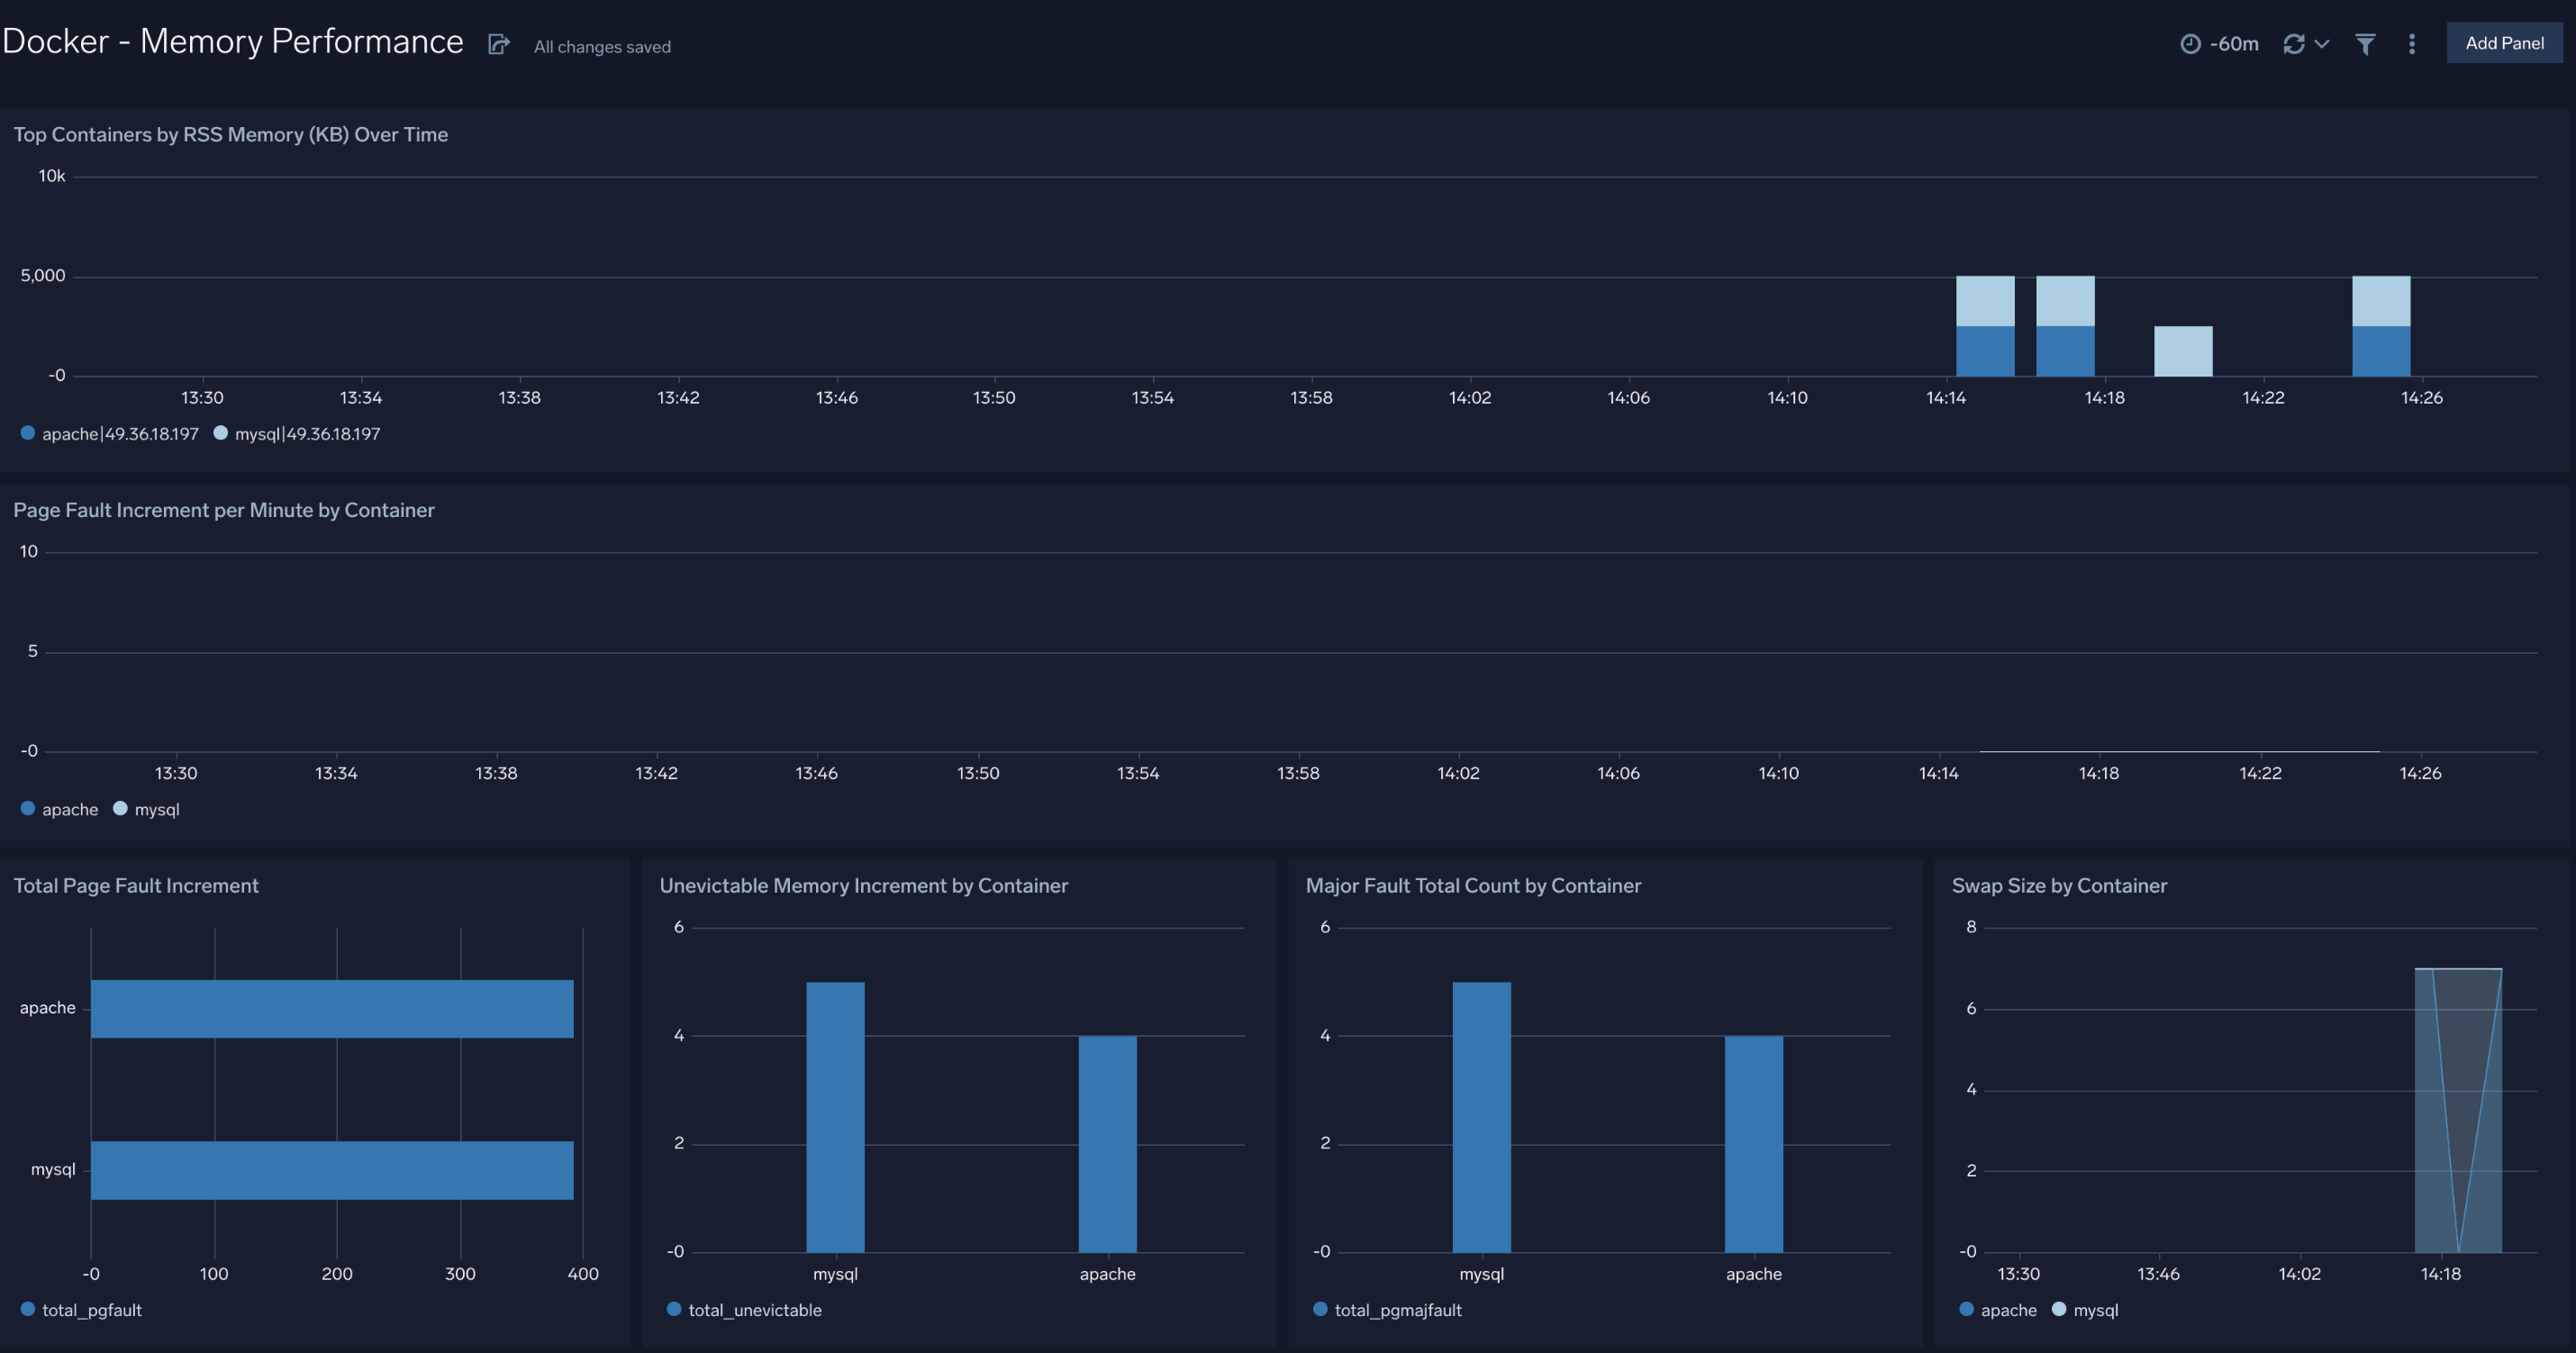
Top Containers by RSS Memory (KB) Over Time. Shows the top Containers by RSS memory over time in KB as a stacked column chart on a timeline for the last hour.
Page Fault Increment per Minute by Container. Displays the page fault increments per minute by Container in a line chart on a timeline for the last hour.
Total Page Fault Increment. Provides details on the total page fault increments by Container in a bar chart for the last hour.
Unevictable Memory Increment by Container. Shows the total unevictable memory increment by Container in a column chart for the last hour.
Major Fault Total Count by Container. Displays the total count of major faults by Container in a column chart for the last hour.
Swap Size by Container. Provides details on the swap size by Container in an area chart on a timeline for the last hour.
Network Performance
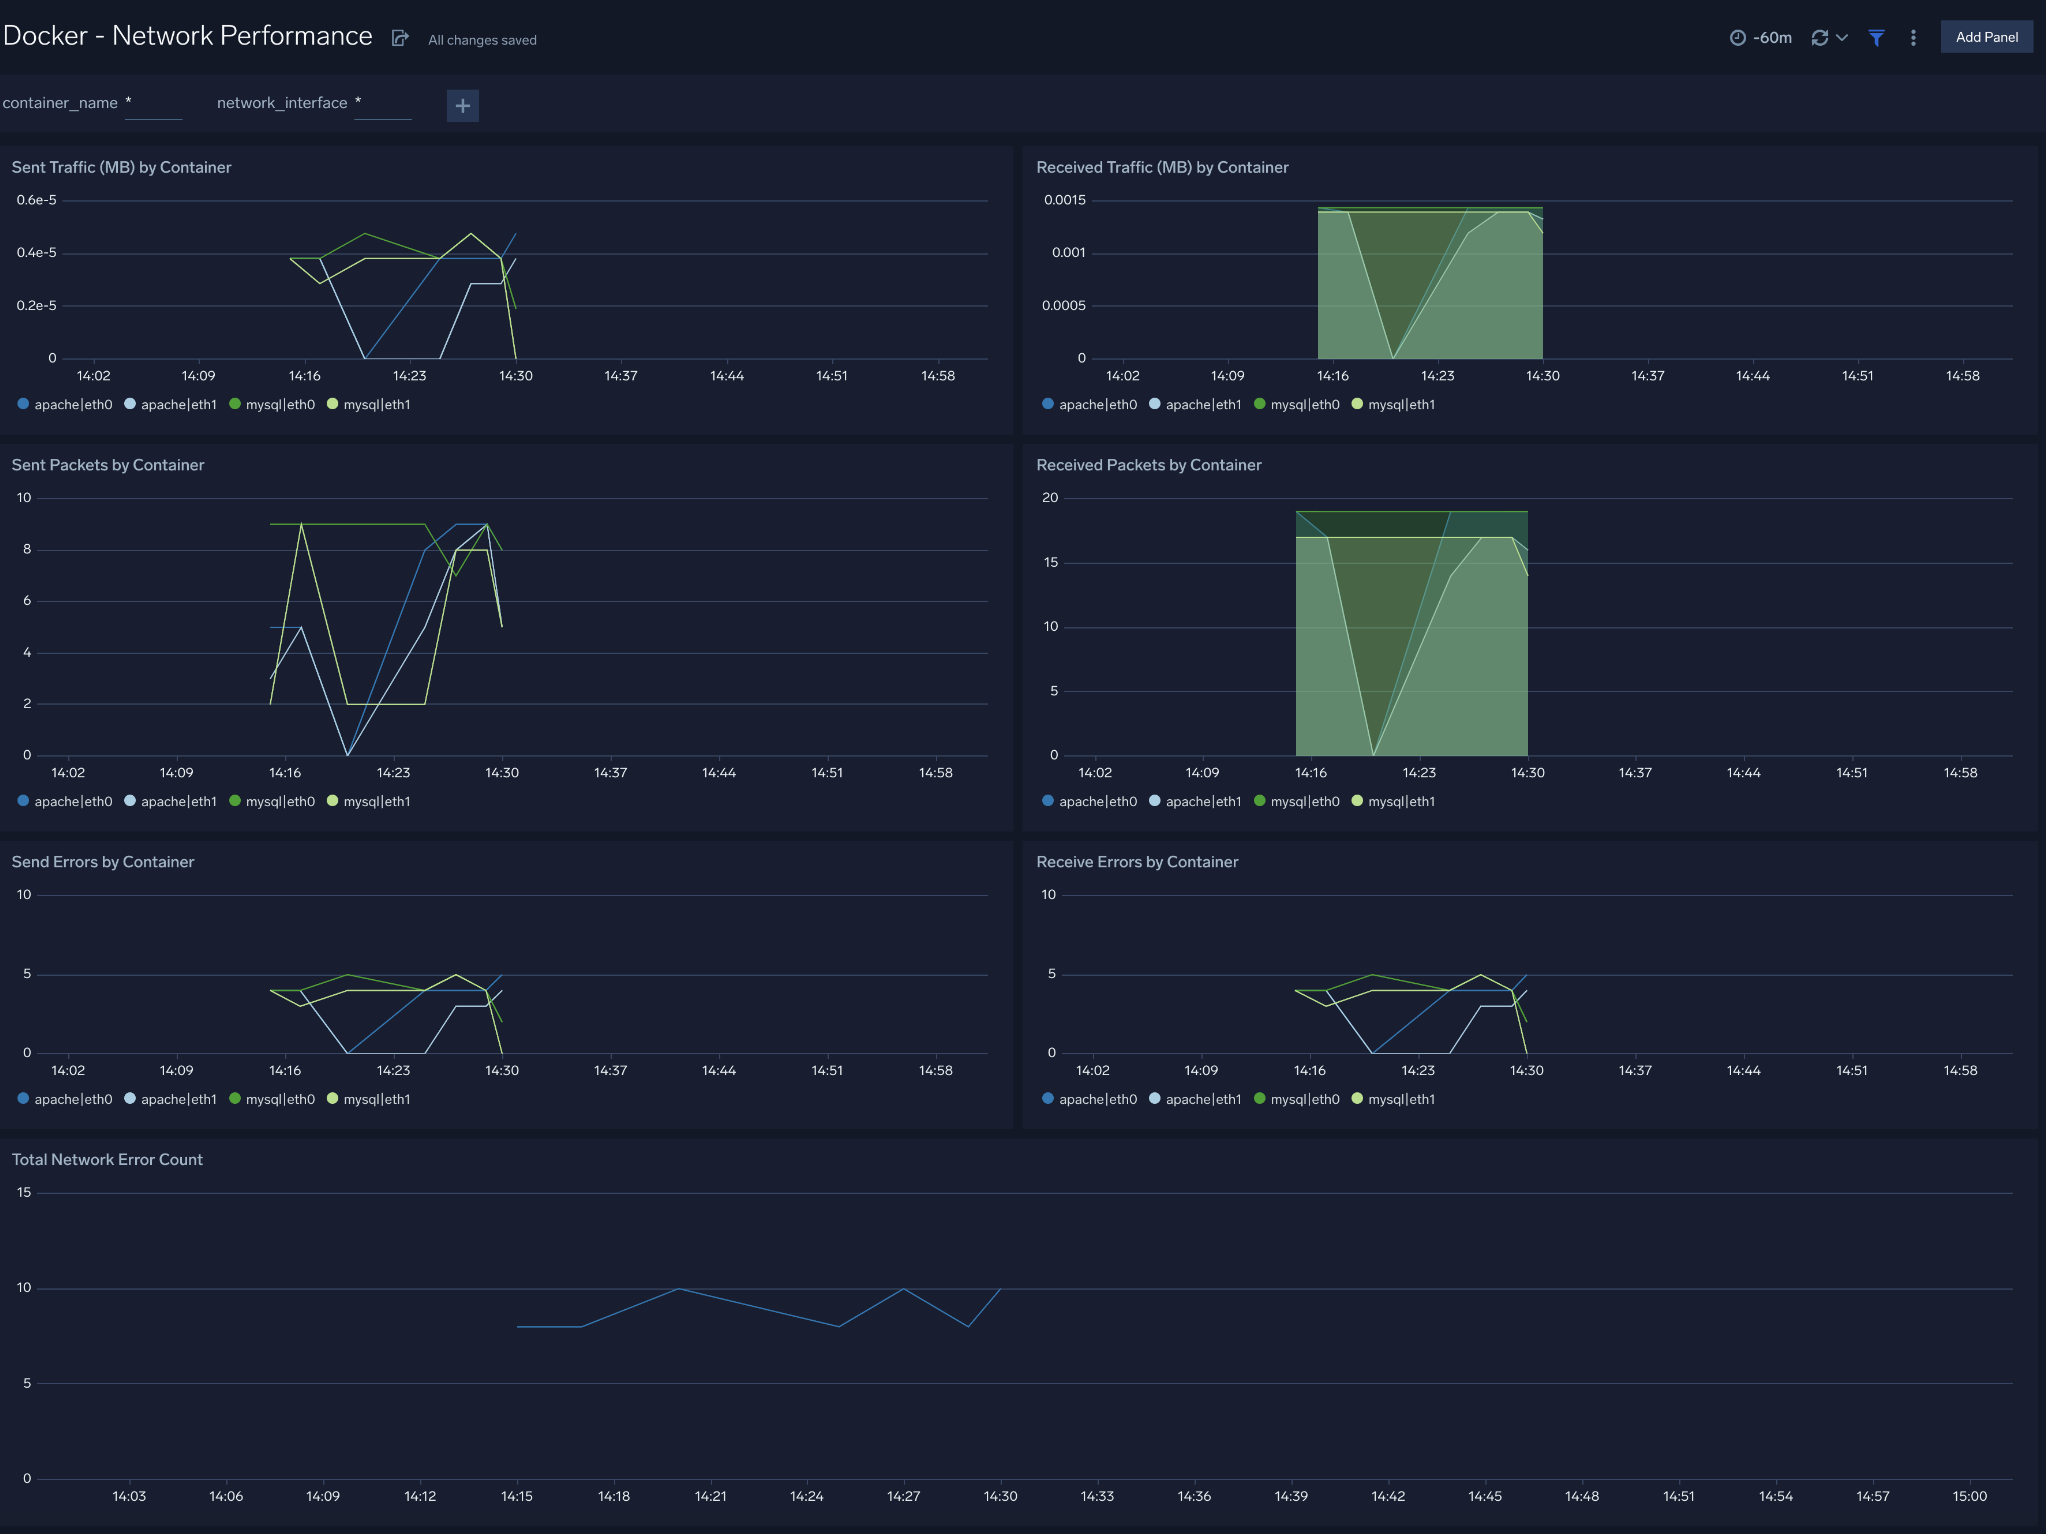
Sent Traffic (MB) by Container. Displays the number of sent MB by Container in a line chart on a timeline for the last hour.
Received Traffic (MB) by Container. Shows the number of received MB by Container in an area chart on a timeline for the last hour.
Sent Packets by Container. Provides the number of sent packets by Container in a line chart on a timeline for the last hour.
Received Packets by Container. Displays the number of received packets by Container in an area chart on a timeline for the last hour.
Send Errors by Container. Shows the number of sent errors by Container in a bar chart for the last hour.
Total Network Error Count. Provides details on the total number of network errors in a line chart on a timeline for the last hour.
Receive Errors by Container. Displays the number of received errors by container in a bar chart for the last hour.
Upgrade/Downgrade the Docker CE app (Optional)
To update the app, do the following:
Next-Gen App: To install or update the app, you must be an account administrator or a user with Manage Apps, Manage Monitors, Manage Fields, Manage Metric Rules, and Manage Collectors capabilities depending upon the different content types part of the app.
- Select App Catalog.
- In the Search Apps field, search for and then select your app.
Optionally, you can identify apps that can be upgraded in the Upgrade available section. - To upgrade the app, select Upgrade from the Manage dropdown.
- If the upgrade does not have any configuration or property changes, you will be redirected to the Preview & Done section.
- If the upgrade has any configuration or property changes, you will be redirected to the Setup Data page.
- In the Configure section of your respective app, complete the following fields.
- Field Name. If you already have collectors and sources set up, select the configured metadata field name (eg _sourcecategory) or specify other custom metadata (eg: _collector) along with its metadata Field Value.
- Click Next. You will be redirected to the Preview & Done section.
Post-update
Your upgraded app will be installed in the Installed Apps folder and dashboard panels will start to fill automatically.
See our Release Notes changelog for new updates in the app.
To revert the app to a previous version, do the following:
- Select App Catalog.
- In the Search Apps field, search for and then select your app.
- To version down the app, select Revert to < previous version of your app > from the Manage dropdown.
Uninstalling the Docker CE app (Optional)
To uninstall the app, do the following:
- Select App Catalog.
- In the 🔎 Search Apps field, run a search for your desired app, then select it.
- Click Uninstall.