Kubernetes Control Plane
The Sumo Logic Kubernetes Control Plane App manages the master node control plane, including the API server, etcd, kube-system and worker nodes. The App utilizes Falco Kubernetes Audit events to monitor and detect notable or suspicious activity such as creating pods that are privileged, mount sensitive host paths, use host networking, and the like. Seamlessly integrated with the Sumo Logic Kubernetes App, preconfigured dashboards display resource-related metrics for Kubernetes deployments, clusters, namespaces, pods, containers, and daemonsets.
Kubernetes is a system that automates the deployment, management, scaling, networking, and availability of container-based applications. Kubernetes container-orchestration allows you to easily deploy and manage multi-container applications at scale.
Sumo Logic supports only Kubernetes versions 1.16 or later for the Kubernetes Control Plane app.
Log and metric types
The Kubernetes Control Plane app uses logs and metrics.
Log sources
The Sumo Logic Kubernetes app uses Sumo Logic Distribution for OpenTelemetry Collector to collect logs.
Sample log messages
{"timestamp":1562059802772,"log":"E0702 09:30:02.772323       1
watcher.go:208] watch chan error: etcdserver: mvcc: required revision has been compacted",
"stream":"stdout","time":"2019-07-02T09:30:02.772474301Z"}
{"timestamp":1561651885393,"log":"E0627 16:11:25.377997       1
 horizontal.go:214] failed to compute desired number of replicas based on listed metrics for
 Deployment/2019-06-27-numbers/goledzki-k8sdemo-20190627: Invalid metrics (1 invalid out of 1),
 last error was: failed to get cpu utilization: unable to get metrics for resource cpu: unable to fetch
 metrics from resource metrics API: the server could not find the requested resource
 (get pods.metrics.k8s.io)","stream":"stderr","time":"2019-06-27T16:11:25.393923292Z"}
{"timestamp":1561646836232,"log":"E0627 14:47:16.211140       1
 scheduling_queue.go:346] Unable to find backoff value for pod
 2019-06-27-numbers/goledzki-k8sdemo-20190627-6cc8d4b677-vqwdt in backoffQ","stream":"stderr",
 "time":"2019-06-27T14:47:16.232275553Z"}
{"timestamp":1562059802772,"log":"E0702 09:30:02.772323       1
watcher.go:208] watch chan error: etcdserver: mvcc: required revision has been compacted",
"stream":"stdout","time":"2019-07-02T09:30:02.772474301Z"}
{"timestamp":1561534865020,"log":"E0626 07:41:05.020255       1
manager.go:101] Error in scraping containers from kubelet:192.168.190.54:10255:
failed to get all container stats from Kubelet URL \"http://192.168.190.54:10255/stats/container/\":
Post http://192.168.190.54:10255/stats/container/: dial tcp 192.168.190.54:10255: getsockopt:
connection refused"}
Metric sources
- Kubernetes API Server Metrics
- Scheduler Metrics
- Controller Manager Metrics
- Node-exporter Metrics
- kube-state-metrics
Metrics are collected using Prometheus with Sumo Logic Distribution for OpenTelemetry Collector. For additional information on metrics options you can configure for collection, see this document.
Sample queries
_sourceCategory = *controller*
| json field=_raw "log" as log
| parse regex field=log "^(?<severity>.)(?:[0-9])"
| timeslice 1h
| count _timeslice, severity
| transpose row _timeslice column severity
| fillmissing timeslice(1h)
Collecting logs and metrics for the Kubernetes Control Plane app
See Sumo Logic Kubernetes Collection for instructions on configuring log and metric collection for the Kubernetes Control Plane App.
Before installing the Kubernetes Control Plane App, you must set up collection for and install the Kubernetes App, which provides the services for managing and monitoring Kubernetes worker nodes.
Installing the Kubernetes Control Plane app
This section provides instructions for installing the Kubernetes Control Plane App, as well as descriptions and examples for each of the dashboards. The app installation process consists of the following tasks:
- Determining custom data filters for source categories
- Installing the app
All the dashboards are linked to the Kubernetes views and can be easily accessed by clicking the Cluster, in the left navigation pane of tab.
Step 1: Determine custom data filters for source categories
The Sumo Logic Kubernetes Collection Helm Chart uses the Sumo Logic Distribution for OpenTelemetry Collector to collect and enrich logs.
All ingested log records will have certain built-in metadata fields set. One of them is the Source Category field, which can be used to specify custom data filters for this app.
To determine custom data filters for source categories, do the following:
- Run a query similar to the following in Sumo Logic to determine the source categories. Use the Collector Name that you configured for Kubernetes collection.
_collector="<Collector Name>"
| count by _sourceCategory
You should see results similar to the following: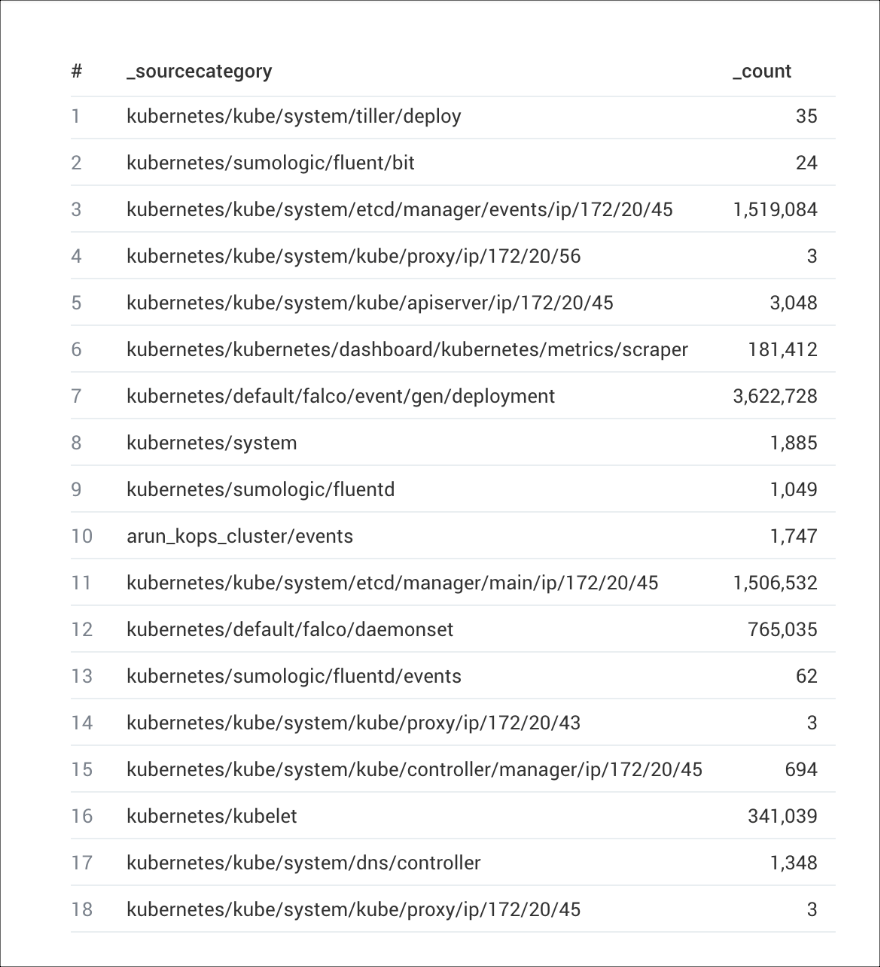
- Determine the custom data filters and source categories. The following table lists some of the sources created by the Sumo Logic Kubernetes Collection Helm Chart in the left column. The Source Category column contains the source category you should configure for the sources when you install the app, or the source category that matches your environment based on the output of the query (from the previous step).
| Source | Source Category |
|---|---|
| Kube Control Manager Log Source | kubernetes/kube/system/kube/controller/manager |
| Kube-System Namespace Log Source | kube/system |
| Kube API Server Log Source | kubernetes/kube/system/kube/apiserver |
| Falco | please see configuration for sumologic.logs.container.sourceCategory in values.yaml |
Step 2. Install the app
Now that you have set up collection for Kubernetes Control Plane, you can install the App and use the pre-configured searches and dashboards that provide insight into your data.
To install the app, do the following:
- Locate and install the app from the App Catalog. If you want to see a preview of the dashboards included with the app before installing, click Preview Dashboards.
- From the App Catalog, search for Kubernetes Control Plane and select the app.
- To install the app, click Add to Library.
- Complete the following fields.
- App Name. You can retain the existing name, or enter a name of your choice for the app.
- Data Source. For each the sources listed, enter a Custom Data Filter or Source Category, as follows:
- For Kube Control Manager Log Source, leave Source Category selected, and enter the following source category:
kubernetes/kube/system/kube/controller/manageror one that matches the source categories in your environment. - For Kube-System Namespace Log Source, leave Source Category selected, and enter the following source category:
kube/systemor one that matches the source categories in your environment. - For Kube API Server Log Source, leave Source Category selected, and enter the following source category:
kubernetes/kube/system/kube/apiserveror one that matches the source categories in your environment. - For Falco Log Source, leave Source Category selected, and enter the source category according to configuration for
sumologic.logs.container.sourceCategoryin values.yaml.
- For Kube Control Manager Log Source, leave Source Category selected, and enter the following source category:
- Advanced. Select the location in the library (the default is the Personal folder in the library), or click New Folder to add a new folder.
- Click Add to Library.
Viewing Kubernetes Control Plane dashboards
Template variables provide dynamic dashboards that can rescope data on the fly. As you apply variables to troubleshoot through your dashboard, you view dynamic changes to the data for a quicker resolution to the root cause. You can use template variables to drill down and examine the data on a granular level. For more information, see Filter with template variables.
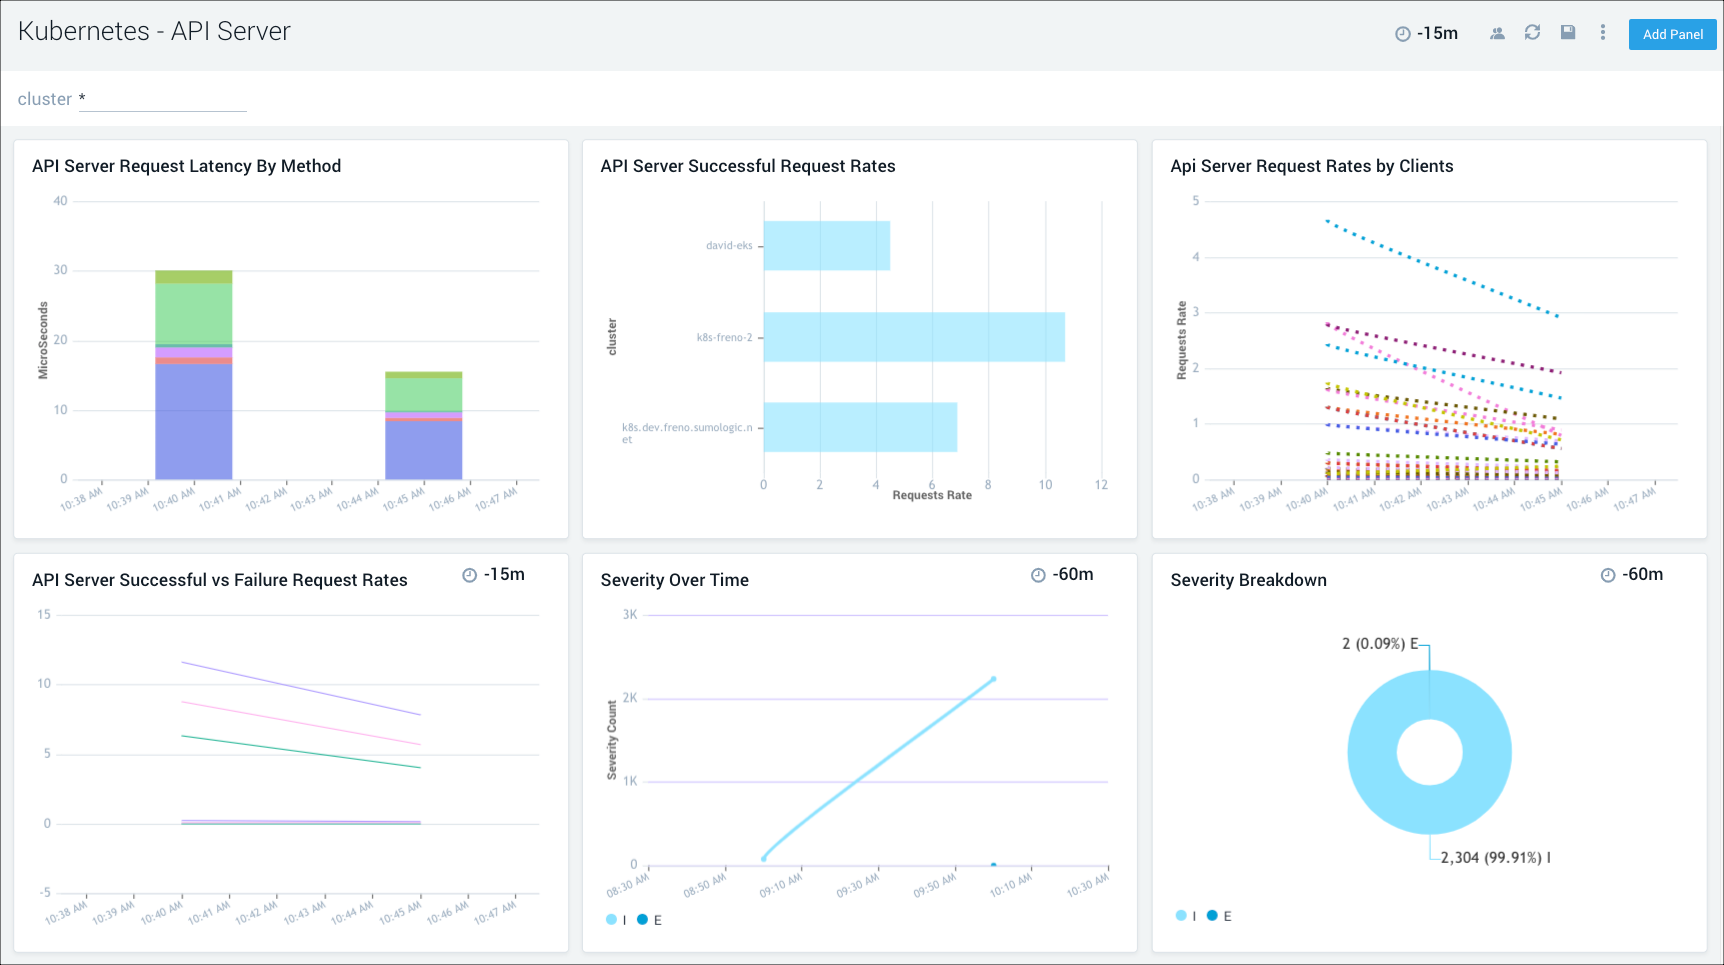
API Server
The Kubernetes - API Server dashboard displays information on the API server logs, which is the control plane component that exposes the Kubernetes API. Panels show details on the API server errors, warnings, and activities.
Use this dashboard to:
- Monitor the health and performance of the API server.
- Review server request rates.
- Review server success and failure request rates.
- Review client activity.
- Review server errors for troubleshooting insights.
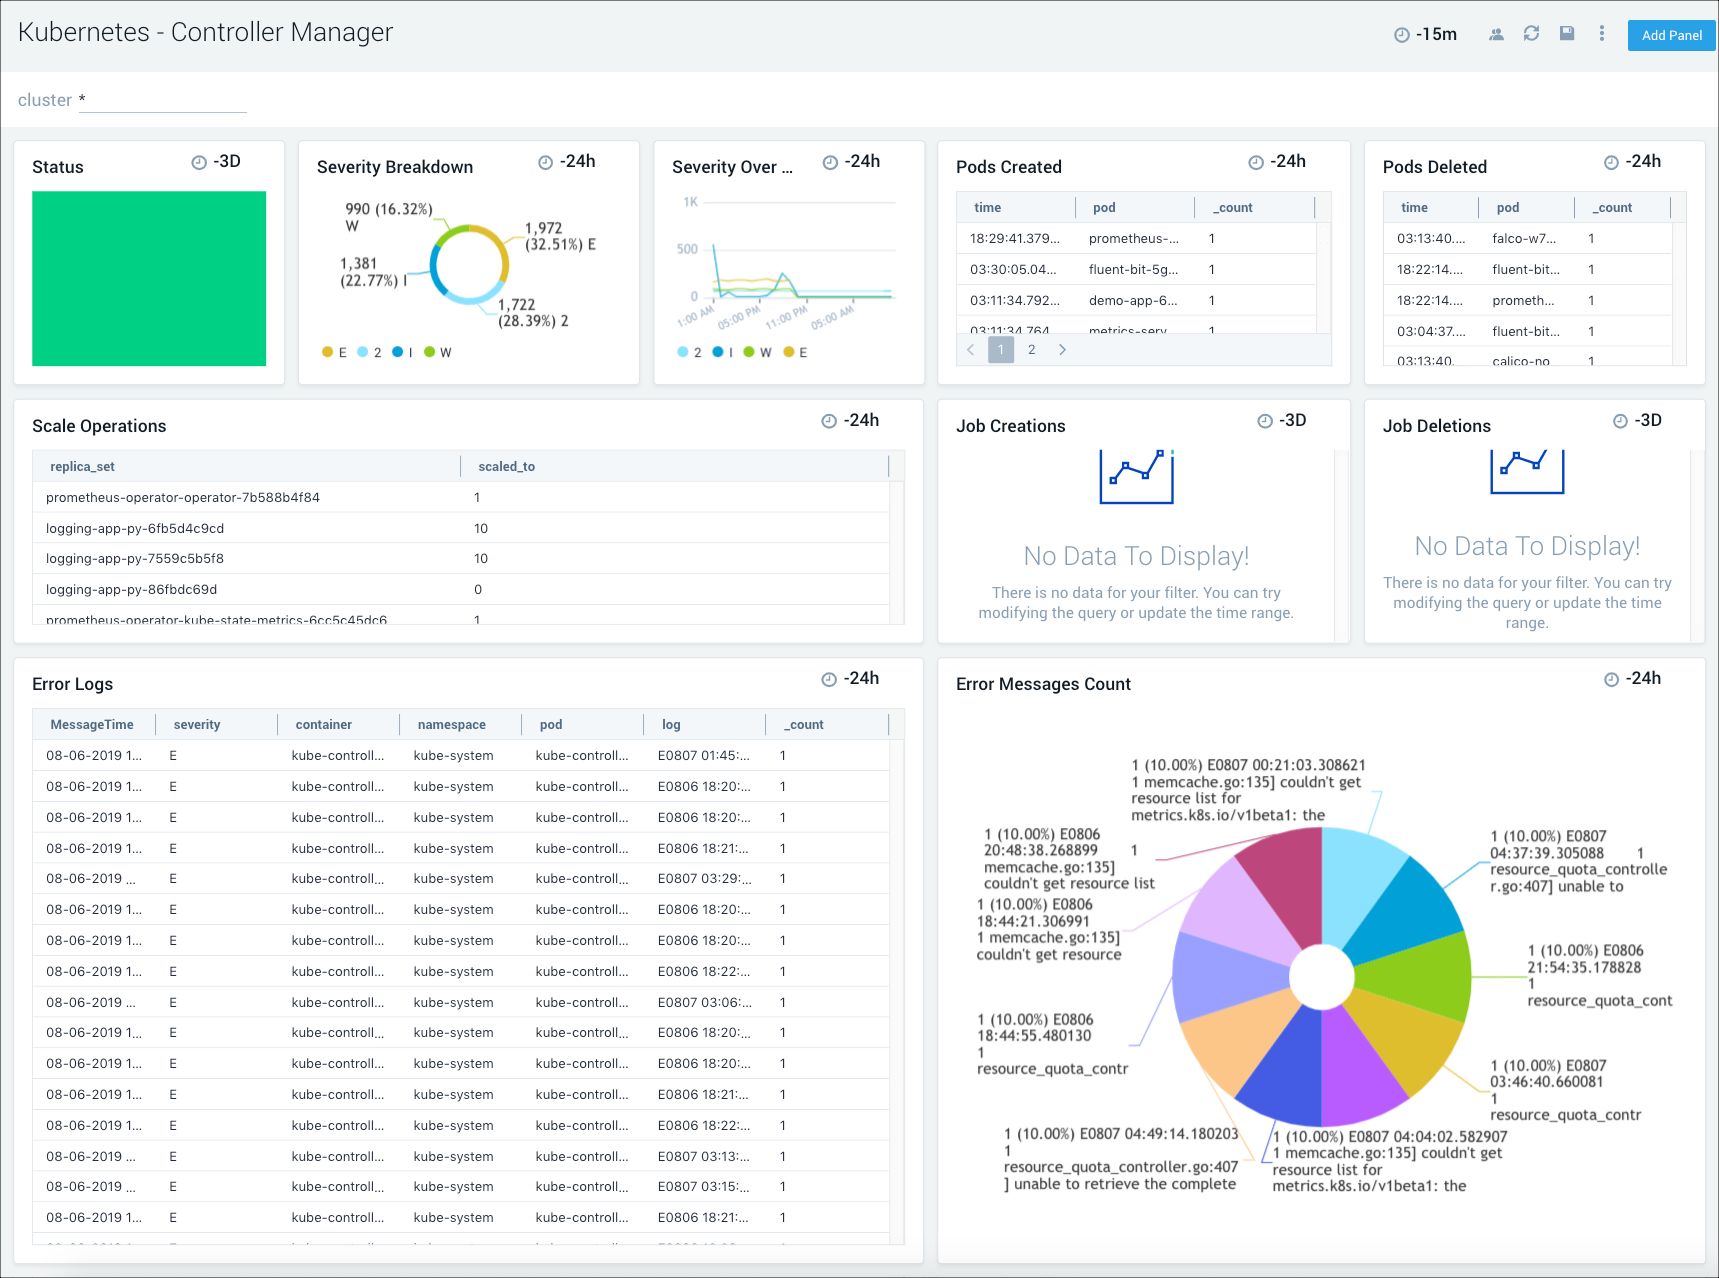
Controller Manager
The Kubernetes - Controller Manager dashboard displays information on the controller manager, providing visibility into the core control loops for Kubernetes.
Use this dashboard to:
- Assess the overall status of the controller manager, along with pod and job creations and deletions, and cloud provider requests.
- Review the details of scaling operations to monitor controller manager health.
- Review the trends in event severities to assist with troubleshooting.
- Get an overview of the number and types of errors, then dive deeper into their causes with the information provided in the error log stream.
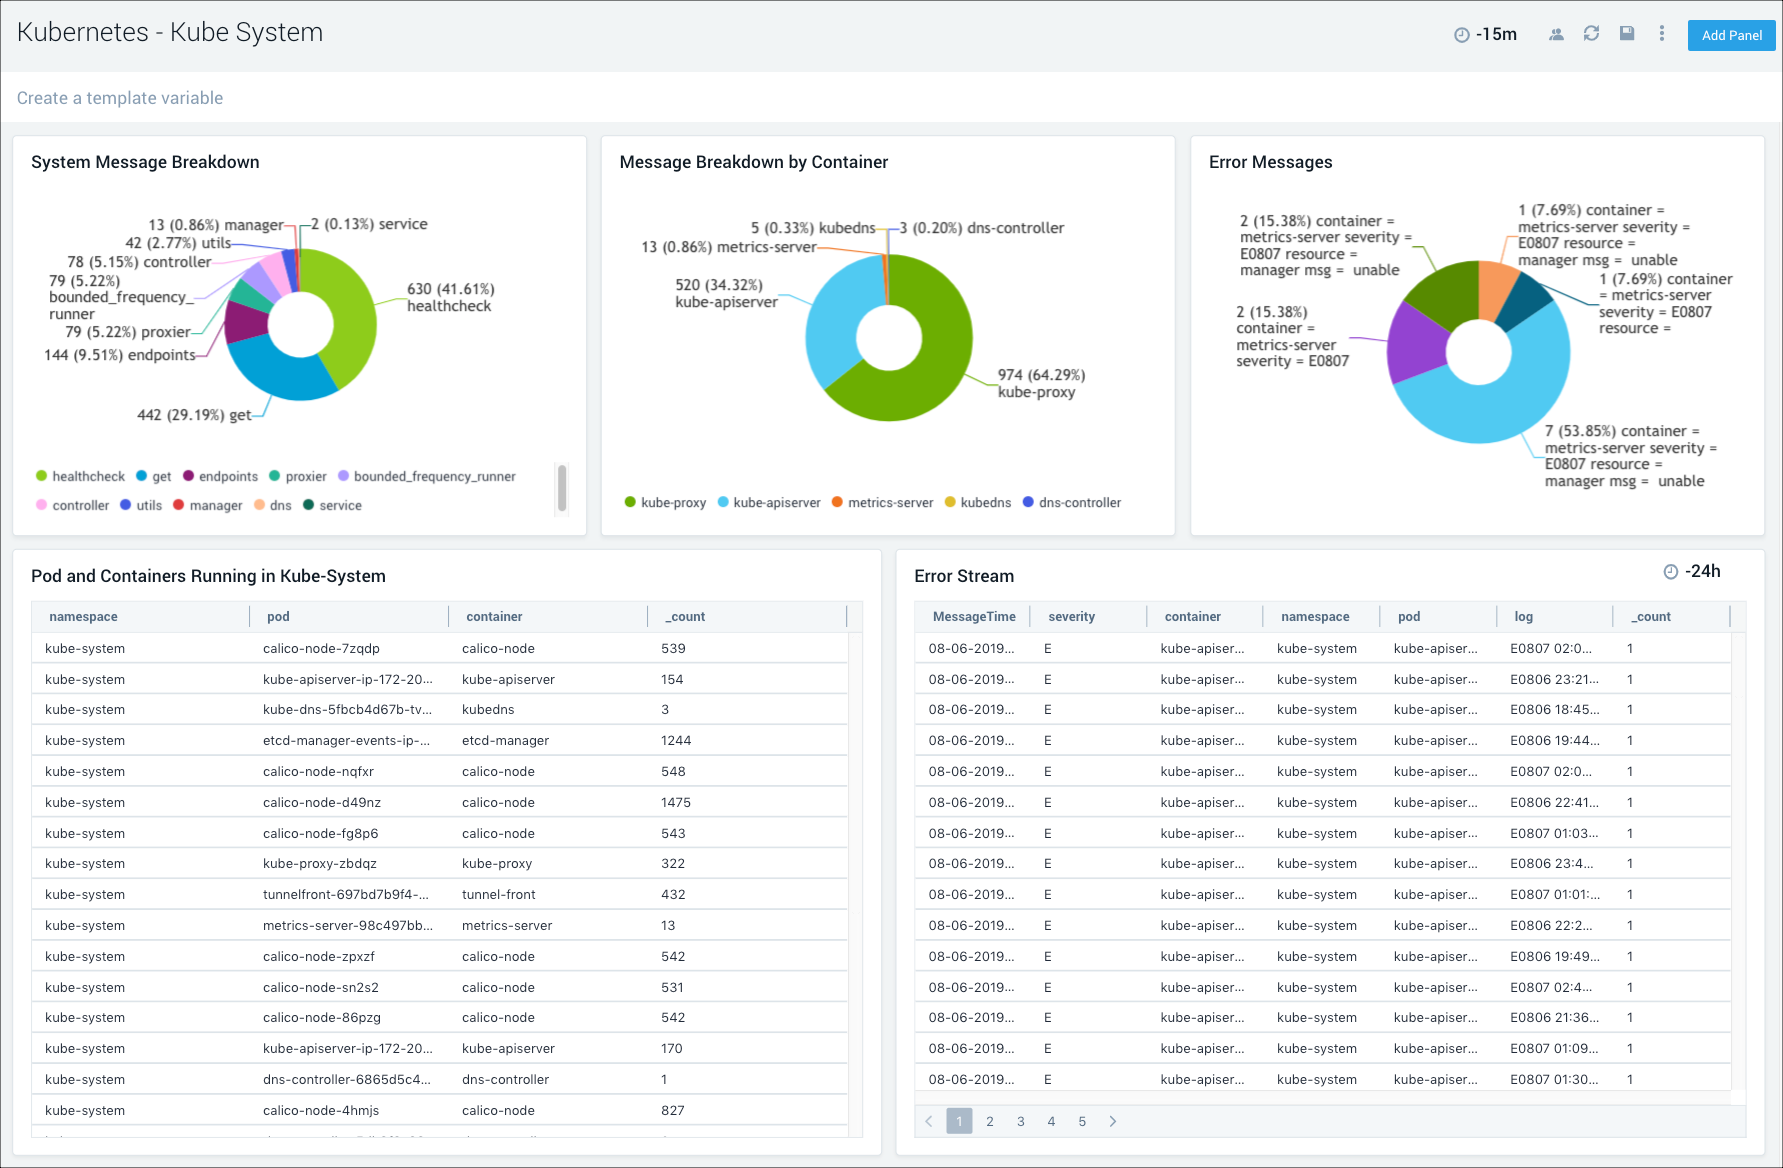
Kube System
The Kubernetes - Kube System dashboard provides insights into the health of the kube system, including details on resource utilization.
Use this dashboard to:
- Get an overview of message breakdowns for system, container, and errors.
- Review the details for the pods and containers in the kube system.
- Analyze the details of the error stream to determine high severity problems and proactively troubleshoot root cause solutions.
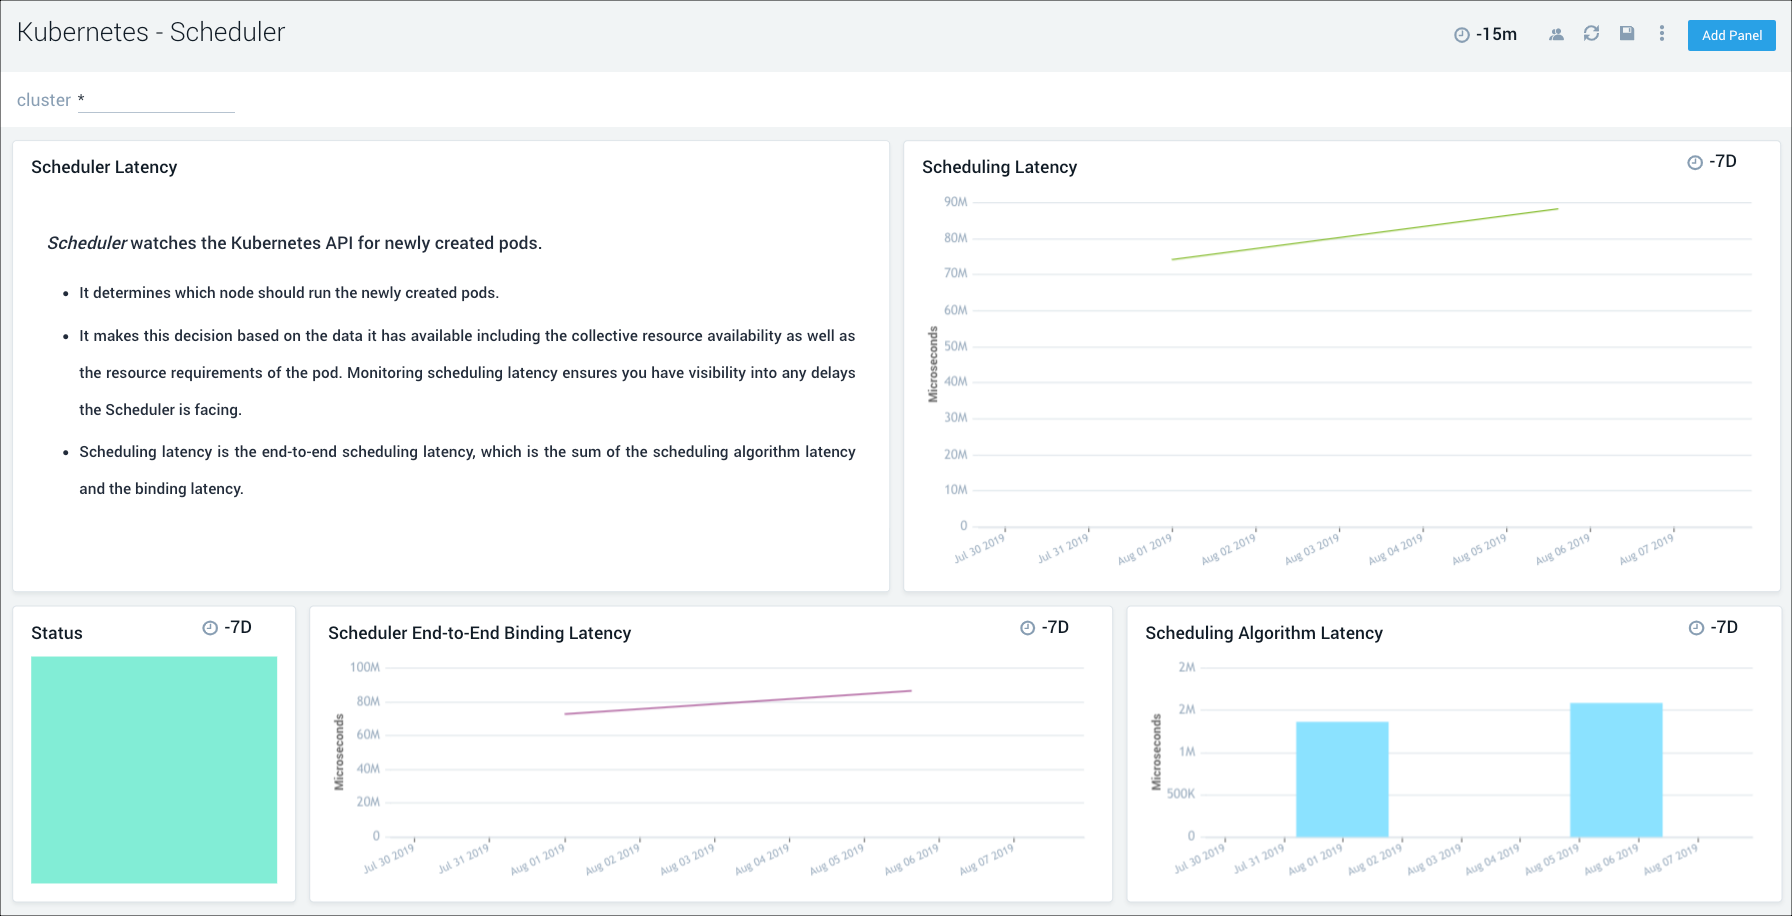
Scheduler
The Kubernetes - Scheduler dashboard provides insights into the health of the scheduler.
Use this dashboard to:
- Get an overview of scheduler health and status.
- Review scheduler latency details.
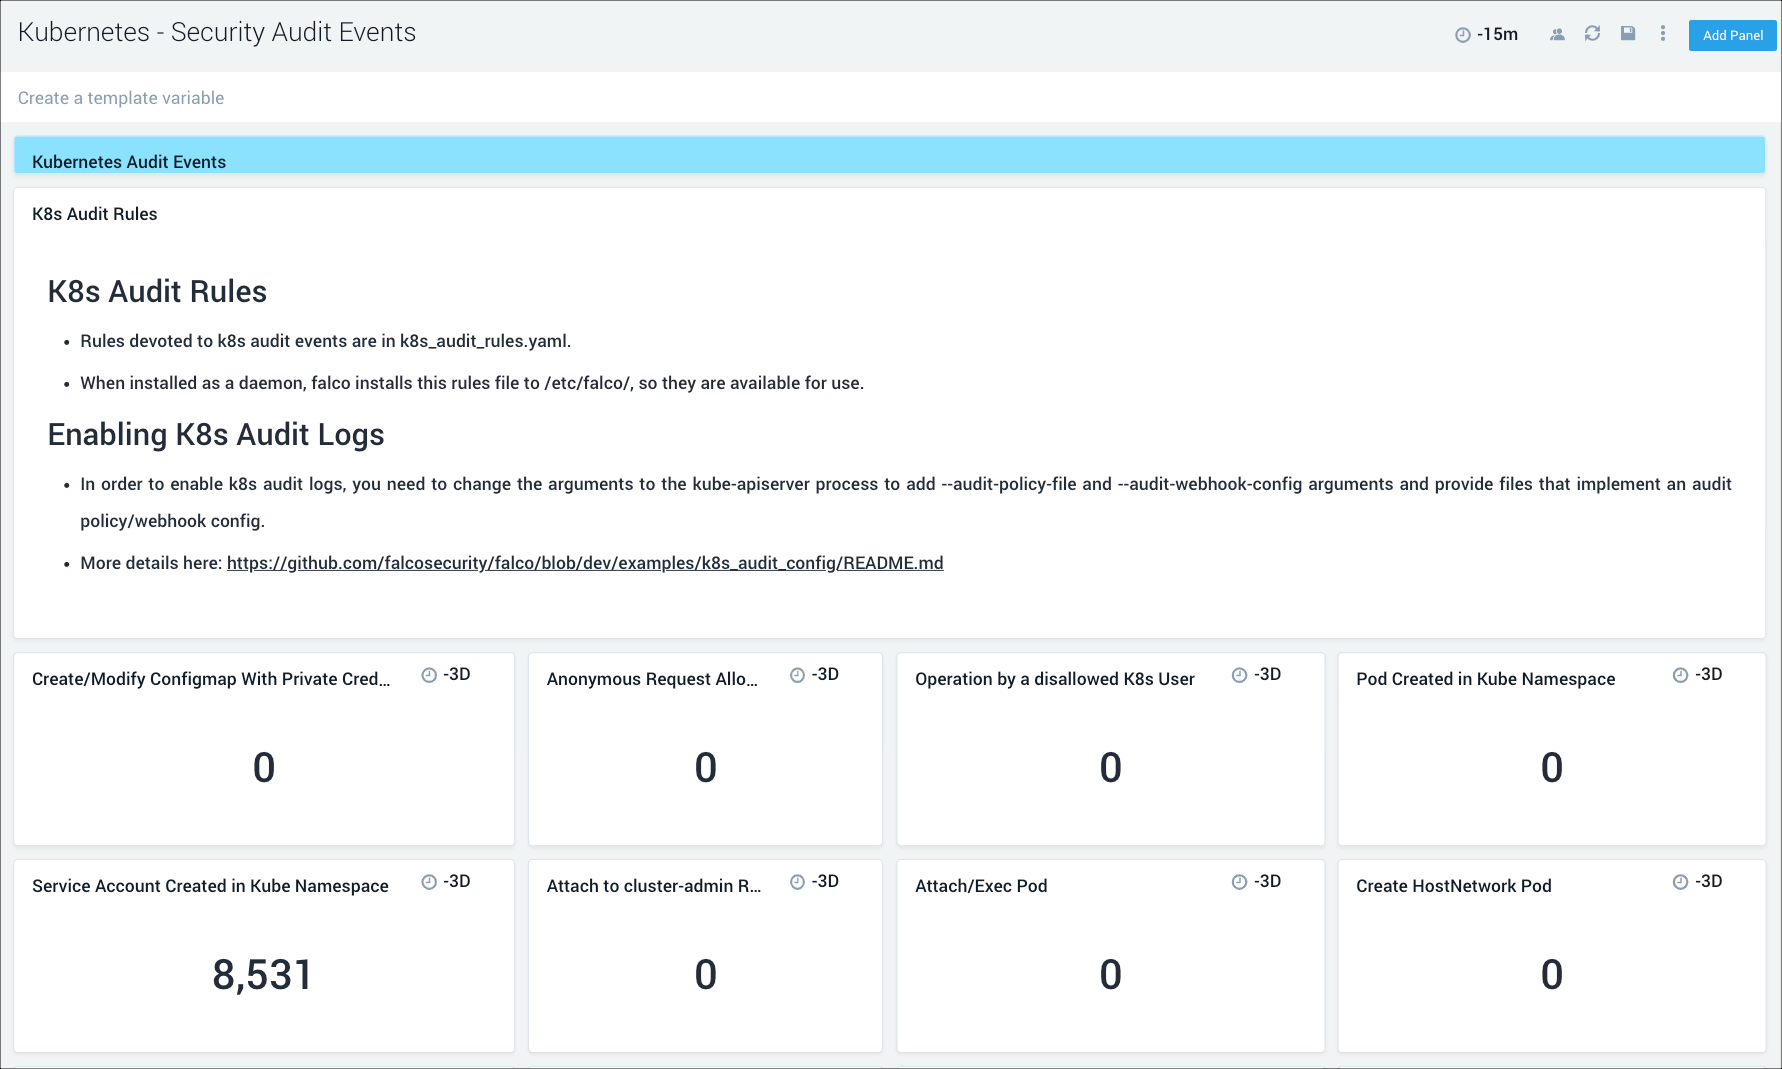
Security Audit Events
This dashboard relies on Falco. If the Dashboard is not populated, enable Falco by setting the flag "falco:enabled" as "true" in values.yaml as described on this page.
The Kubernetes - Security Audit Events dashboard provides insights into Kubernetes audit events collected by Falco.
Use this dashboard to:
- Monitor Kubernetes audit events.
- Identify and investigate unexpected or anomalous activity.
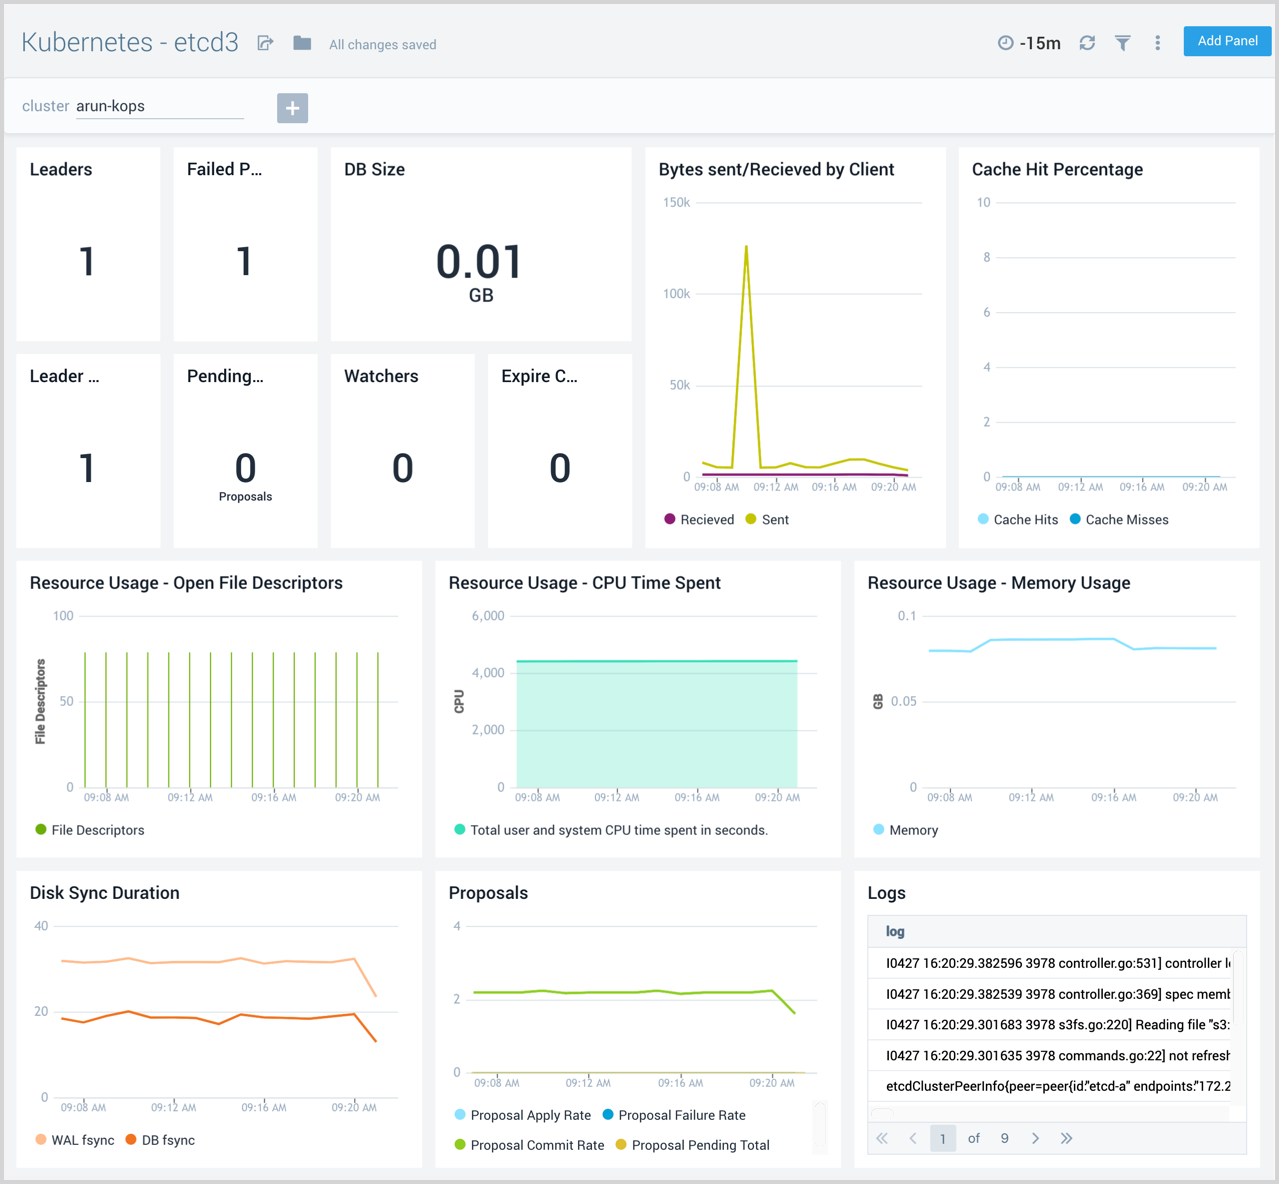
etcd3
The Kubernetes - etcd3 dashboard provides information on the health of etcd, including resource usage, cache, proposals and leader changes.
Use this dashboard to:
- Get a high-level view of the health and performance of the etcd backing store for the cluster.
- Review performance data for cache insertions and deletions, to determine if there any potential problems and proactively troubleshoot root cause solutions.