VMWare - OpenTelemetry Collector

The VMware - OpenTelemetry app uses metrics from the VMware cloud computing virtualization platform to enable monitoring of vCenter, datacenter, resource pool, cluster, ESXi hosts, and individual virtual machine metrics with real-time data displayed in predefined dashboards.
The dashboards provide insight into key metrics such as CPU, memory, disk utilization at different infrastructure levels like VM, host, datacenter, resource pool, and clusters. This enables you to determine capacity constraints and troubleshoot operational issues related to over-provisioning, changes to configuration, and VM movement.
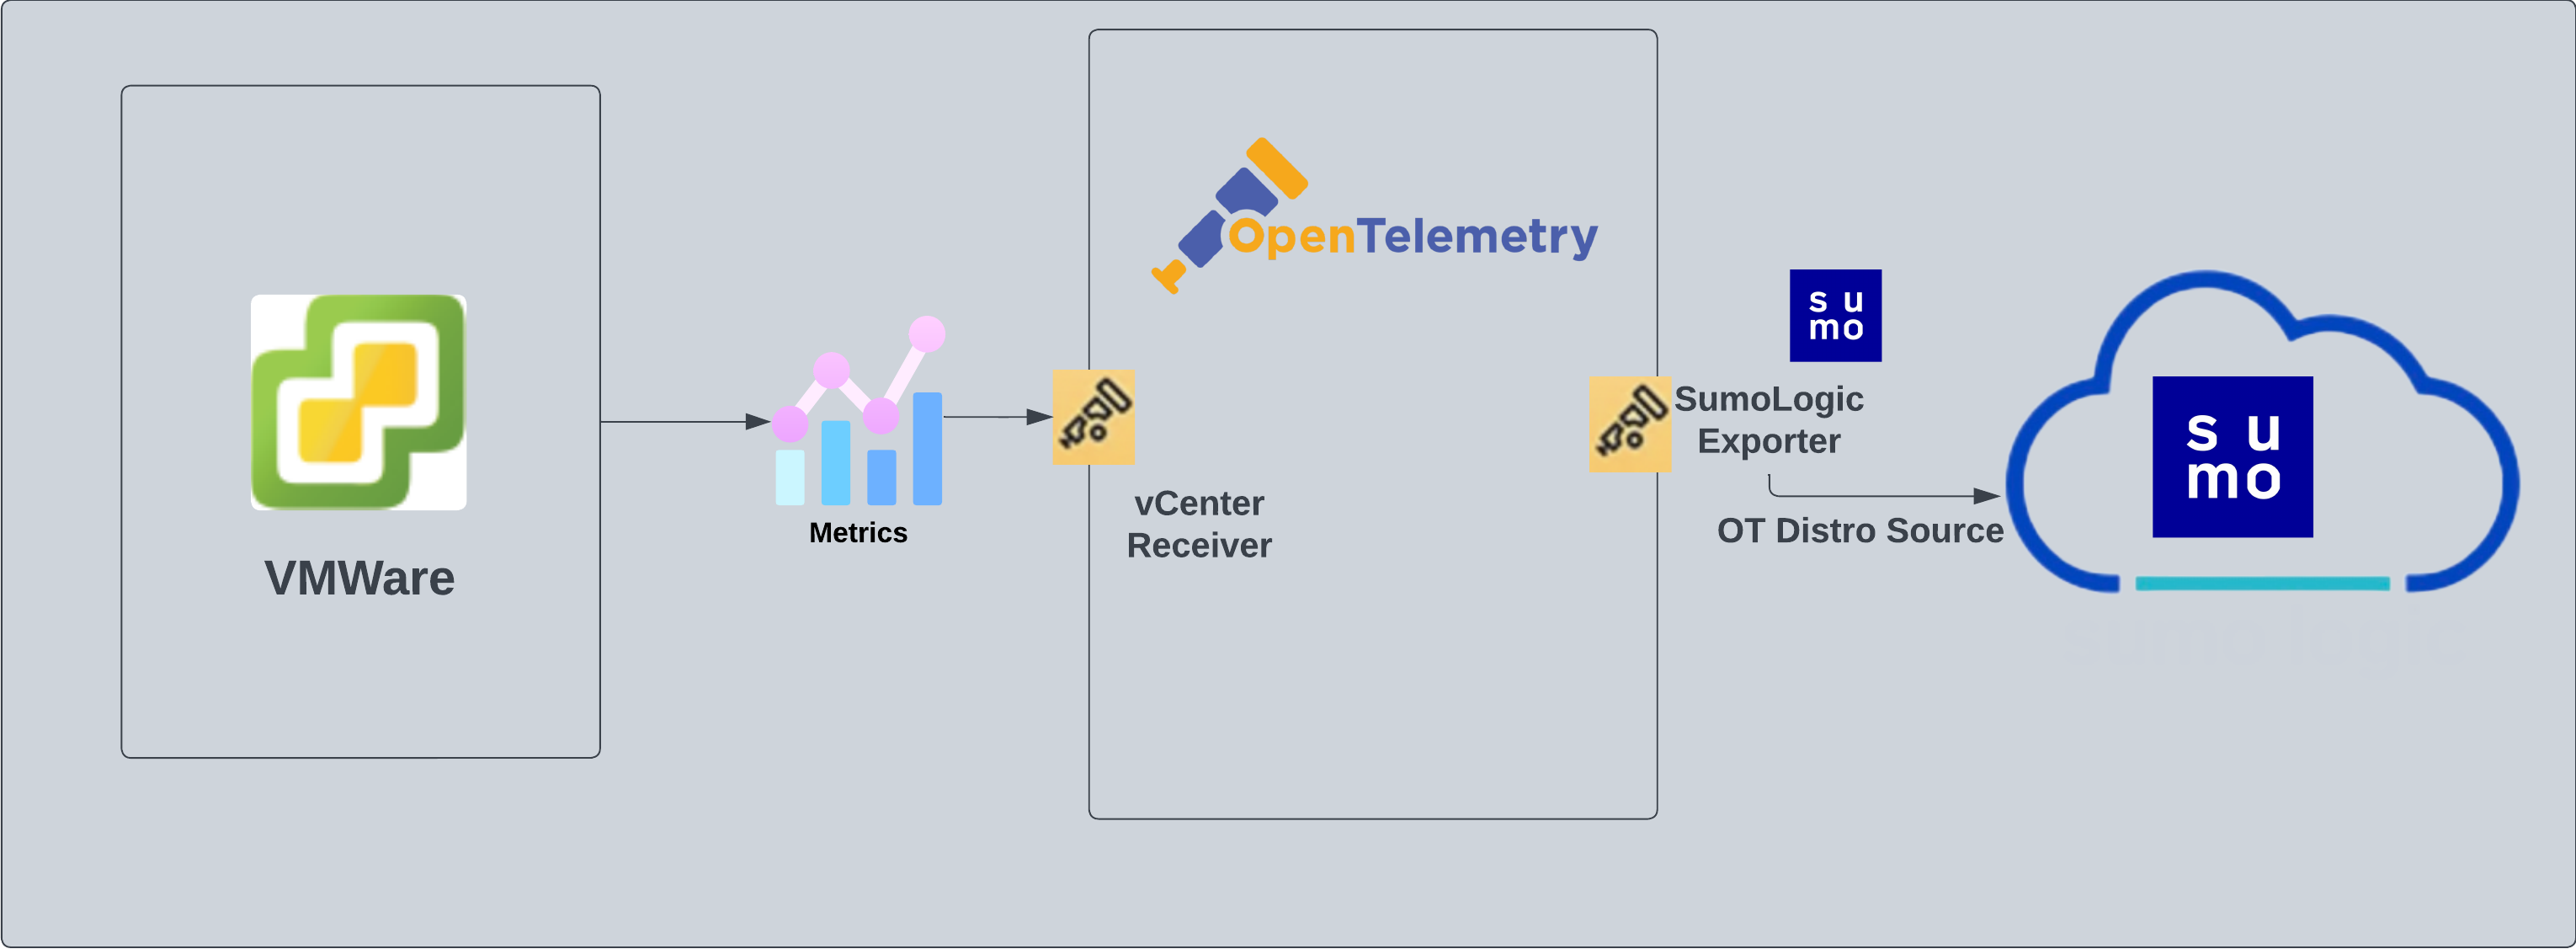
VMWare metrics are collected through the vCenter Receiver of OpenTelemetry.
See the vSphere product page for more information on VMware hybrid cloud.
This app includes built-in monitors. For details on creating custom monitors, refer to the Create monitors for JFrog Artifactory app.
Prerequisites
VMWare metrics are collected through the vCenter Receiver of OpenTelemetry.
This receiver has been built to support ESXi and vCenter versions:
- 8.0
- 7.0
A “Read Only” user assigned to a vSphere with permissions to the vCenter server, cluster, and all subsequent resources being monitored must be specified in order for the receiver to retrieve information about them.
Collection configuration and app installation
As part of data collection setup and app installation, you can select the App from App Catalog and click on Install App. Follow the steps below.
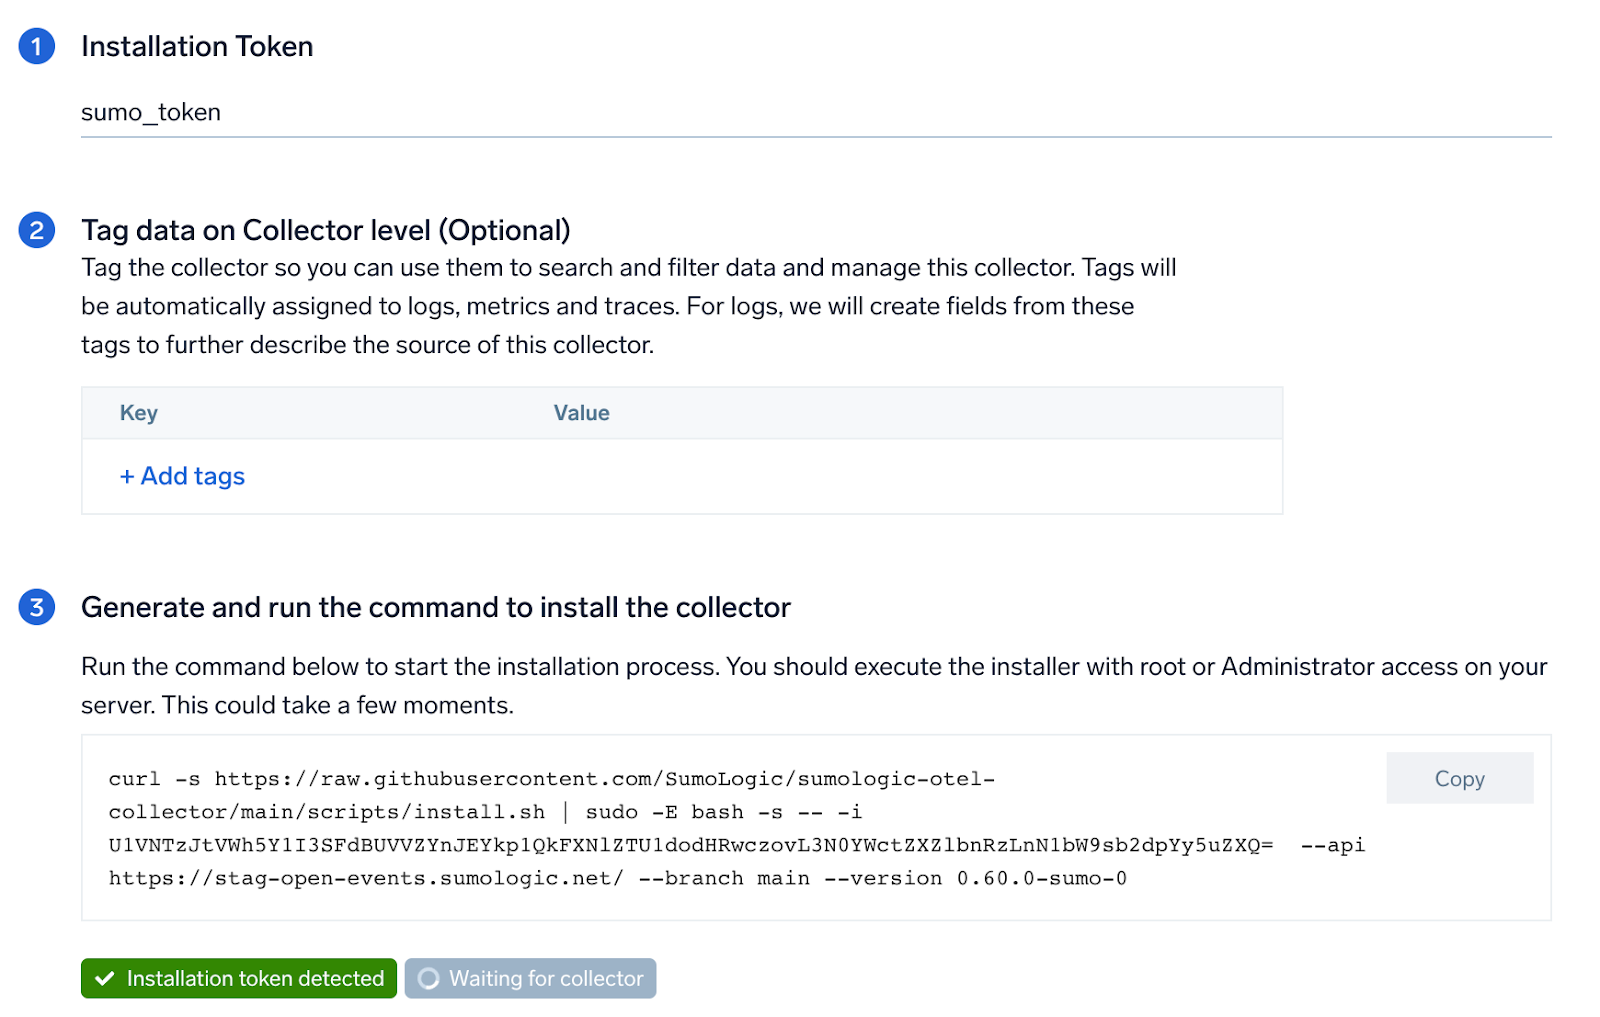
Step 1: Set up Collector
If you want to use an existing OpenTelemetry Collector, you can skip this step by selecting the Use an existing Collector option.
To create a new Collector:
- Select the Add a new Collector option.
- Select the platform where you want to install the Sumo Logic OpenTelemetry Collector.
This will generate a command that you can execute in the machine environment you need to monitor. Once executed, it will install the Sumo Logic OpenTelemetry Collector.
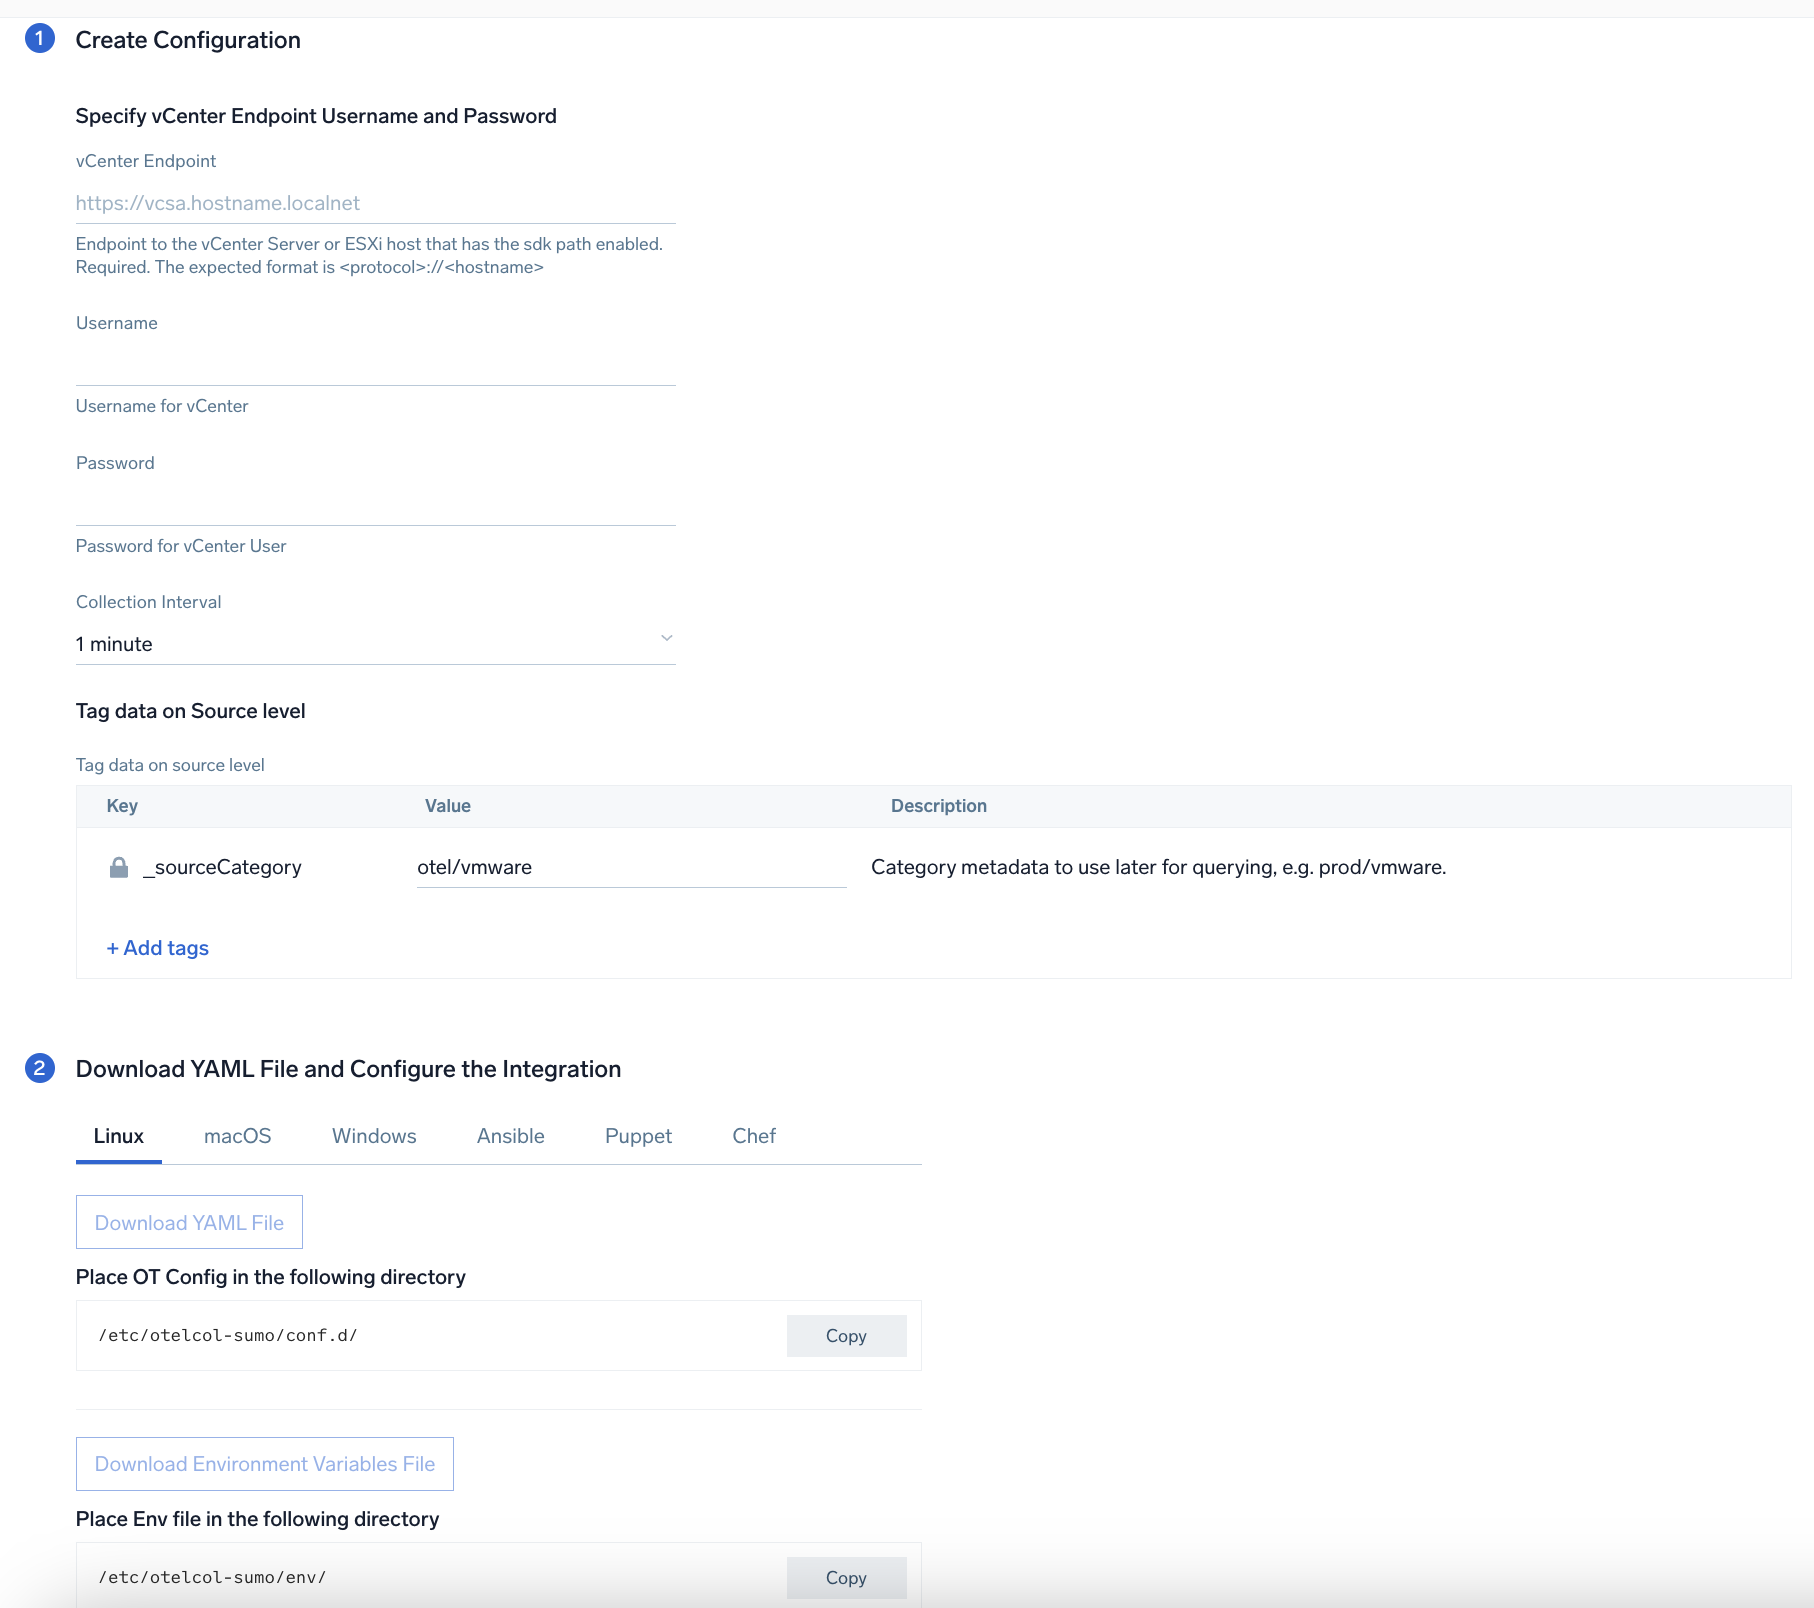
Step 2: Configure integration
In this step, we will configure the YAML file required for VMWare Collection. Here is a list of required parameters:
- Endpoint to the vCenter Server or ESXi host that has the SDK path enabled. This is a required parameter. The expected format is
<protocol>://<hostname>. For example,https://vcsa.hostname.localnet. - Username of User which has access to vCenter server.
- Password of User which has access to vCenter server.
- collection_interval this receiver collects metrics on an interval. If the vCenter is fairly large, this value may need to be increased. Valid time units are
ns,us(orµs),ms,s,m,h.
You can add any custom fields which you want to tag along with the data ingested in Sumo Logic. Click on the Download YAML File button to get the YAML file.
If you're using a username and password with OpenTelemetry Collector version ≥ 0.104, we recommend using the downloaded config with an environment variable, for example: ${environment_variable}.
On Linux, click Download Environment Variables File to get a file that includes the password, which should be set as an environment variable.
Step 3: Send logs to Sumo Logic
Once you have downloaded the YAML file as described in the previous step, follow the below steps based on your platform.
- Linux
- Windows
- macOS
- Chef
- Ansible
- Puppet
- Copy the YAML file to the
/etc/otelcol-sumo/conf.d/folder on the VMware instance that has access to vCenter or to vCenter itself. - Restart the collector using:
sudo systemctl restart otelcol-sumo
- Copy the YAML file to
C:\ProgramData\Sumo Logic\OpenTelemetry Collector\config\conf.dfolder in the VMWare instance which has access to vCenter or the vCenter itself. - Restart the collector using:
Restart-Service -Name OtelcolSumo
- Copy the YAML file to
/etc/otelcol-sumo/conf.d/folder on the VMware instance that has access to vCenter or to vCenter itself. - Restart the otelcol-sumo process using the below command:
otelcol-sumo --config /etc/otelcol-sumo/sumologic.yaml --config "glob:/etc/otelcol-sumo/conf.d/*.yaml"
- Copy the yaml file into your Chef cookbook files directory
files/<downloaded_yaml_file>. - Use a Chef file resource in a recipe to manage it.
cookbook_file '/etc/otelcol-sumo/conf.d/<downloaded_yaml_file>' do mode 0644 notifies :restart, 'service[otelcol-sumo]', :delayed end - Add the recipe to your collector setup to start collecting the data. Every team typically has their established way of applying the Chef recipe. The resulting Chef recipe should look something like:
cookbook_file '/etc/otelcol-sumo/conf.d/<downloaded_yaml_file>' do
mode 0644
notifies :restart, 'service[otelcol-sumo]', :delayed
end
- Place the file into your Ansible playbook files directory.
- Run the Ansible playbook.
ansible-playbook -i inventory install_sumologic_otel_collector.yaml
-e '{"installation_token": "<YOUR_TOKEN>", "collector_tags": {<YOUR_TAGS>}, "src_config_path": "files/conf.d"}'
- Place the file into your Puppet module files directory
modules/install_otel_collector/files/<downloaded_yaml>. - Use a Puppet file resource to manage it.
file { '/etc/otelcol-sumo/conf.d/<downloaded_yaml_file>':
    ensure => present,
    source => 'puppet:///modules/install_otel_collector/<downloaded_yaml_file>',
    mode => '0644',
    notify => Service[otelcol-sumo],
} - Apply the Puppet manifest. Every team typically has their established way of applying the Puppet manifest. The resulting Puppet manifest should look something like:
node 'default' {
    class { 'install_otel_collector'
      installation_token => '<YOUR_TOKEN>',
      collector_tags => { <YOUR_TAGS> },
    }

    service { 'otelcol-sumo':
      provider => 'systemd',
      ensure => running,
      enable => true,
      require => Class['install_otel_collector'],
    }

    file { '/etc/otelcol-sumo/conf.d/<downloaded_yaml_file>':
      ensure => present,
      source => 'puppet:///modules/install_otel_collector/<downloaded_yaml_file>',
      mode => '0644',
      notify => Service[otelcol-sumo],
    }
  }
After successfully executing the above command, Sumo Logic will start receiving data from your host machine.
Click Next. This will install the app (dashboards and monitors) to your Sumo Logic Org.
Dashboard panels will start to fill automatically. It's important to note that each panel fills with data matching the time range query and received since the panel was created. Results won't immediately be available, but within 20 minutes, you'll see full graphs and maps.
Sample queries
Metrics query
This sample query is from the VMWare - Overview > Top 25 ESXi Hosts - CPU Utilization panel.
sumo.datasource=vmware metric=vcenter.host.cpu.utilization vcenter.datacenter.name=* vcenter.cluster.name=* vcenter.host.name=* | topk(25,avg)
Sample metrics
Metric message
{
  "queryId": "A",
  "_source": "WIN-U8TUICHO2JM",
  "_metricId": "-nHlUFTEN-e35PT8M0bW4Q",
  "_sourceName": "vmware",
  "host.group": "sumovmware",
  "os.type": "windows",
  "sumo.datasource": "vmware",
  "_sourceCategory": "otel/vmware",
  "deployment.environment": "sumovmware",
  "_contentType": "OpenTelemetry",
  "host.name": "WIN-U8TUICHO2JM",
  "metric": "vcenter.host.cpu.utilization",
  "_collectorId": "00005AF310C86B33",
  "vcenter.datacenter.name": "Production",
  "_sourceId": "0000000000000000",
  "unit": "%",
  "vcenter.cluster.name": "Prod Cluster",
  "_sourceHost": "WIN-U8TUICHO2JM",
  "_collector": "WIN-U8TUICHO2JM",
  "vcenter.host.name": "esx1.esxlab.com",
  "max": 45.76,
  "min": 0,
  "avg": 5.65,
  "sum": 1621.41,
  "latest": 0,
  "count": 287
}
Viewing VMWare dashboards
You can filter data on VMWare dashboards with template variables. Template variables provide dynamic dashboards that rescope data on the fly. As you apply variables to troubleshoot through your dashboard, you can view dynamic changes to the data for a fast resolution to the root cause. For more information, see Filtering Dashboards with Template Variables.
VMWare - Overview
The VMWare - Overview dashboard provides an at-a-glance view of unique clusters, ESXi hosts, and unique VMs. It also provides data for datastore disk utilisation, VM disk usage, CPU Utilization, Memory Utilization, and Network Usage for VMs and Hosts.
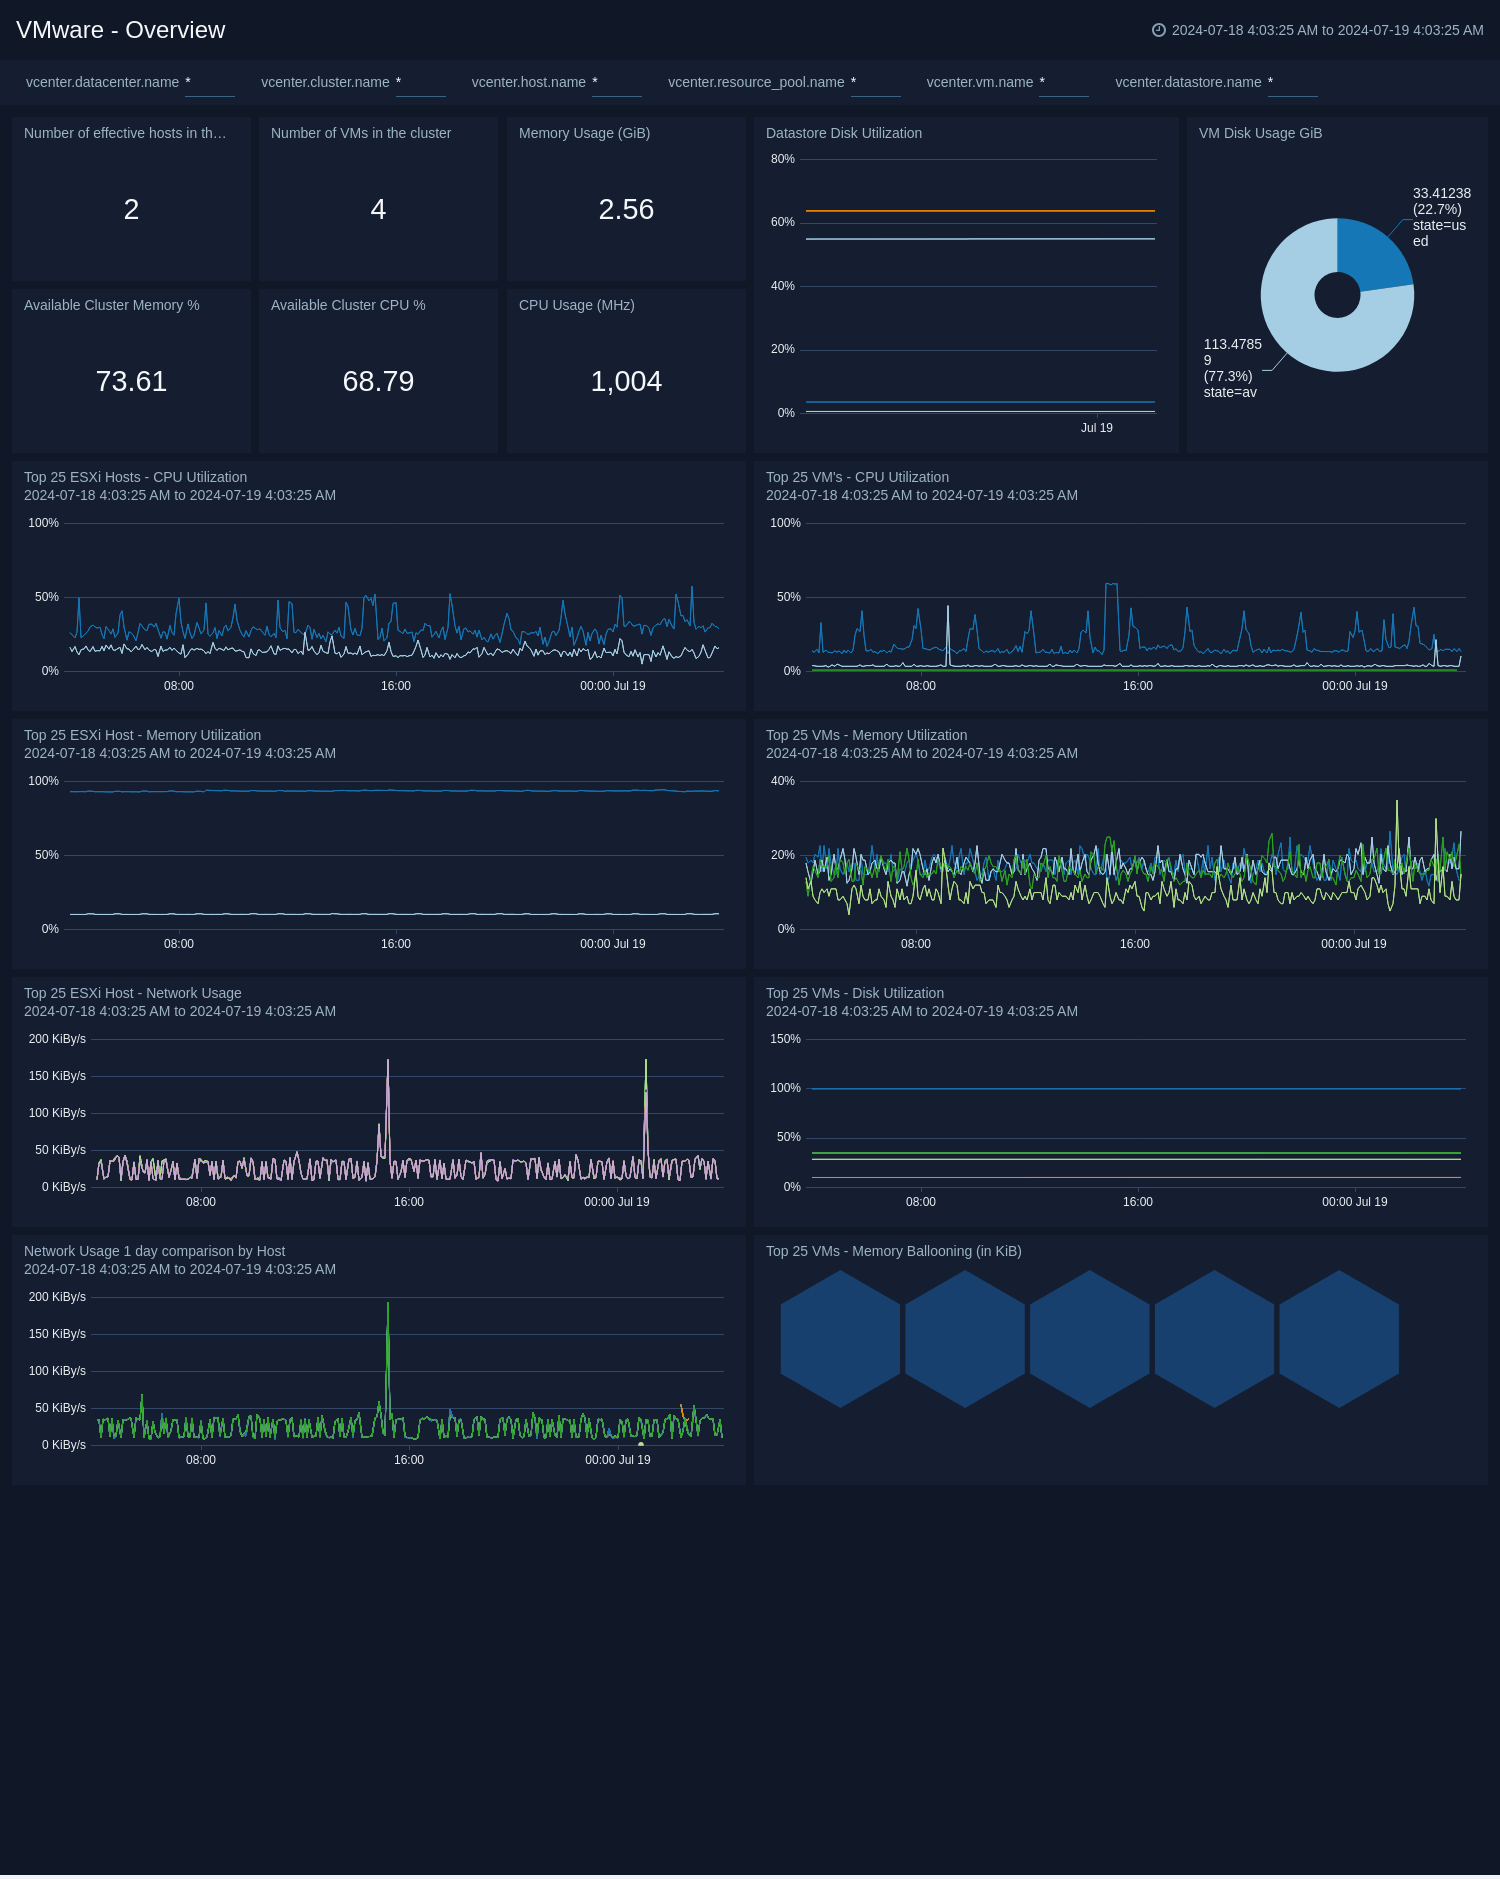
- Number of ESXi Hosts in Cluster. The total number of ESXi hosts in the cluster.
- Number of VMs in Cluster. The total number of VMs in the cluster.
- Available Cluster Memory. Percentage of memory available in the cluster.
- Available Cluster CPU. Percentage of CPU available in the cluster.
- Datastore Disk Utilization. The disk utilization of the datastore.
- VM Disk Usage. The disk usage of VM.
- Top 25 ESXi Hosts CPU Utilization. Top 25 ESXi Hosts CPU utilization.
- Top 25 ESXi Hosts Memory Utilization. Top 25 ESXi Hosts memory utilization.
- Top 25 ESXi Hosts Network Usage. Top 25 ESXi Hosts usage.
- Top 25 VMs CPU Utilization. Top 25 VMs CPU utilization.
- Top 25 VMs Memory Utilization. Top 25 VMs memory utilization.
- Top 25 VMs Network Usage. Top 25 VMs network usage.
- Top 25 VMs Memory Ballooning. Top 25 VMs memory ballooning.
VMWare - Clusters
The VMWare - Clusters dashboard provides at-a-glance analysis of VMWare cluster metrics like Hosts count, VM count, available CPU, and Memory percentage.
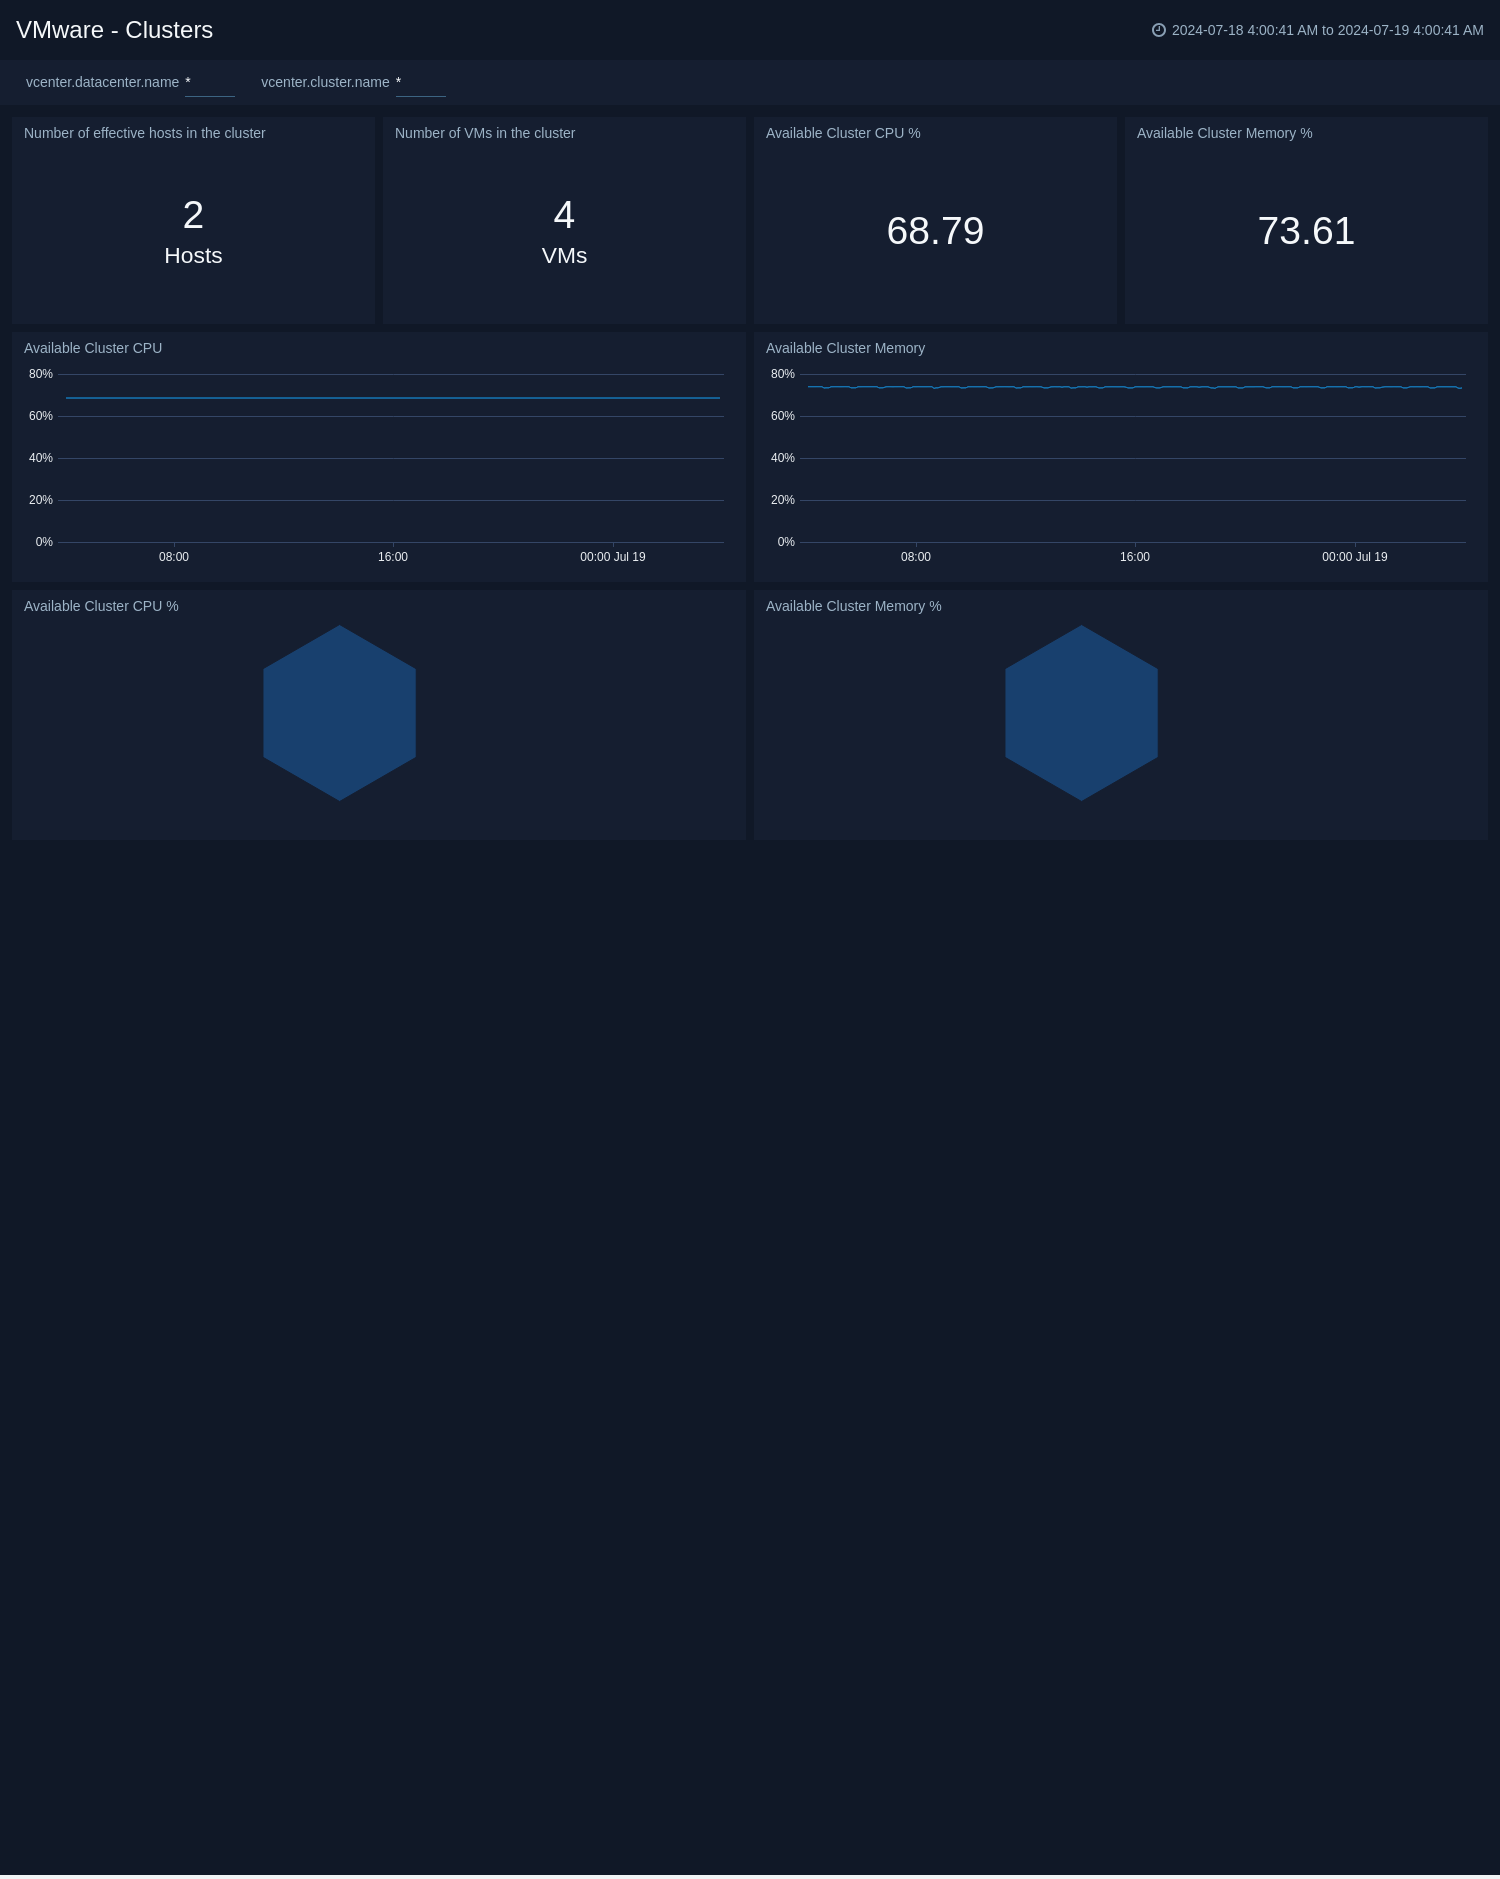
- Number of ESXi Hosts in Cluster. The total number of ESXi hosts in the cluster.
- Number of VMs in Cluster. The total number of VMs in the cluster.
- Available Cluster CPU. Percentage of CPU available in the cluster.
- Available Cluster Memory. Percentage of Memory available in the cluster.
VMWare - Resource Pools
The VMWare - Resource Pools dashboard provides an at-a-glance analysis of Resource Pool metrics like Memory Usage, CPU Usage, Shares of CPU, and Memory.
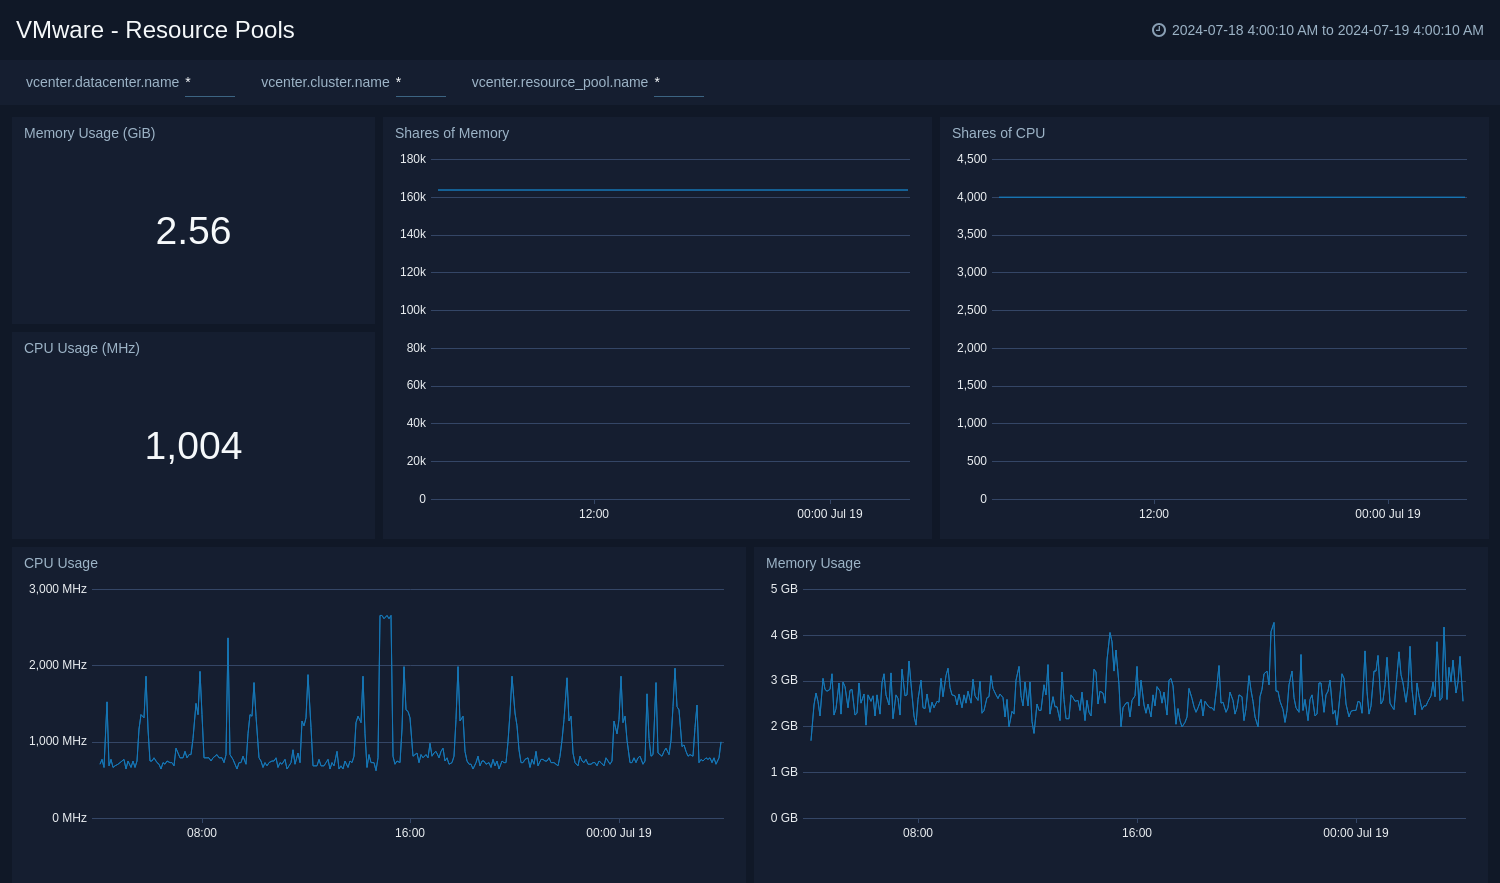
- Cluster CPU Usage. CPU usage of the resource pool.
- Cluster Memory Usage. Memory usage of the resource pool.
- Shares of CPU. Shares of CPU in the resource pool.
- Shares of Memory. Shares of Memory in the resource pool.
VMWare - Host Overview
The VMWare - Host Overview dashboard provides at-a-glance analysis of ESXi Hosts metrics like CPU Utilization, Memory Utilization, Read/ Write Latency, and Network Usage.
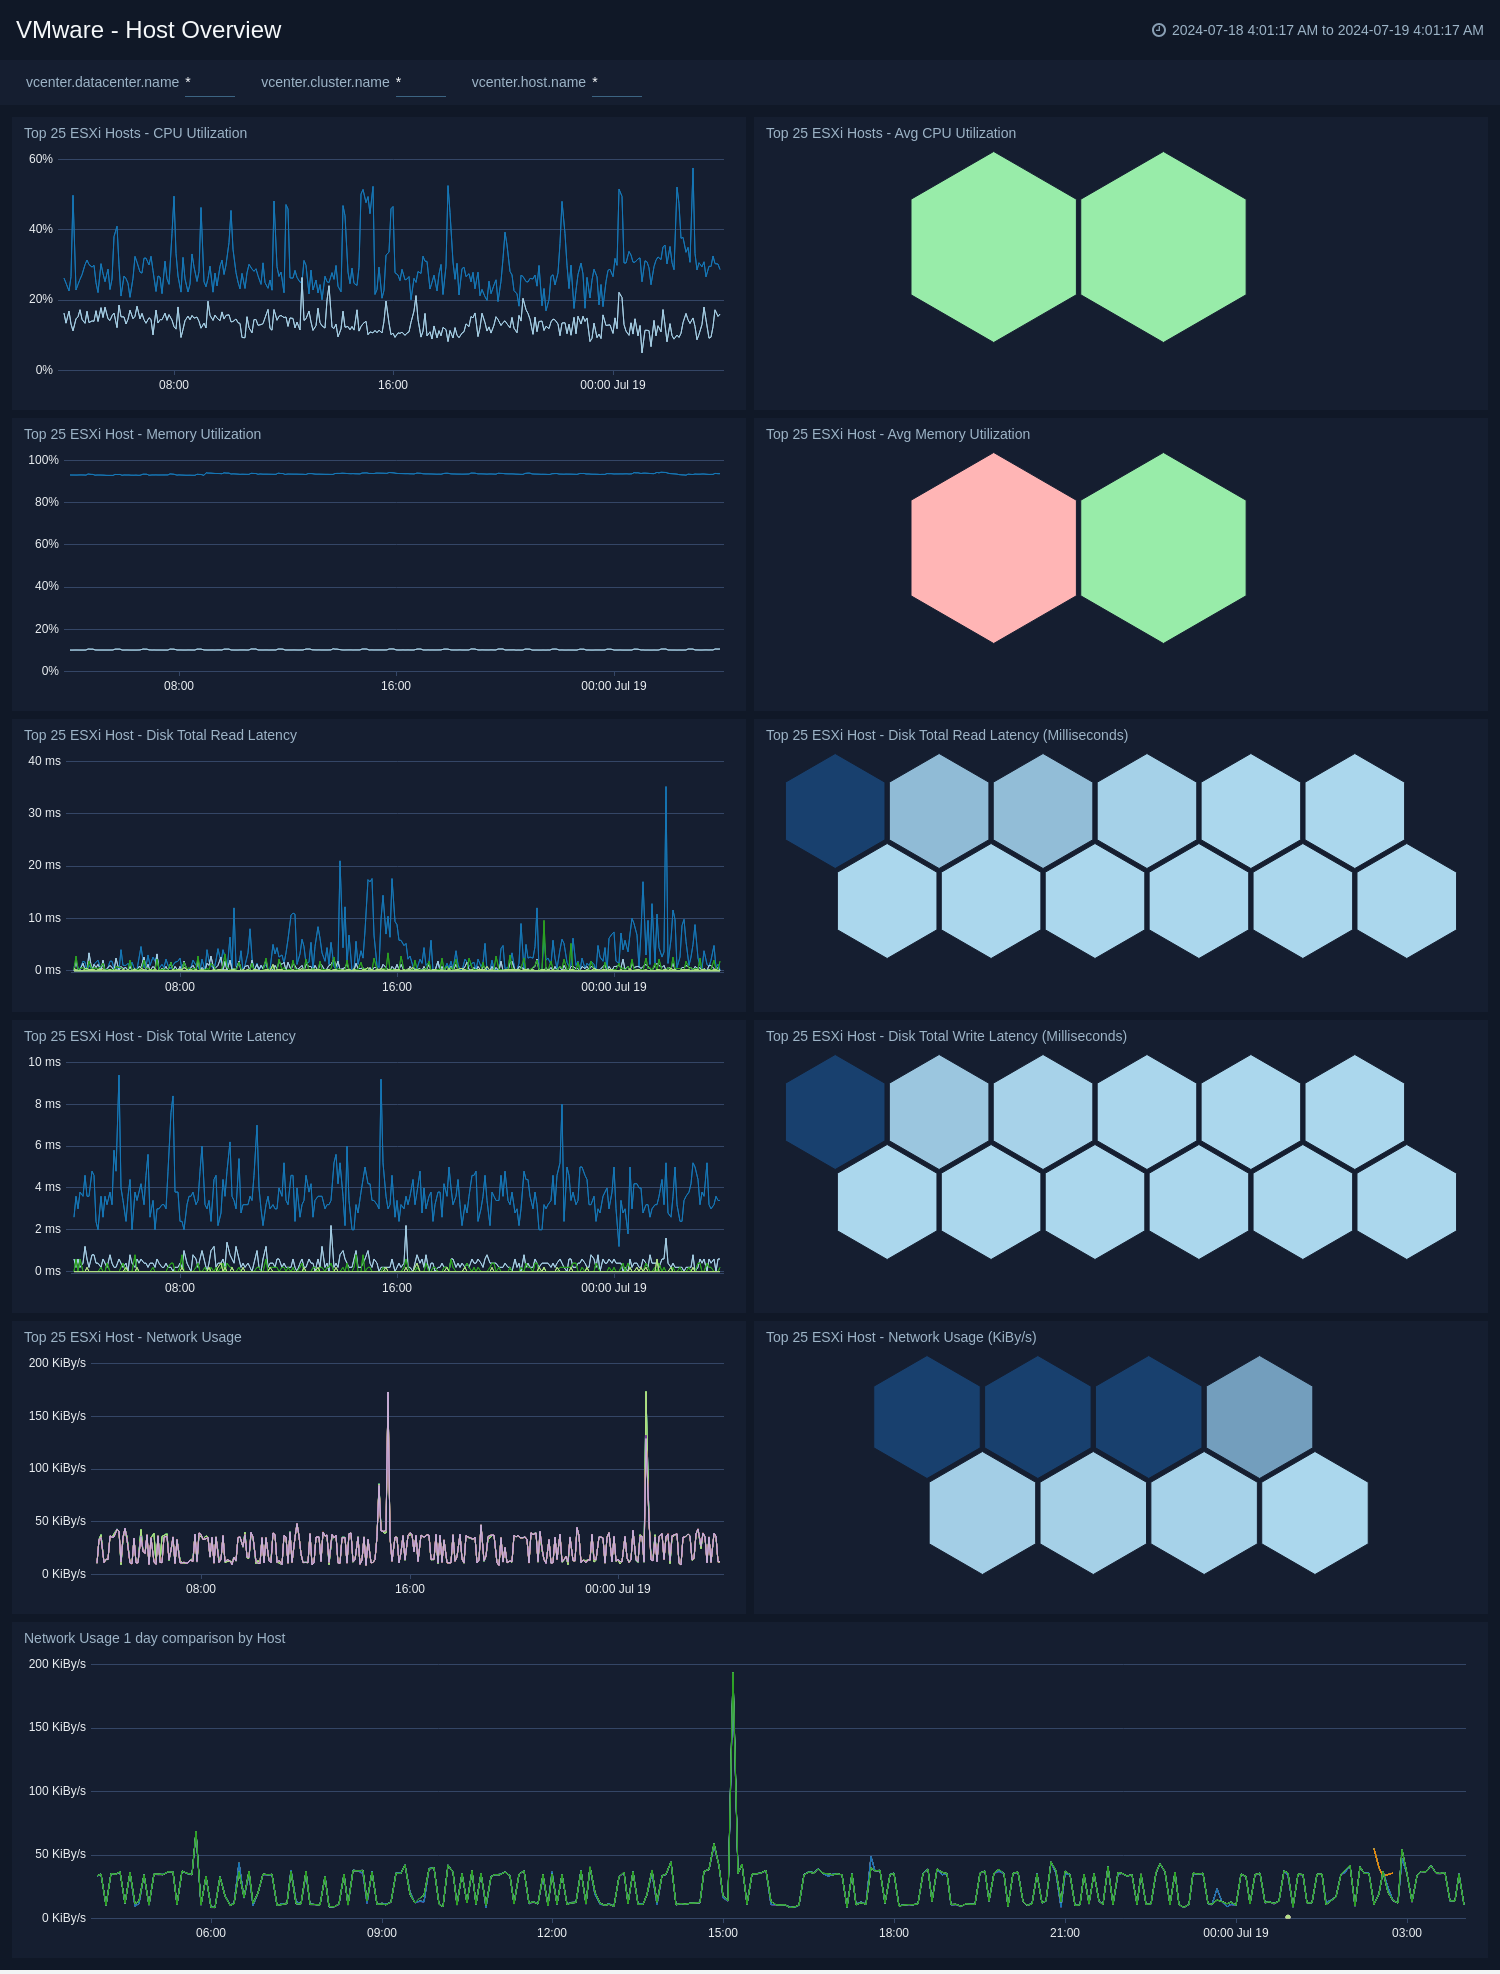
- Top 25 ESXi Hosts CPU Utilization. Top 25 ESXi Hosts CPU Utilization.
- Top 25 ESXi Hosts Memory Utilization. Top 25 ESXi Hosts Memory Utilization.
- Top 25 ESXi Hosts Network Usage. Top 25 ESXi Hosts Network Usage.
- Top 25 ESXi Hosts Disk Read/ Write Latency. Top 25 ESXi Hosts Disk read/ write latency.
- Host Memory Capacity. Total memory capacity of the host systems being monitored.
VMWare - Host Details
The VMWare - Host Details dashboard provides detailed analysis of ESXi Hosts metrics like CPU Usage, Memory Usage, Disk Read/ Write Rate, Network Usage, Network Packet Rate, and Network Packet Error Rate.
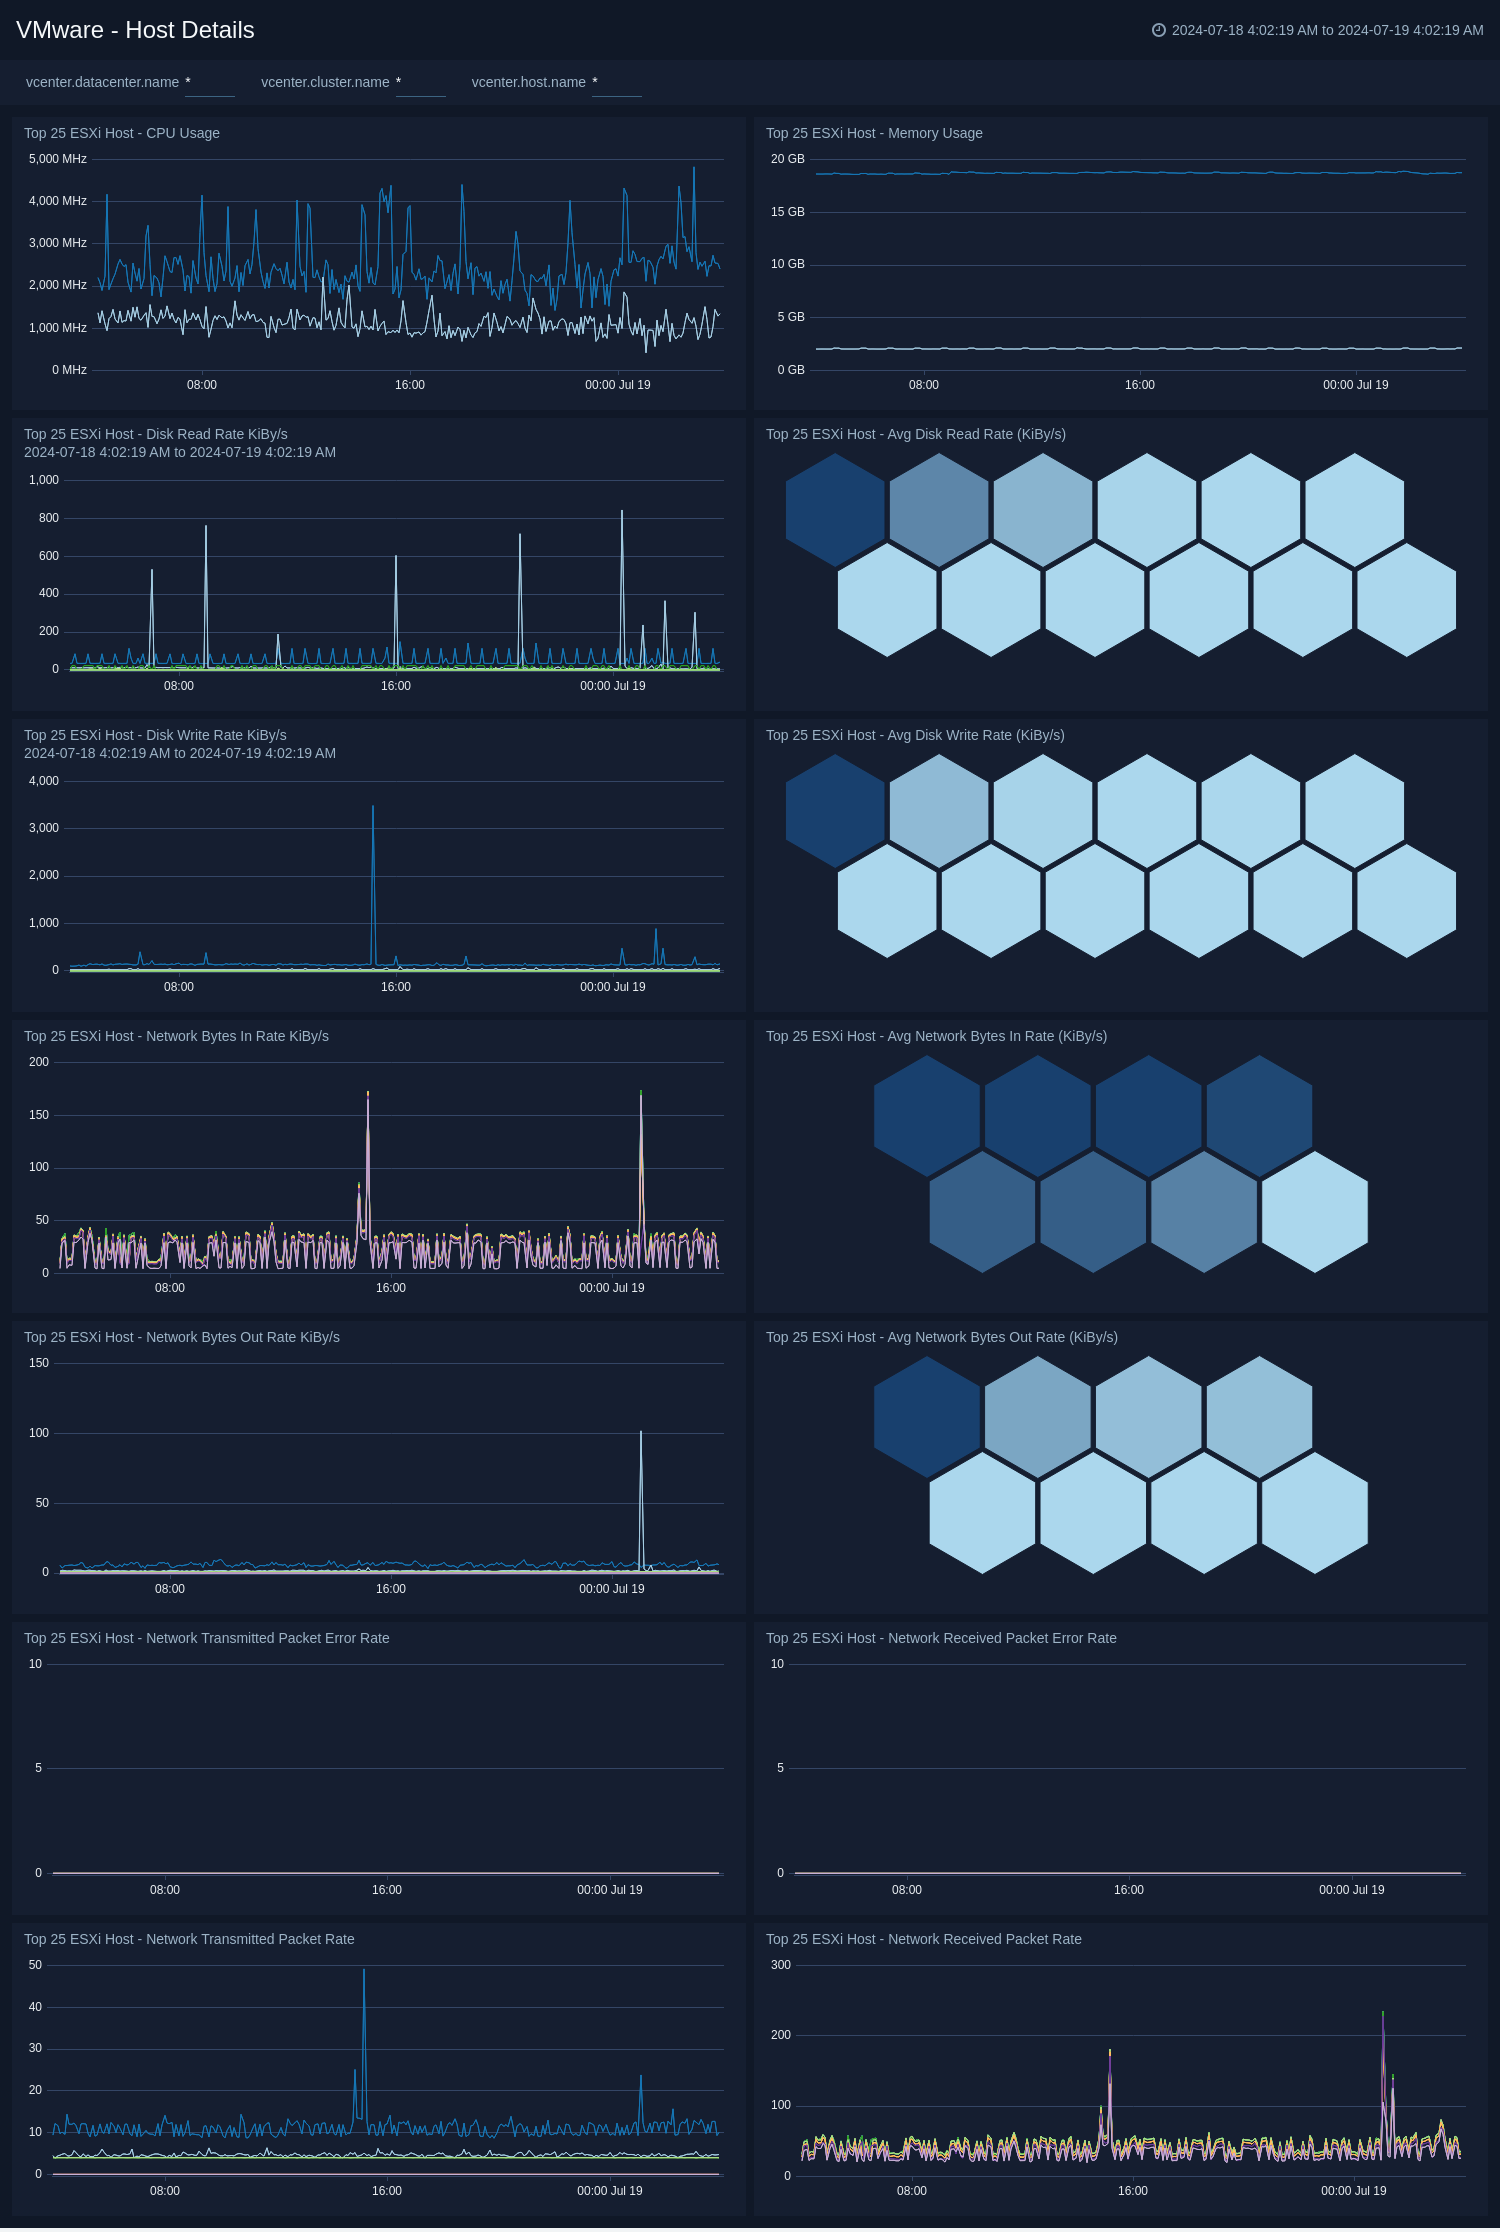
- Top 25 ESXi Hosts CPU Usage. Top 25 ESXi Hosts CPU usage.
- Top 25 ESXi Hosts Disk Read/ Write Rate. Top 25 ESXi Hosts Disk read/ write rate.
- Top 25 ESXi Hosts Network Throughput. Top 25 ESXi Hosts Network throughput.
- Top 25 ESXi Hosts Network Packet Rate. Top 25 ESXi Hosts Network transmitted/ received packet rate.
- Top 25 ESXi Hosts Network Packet Error Rate. Top 25 ESXi Hosts Network transmitted/ received packet error rate.
VMWare - VM Overview
The VMWare - VM Overview dashboard provides an at-a-glance analysis of VM metrics like CPU Utilization, Memory Utilization, Disk Utilization, Network Usage, and Disk Usage.
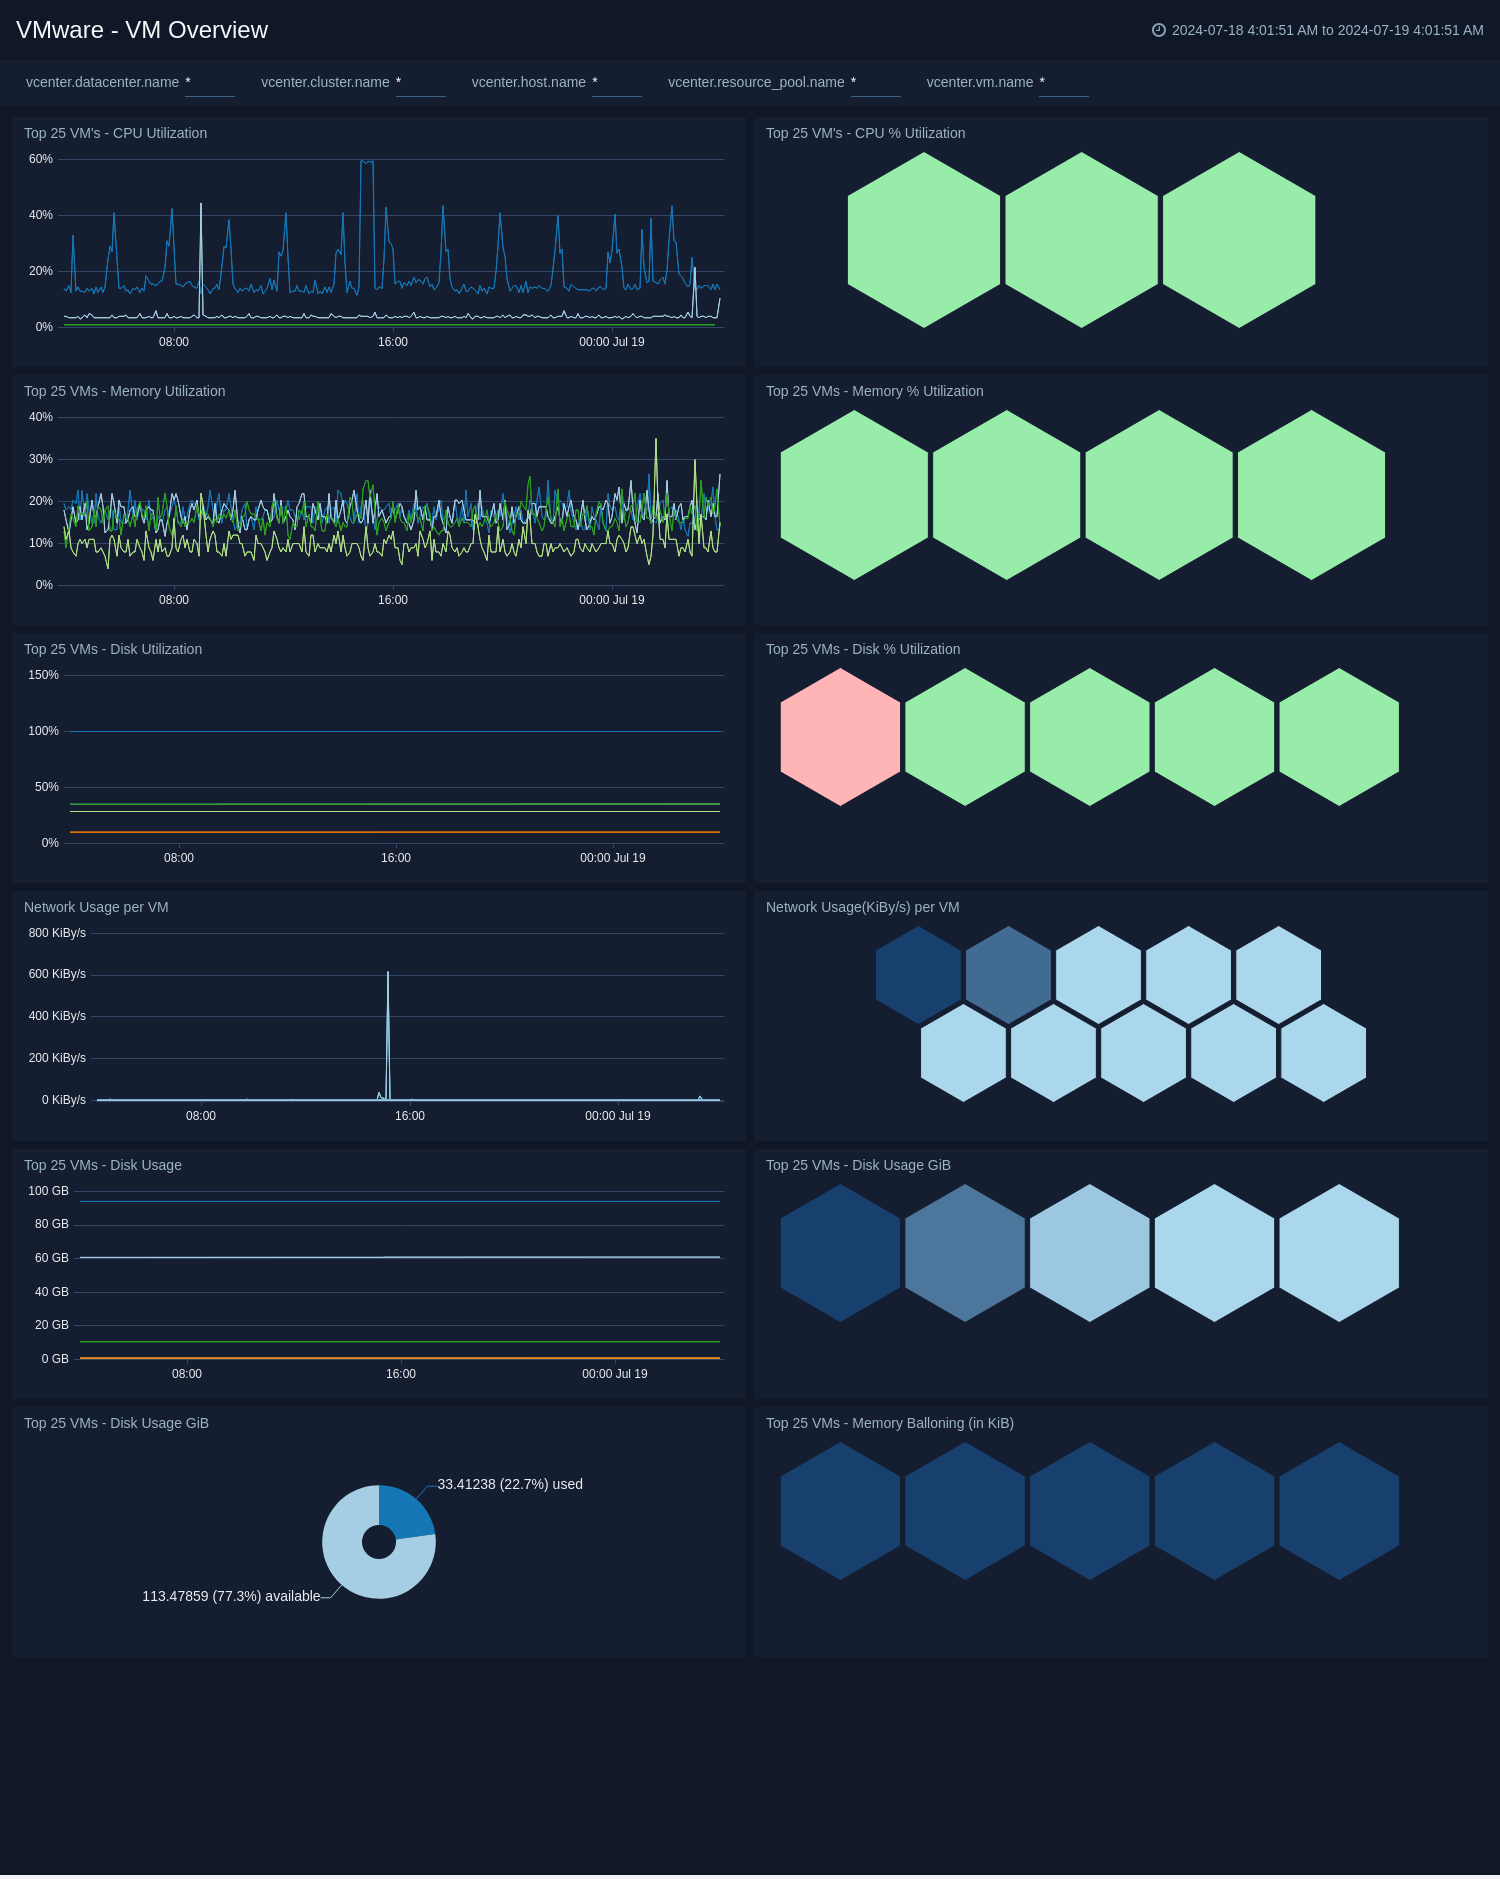
- Top 25 VMs CPU Utilization. Top 25 VMs CPU utilization.
- Top 25 VMs Memory Utilization. Top 25 VMs Memory utilization.
- Top 25 VMs Disk Utilization. Top 25 VMs Disk utilization.
- Top 25 VMs Network Usage. Top 25 VMs Network usage.
- Top 25 VMs Disk Usage. Top 25 VMs Disk usage.
- Top 25 VMs Memory Ballooning. Top 25 VMs Memory Ballooning.
- VM CPU Time. CPU time spent in idle, ready or wait state in %.
VMWare - VM Details
The VMWare - VM Details dashboard provides a detailed analysis of VM metrics like CPU Usage, Memory Usage, Read/Write Latency, Network Packet Rate, and Memory Swapped.
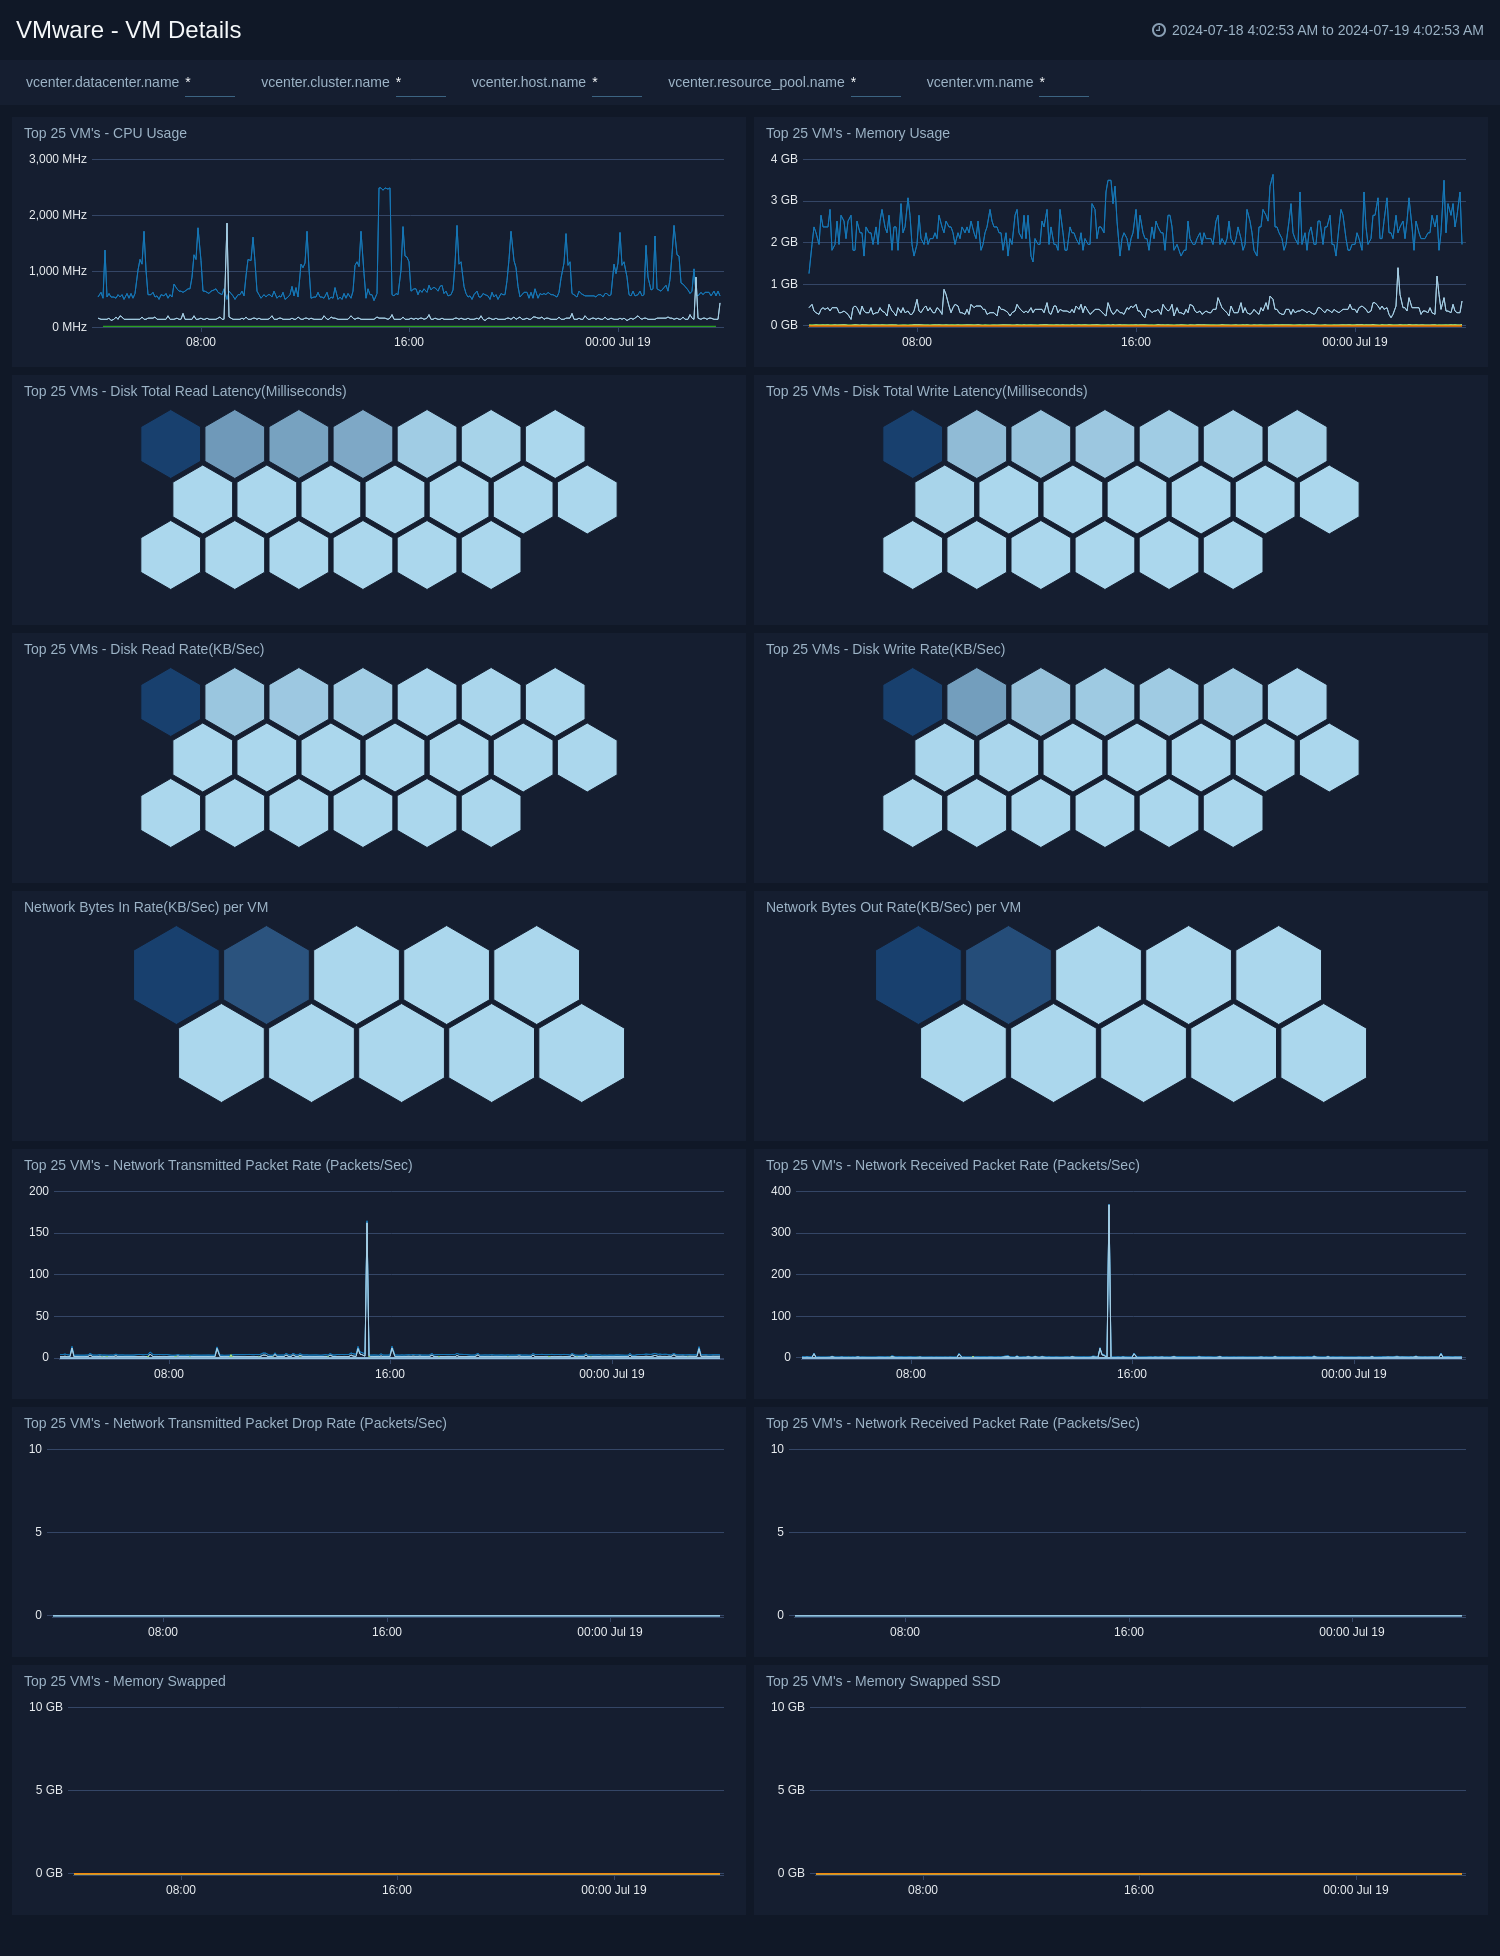
- Top 25 VMs CPU Usage. Top 25 VMs CPU usage.
- Top 25 VMs Memory Usage. Top 25 VMs Memory usage.
- Top 25 VMs Disk Read/ Write Latency. Top 25 VMs Disk read/write latency.
- Top 25 VMs Disk Read/ Write Rate. Top 25 VMs Disk read/write rate.
- Top 25 VMs Network Throughput. Top 25 VMs Network throughput.
- Top 25 VMs Network Packet Rate. Top 25 VMs Network transmitted/received packet rate.
- Top 25 VMs Network Packet Drop Rate. Top 25 VMs Network transmitted/received packet drop rate.
- Top 25 VMs Memory Swapped. Top 25 VMs Memory swapped.
- VM Memory Granted. The amount of memory that is granted to a VM.
Create monitors for VMWare app
From your App Catalog:
- From the Sumo Logic navigation, select App Catalog.
- In the Search Apps field, search for and then select your app.
- Make sure the app is installed.
- Navigate to What's Included tab and scroll down to the Monitors section.
- Click Create next to the pre-configured monitors. In the create monitors window, adjust the trigger conditions and notifications settings based on your requirements.
- Scroll down to Monitor Details.
- Under Location click on New Folder.
note
By default, monitor will be saved in the root folder. So to make the maintenance easier, create a new folder in the location of your choice.
- Enter Folder Name. Folder Description is optional.
tip
Using app version in the folder name will be helpful to determine the versioning for future updates.
- Click Create. Once the folder is created, click on Save.
VMWare alerts
| Name | Description | Alert Condition | Recover Condition |
|---|---|---|---|
VMware - Datastore High Utilization | This alert is triggered when datastore usage is approaching capacity. | Count >= 90 | Count < 90 |
VMware - High Virtual Disk Read Latency | This alert gets triggered on high virtual datastore read latency indicating storage performance issues. | Count >= 20 | Count < 20 |
VMware - High Virtual Disk Write Latency | This alert gets triggered on high virtual datastore write latency indicating storage performance issues. | Count >= 20 | Count < 20 |
VMware - Host CPU High Utilization | This alert is triggered when host CPU utilization is consistently high, which may impact VM performance. | Count >= 90 | Count < 90 |
VMware - Host Memory Utilization | This alert is triggered when host memory utilization is consistently high. | Count >= 95 | Count < 95 |
VMware - VM CPU Ready Time High | This alert gets triggered when VMs are waiting too long for CPU resources, indicating CPU contention. | Count >= 10 | Count < 10 |
VMware - VM Memory Balloon Pressure | This alert gets triggered when VMs are experiencing significant memory ballooning. | Count >= 1024 | Count < 1024 |