RabbitMQ - Classic Collector

The RabbitMQ app is a unified logs and metrics app that helps you monitor the availability, performance, health, and resource utilization of your RabbitMQ messaging clusters. Preconfigured dashboards provide insight into cluster status, exchanges, queues, nodes and error logs.
Sample log messages
- Kubernetes environments
- Non-Kubernetes environments
{
    "Timestamp":1623650644120,
     "log":"2021-06-14 06:04:02.885 [debug] <0.3106.0> Asked to [re-]register this node   (rabbit@rabbitmq-1) with epmd...",
     "Stream":"stdout",
     "time":"2021-06-14T06:04:04.115318516Z"
}
2021-06-14 12:59:00.004 [debug] <0.29866.49> User 'guest' authenticated successfully by backend rabbit_auth_backend_internal
Host: broker-1 Name: /var/log/rabbitmq/rabbit.log Category: logfile
Collecting logs and metrics for RabbitMQ
This section provides instructions for configuring log and metric collection for the Sumo Logic App for RabbitMQ.
Configure collection for RabbitMQ
Sumo Logic supports collection of logs and metrics data from RabbitMQ in both Kubernetes and non-Kubernetes environments.
Please click on the appropriate links below based on the host environment.
- Kubernetes environments
- Non-Kubernetes environments
In Kubernetes environments, we use the Telegraf Operator, which is packaged with our Kubernetes collection. You can learn more about it here.The diagram below illustrates how data is collected from RabbitMQ in a Kubernetes environment. In the architecture shown below, there are four services that make up the metric collection pipeline: Telegraf, Telegraf Operator, Prometheus, and Sumo Logic Distribution for OpenTelemetry Collector.
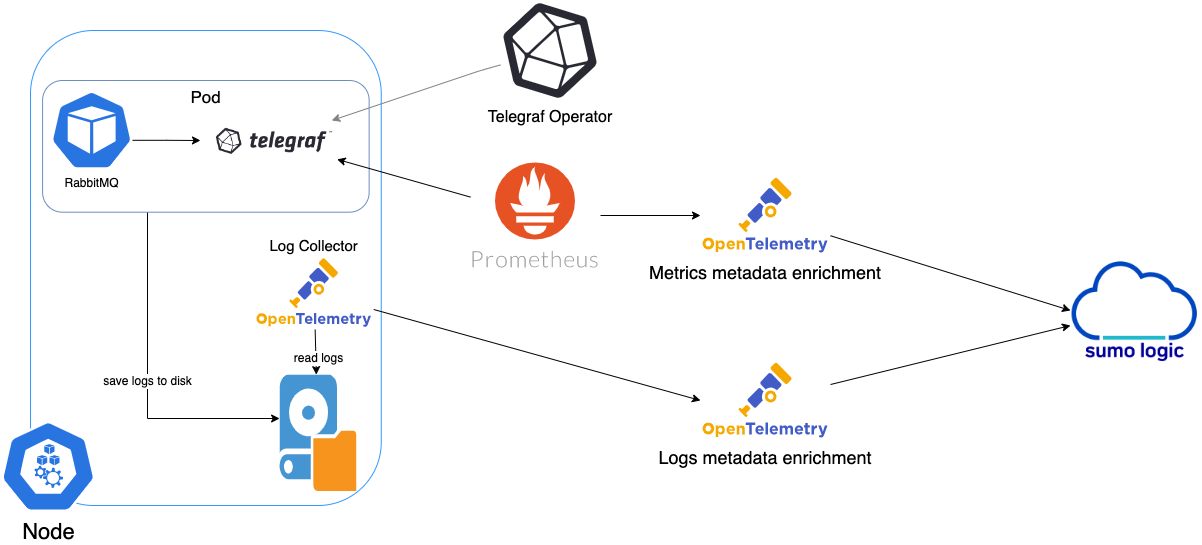
The first service in the metrics pipeline is Telegraf. Telegraf collects metrics from RabbitMQ. Note that we’re running Telegraf in each pod we want to collect metrics from as a sidecar deployment for example, Telegraf runs in the same pod as the containers it monitors. Telegraf uses the RabbitMQ input plugin to obtain metrics. (For simplicity, the diagram doesn’t show the input plugins.) The injection of the Telegraf sidecar container is done by the Telegraf Operator. Prometheus pulls metrics from Telegraf and sends them to Sumo Logic Distribution for OpenTelemetry Collector which enriches metadata and sends metrics to Sumo Logic.
In the logs pipeline, Sumo Logic Distribution for OpenTelemetry Collector collects logs written to standard out and forwards them to another instance of Sumo Logic Distribution for OpenTelemetry Collector, which enriches metadata and sends logs to Sumo Logic.
It’s assumed that you are using the latest helm chart version. If not, upgrade using the instructions here.
Configure Metrics Collection
This section explains the steps to collect RabbitMQ metrics from a Kubernetes environment.
In Kubernetes environments, we use the Telegraf Operator, which is packaged with our Kubernetes collection. You can learn more on this here. Follow the steps listed below to collect metrics from a Kubernetes environment:
- Set up Kubernetes Collection with the Telegraf Operator
- On your RabbitMQ Pods, add the following annotations:
 annotations:
    telegraf.influxdata.com/class: sumologic-prometheus
    prometheus.io/scrape: "true"
    prometheus.io/port: "9273"
    telegraf.influxdata.com/inputs: |+
      [[inputs.rabbitmq]]
        url = "http://localhost:15672"
        username = "<username_CHANGE_ME>"
        password = "<password_CHANGE_ME>"
        insecure_skip_verify = false
        queue_name_include = []
        queue_name_exclude = []
      [inputs.rabbitmq.tags]
        environment="prod_CHANGE_ME"
        component="messaging"
        messaging_system="rabbitmq"
        messaging_cluster="rabbitmq_on_k8s_CHANGE_ME"
Please enter values for the following parameters (marked in CHANGE_ME above):
telegraf.influxdata.com/inputs. This contains the required configuration for the Telegraf RabbitMQ Input plugin. Please refer to this doc for more information on configuring the RabbitMQMongoDB input plugin for Telegraf. Note: As telegraf will be run as a sidecar the host should always be localhost.- In the input plugins section [
[inputs.rabbitmq]]:url- The URL of the RabbitMQ server for Management HTTP Endpoint. Please see this doc for more information on additional parameters for configuring the RabbitMQ input plugin for Telegraf.username: The Username of RabbitMQ's admin account. The default is“guest”.password: The password of RabbitMQ's admin account. The default is“guest”.
- In the tags section
[inputs.rabbitmq.tags]:environment. This is the deployment environment where the RabbitMQ cluster identified by the value ofserversresides. For example: dev, prod or qa. While this value is optional we highly recommend setting it.messaging_cluster- Enter a name to identify this RabbitMQ cluster. This cluster name will be shown in the Sumo Logic dashboards.
- In the input plugins section [
Do not modify the following values set by this configuration as it will cause the Sumo Logic app to not function correctly.
telegraf.influxdata.com/class: sumologic-prometheus. This instructs the Telegraf operator what output to use. This should not be changed.prometheus.io/scrape: "true". This ensures our Prometheus will scrape the metrics.prometheus.io/port: "9273". This tells prometheus what ports to scrape on. This should not be changed.telegraf.influxdata.com/inputs- In the tags section,
[inputs.rabbitmq.tags]:component: “messaging”- This value is used by Sumo Logic apps to identify application components.messaging_system: “rabbitmq”- This value identifies the messaging system.
- In the tags section,
For all other parameters, see this doc for more parameters that can be configured in the Telegraf agent globally.
- Sumo Logic Kubernetes collection will automatically start collecting metrics from the pods having the labels and annotations defined in the previous step.
- Verify metrics in Sumo Logic.
Configure Logs Collection
This section explains the steps to collect RabbitMQ logs from a Kubernetes environment.
- Add labels on your RabbitMQ pods to capture logs from standard output. Make sure that the logs from RabbitMQ are sent to stdout. For more details see this doc. Follow the instructions below to capture RabbitMQRabbitMQ logs from stdout on Kubernetes.
- Apply following labels to the RabbitMQ pods:
environment: "prod_CHANGE_ME"
 component: "messaging"
 messaging_system: "rabbitmq"
    messaging_cluster: "rabbitmq_on_k8s_CHANGE_ME"
Enter in values for the following parameters (marked CHANGE_ME above):
environment. This is the deployment environment where the RabbitMQ cluster identified by the value ofserversresides. For example: dev, prod or qa. While this value is optional we highly recommend setting it.messaging_cluster. Enter a name to identify this RabbitMQ cluster. This cluster name will be shown in the Sumo Logic dashboards.
Do not modify the following values as it will cause the Sumo Logic app to not function correctly.
component: “messaging”. This value is used by Sumo Logic apps to identify application components.messaging_system: “rabbitmq”. This value identifies the messaging system.
For all other parameters see this doc for more parameters that can be configured in the Telegraf agent globally.
- (Optional) Collecting RabbitMQ Logs from a Log File. Follow the steps below to capture RabbitMQ logs from a log file on Kubernetes.
- Determine the location of the RabbitMQ log file on Kubernetes. This can be determined from the RabbitMQ.conf for your RabbitMQ cluster along with the mounts on the RabbitMQ pods.
- Install the Sumo Logic tailing sidecar operator.
- Add the following annotation in addition to the existing annotations.
Example:annotations:
tailing-sidecar: sidecarconfig;<mount>:<path_of_RabbitMQ_log_file>/<RabbitMQ_log_file_name>annotations:
tailing-sidecar: sidecarconfig;data:/var/log/rabbitmq/rabbitmq.log- Make sure that the RabbitMQ pods are running and annotations are applied by using the command:
kubectl describe pod <RabbitMQ_pod_name>
- Sumo Logic Kubernetes collection will automatically start collecting logs from the pods having the annotations defined above.
- FER to normalize the fields in Kubernetes environments. Labels created in Kubernetes environments automatically are prefixed with
pod_labels. To normalize these for our app to work, a Field Extraction Rule named AppObservabilityMessagingRabbitMQFER is automatically created.
In non-Kubernetes environments, we use the Telegraf operator for RabbitMQ metric collection and Sumo Logic Installed Collector for collecting RabbitMQ logs. The diagram below illustrates the components of the RabbitMQ collection in a non-Kubernetes environment. Telegraf runs on the same system as RabbitMQ, and uses the RabbitMQ input plugin to obtain RabbitMQ metrics, and the Sumo Logic output plugin to send the metrics to Sumo Logic. Logs from RabbitMQ on the other hand are sent to either a Sumo Logic Local File source.
This section provides instructions for configuring metrics collection for the Sumo Logic App for RabbitMQ. Follow the below instructions to set up collection:
Configure Metrics Collection
- Configure a Hosted Collector
- Configure an HTTP Logs and Metrics Source
- Install Telegraf
- Configure and start Telegraf
Configure Logs Collection
- Configure logging in RabbitMQ
- Configure local log file collection
- Configure a Collector
- Configure a Source
Configure Metrics Collection
- Configure a Hosted Collector. To create a new Sumo Logic hosted collector, perform the steps in the Configure a Hosted Collector section of the Sumo Logic documentation.
- Configure an HTTP Logs and Metrics Source. Create a new HTTP Logs and Metrics Source in the hosted collector created above by following these instructions. Make a note of the HTTP Source URL.
- Install Telegraf. Use the following steps to install Telegraf.
- Configure and start Telegraf. As part of collecting metrics data from Telegraf, we will use the RabbitMQ input plugin to get data from Telegraf and the Sumo Logic output plugin to send data to Sumo Logic.
Before you configure telegraf, you will need to enable: Reads metrics from RabbitMQ servers via the Management Plugin.
Enable the RabbitMQ management plugins by running the command below on every node:
sudo rabbitmq-plugins enable rabbitmq_management
sudo systemctl restart rabbitmq-server
Create or modify telegraf.conf and copy and paste the text below:
[[inputs.rabbitmq]]
           url = "http://localhost:15672"
           username = "<username_CHANGE_ME>"
           password = "<password_CHANGE_ME>"
           insecure_skip_verify = false
           queue_name_include = []
           queue_name_exclude = []
           [inputs.rabbitmq.tags]
             environment="prod_CHANGE_ME"
             component="messaging"
             messaging_system="rabbitmq"
             messaging_cluster="rabbitmq_onprem_CHANGE_ME"

[[outputs.sumologic]]
  url = "<URL Created in Step b>"
  data_format = "prometheus"
Please enter values for the following parameters (marked CHANGEME above):
- In the input plugins section, which is
[[inputs.rabbitmq]]:url- The URL of the RabbitMQ server for Management HTTP Endpoint. Please see this doc for more information on additional parameters for configuring the RabbitMQ input plugin for Telegraf.username. The Username of RabbitMQ's admin account . The default is “guest”.password. The password of RabbitMQ's admin account. The default is “guest”.- In the tags section, that is
[inputs.rabbitmq.tags]environment. This is the deployment environment where the RabbitMQ cluster identified by the value ofserversresides. For example: dev, prod or qa. While this value is optional we highly recommend setting it.messaging_cluster. Enter a name to identify this RabbitMQ cluster. This cluster name will be shown in the Sumo Logic dashboards.
- In the output plugins section, that is
[[outputs.sumologic]]:url- This is the HTTP source URL created in step 3. Please see this doc for more information on additional parameters for configuring the Sumo Logic Telegraf output plugin.
Do not modify the following values set by this Telegraf configuration as it will cause the Sumo Logic app to not function correctly.
data_format - “prometheus”In the output plugins section, which is[[outputs.sumologic]]. Metrics are sent in the Prometheus format to Sumo Logic.component: “messaging”- In the input plugins section, which is[[inputs.RabbitMQ]]. This value is used by Sumo Logic apps to identify application components.messaging_system: “rabbitmq”- In the input plugins sections.In other words, this value identifies the messaging system
For all other parameters, see this doc for more parameters that can be configured in the Telegraf agent globally.
Once you have finalized your telegraf.conf file, you can start or reload the telegraf service using instructions from the doc.
- Once you have finalized your telegraf.conf file, you can start or reload the telegraf service using instructions from the doc.
- At this point, RabbitMQ metrics should start flowing into Sumo Logic.
Configure Logs Collection
This section provides instructions for configuring log collection for RabbitMQ running on a non-Kubernetes environment for the Sumo Logic App for RabbitMQ.
By default, RabbitMQ logs are stored in a log file. Sumo Logic supports collecting logs via a local log file. Local log files can be collected via Installed collectors. An Installed collector will require you to allow outbound traffic to Sumo Logic endpoints for collection to work. For detailed requirements for Installed collectors, see this page.
Based on your infrastructure and networking setup choose one of these methods to collect RabbitMQ logs and follow the instructions below to set up log collection:
- Configure logging in RabbitMQ. RabbitMQ supports logging via the following methods: local text log files, syslog and stdout. RabbitMQ logs have six levels of verbosity: debug, info, warning, error, critical, none. For details please visit this page. For the dashboards to work properly, must set log level = debug. Default, log level is info. All logging settings are located in RabbitMQ.conf.
- Configure RabbitMQ log to a Local file. By default, RabbitMQ logs are stored in
/var/log/rabbitmq/rabbit@<hostname>.log. The default directory for log files is listed in the RabbitMQ.conf file. To configure the log output destination to a log file, use one of the following settings, either in the configuration file.
Edit or create file config: /etc/rabbitmq/rabbitmq.conf following below:
log.dir = /var/log/rabbitmq
log.file = rabbitmq.log
log.file.level = debug
Logs from the RabbitMQ log file can be collected via a Sumo Logic Installed collector and a Local File Source as explained in the next section. 3. Configuring a Collector. To add an Installed collector, perform the steps as defined on the page Configure an Installed Collector. 4. Configuring a Source. To add a Local File Source source for RabbitMQ, do the following. To collect logs directly from your RabbitMQ machine, use an Installed Collector and a Local File Source.
- Add a Local File Source.
- Configure the Local File Source fields as follows:
- Name. (Required)
- Description. (Optional)
- File Path (Required). Enter the path to your rabbitmq.log. The files are typically located in /var/log/rabbitmq/rabbitmq.log. If you're using a customized path, check the RabbitMQ.conf file for this information.
- Source Host. Sumo Logic uses the hostname assigned by the OS unless you enter a different host name
- Source Category. Enter any string to tag the output collected from this Source, such as RabbitMQ/Logs. (The Source Category metadata field is a fundamental building block to organize and label Sources. For details, see Best Practices.)
- Fields. Set the following fields:
component = messagingmessaging_system = rabbitmqmessaging_cluster = <Your_RabbitMQ_Cluster_Name>environment = <Environment_Name>, such as Dev, QA or Prod.
- Configure the Advanced section:
- Enable Timestamp Parsing. Select Extract timestamp information from log file entries.
- Time Zone. Choose the option, Ignore time zone from log file and instead use, and then select your RabbitMQ Server’s time zone.
- Timestamp Format. The timestamp format is automatically detected.
- Encoding. Select UTF-8 (Default).
- Enable Multiline Processing. Detect messages spanning multiple lines
- Infer Boundaries - Detect message boundaries automatically
- Click Save.
At this point, RabbitMQ logs should start flowing into Sumo Logic.
Installing the RabbitMQ App
To install the app, do the following:
Next-Gen App: To install or update the app, you must be an account administrator or a user with Manage Apps, Manage Monitors, Manage Fields, Manage Metric Rules, and Manage Collectors capabilities depending upon the different content types part of the app.
- Select App Catalog.
- In the 🔎 Search Apps field, run a search for your desired app, then select it.
- Click Install App.
note
Sometimes this button says Add Integration.
- Click Next in the Setup Data section.
- In the Configure section of your respective app, complete the following fields.
- Field Name. If you already have collectors and sources set up, select the configured metadata field name (eg _sourcecategory) or specify other custom metadata (eg: _collector) along with its metadata Field Value.
- Is K8S deployment involved. Specify if resources being monitored are partially or fully deployed on Kubernetes (K8s)
- Click Next. You will be redirected to the Preview & Done section.
Post-installation
Once your app is installed, it will appear in your Installed Apps folder, and dashboard panels will start to fill automatically.
Each panel slowly fills with data matching the time range query received since the panel was created. Results will not immediately be available but will be updated with full graphs and charts over time.
As part of the app installation process, the following fields will be created by default:
componentenvironmentmessaging_systemmessaging_clusterpod
If you're using RabbitMQ in a Kubernetes environment, the following additional fields will be automatically created as a part of the app installation process:
pod_labels_componentpod_labels_environmentpod_labels_messaging_systempod_labels_messaging_cluster
Viewing the RabbitMQ Dashboards
All dashboards have a set of filters that you can apply to the entire dashboard. Use these filters to drill down and examine the data to a granular level.
- You can change the time range for a dashboard or panel by selecting a predefined interval from a drop-down list, choosing a recently used time range, or specifying custom dates and times. Learn more.
- You can use template variables to drill down and examine the data on a granular level. For more information, see Filtering Dashboards with Template Variables.
- Most Next-Gen apps allow you to provide the scope at the installation time and are comprised of a key (
_sourceCategoryby default) and a default value for this key. Based on your input, the app dashboards will be parameterized with a dashboard variable, allowing you to change the dataset queried by all panels. This eliminates the need to create multiple copies of the same dashboard with different queries.
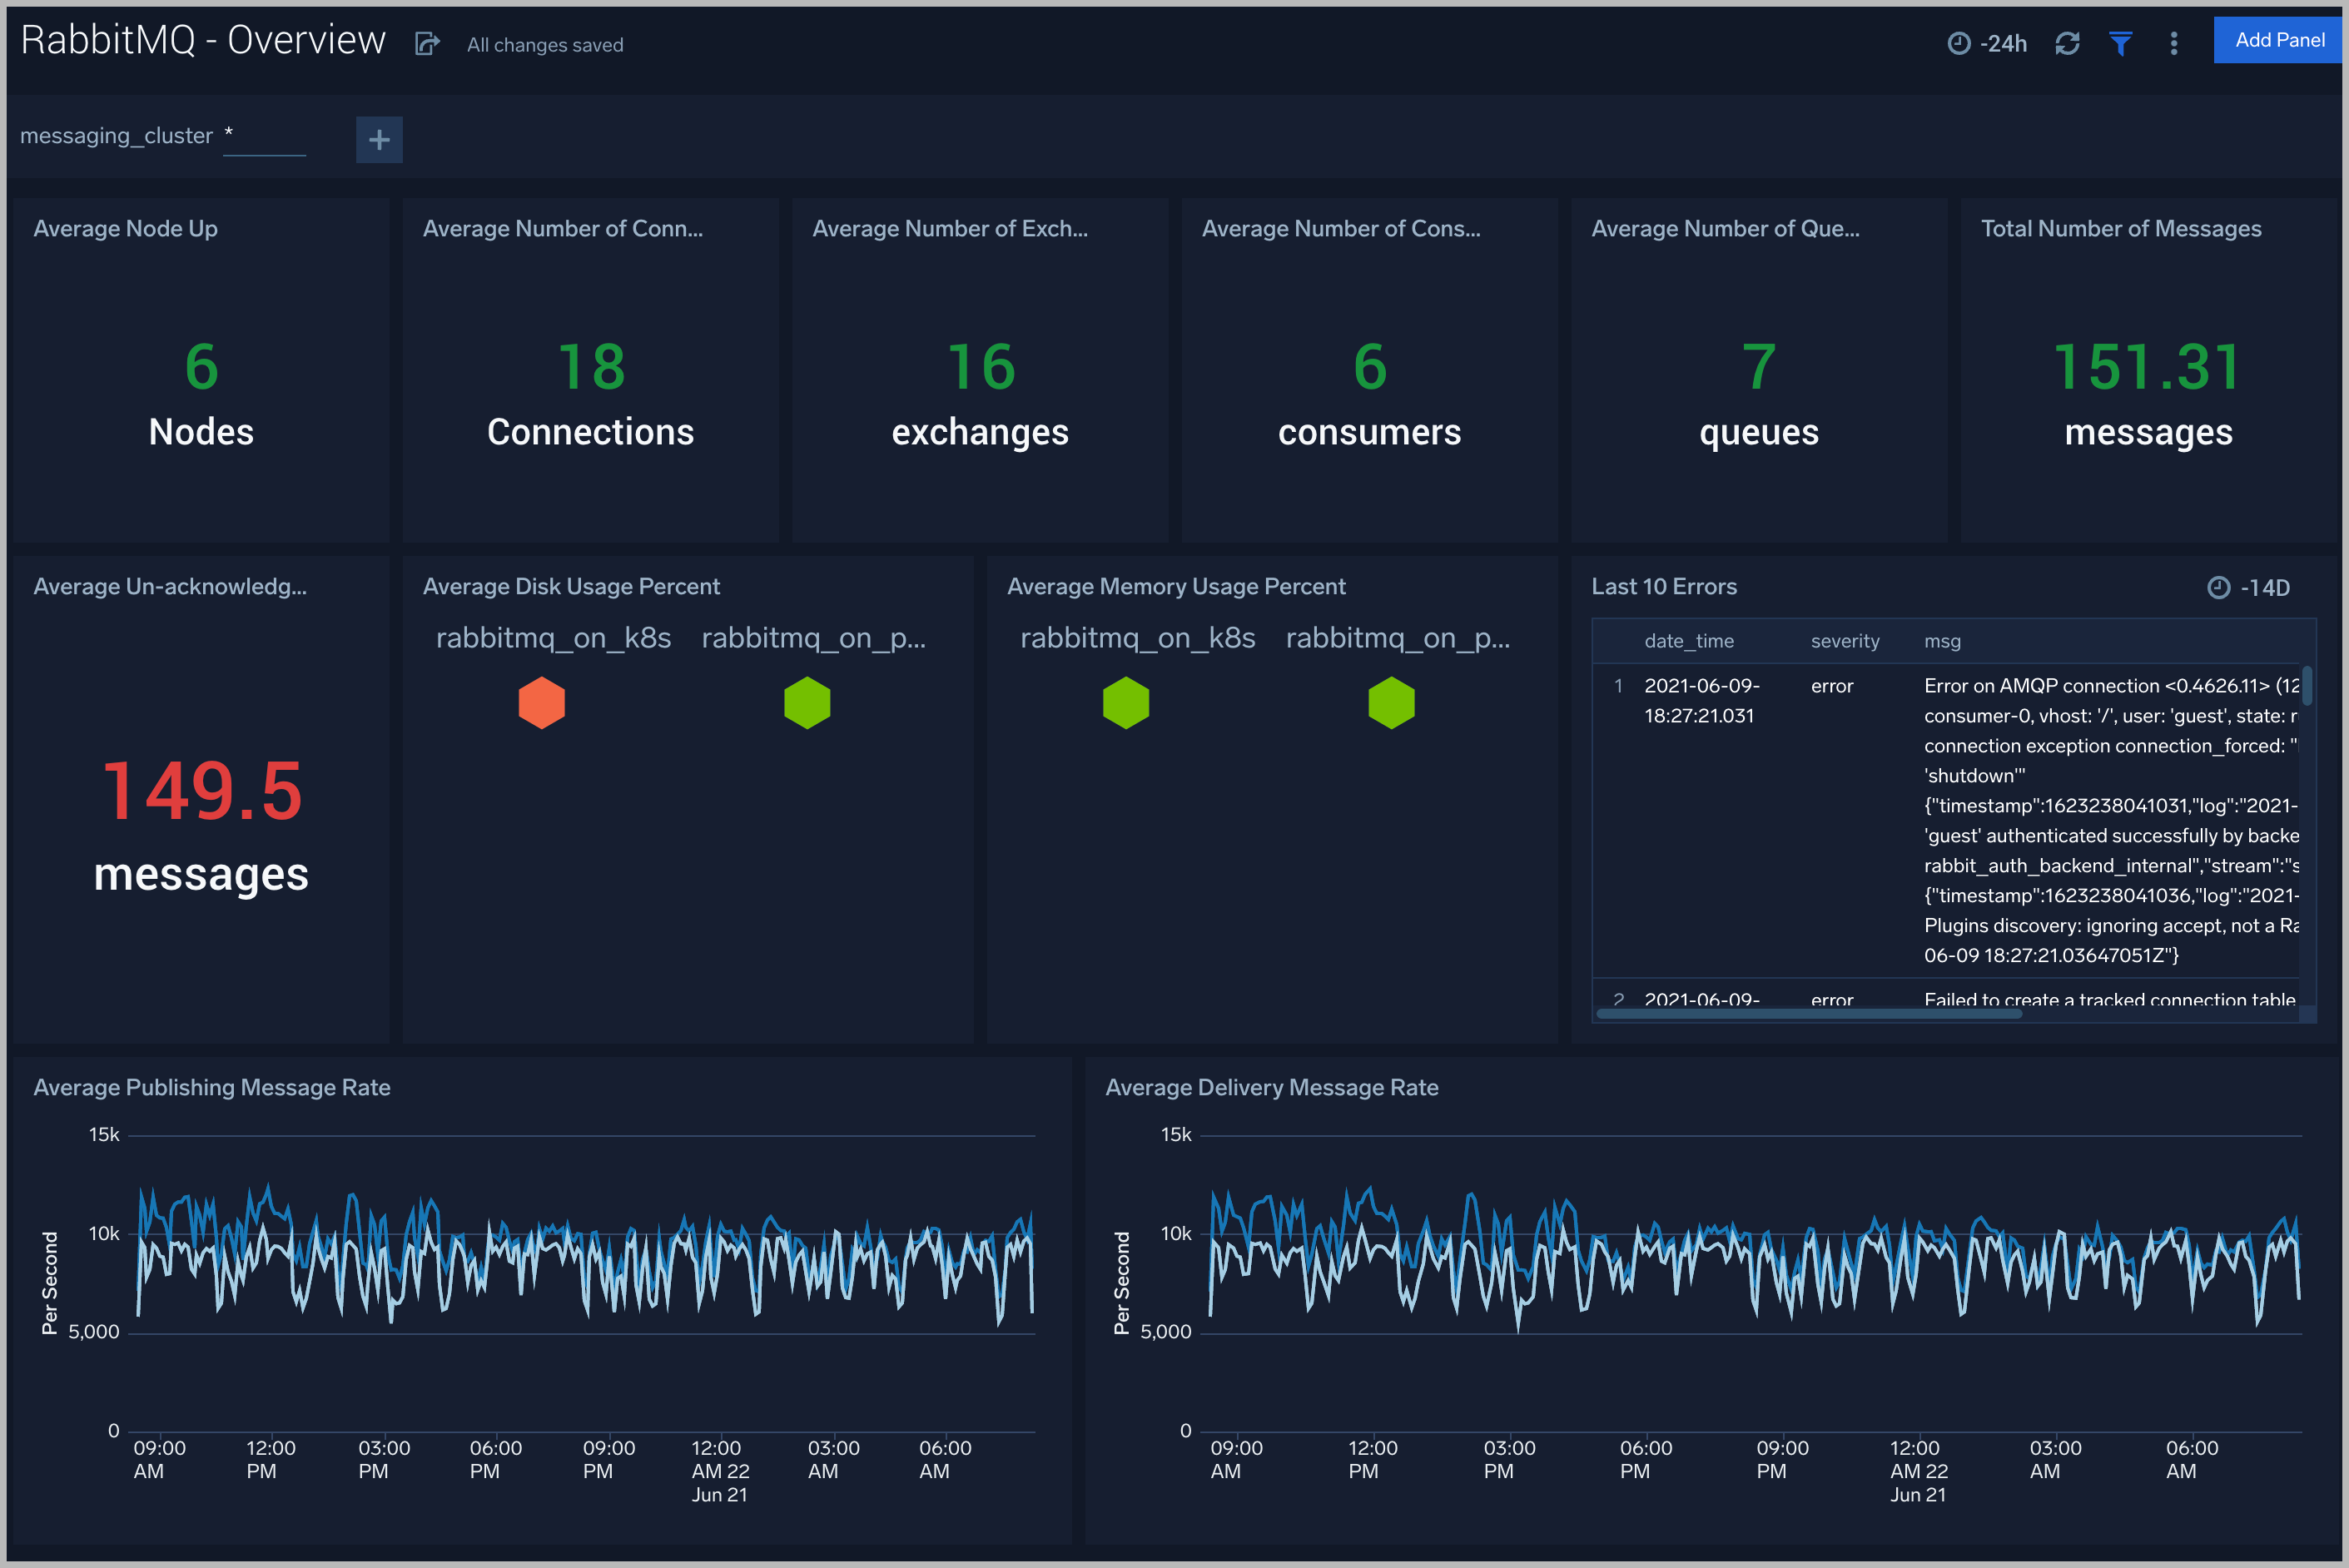
Overview
The RabbitMQ - Overview dashboard gives you an at-a-glance view of your RabbitMQ deployment across brokers, queues, exchanges, and messages.
Use this dashboard to:
- Analyze Memory and disk utilization.
- Gain insights into pushing messages for your RabbitMQ server.
- Gain insights into delivery messages for your RabbitMQ server.
- Determine the number of nodes, connections, exchanges, consume, queues, unack messages, total messages, across each cluster and ensure they match with expectations
- Analysis of near errors.
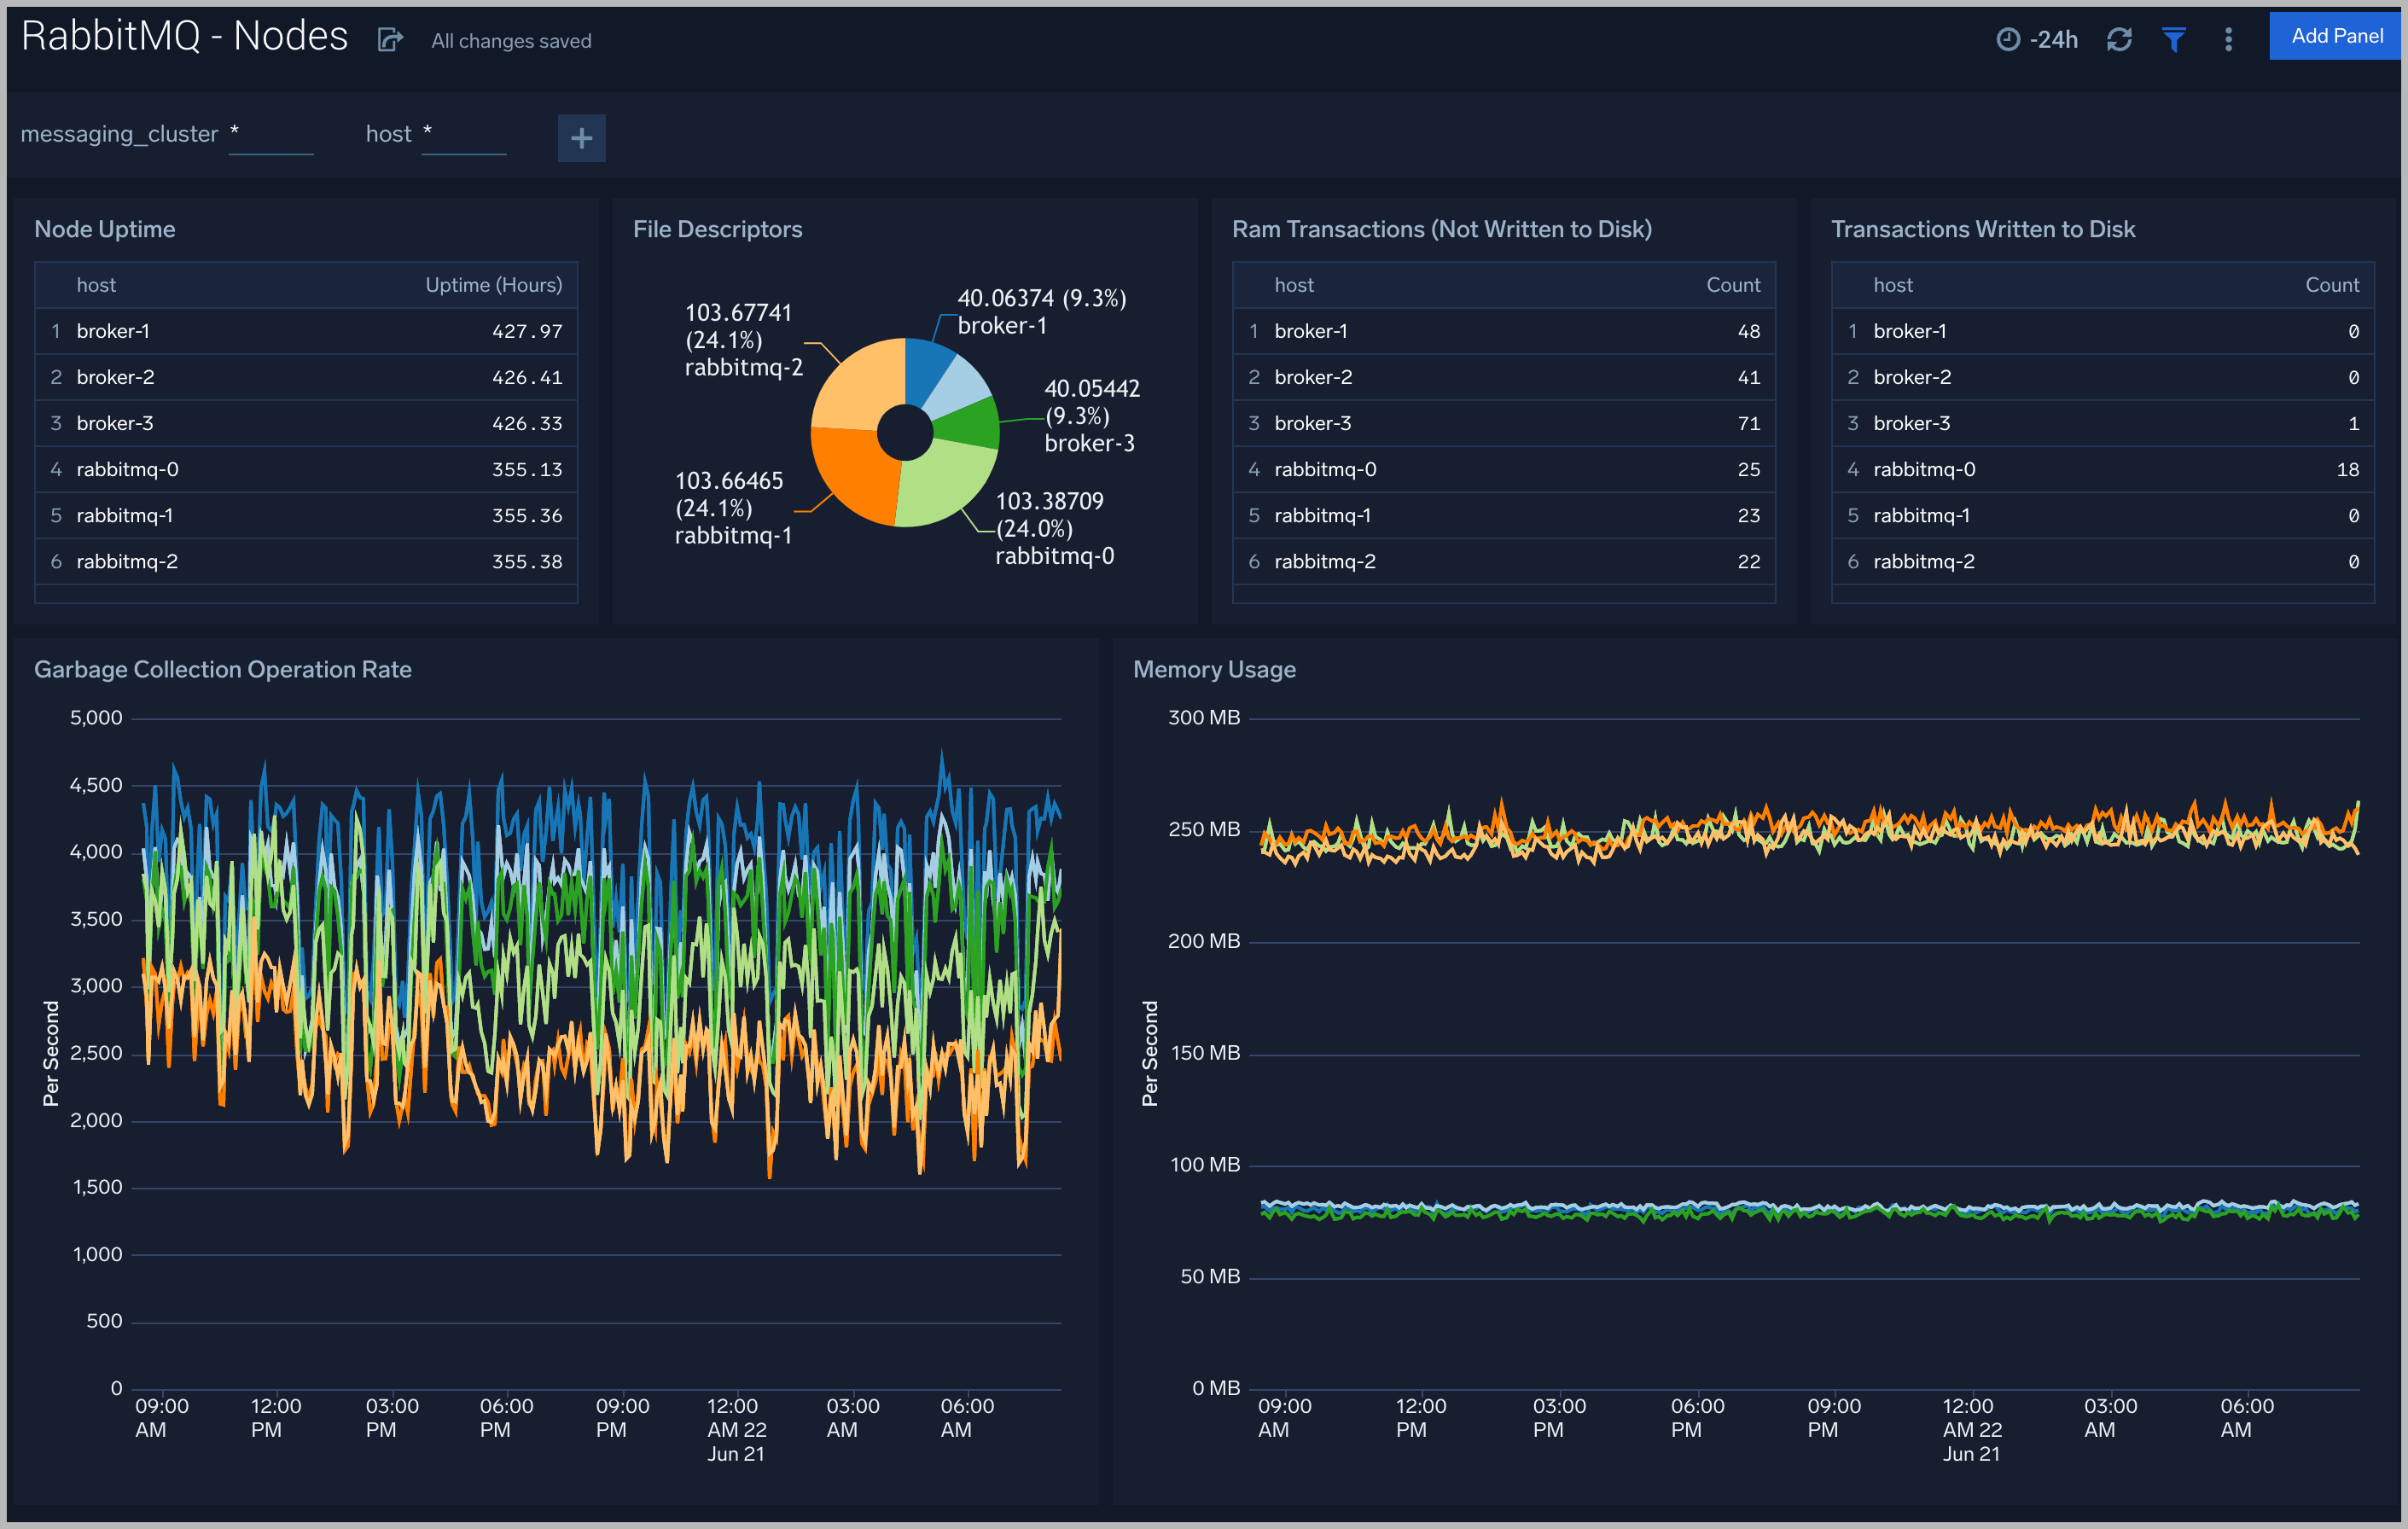
Node
The RabbitMQ - Node dashboard helps you Get an at-a-glance view of the state of the nodes in the RabbitMQ cluster.
Use this dashboard to:
- Monitor the number of open file descriptors.
- Monitor uptime of nodes.
- Determine the amount of ram transaction, disk transaction.
- Determine the amount of garbage collection per second.
- Monitor current memory usage
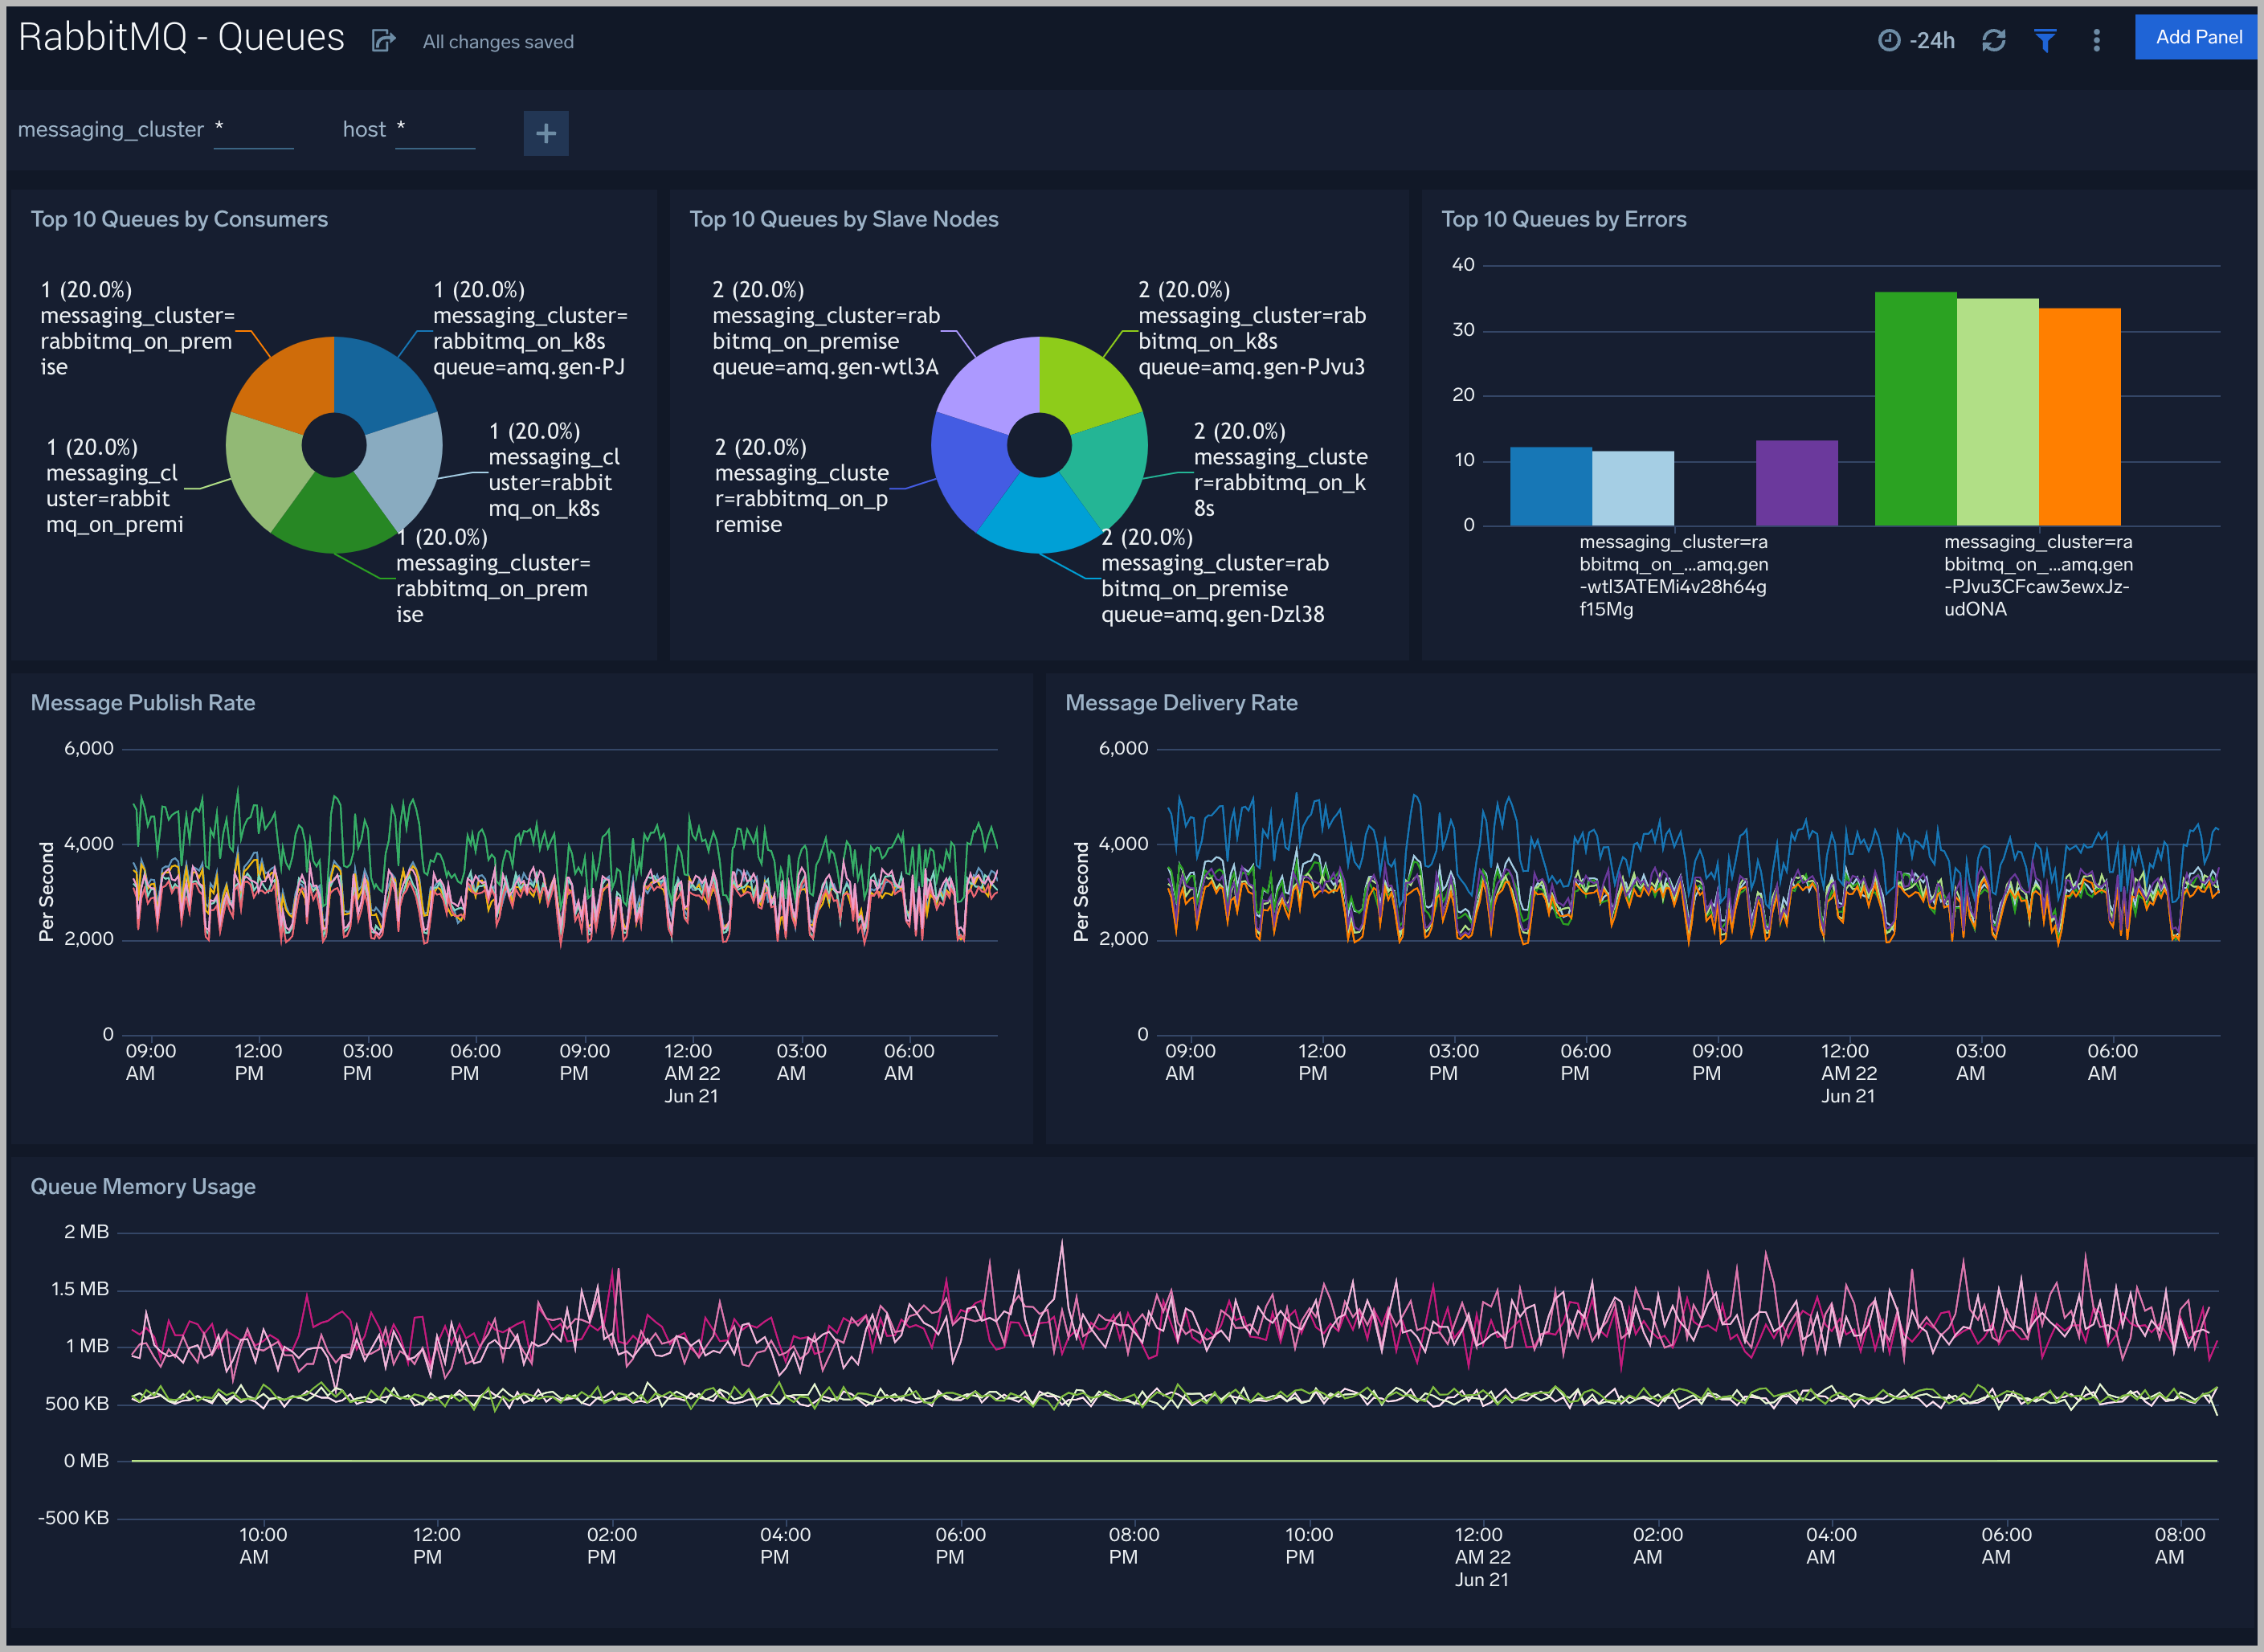
Queue
The RabbitMQ - Queue dashboard provides an at-a-glance view of the state of your queues in your RabbitMQ clusters.
Use this dashboard to:
- Monitor number of consumers on queues
- Gain insights into pushing messages rate for queues of your RabbitMQ cluster.
- Gain insights into delivery messages rate for queues of your RabbitMQ cluster.
- Determine the amount of slave nodes for queues.
- Monitor memory usage of queues over time.
- Determine the number of error messages on queues.
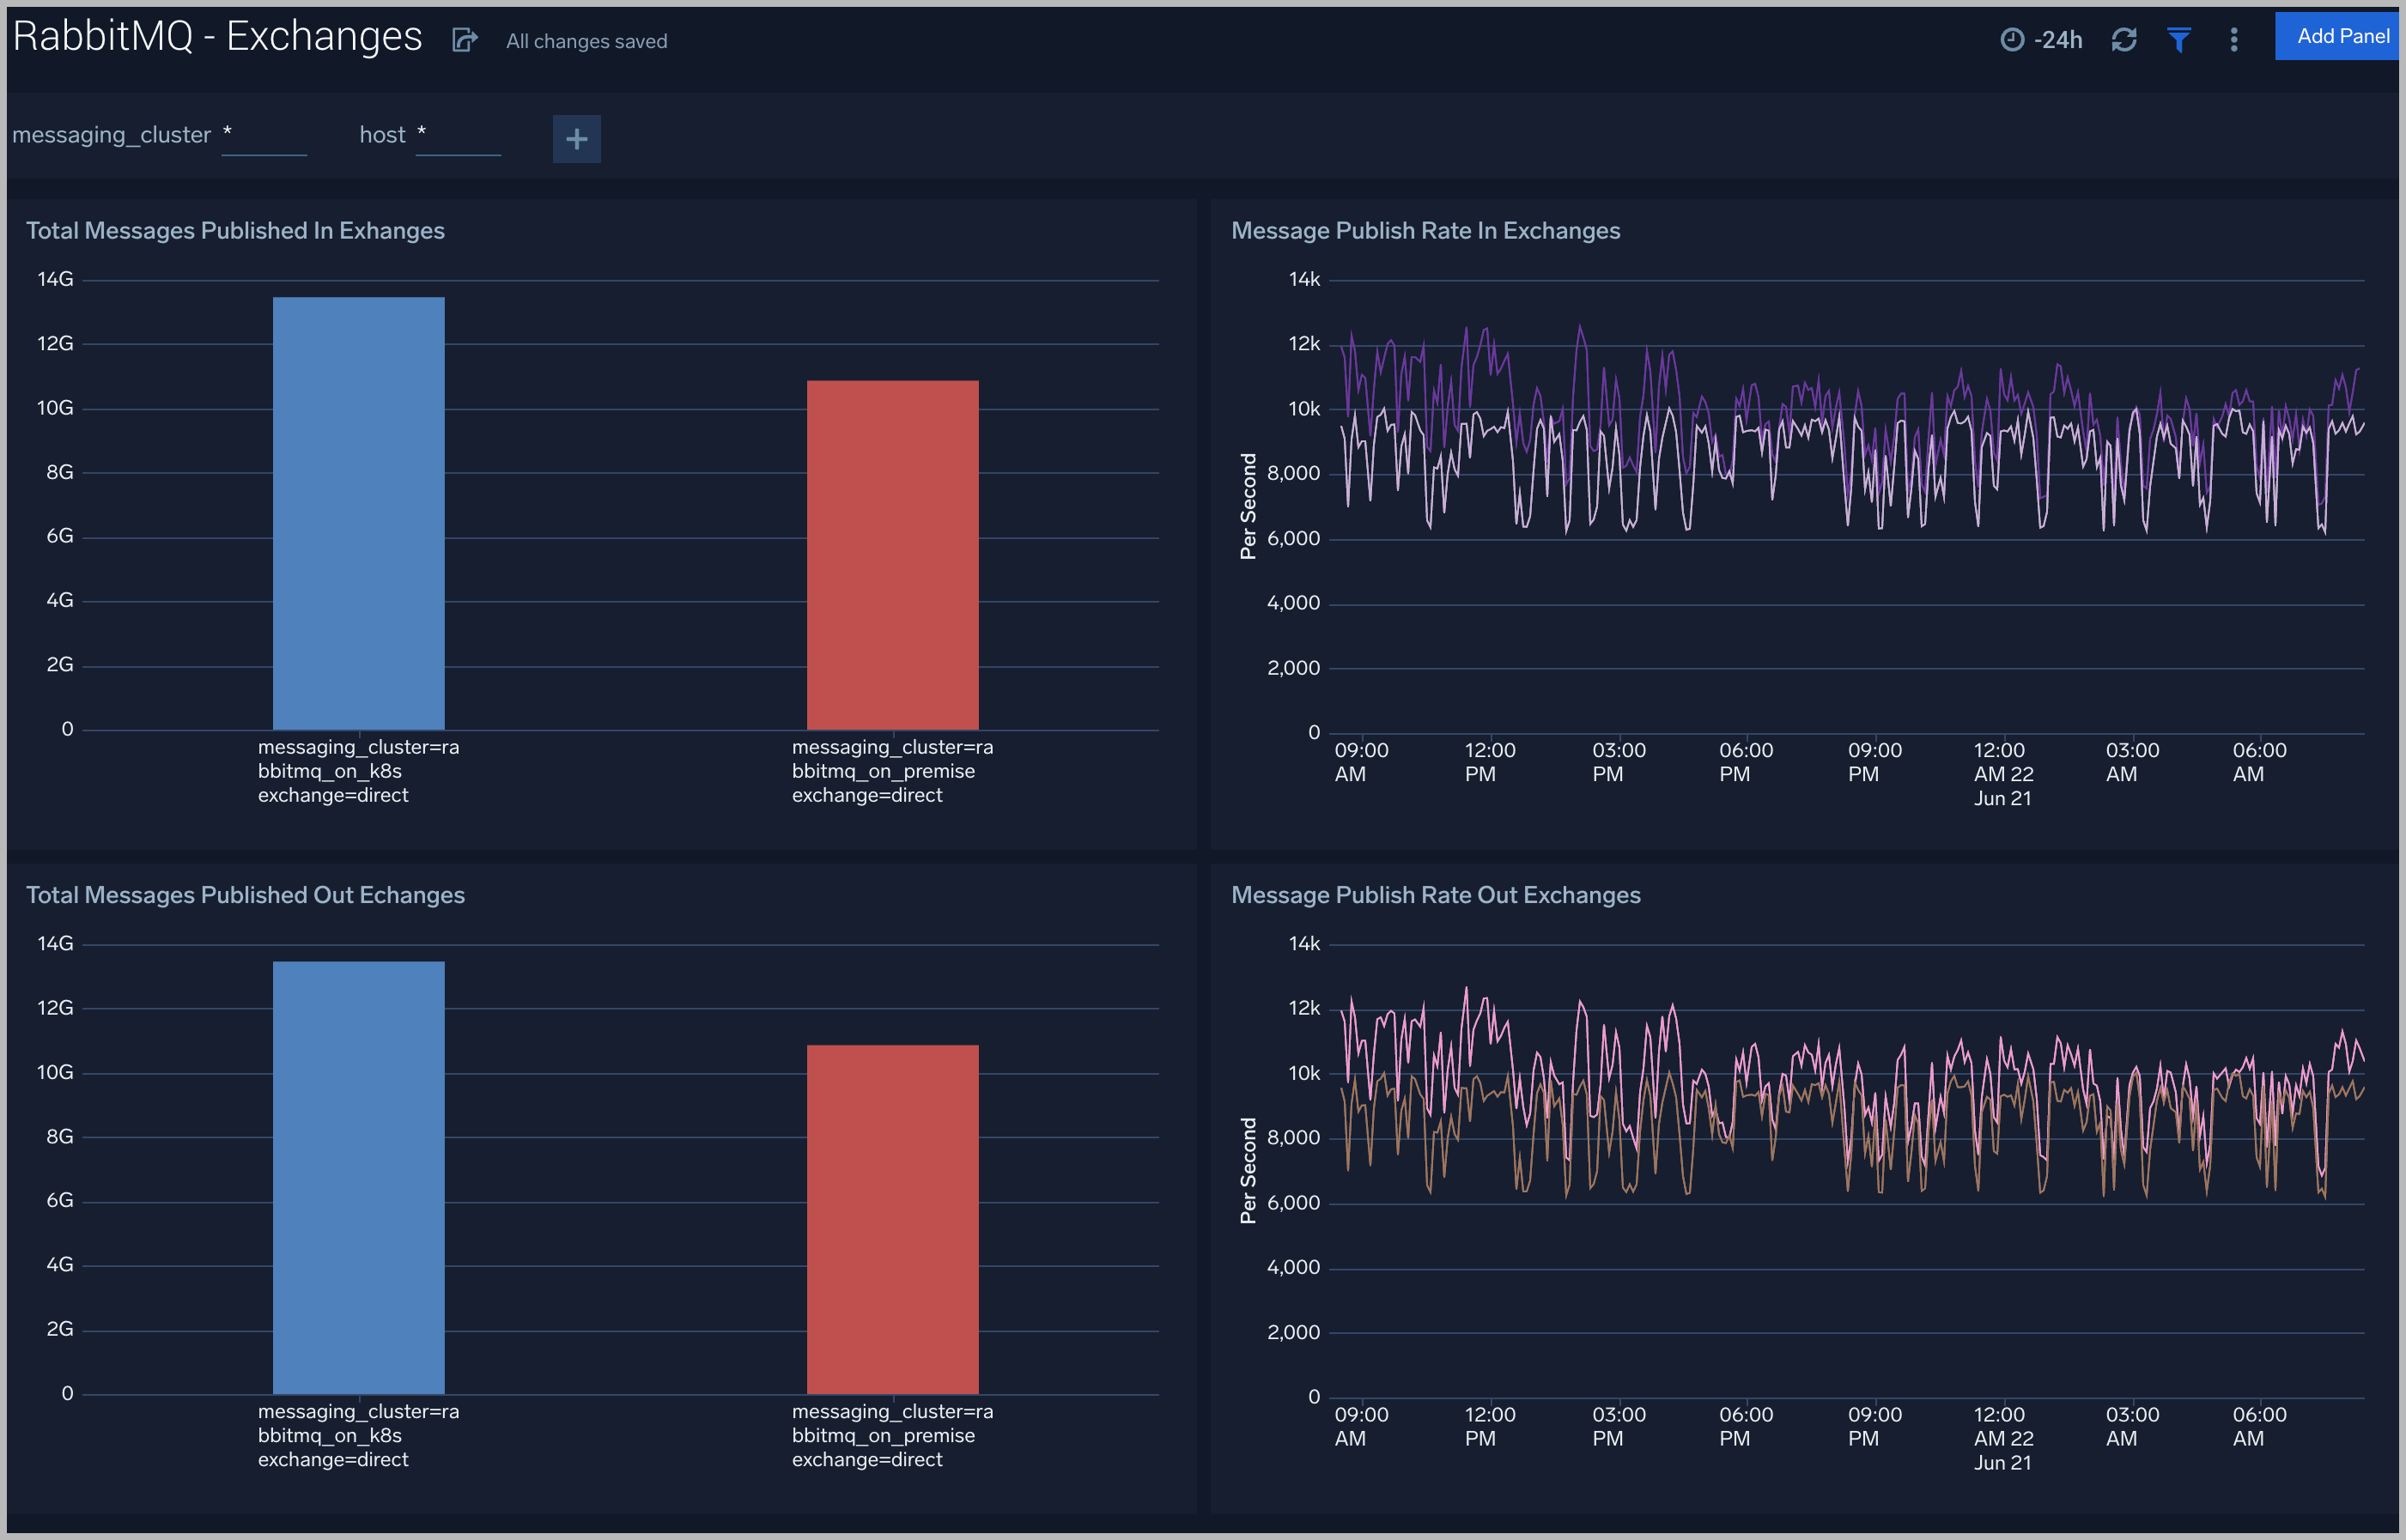
Exchanges
The RabbitMQ - Exchanges dashboard provides an at-a-glance view of the state of your exchanges in your RabbitMQ clusters.
Use this dashboard to:
- Monitor number of total messages published in exchanges
- Monitor number of total messages published out exchanges
- Gain insights into message publish Rate in exchanges of your RabbitMQ cluster.
- Gain insights into message publish Rate out exchanges of your RabbitMQ cluster.
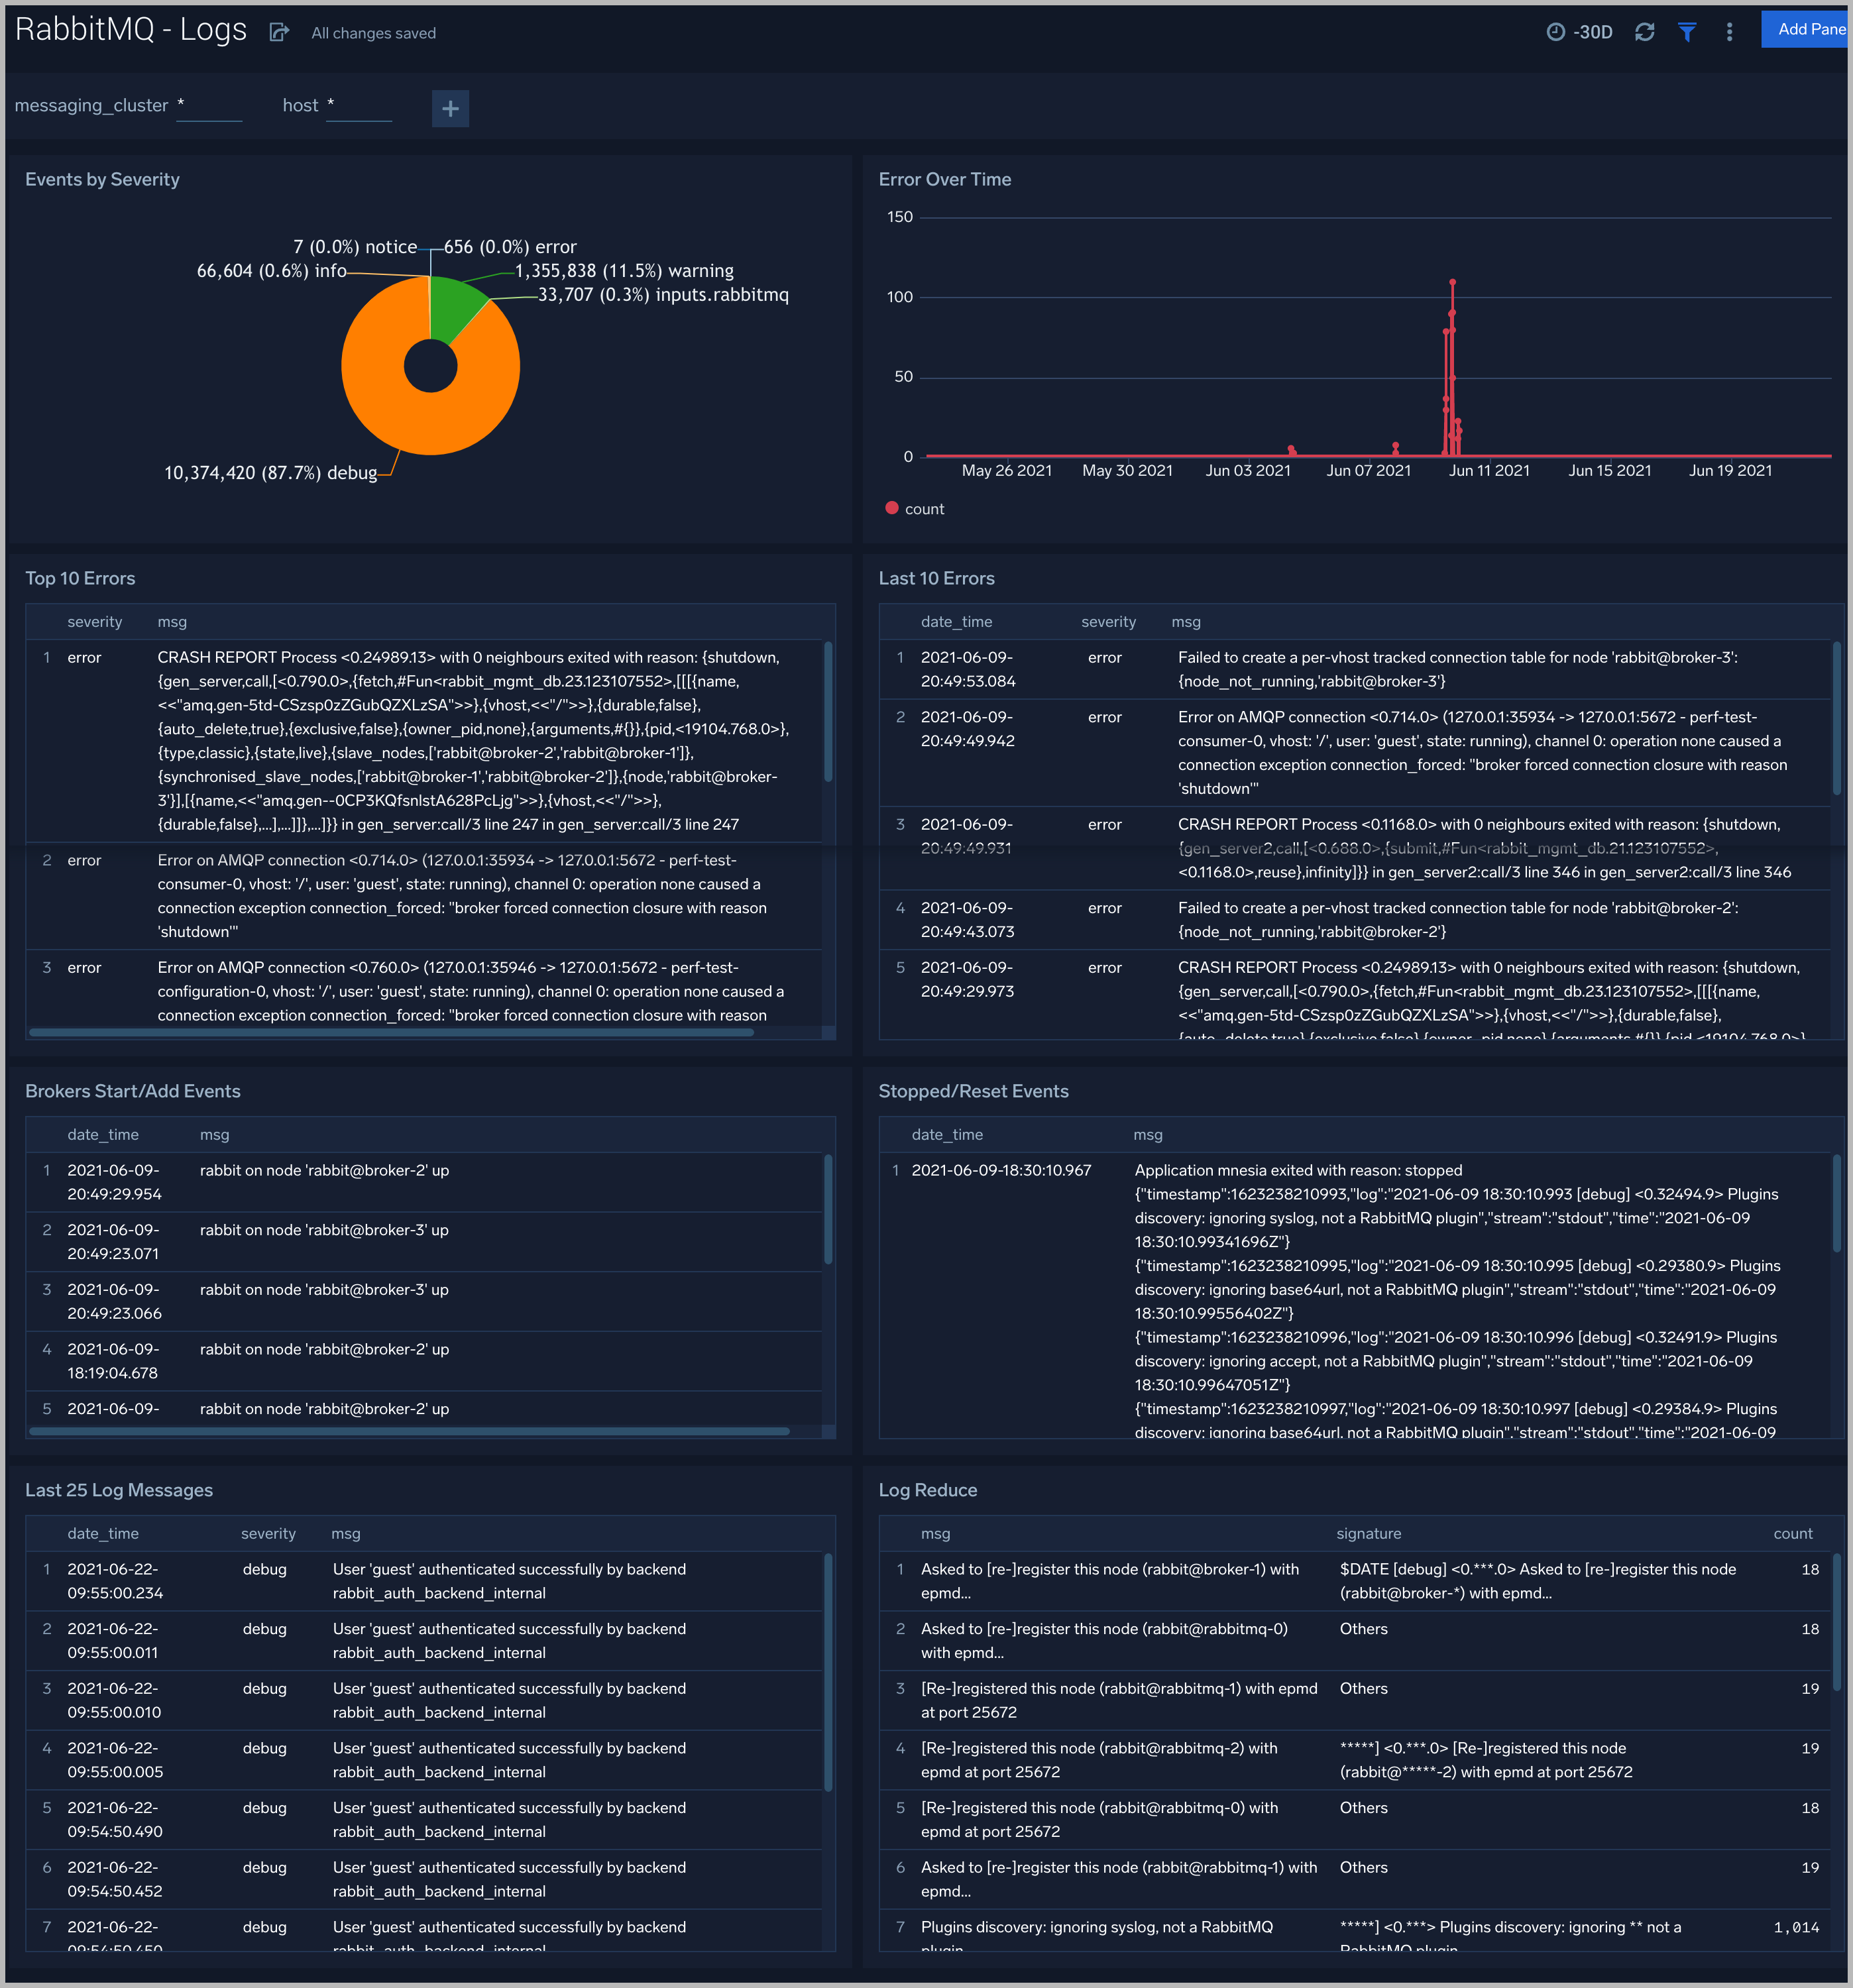
Logs
This dashboard helps you quickly analyze your RabbitMQ error logs across all clusters.
Use this dashboard to:
- Identify critical events in your RabbitMQ cluster.
- Examine trends to detect spikes in Error or Fatal events
- Monitor Broker added/started and shutdown events in your cluster.
- Quickly determine patterns across all logs in a given RabbitMQ cluster.
Create monitors for RabbitMQ app
From your App Catalog:
- From the Sumo Logic navigation, select App Catalog.
- In the Search Apps field, search for and then select your app.
- Make sure the app is installed.
- Navigate to What's Included tab and scroll down to the Monitors section.
- Click Create next to the pre-configured monitors. In the create monitors window, adjust the trigger conditions and notifications settings based on your requirements.
- Scroll down to Monitor Details.
- Under Location click on New Folder.
note
By default, monitor will be saved in the root folder. So to make the maintenance easier, create a new folder in the location of your choice.
- Enter Folder Name. Folder Description is optional.
tip
Using app version in the folder name will be helpful to determine the versioning for future updates.
- Click Create. Once the folder is created, click on Save.
RabbitMQ Alerts
| Alert Name | Alert Description | Trigger Type (Critical / Warning) | Alert Condition | Recover Condition |
| RabbitMQ - High Memory Usage | This alert fires when memory usage on a node in a RabbitMQ cluster is high. | Critical | > = 80 | < 80 |
| RabbitMQ - No Consumers | This alert fires when a RabbitMQ queue has no consumers. | Critical | < 1 | > = 1 |
| RabbitMQ - High Disk Usage | This alert fires when there is high disk usage on a node in a RabbitMQ cluster. | Critical | > = 80 | < 80 |
| RabbitMQ - High Number of File Descriptors in use | This alert fires when the percentage of file descriptors used by a node in a RabbitMQ cluster is high. | Critical | > = 90 | < 90 |
| RabbitMQ - Node Down | This alert fires when a node in the RabbitMQ cluster is down. | Critical | > = 1 | < 1 |
| RabbitMQ - Too Many Connections | This alert fires when there are too many connections to a node in a RabbitMQ cluster. | Critical | > = 1000 | < 1000 |
| RabbitMQ - Too Many Un-acknowledged Messages | This alert fires when we detect that there are too many un-acknowledged messages on a node in a RabbitMQ cluster. | Critical | > = 1000 | < 1000 |
| RabbitMQ - Un-routable Messages | This alert fires when we detect that a node in the RabbitMQ cluster has un-routable messages | Critical | > = 1 | < 1 |