Cassandra - Classic Collector

The Cassandra app is a unified logs and metrics app that helps you monitor the availability, performance, health, and resource utilization of your Cassandra clusters. Preconfigured dashboards provide insight into cluster health, resource utilization, cache/Gossip/Memtable statistics, compaction, garbage collection, thread pools, and write paths.
Log types and Metrics
The app supports Logs and Metrics from the open-source version of Cassandra. The app is tested on the 3.11.10 version of Cassandra.
Cassandra has three main logs, system.log, debug.log, and gc.log which hold general logging messages, debugging logging messages, and java garbage collection logs respectively.
These logs by default live in ${CASSANDRA_HOME}/logs, but most Linux distributions relocate logs to /var/log/cassandra. Operators can tune this location as well as what levels are logged using the provided logback.xml file. For more details on Cassandra logs, see this link.
The Sumo Logic app for Cassandra supports metrics generated by the Jolokia2 plugin for Telegraf. The app assumes prometheus format Metrics.
Collecting logs and metrics for Cassandra
This section provides instructions for configuring log and metric collection for the Sumo Logic app for Cassandra.
Configure Collection for Cassandra
- Kubernetes environments
- Non-Kubernetes environments
In Kubernetes environments, we use the Telegraf Operator, which is packaged with our Kubernetes collection. You can learn more about it here.
The diagram below illustrates how data is collected from Cassandra in a Kubernetes environment. In the architecture shown below, make up the metric collection pipeline: Telegraf, Telegraf Operator, Prometheus, and Sumo Logic Distribution for OpenTelemetry Collector.
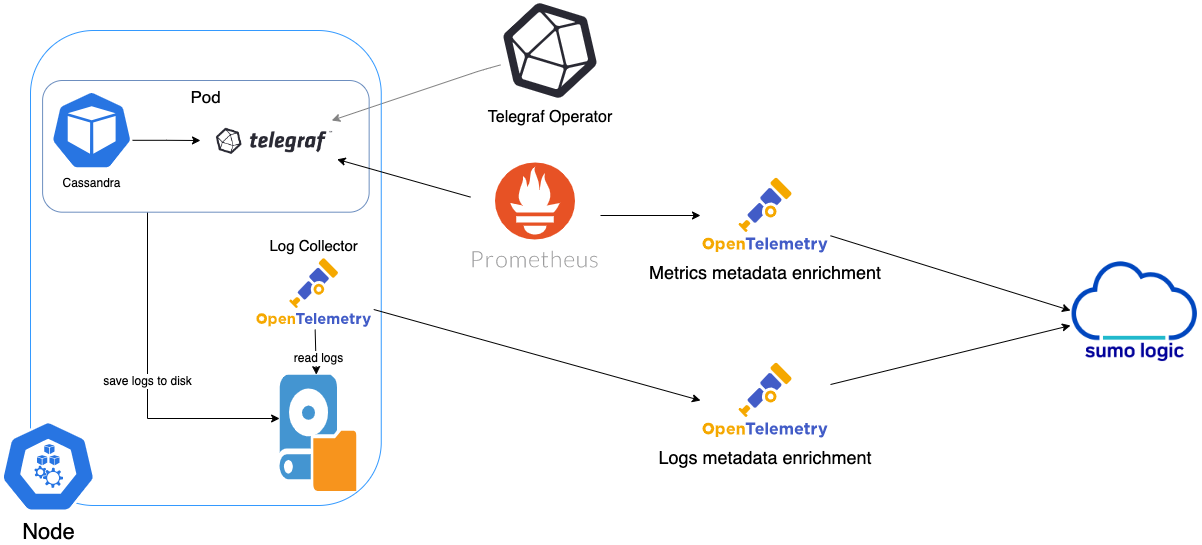
The first service in the metrics pipeline is Telegraf. Telegraf collects metrics from Cassandra. Note that we’re running Telegraf in each pod we want to collect metrics from as a sidecar deployment for example, Telegraf runs in the same pod as the containers it monitors. Telegraf uses the Jolokia2 input plugin to obtain metrics. For simplicity, the diagram doesn’t show the input plugins. The injection of the Telegraf sidecar container is done by the Telegraf Operator. Prometheus pulls metrics from Telegraf and sends them to Sumo Logic Distribution for OpenTelemetry Collector which enriches metadata and sends metrics to Sumo Logic.
In the logs pipeline, Sumo Logic Distribution for OpenTelemetry Collector collects logs written to standard out and forwards them to another instance of Sumo Logic Distribution for OpenTelemetry Collector, which enriches metadata and sends logs to Sumo Logic.
It’s assumed that you're using the latest helm chart version. If not, upgrade using the instructions here.
Configure Metrics Collection
Follow the steps listed below to collect Cassandra metrics from a Kubernetes environment.
- Set up your Kubernetes Collection with the Telegraf Operator.
- On your Cassandra Pods, add the following annotations:
annotations:
 telegraf.influxdata.com/class: sumologic-prometheus
 prometheus.io/scrape: "true"
 prometheus.io/port: "9273"
 telegraf.influxdata.com/inputs: |+
[[inputs.jolokia2_agent]]
  urls = ["http://localhost:8778/jolokia"]
  name_prefix = "cassandra_java_"
  [inputs.jolokia2_agent.tags]
    environment = "prod"
    component = "database"
    db_system = "cassandra"
    db_cluster = "cassandra_on_premise"
    dc = "IDC1"
[[inputs.jolokia2_agent.metric]]
  name  = "Memory"
  mbean = "java.lang:type=Memory"
[[inputs.jolokia2_agent.metric]]
  name  = "GarbageCollector"
  mbean = "java.lang:name=*,type=GarbageCollector"
  tag_keys = ["name"]
  field_prefix = "$1_"
[[inputs.jolokia2_agent.metric]]
  name=”OperatingSystem”
  mbean=”java.lang:type=OperatingSystem”
  paths = [“FreePhysicalMemorySize", "AvailableProcessors", "SystemCpuLoad", "TotalPhysicalMemorySize", "TotalSwapSpaceSize", "SystemLoadAverage"]
[[inputs.jolokia2_agent]]
  urls = ["http://localhost:8778/jolokia"]
  name_prefix = "cassandra_"
  [inputs.jolokia2_agent.tags]
    environment="ENV_TO_BE_CHANGED"
    component="database"
    db_system="cassandra"
    db_cluster="cassandra_on_premise"
    db_cluster_address = “ENV_TO_BE_CHANGED”
    db_cluster_port = “ENV_TO_BE_CHANGED”
    dc = "IDC1"
[[inputs.jolokia2_agent.metric]]
  name  = "TableMetrics"
  mbean = "org.apache.cassandra.metrics:name=*,scope=*,keyspace=*,type=Table"
  tag_keys = ["name", "scope","keyspace"]
  field_prefix = "$1_"
[[inputs.jolokia2_agent.metric]]
  name = "DroppedMessageMetrics"
  mbean = "org.apache.cassandra.metrics:name=*,scope=*,type=DroppedMessage"
  tag_keys = ["name", "scope"]
  field_prefix = "$1_"
[[inputs.jolokia2_agent.metric]]
  name = "ClientMetrics"
  mbean = "org.apache.cassandra.metrics:type=Client,name=*"
  tag_keys = ["name"]
  field_prefix = "$1_"
[[inputs.jolokia2_agent.metric]]
  name = "ThreadPoolMetrics"
  mbean = "org.apache.cassandra.metrics:type=ThreadPools,path=*,scope=*,name=*"
  tag_keys = ["name", "scope", "path"]
  field_prefix = "$1_"
[[inputs.jolokia2_agent.metric]]
  name = "CacheMetrics"
  mbean = "org.apache.cassandra.metrics:type=Cache,scope=*,name=*"
  tag_keys = ["name", "scope"]
  field_prefix = "$1_"
[[inputs.jolokia2_agent.metric]]
  name = "CommitLogMetrics"
  mbean = "org.apache.cassandra.metrics:type=CommitLog,name=*"
  tag_keys = ["name"] field_prefix = "$1_"
Enter in values for the following parameters (marked ENV_TO_BE_CHANGED above):
telegraf.influxdata.com/inputs. This contains the required configuration for the Telegraf Cassandra Input plugin. Please refer to this doc for more information on configuring the Cassandra input plugin for Telegraf. As Telegraf will be run as a sidecar, the host should always be localhost.- In the input plugins section (
[[inputs.jolokia2_agent]]):urls- The URL to the Cassandra server. This can be a comma-separated list to connect to multiple Cassandra servers. Please see this doc for more information on additional parameters for configuring the Cassandra input plugin for Telegraf.
- In the tags section (
[[inputs.jolokia2_agent]]):environment. This is the deployment environment where the Cassandra cluster identified by the value of servers resides. For example: dev, prod or qa. While this value is optional we highly recommend setting it.db_cluster. Enter a name to identify this Cassandra cluster. This cluster name will be shown in the Sumo Logic dashboards.db_cluster_address. Enter the cluster hostname or ip address that is used by the application to connect to the database. It could also be the load balancer or proxy endpoint.db_cluster_port. Enter the database port. If not provided, a default port will be used
- In the input plugins section (
Do not modify the following values set by this configuration as it will cause the Sumo Logic app to not function correctly.
telegraf.influxdata.com/class: sumologic-prometheus. This instructs the Telegraf operator what output to use. This should not be changed.prometheus.io/scrap: "true". This ensures our Prometheus will scrape the metrics.prometheus.io/port: "9273". This tells prometheus what ports to scrape on. This should not be changed.telegraf.influxdata.com/inputs- In the tags section (
[inputs.jolokia2_agent.tags]):component: “database”- This value is used by Sumo Logic apps to identify application components.db_system: “cassandra”- This value identifies the database system.
- In the tags section (
db_cluster_address and db_cluster_port should reflect exact configuration of DB client configuration in your application, especially if you instrument it with OT tracing. The values of these fields should match exactly the connection string used by the database client (reported as values for net.peer.name and net.peer.port metadata fields).
For example, if your application uses “cassandra-prod.sumologic.com:3306” as the connection string, the field values should be set as follows: db_cluster_address=cassandra-prod.sumologic.com db_cluster_port=3306.
If your application connects directly to a given Cassandra node, rather than the whole cluster, use the application connection string to override the value of the “host” field in the Telegraf configuration:
host=cassandra-prod.sumologic.com.
Pivoting to Tracing data from Entity Inspector is possible only for “Cassandra address” Entities.
See this doc for more parameters that can be configured in the Telegraf agent globally.
- Sumo Logic Kubernetes collection will automatically start collecting metrics from the pods having the labels and annotations defined in the previous step.
- Verify metrics in Sumo Logic.
Configure Logs Collection
This section explains the steps to collect Cassandra logs from a Kubernetes environment.
-
Add labels on your Cassandra pods to capture logs from standard output on Kubernetes.
- Apply following labels to the Cassandra pods:
environment: "<Ex prod, stag>"
component: "database"
db_system: "cassandra"
db_cluster: "<Your_Cassandra_Cluster_Name>"--Enter Default if you do not have one.
db_cluster_address: <your cluster’s hostname or ip address or service endpoint>
db_cluster_port: <database port>
Please enter values for the following parameters:
environment. This is the deployment environment where the Cassandra cluster identified by the value of servers resides. For example: dev, prod or qa. While this value is optional we highly recommend setting it.db_cluster- Enter a name to identify the Cassandra cluster. The cluster name will be shown in the Sumo Logic dashboards.
Do not modify the following values as it will cause the Sumo Logic apps to not function correctly.
component: “database”. This value is used by Sumo Logic apps to identify application components.db_system: “Cassandra”. This value identifies the database system.db_cluster_address. Enter the cluster hostname or ip address that is used by the application to connect to the database. It could also be the load balancer or proxy endpoint.db_cluster_port. Enter the database port. If not provided, a default port will be used
db_cluster_address and db_cluster_port should reflect exact configuration of DB client configuration in your application, especially if you instrument it with OT tracing. The values of these fields should match exactly the connection string used by the database client (reported as values for net.peer.name and net.peer.port metadata fields).
For example, if your application uses “cassandra-prod.sumologic.com:3306” as the connection string, the field values should be set as follows:
db_cluster_address=cassandra-prod.sumologic.com db_cluster_port=3306
If your application connects directly to a given Cassandra node, rather than the whole cluster, use the application connection string to override the value of the “host” field in the Telegraf configuration:
host=cassandra-prod.sumologic.com
Pivoting to Tracing data from Entity Inspector is possible only for “Cassandra address” Entities.
For all other parameters, see this doc for more parameters that can be configured in the Telegraf agent globally.
- (Optional) Collecting Cassandra Logs from a Log File on Kubernetes.
- Determine the location of the Cassandra log file on Kubernetes. This can be determined from the Cassandra logback.xml for your Cassandra cluster along with the mounts on the Cassandra pods.
- Install the Sumo Logic tailing sidecar operator.
- Add the following annotation in addition to the existing annotations.
annotations:
  tailing-sidecar: sidecarconfig;<mount>:<path_of_Cassandra_log_file>/  <Cassandra_log_file_name>
Example:
annotations:
  tailing-sidecar: sidecarconfig;data:/opt/bitnami/cassandra/logs/cassandra.log
- Make sure that the Cassandra pods are running and annotations are applied by using the command:
kubectl describe pod <Cassandra_pod_name>
- Sumo Logic Kubernetes collection will automatically start collecting logs from the pods having the annotations defined above.
- Verify logs in Sumo Logic.
FER to normalize the fields in Kubernetes environments. Labels created in Kubernetes environments automatically are prefixed with pod_labels. To normalize these for our app to work, a Field Extraction Rule named AppObservabilityCassandraDatabaseFER is automatically created for Database Application Components.
- Configure Jolokia JVM Agent in Cassandra to collect metrics:
- Download the latest Jolokia JVM agent jar file (example:
jolokia-jvm-1.3.3-agent.jar) from here. - Copy the downloaded jar file to Cassandra’s lib folder (example:
/usr/share/cassandra/lib). - In
cassandra-env.shfile, enable/add the following lines:
# Jolokia javaagent
JVM_OPTS="$JVM_OPTS -javaagent:$CASSANDRA_HOME/lib/jolokia-jvm-1.3.3-agent.jar"- Restart Cassandra service.
- Download the latest Jolokia JVM agent jar file (example:
- Choose one of the two methods below to configure Casssandra metrics collection:
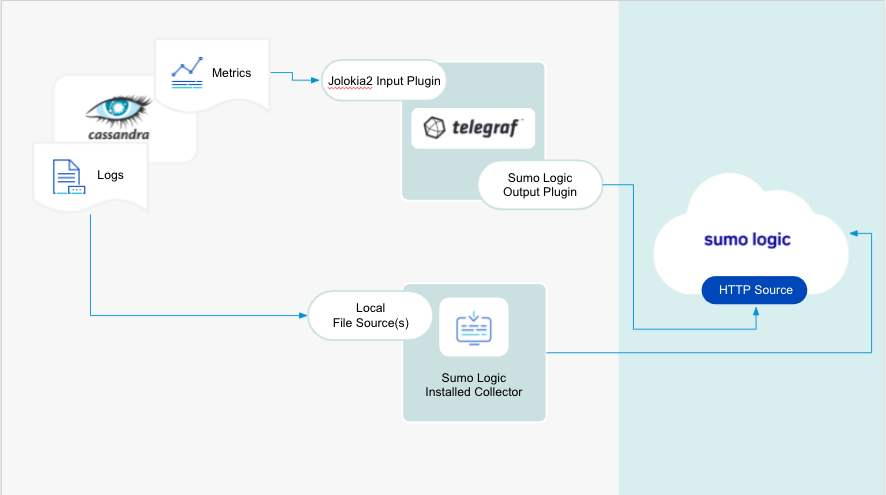
Method A: Using Telegraf and Installed Collector
We use the Telegraf operator for Cassandra metric collection and Sumo Logic Installed Collector for collecting Cassandra logs. The diagram below illustrates the components of the Cassandra collection in a non-Kubernetes environment. Telegraf runs on the same system as Cassandra, and uses the Jolokia2 input plugin to obtain Cassandra metrics, and the Sumo Logic output plugin to send the metrics to Sumo Logic. Logs from Cassandra on the other hand are sent to a Sumo Logic Local File source.
Configure Metrics Collection
This section provides instructions for configuring metrics collection for the Sumo Logic app for Cassandra.
- Configure a Hosted Collector. To create a new Sumo Logic hosted collector, perform the steps in the Configure a Hosted Collector section of the Sumo Logic documentation.
- Configure an HTTP Logs and Metrics Source. Create a new HTTP Logs and Metrics Source in the hosted collector created above by following these instructions. Make a note of the HTTP Source URL.
- Install Telegraf. Use the following steps to install Telegraf.
- Configure and start Telegraf. As part of collecting metrics data from Telegraf, we will use the jolokia2 input plugin to get data from Telegraf and the Sumo Logic output plugin to send data to Sumo Logic.
Create or modify telegraf.conf and copy and paste the text below:
[[inputs.jolokia2_agent]]
  urls = ["http://localhost:8778/jolokia"]
  name_prefix = "cassandra_java_"
  [inputs.jolokia2_agent.tags]
    environment="<Your_Environment_Name>"
    component="database"
    db_system="cassandra"
    db_cluster="<Your_Cassandra_Cluster_Name>"
    dc = "IDC1"
[[inputs.jolokia2_agent.metric]]
  name  = "Memory"
  mbean = "java.lang:type=Memory"
[[inputs.jolokia2_agent.metric]]
  name  = "GarbageCollector"
  mbean = "java.lang:name=*,type=GarbageCollector"
  tag_keys = ["name"]
  field_prefix = "$1_"
[[inputs.jolokia2_agent.metric]]
  name="OperatingSystem"
  mbean="java.lang:type=OperatingSystem"
  paths=["FreePhysicalMemorySize","AvailableProcessors","SystemCpuLoad","TotalPhysicalMemorySize","TotalSwapSpaceSize","SystemLoadAverage"]
[[inputs.jolokia2_agent]]
  urls = ["http://localhost:8778/jolokia"]
  name_prefix = "cassandra_"
  [inputs.jolokia2_agent.tags]
    environment="<Your_Environment_Name>"
    component="database"
    db_system="cassandra"
    db_cluster="<Your_Cassandra_Cluster_Name>"
    db_cluster_address = "ENV_TO_BE_CHANGED"
    db_cluster_port = "ENV_TO_BE_CHANGED"
    dc = "IDC1"
[[inputs.jolokia2_agent.metric]]
  name  = "TableMetrics"
  mbean = "org.apache.cassandra.metrics:name=*,scope=*,keyspace=*,type=Table"
  tag_keys = ["name", "scope","keyspace"]
  field_prefix = "$1_"
[[inputs.jolokia2_agent.metric]]
  name = "DroppedMessageMetrics"
  mbean = "org.apache.cassandra.metrics:name=*,scope=*,type=DroppedMessage"
  tag_keys = ["name", "scope"]
  field_prefix = "$1_"
[[inputs.jolokia2_agent.metric]]
  name = "ClientMetrics"
  mbean = "org.apache.cassandra.metrics:type=Client,name=*"
  tag_keys = ["name"]
  field_prefix = "$1_"
[[inputs.jolokia2_agent.metric]]
  name = "ThreadPoolMetrics"
  mbean = "org.apache.cassandra.metrics:type=ThreadPools,path=*,scope=*,name=*"
  tag_keys = ["name", "scope", "path"]
  field_prefix = "$1_"
[[inputs.jolokia2_agent.metric]]
  name = "CacheMetrics"
  mbean = "org.apache.cassandra.metrics:type=Cache,scope=*,name=*"
  tag_keys = ["name", "scope"]
  field_prefix = "$1_"
[[inputs.jolokia2_agent.metric]]
  name = "CommitLogMetrics"
  mbean = "org.apache.cassandra.metrics:type=CommitLog,name=*"
  tag_keys = ["name"]
  field_prefix = "$1_"
[[outputs.sumologic]]
  url = "<URL Created in Step 3>"
  data_format = "prometheus"
 [outputs.sumologic.tagpass]
    db_cluster=["<Your_Cassandra_Cluster_Name>"]
Please enter values for the following parameters:
- In the input plugins section, which is
[[inputs. jolokia2_agent]]:urls- The URL to the jolokia server. Please see this doc for more information on additional parameters for configuring the Cassandra input plugin for Telegraf.
- In the tags section, which is
[inputs.Cassandra.tags]:environment. This is the deployment environment where the Cassandra cluster identified by the value ofserversresides. For example: dev, prod or qa. While this value is optional we highly recommend setting it.db_cluster. Enter a name to identify this Cassandra cluster. This cluster name will be shown in the Sumo Logic dashboards.db_cluster_address- Enter the cluster hostname or ip address that is used by the application to connect to the database. It could also be the load balancer or proxy endpoint.db_cluster_port- Enter the database port. If not provided, a default port will be used.
Do not modify the following values set by this configuration as it will cause the Sumo Logic app to not function correctly.
- In the tags section (
[inputs.jolokia2_agent.tags]):component: “database”- This value is used by Sumo Logic apps to identify application components.db_system: “cassandra”- This value identifies the database system.
db_cluster_address and db_cluster_port should reflect exact configuration of DB client configuration in your application, especially if you instrument it with OT tracing. The values of these fields should match exactly the connection string used by the database client (reported as values for net.peer.name and net.peer.port metadata fields).
For example, if your application uses “cassandra-prod.sumologic.com:3306” as the connection string, the field values should be set as follows:
db_cluster_address=cassandra-prod.sumologic.com db_cluster_port=3306
If your application connects directly to a given Cassandra node, rather than the whole cluster, use the application connection string to override the value of the “host” field in the Telegraf configuration:
host=cassandra-prod.sumologic.com
Pivoting to Tracing data from Entity Inspector is possible only for “Cassandra address” Entities.
- In the output plugins section, which is
[[outputs.sumologic]]:url- This is the HTTP source URL created in step 3. Please see this doc for more information on additional parameters for configuring the Sumo Logic Telegraf output plugin.
- Do not modify the following values as it will cause the Sumo Logic apps to not function correctly.
data_format - “prometheus”In the output plugins section, which is[[outputs.sumologic]]. Metrics are sent in the Prometheus format to Sumo Logicdb_system: “cassandra”- In the input plugins section: This value identifies the database system.component: “database”- In the input plugins section: This value identifies application components.
- For all other parameters please see this doc for more properties that can be configured in the Telegraf agent globally.
Once you have finalized your telegraf.conf file, you can start or reload the telegraf service using instructions from the doc. At this point, Cassandra metrics should start flowing into Sumo Logic.
Configure Logs Collection
This section provides instructions for configuring log collection for Cassandra running on a non-Kubernetes environment.
By default, Cassandra logs are stored in a log file. Sumo Logic supports collecting logs from a local log file by using a local file source via Installed collectors. The installed collector will require you to allow outbound traffic to Sumo Logic endpoints for collection to work. For detailed requirements for Installed collectors, see this page.
Based on your infrastructure and networking setup choose one of these methods to collect Cassandra logs and follow the instructions below to set up log collection:
- Configure logging in Cassandra. Cassandra supports logging via the local text log files. Cassandra logs have the following levels of verbosity. To select a level, set loglevel to one of:
- ALL
- TRACE
- DEBUG
- INFO (Default)
- WARN
- ERROR
- OFF
To permanently add debug logging to a class permanently using the logback framework, use nodetool setlogginglevel to check you have the right class before you set it in the logback.xml file in install_location/conf. Modify to include the following line or similar at the end of the file:
<logger name="org.apache.cassandra.gms.FailureDetector" level="DEBUG"/>
Restart the node to invoke the change.
2. Configure Cassandra to log to a Local file. Cassandra provides logging functionality using Simple Logging Facade for Java (SLF4J) with a logback backend. Cassandra has three main logs, the system.log, debug.log, and gc.log which hold general logging messages, debugging logging messages, and java garbage collection logs, respectively.
These logs, by default, live in ${CASSANDRA_HOME}/logs, but most Linux distributions relocate logs to /var/log/cassandra. Operators can tune this location as well as what levels are logged using the provided logback.xml file.
You can configure logging programmatically or manually. Manual ways to configure logging are:
- Run the nodetool setlogginglevel command.
- Configure the
logback-test.xmlorlogback.xmlfile installed with Cassandra. - Use the JConsole tool to configure logging through JMX.
Logs from the Cassandra log file can be collected via a Sumo Logic Installed collector and a Local File Source as explained in the next section. 3. Configure a Collector To add an Installed collector, perform the steps as defined on the page Configure an Installed Collector. 4. Configure a Local File Source. To collect logs directly from your Cassandra machine, use an Installed Collector and a Local File Source.
- Add a Local File Source.
- Configure the Local File Source fields as follows:
- Name. (Required)
- Description. (Optional)
- File Path (Required). Enter the path to your log files. The files are typically located in
/var/log/cassandra/system.log. If you are using a customized path, check thelogback.xmlfile for this information. - Source Host. Sumo Logic uses the hostname assigned by the OS unless you enter a different host name
- Source Category. Enter any string to tag the output collected from this Source, such as Cassandra/Logs. The Source Category metadata field is a fundamental building block to organize and label Sources. For details, see Best Practices.
- Fields. Set the following fields:
component = databasedb_system = cassandradb_cluster = <Your_Cassandra_Cluster_Name>environment = <Environment_Name>, such as Dev, QA or Prod.db_cluster_address- Enter the cluster hostname or ip address that is used by the application to connect to the database. It could also be the load balancer or proxy endpoint.db_cluster_port- Enter the database port. If not provided, a default port will be used.
- Configure the Advanced section:
- Enable Timestamp Parsing. Select Extract timestamp information from log file entries.
- Time Zone. Choose the option, Ignore time zone from log file and instead use, and then select your Cassandra Server’s time zone.
- Timestamp Format. The timestamp format is automatically detected.
- Encoding. Select UTF-8 (Default).
- Enable Multiline Processing. Detect messages spanning multiple lines
- Infer Boundaries - Detect message boundaries automatically
- Click Save.
At this point, Cassandra logs should start flowing into Sumo Logic.
Method B: Using OpenTelemetry
We use the Telegraf receiver of Sumo Logic OpenTelemetry Distro Collector for Cassandra metric collection and filelog receiver for collecting Cassandra logs. Sumo Logic OT distro runs on the same system as Cassandra, and uses the Cassandra Jolokia input plugin for Telegraf to obtain Cassandra metrics, and the Sumo Logic exporter to send the metrics to Sumo Logic.
Configure Metrics and Logs Collection
- Install sumologic-otel-collector by following the instructions for your operating system:
- Configure and start sumologic-otel-collector. As part of collecting metrics data from Cassandra, we will use the jolokia2 input plugin for Telegraf to get data from otel and then send data to Sumo Logic. Create or modify config.yaml. Sample config is here. Please enter values for the following parameters.
- Enter Sumo Logic collection details in the section; extensions > sumologic by referring to these instructions. Configure details like collector name, category, install token, endpoint etc.
- In the input plugins section, that is
[[inputs.jolokia2_agent]]:urls- The URL to the jolokia server. Please see this doc for more information on additional parameters for configuring the Cassandra input plugin for Telegraf.
- In the tags section, which is
[inputs.Cassandra.tags]and filelog sectionenvironment. This is the deployment environment where the Cassandra cluster identified by the value of servers resides. For example: dev, prod or qa. While this value is optional we highly recommend setting it.db_cluster. Enter a name to identify this Cassandra cluster. This cluster name will be shown in the Sumo Logic dashboards.
- In the exporter plugins section :
- Enter details like
source_categoryandsource_host. Please see this doc for more information on additional parameters for configuring the Sumo Logic Telegraf output plugin.
- Enter details like
- Do not modify the following values as it will cause the Sumo Logic apps to not function correctly.
data_format - “prometheus”In the output plugins section, which is[[outputs.sumologic]]Metrics are sent in the Prometheus format to Sumo Logicdb_system: “cassandra”- In the input plugins section: This value identifies the database system.component: “database”- In the input plugins section: This value identifies application components.
- For all other parameters, see this doc for more properties that can be configured in the Telegraf agent globally.
- Run the Sumo Logic OT Distro using the below command
otelcol-sumo --config config.yaml
At this point, Cassandra metrics and logs should start flowing into Sumo Logic.
Installing the Cassandra app
This step is not needed if you are using the Application Components Solution Terraform script.
To install the app, do the following:
Next-Gen App: To install or update the app, you must be an account administrator or a user with Manage Apps, Manage Monitors, Manage Fields, Manage Metric Rules, and Manage Collectors capabilities depending upon the different content types part of the app.
- Select App Catalog.
- In the 🔎 Search Apps field, run a search for your desired app, then select it.
- Click Install App.
note
Sometimes this button says Add Integration.
- Click Next in the Setup Data section.
- In the Configure section of your respective app, complete the following fields.
- Is K8S deployment involved. Specify if resources being monitored are partially or fully deployed on Kubernetes (K8s)
- Click Next. You will be redirected to the Preview & Done section.
Post-installation
Once your app is installed, it will appear in your Installed Apps folder, and dashboard panels will start to fill automatically.
Each panel slowly fills with data matching the time range query received since the panel was created. Results will not immediately be available but will be updated with full graphs and charts over time.
As part of the app installation process, the following fields will be created by default:
componentenvironmentdb_systemdb_clusterpoddb_cluster_addressdb_cluster_port
Additionally, if you're using Cassandra in the Kubernetes environment, the following additional fields will be created by default during the app installation process:
pod_labels_componentpod_labels_environmentpod_labels_db_systempod_labels_db_clusterpod_labels_db_cluster_addresspod_labels_db_cluster_port
For information on setting up fields, see Fields.
Viewing Cassandra dashboards
All dashboards have a set of filters that you can apply to the entire dashboard. Use these filters to drill down and examine the data to a granular level.
- You can change the time range for a dashboard or panel by selecting a predefined interval from a drop-down list, choosing a recently used time range, or specifying custom dates and times. Learn more.
- You can use template variables to drill down and examine the data on a granular level. For more information, see Filtering Dashboards with Template Variables.
- Most Next-Gen apps allow you to provide the scope at the installation time and are comprised of a key (
_sourceCategoryby default) and a default value for this key. Based on your input, the app dashboards will be parameterized with a dashboard variable, allowing you to change the dataset queried by all panels. This eliminates the need to create multiple copies of the same dashboard with different queries.
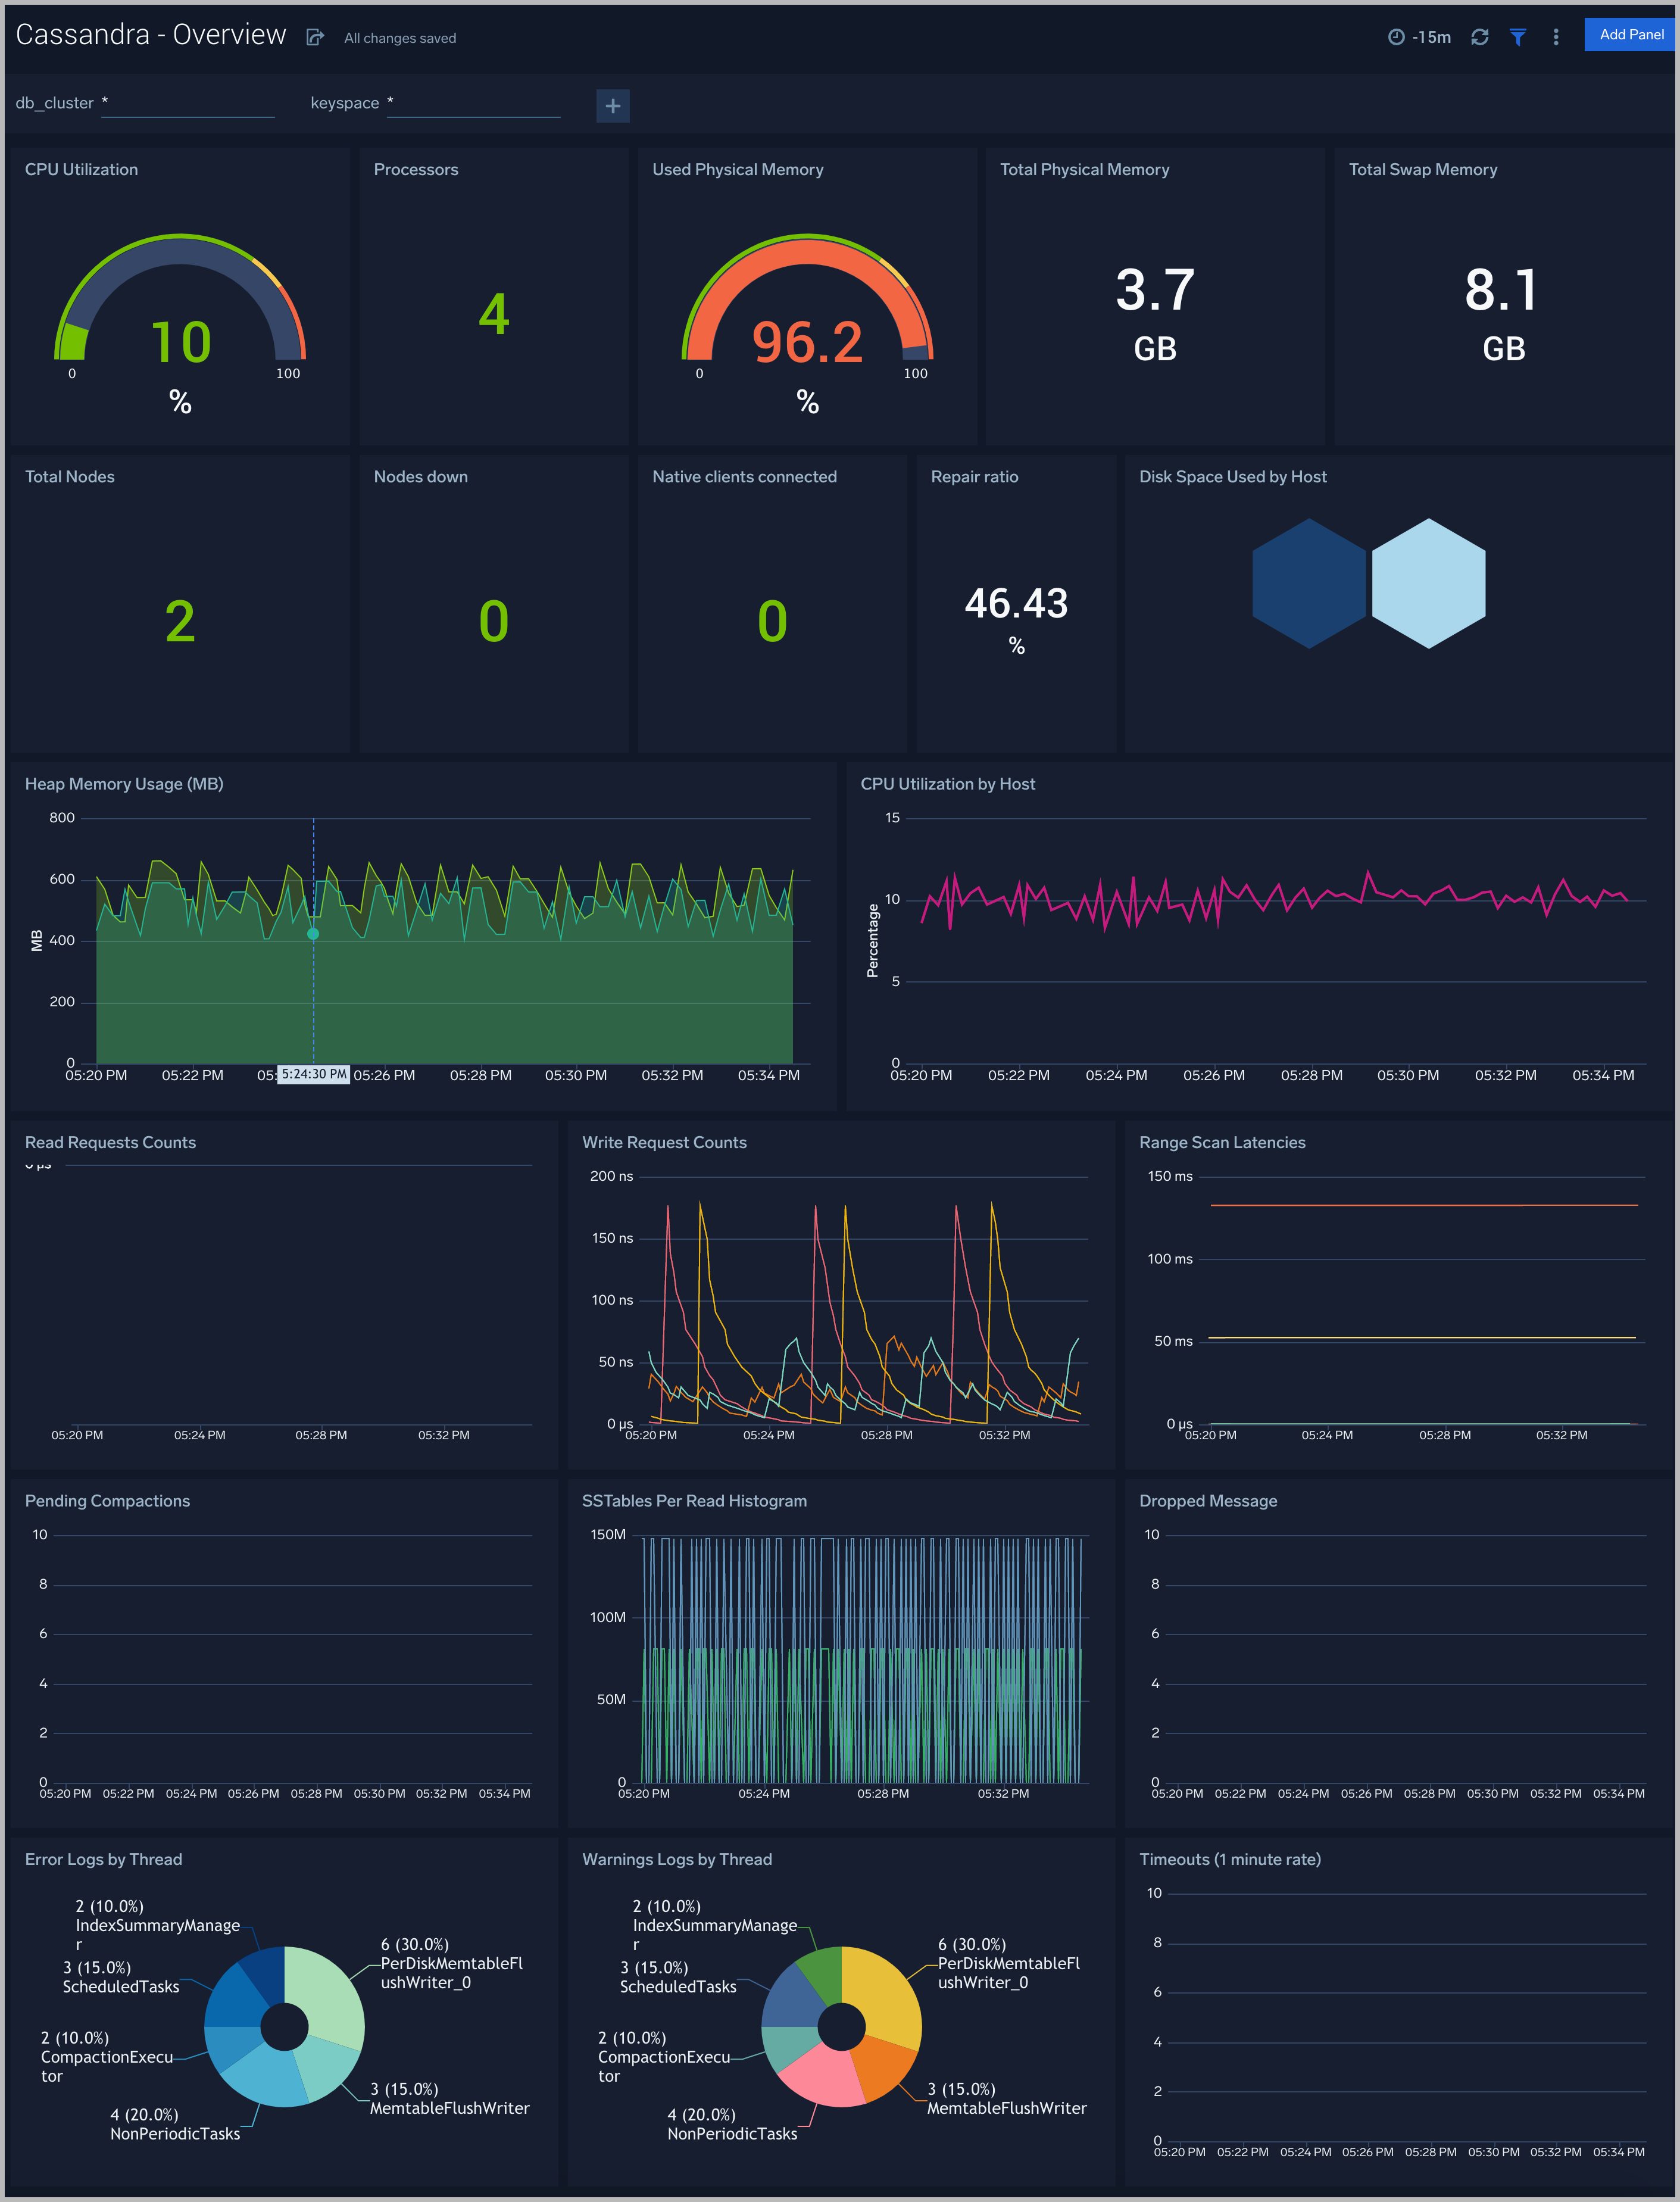
Overview
The Cassandra (Classic) - Overview dashboard provides an at-a-glance view of Cassandra backend and frontend HTTP error codes percentage, visitor location, URLs, and clients causing errors.
Use this dashboard to:
- Identify Frontend and Backend Sessions percentage usage to understand active sessions. This can help you increase the session limit.
- Gain insights into originated traffic location by region. This can help you allocate computer resources to different regions according to their needs.
- Gain insights into the client, server responses on the server. This helps you identify errors in the server.
- Gain insights into network traffic for the frontend and backend systems of your server.
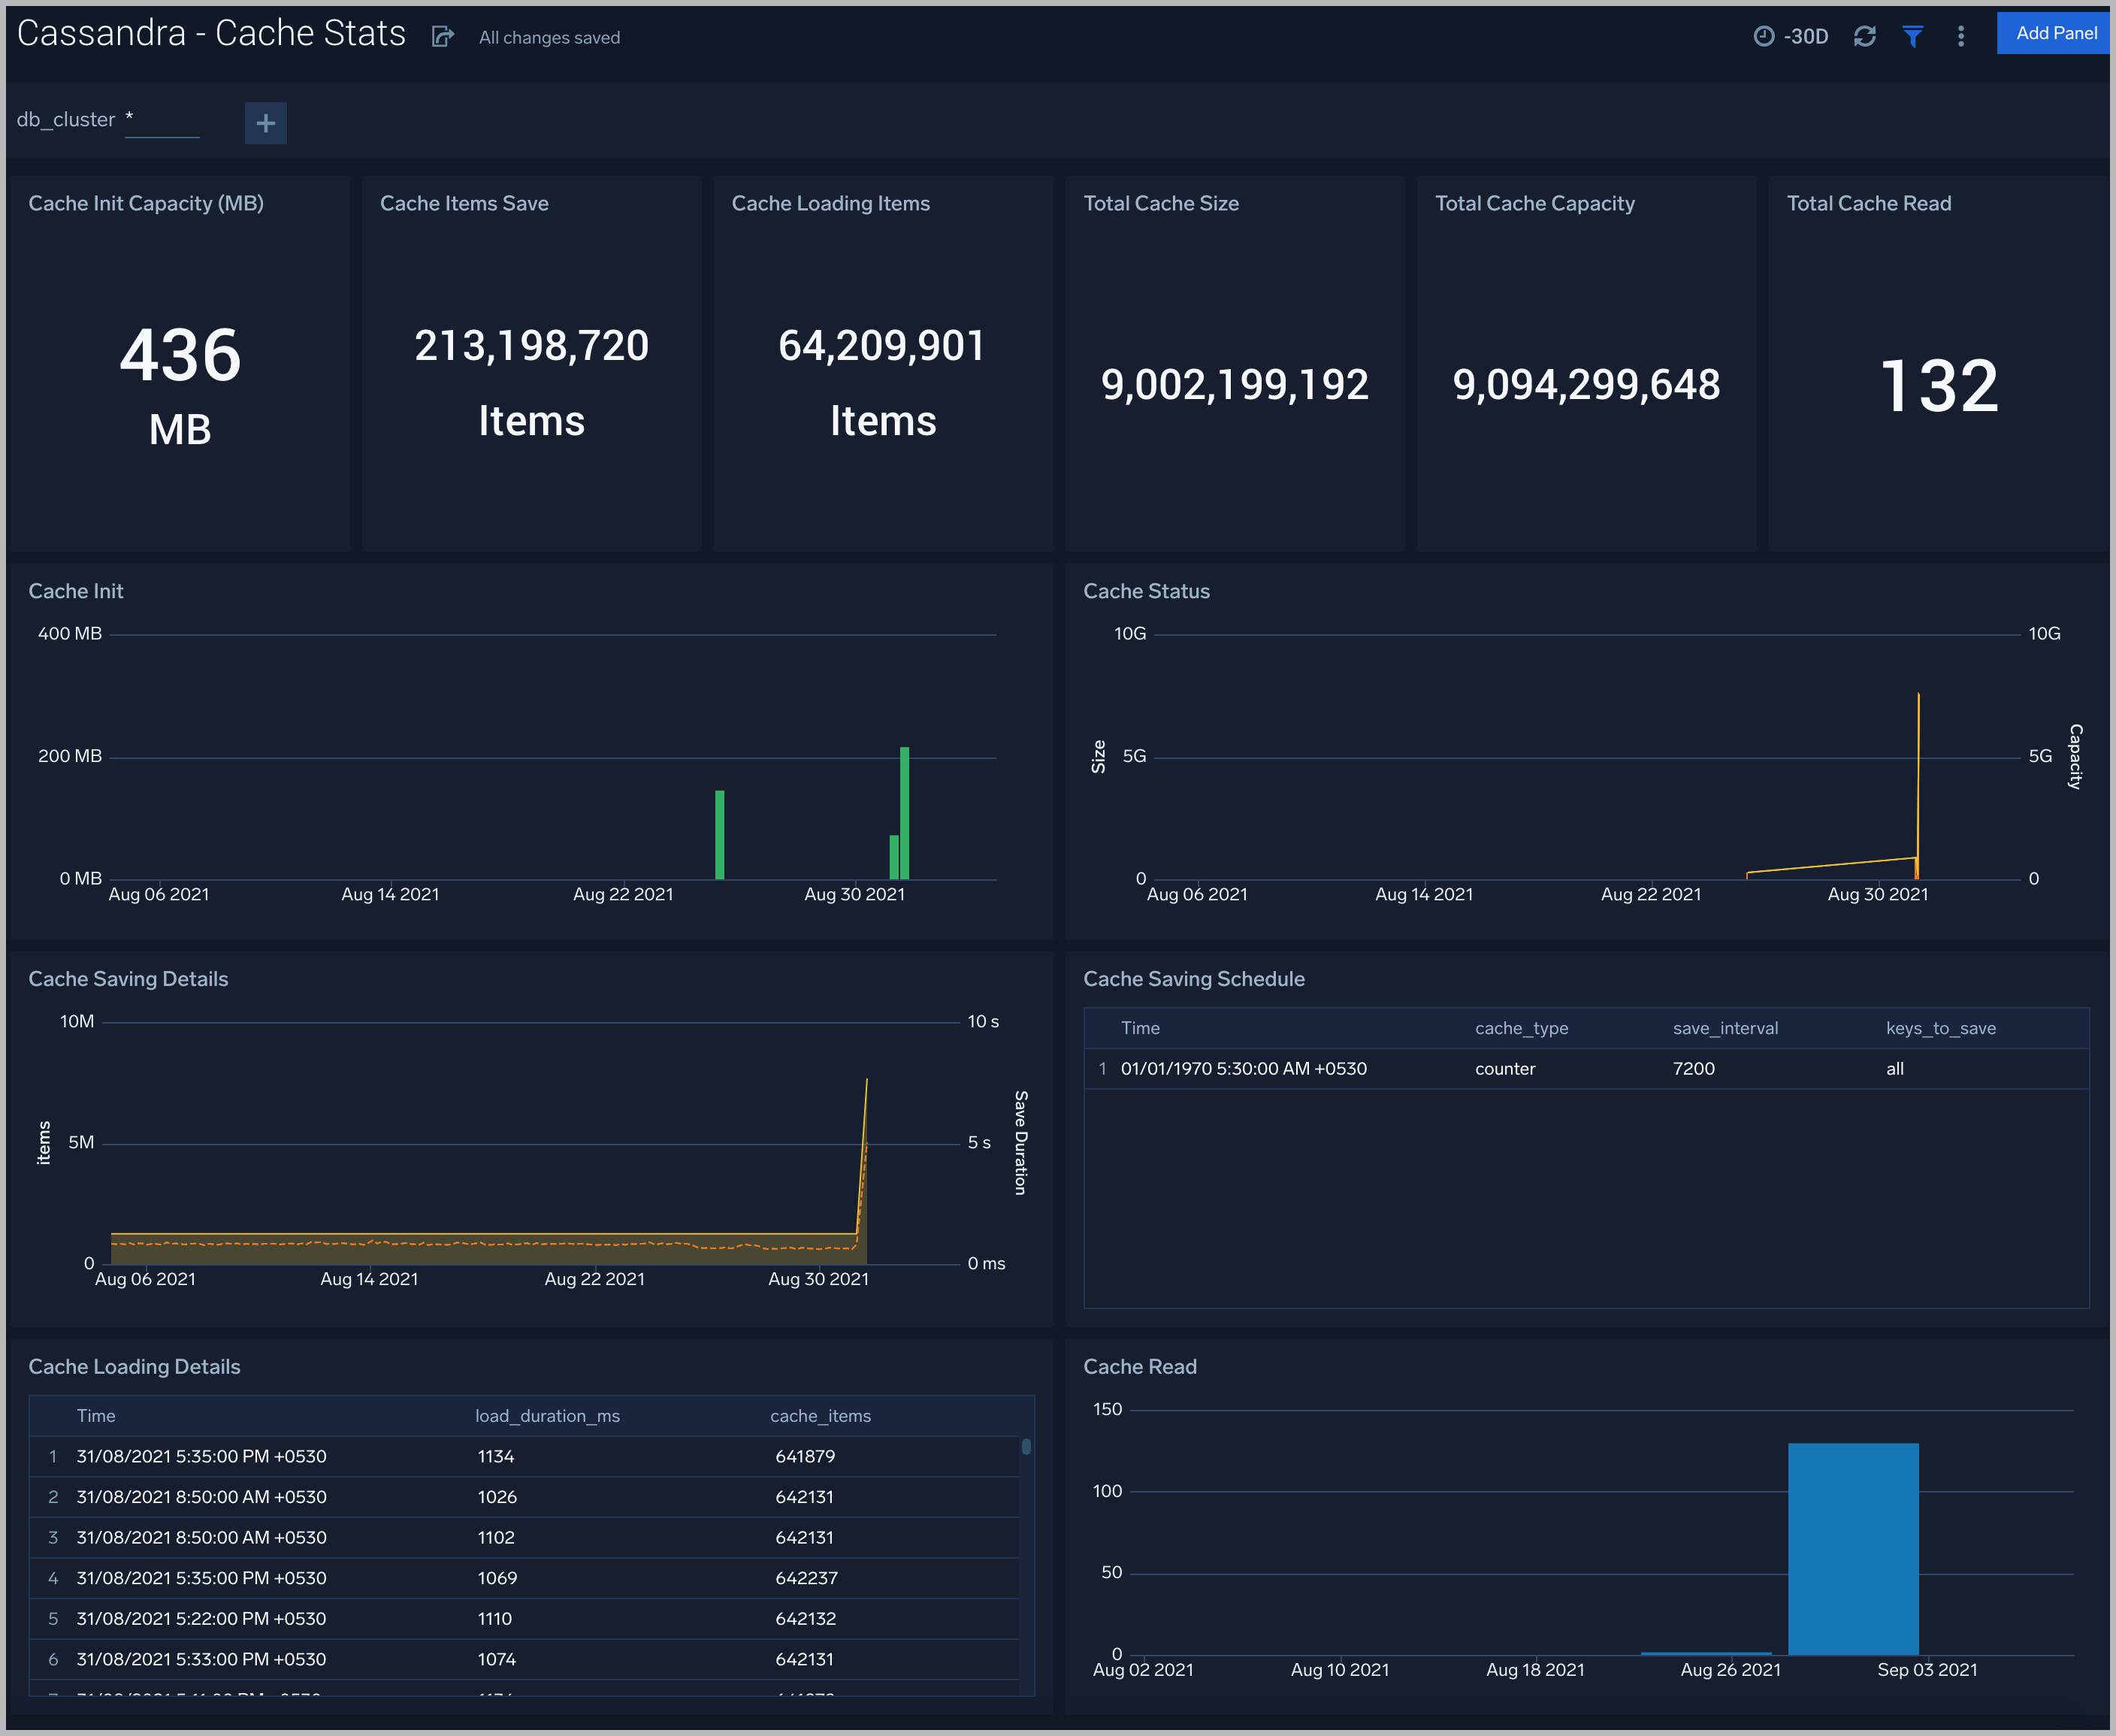
Cache Stats
The Cassandra (Classic) - Cache Stats dashboard provides insight into the database cache status, schedule, and items.
Use this dashboard to:
- Monitor Cache performance.
- Identify Cache usage statistics.
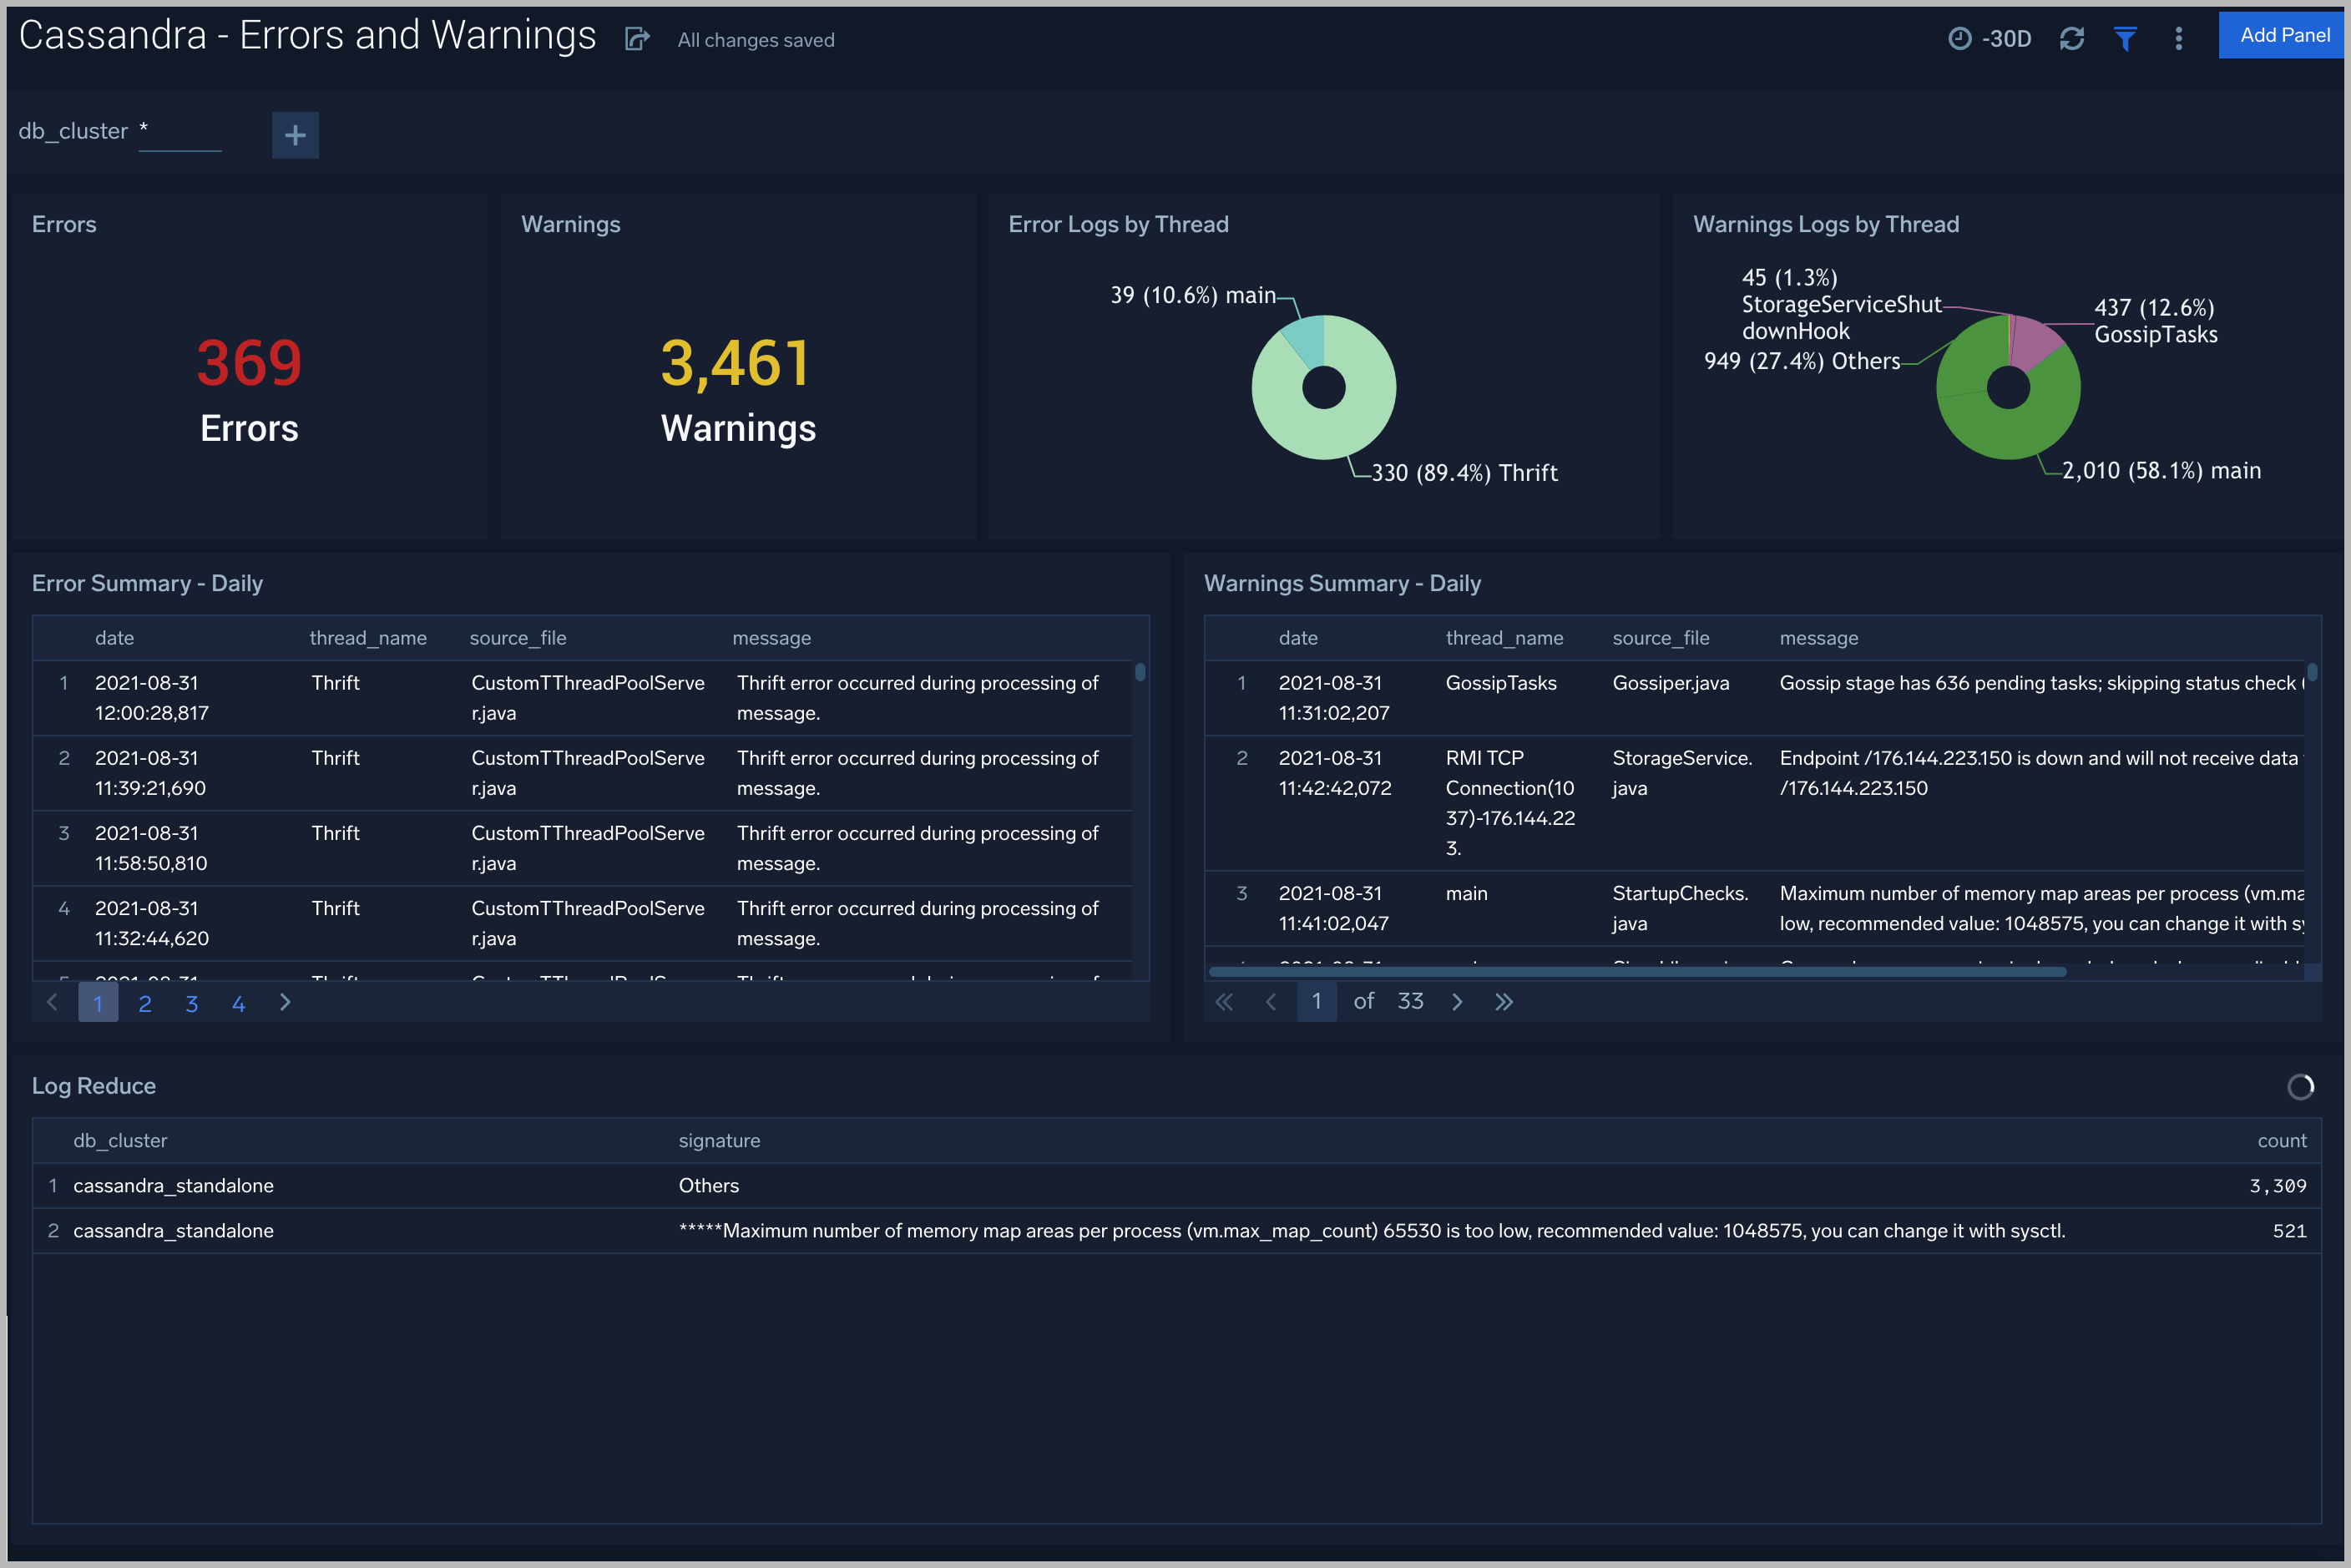
Errors and Warnings
The Cassandra (Classic) - Errors and Warnings dashboard provides details of the database errors and warnings.
Use this dashboard to:
- Review errors and warnings generated by the server.
- Review the Threads errors and warning events.
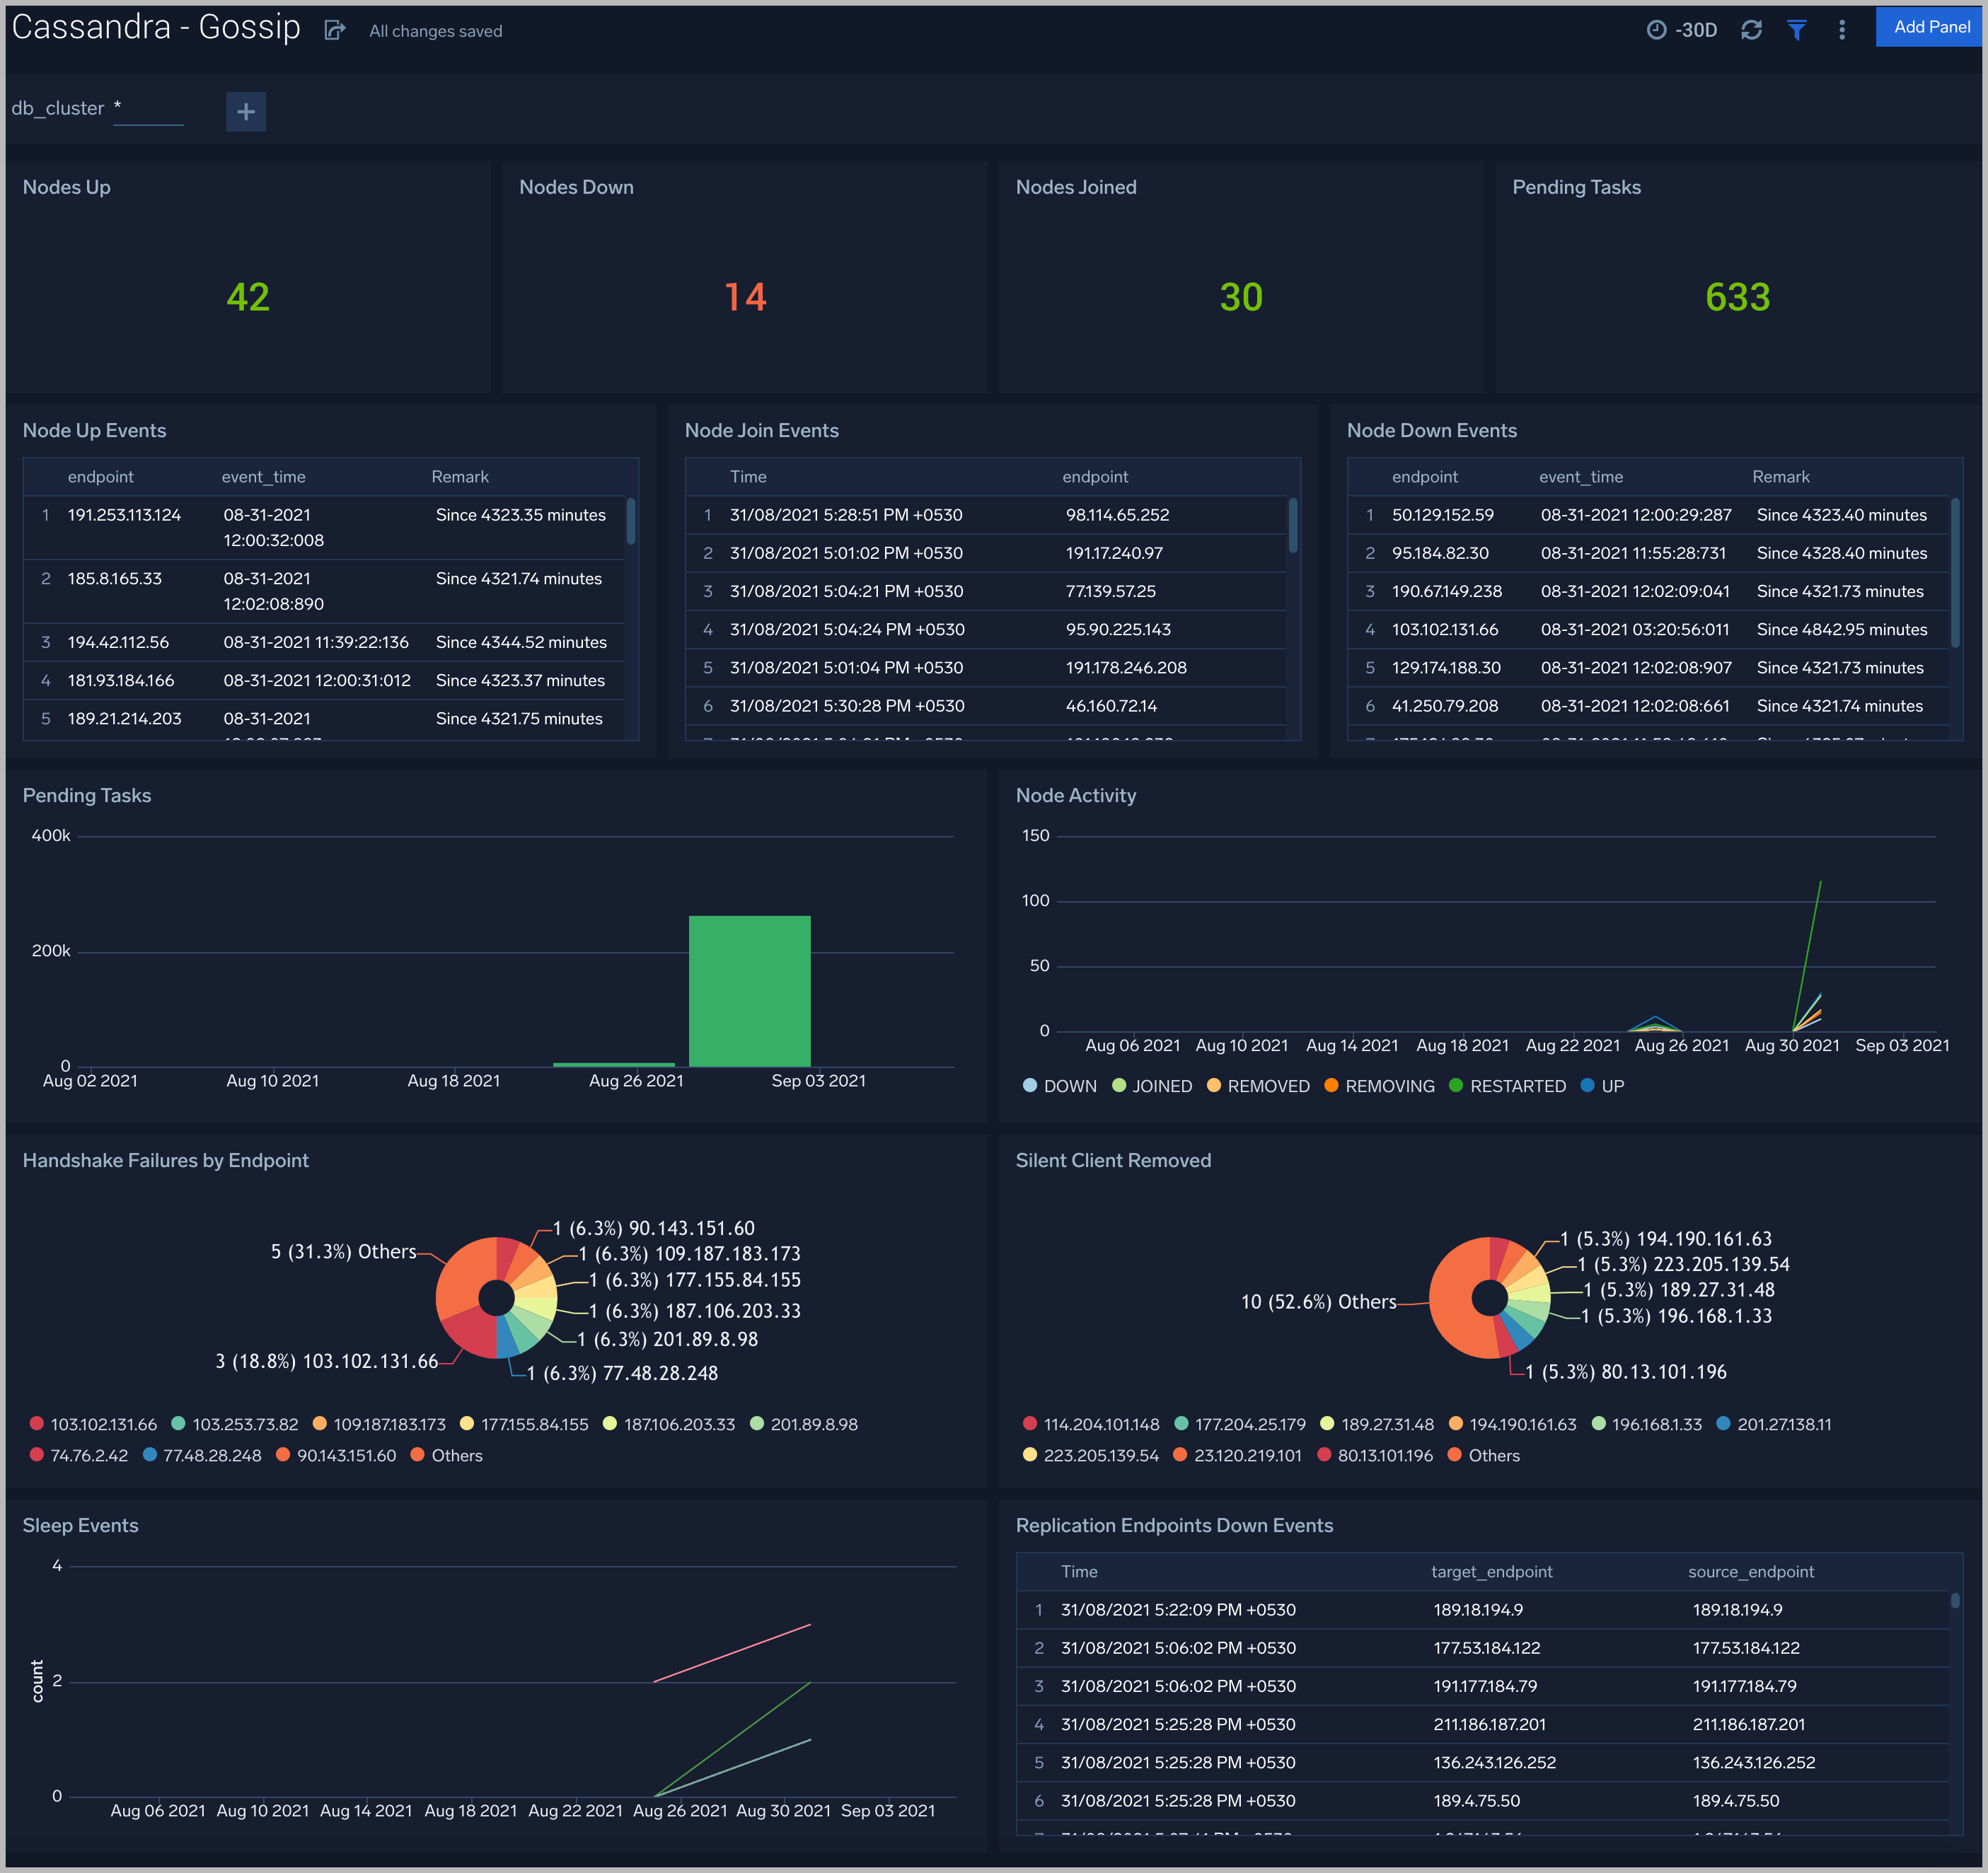
Gossip
The Cassandra (Classic) - Gossip dashboard provides details about communication between various cassandra nodes.
Use this dashboard to:
- Determine nodes with errors resulting in failures.
- Review the node activity and pending tasks.
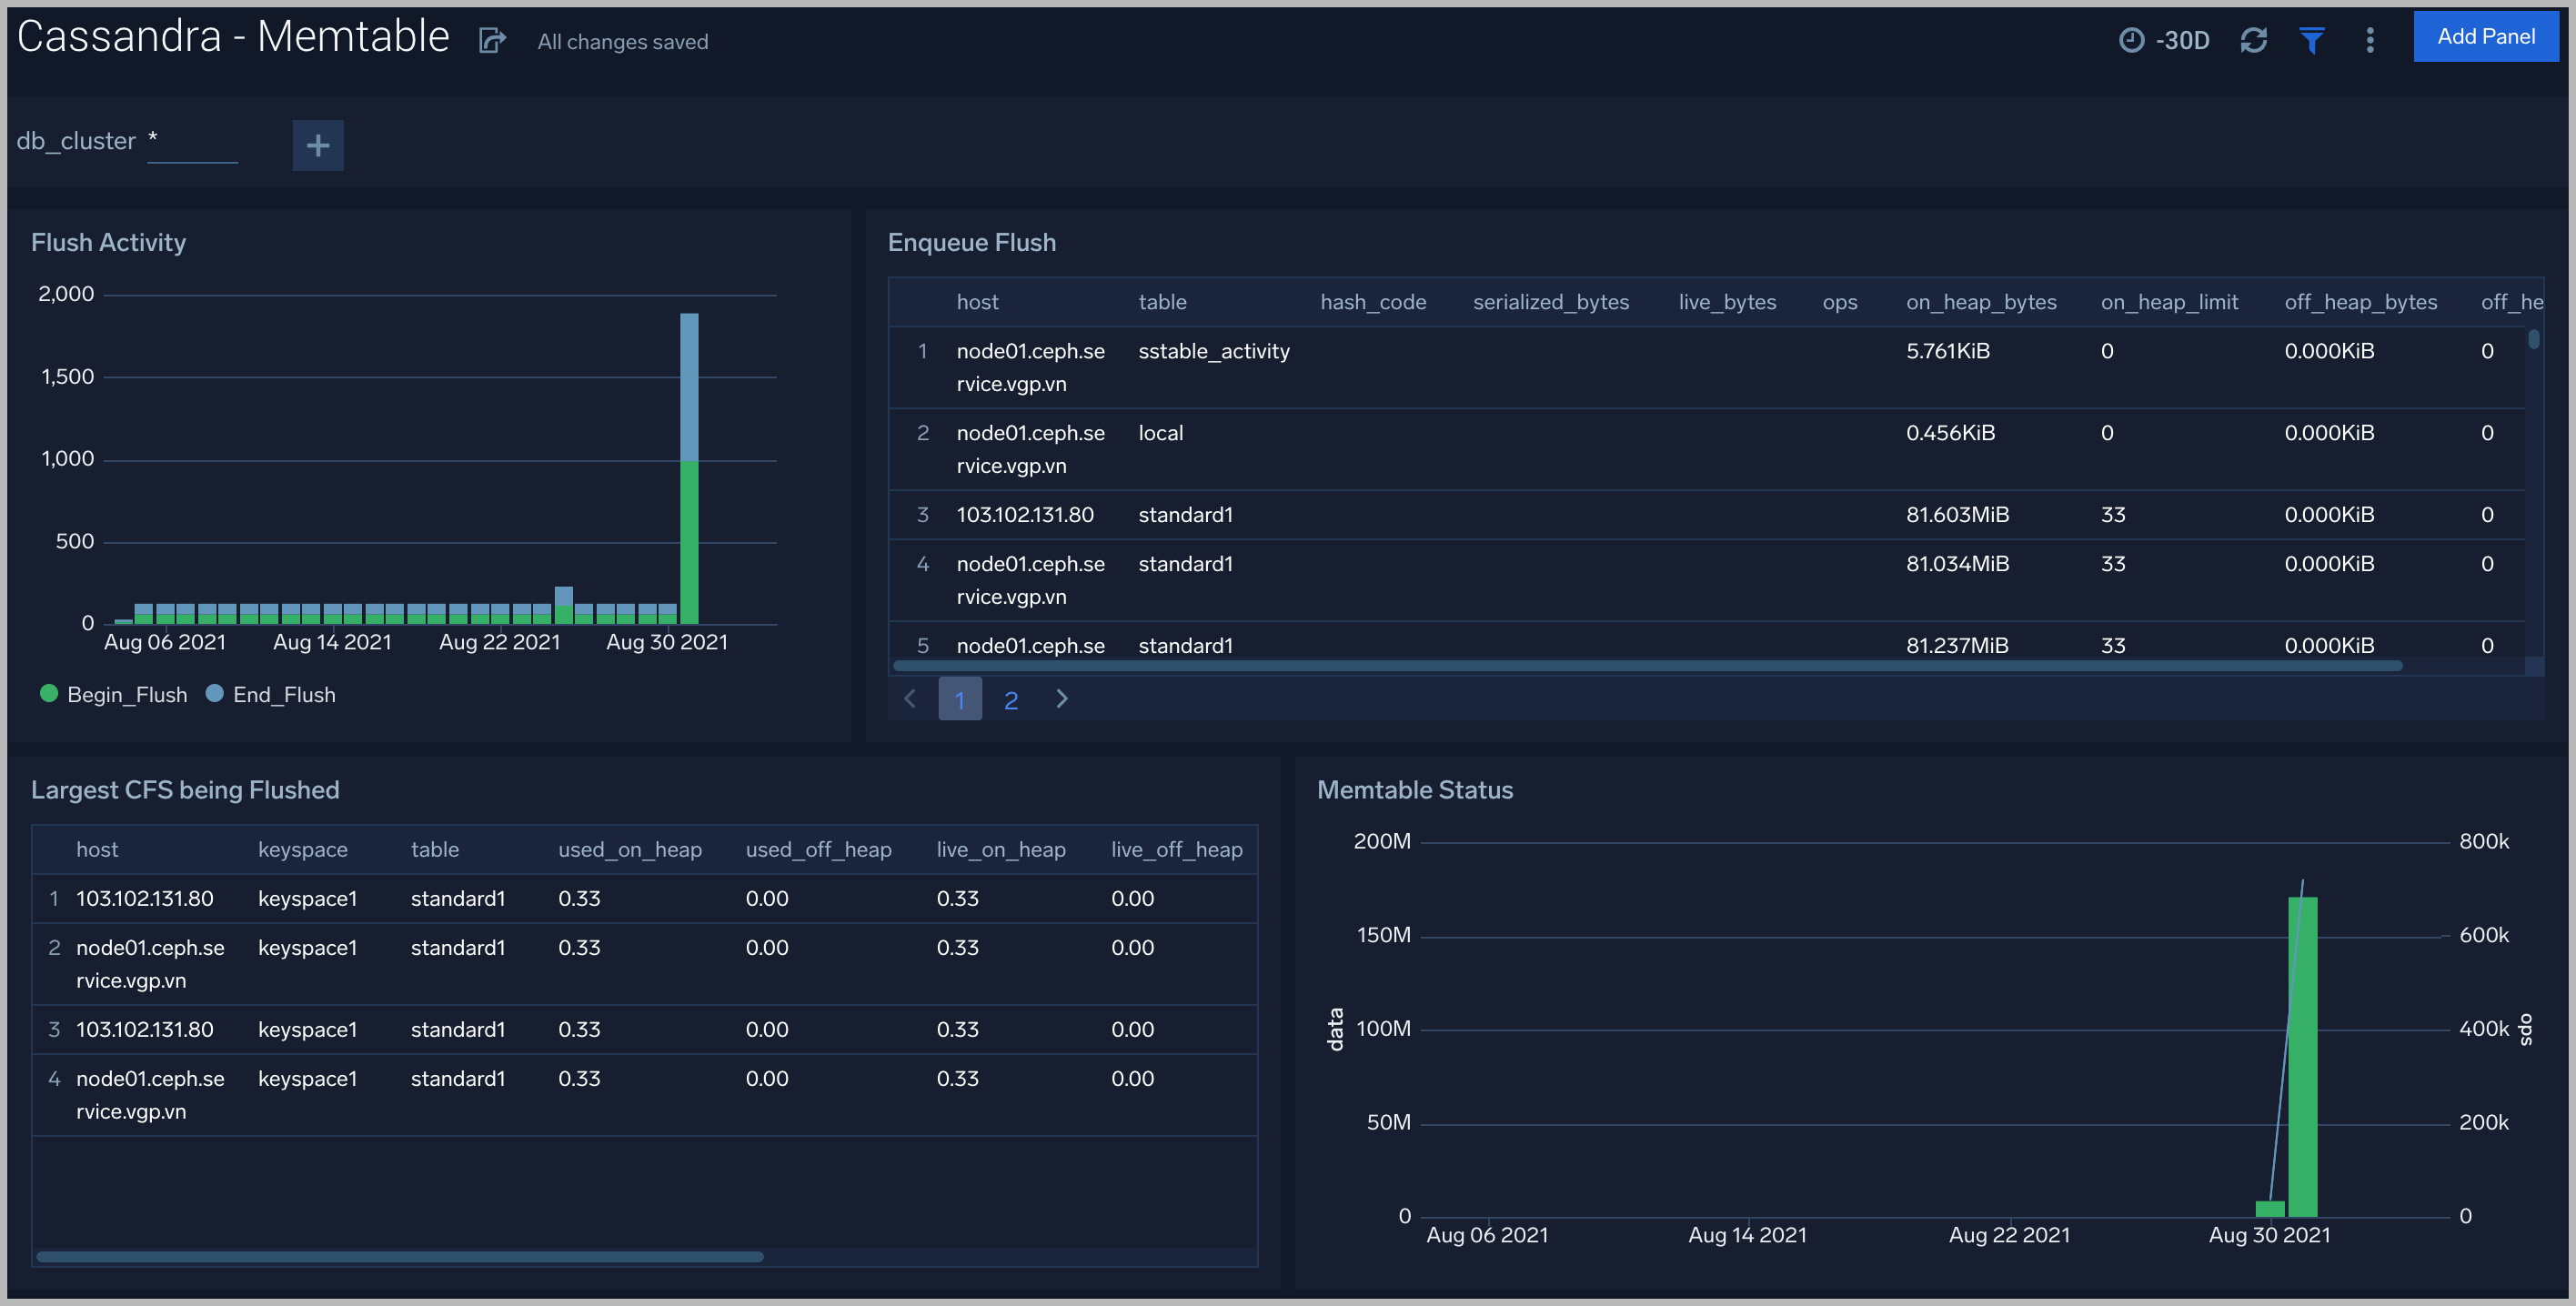
Memtable
The Cassandra (Classic) - Memtable dashboard provides insights into memtable statistics.
Use this dashboard to:
- Review flush activity and memtable status.
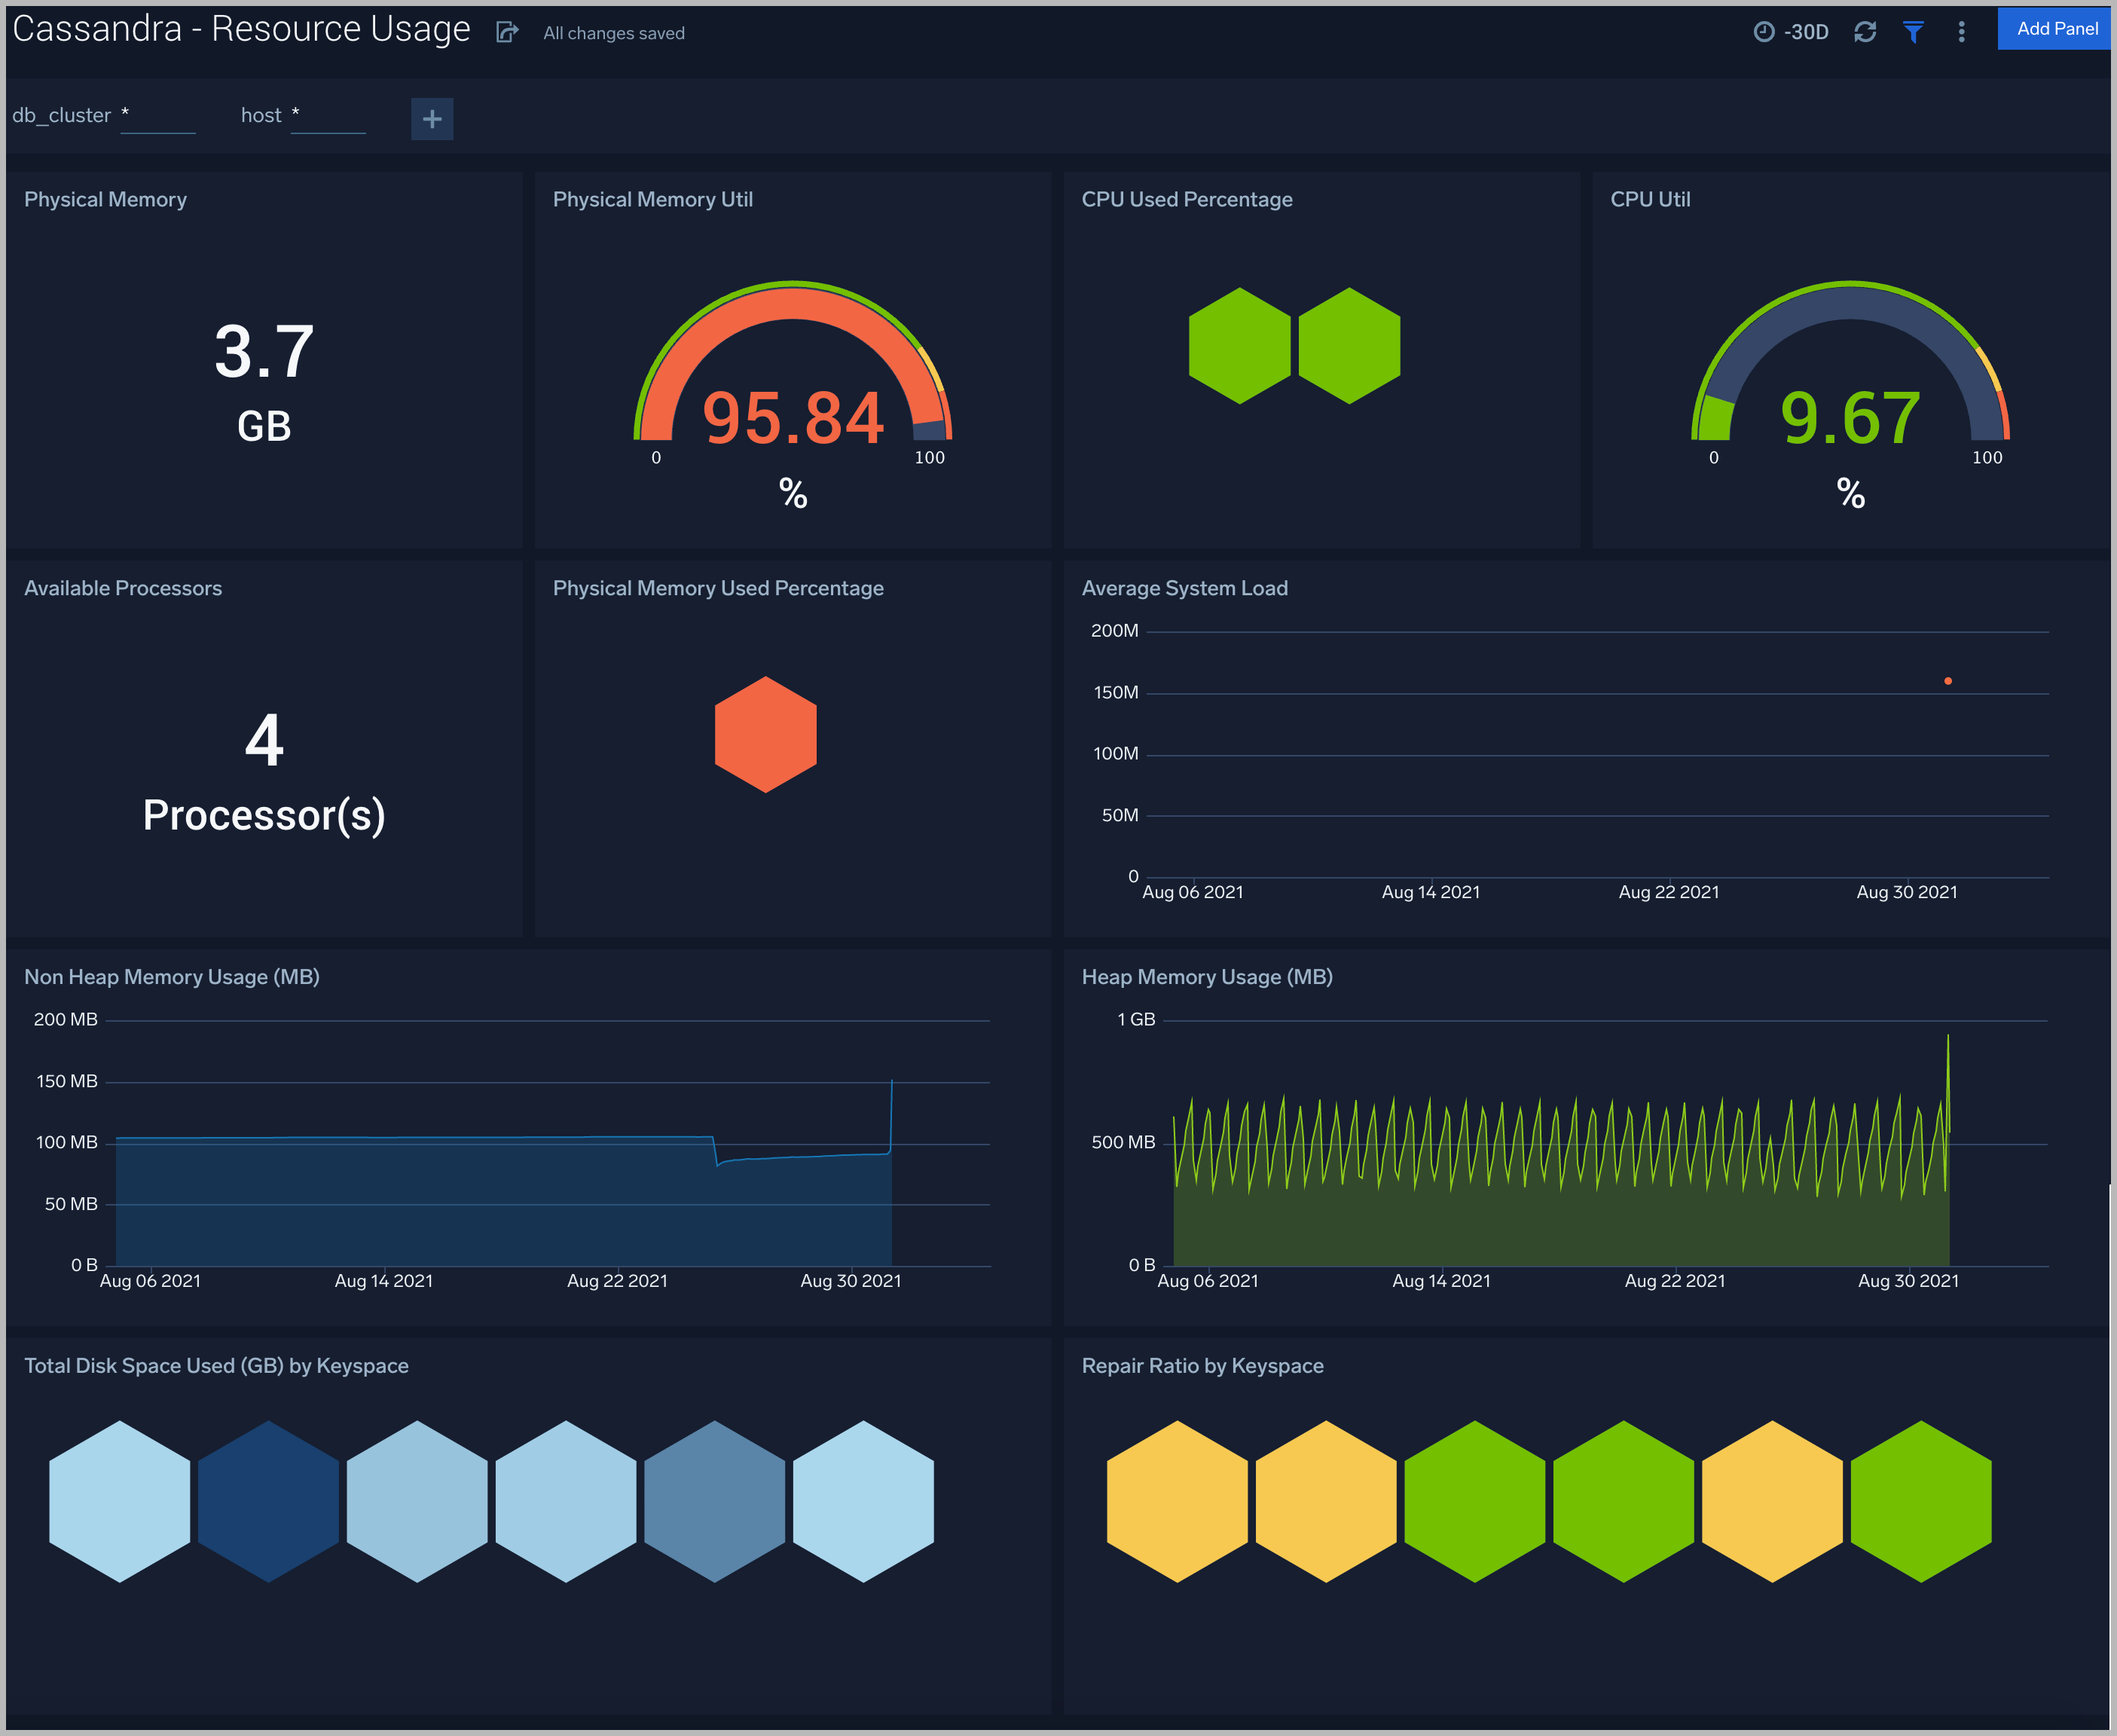
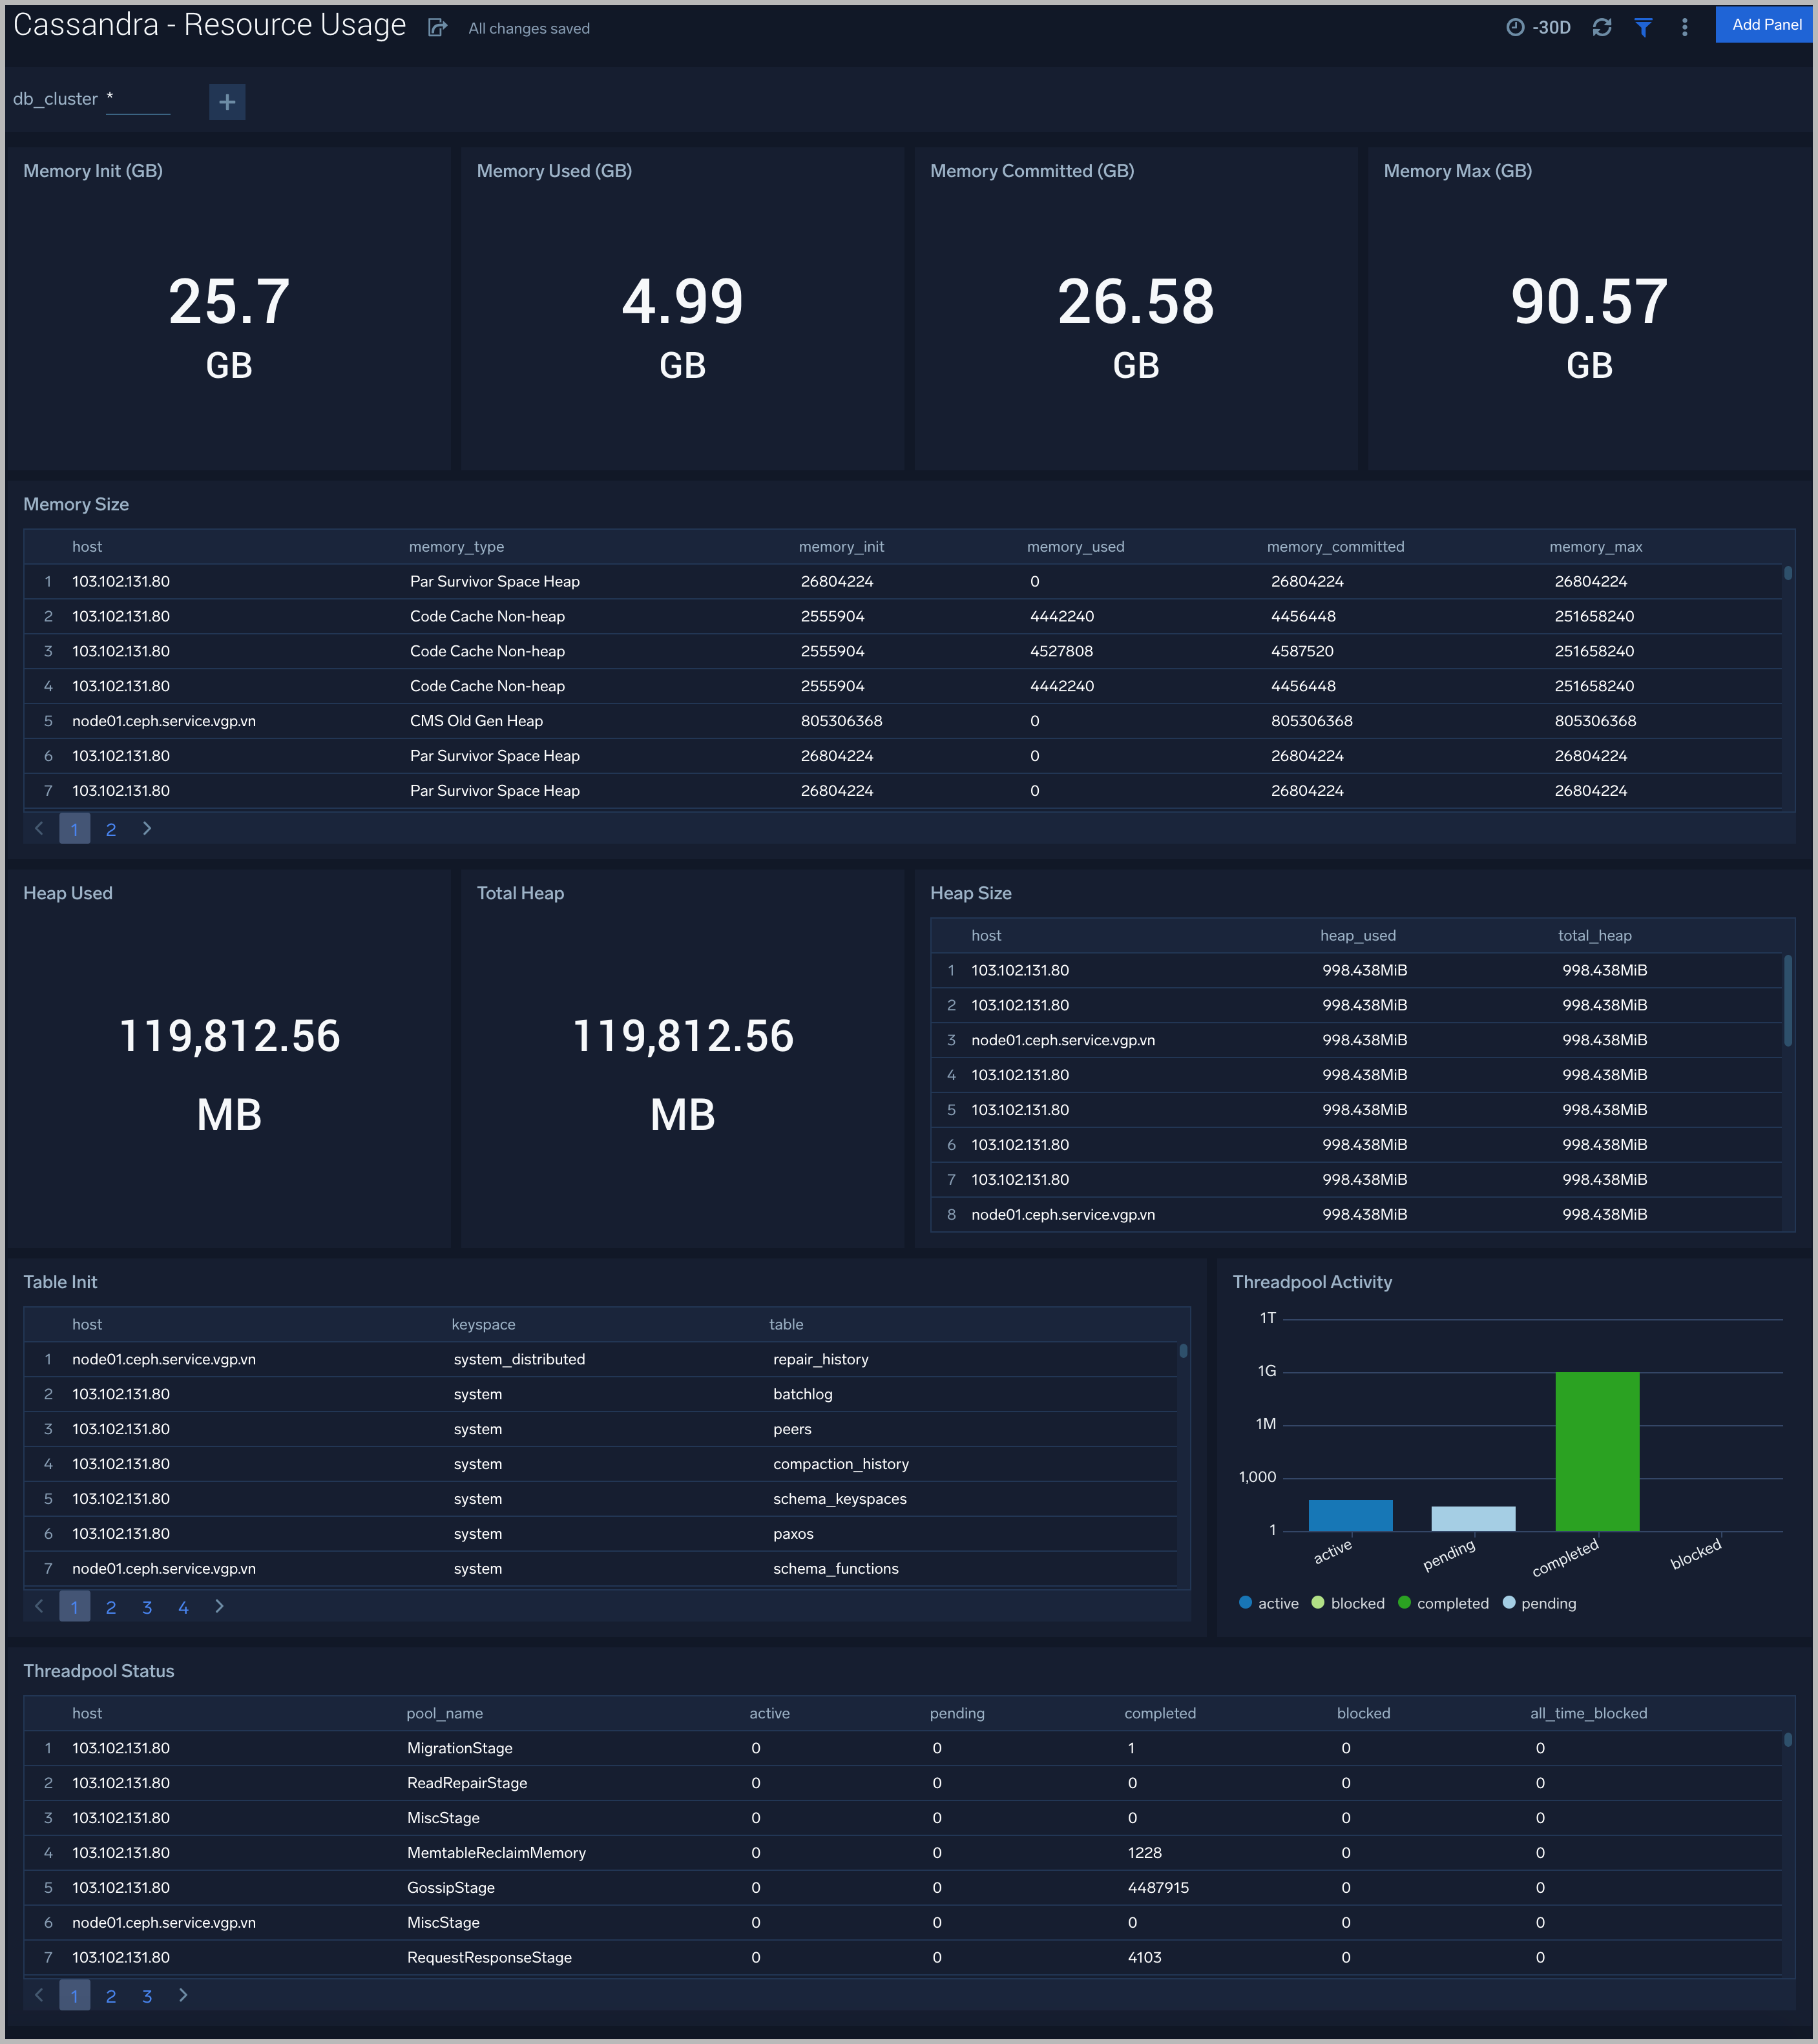
Resource Usage
The Cassandra (Classic) - Resource Usage dashboard provides details of resource utilization across Cassandra clusters.
Use this dashboard to:
- Identify resource utilization. This can help you to determine whether are resources over- or under-allocated.
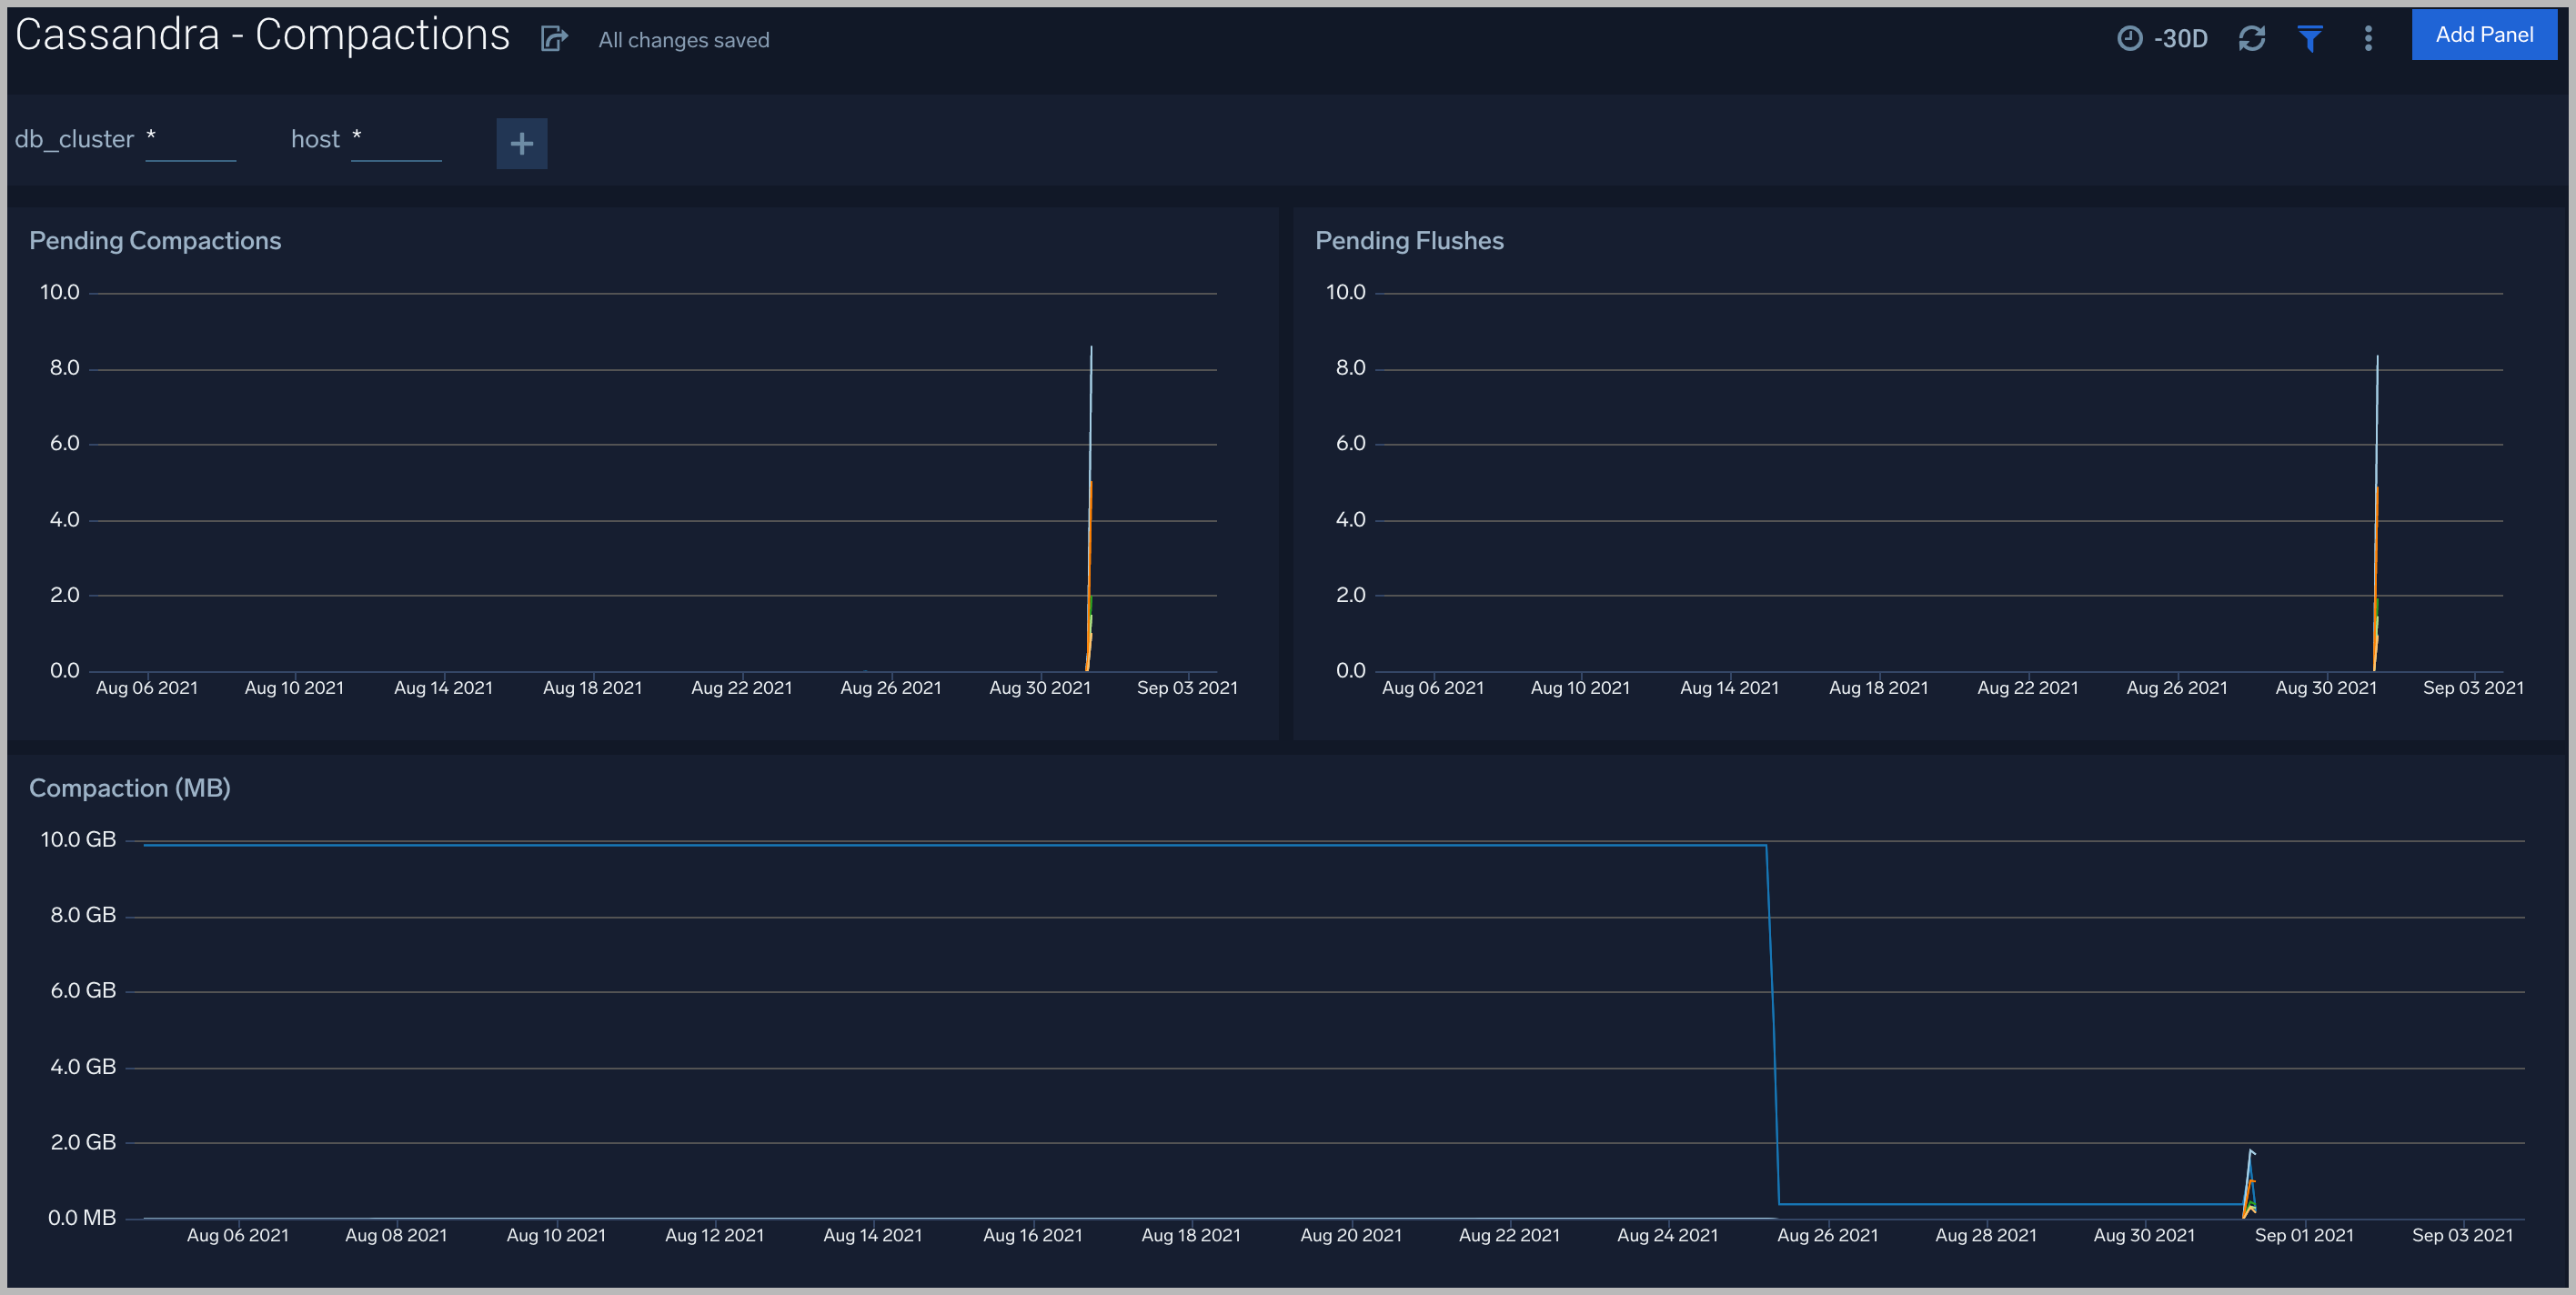
Compactions
The Cassandra (Classic) - Compactions dashboard provides details of compactions.
Use this dashboard to:
- Review pending/completed compactions and flushes.
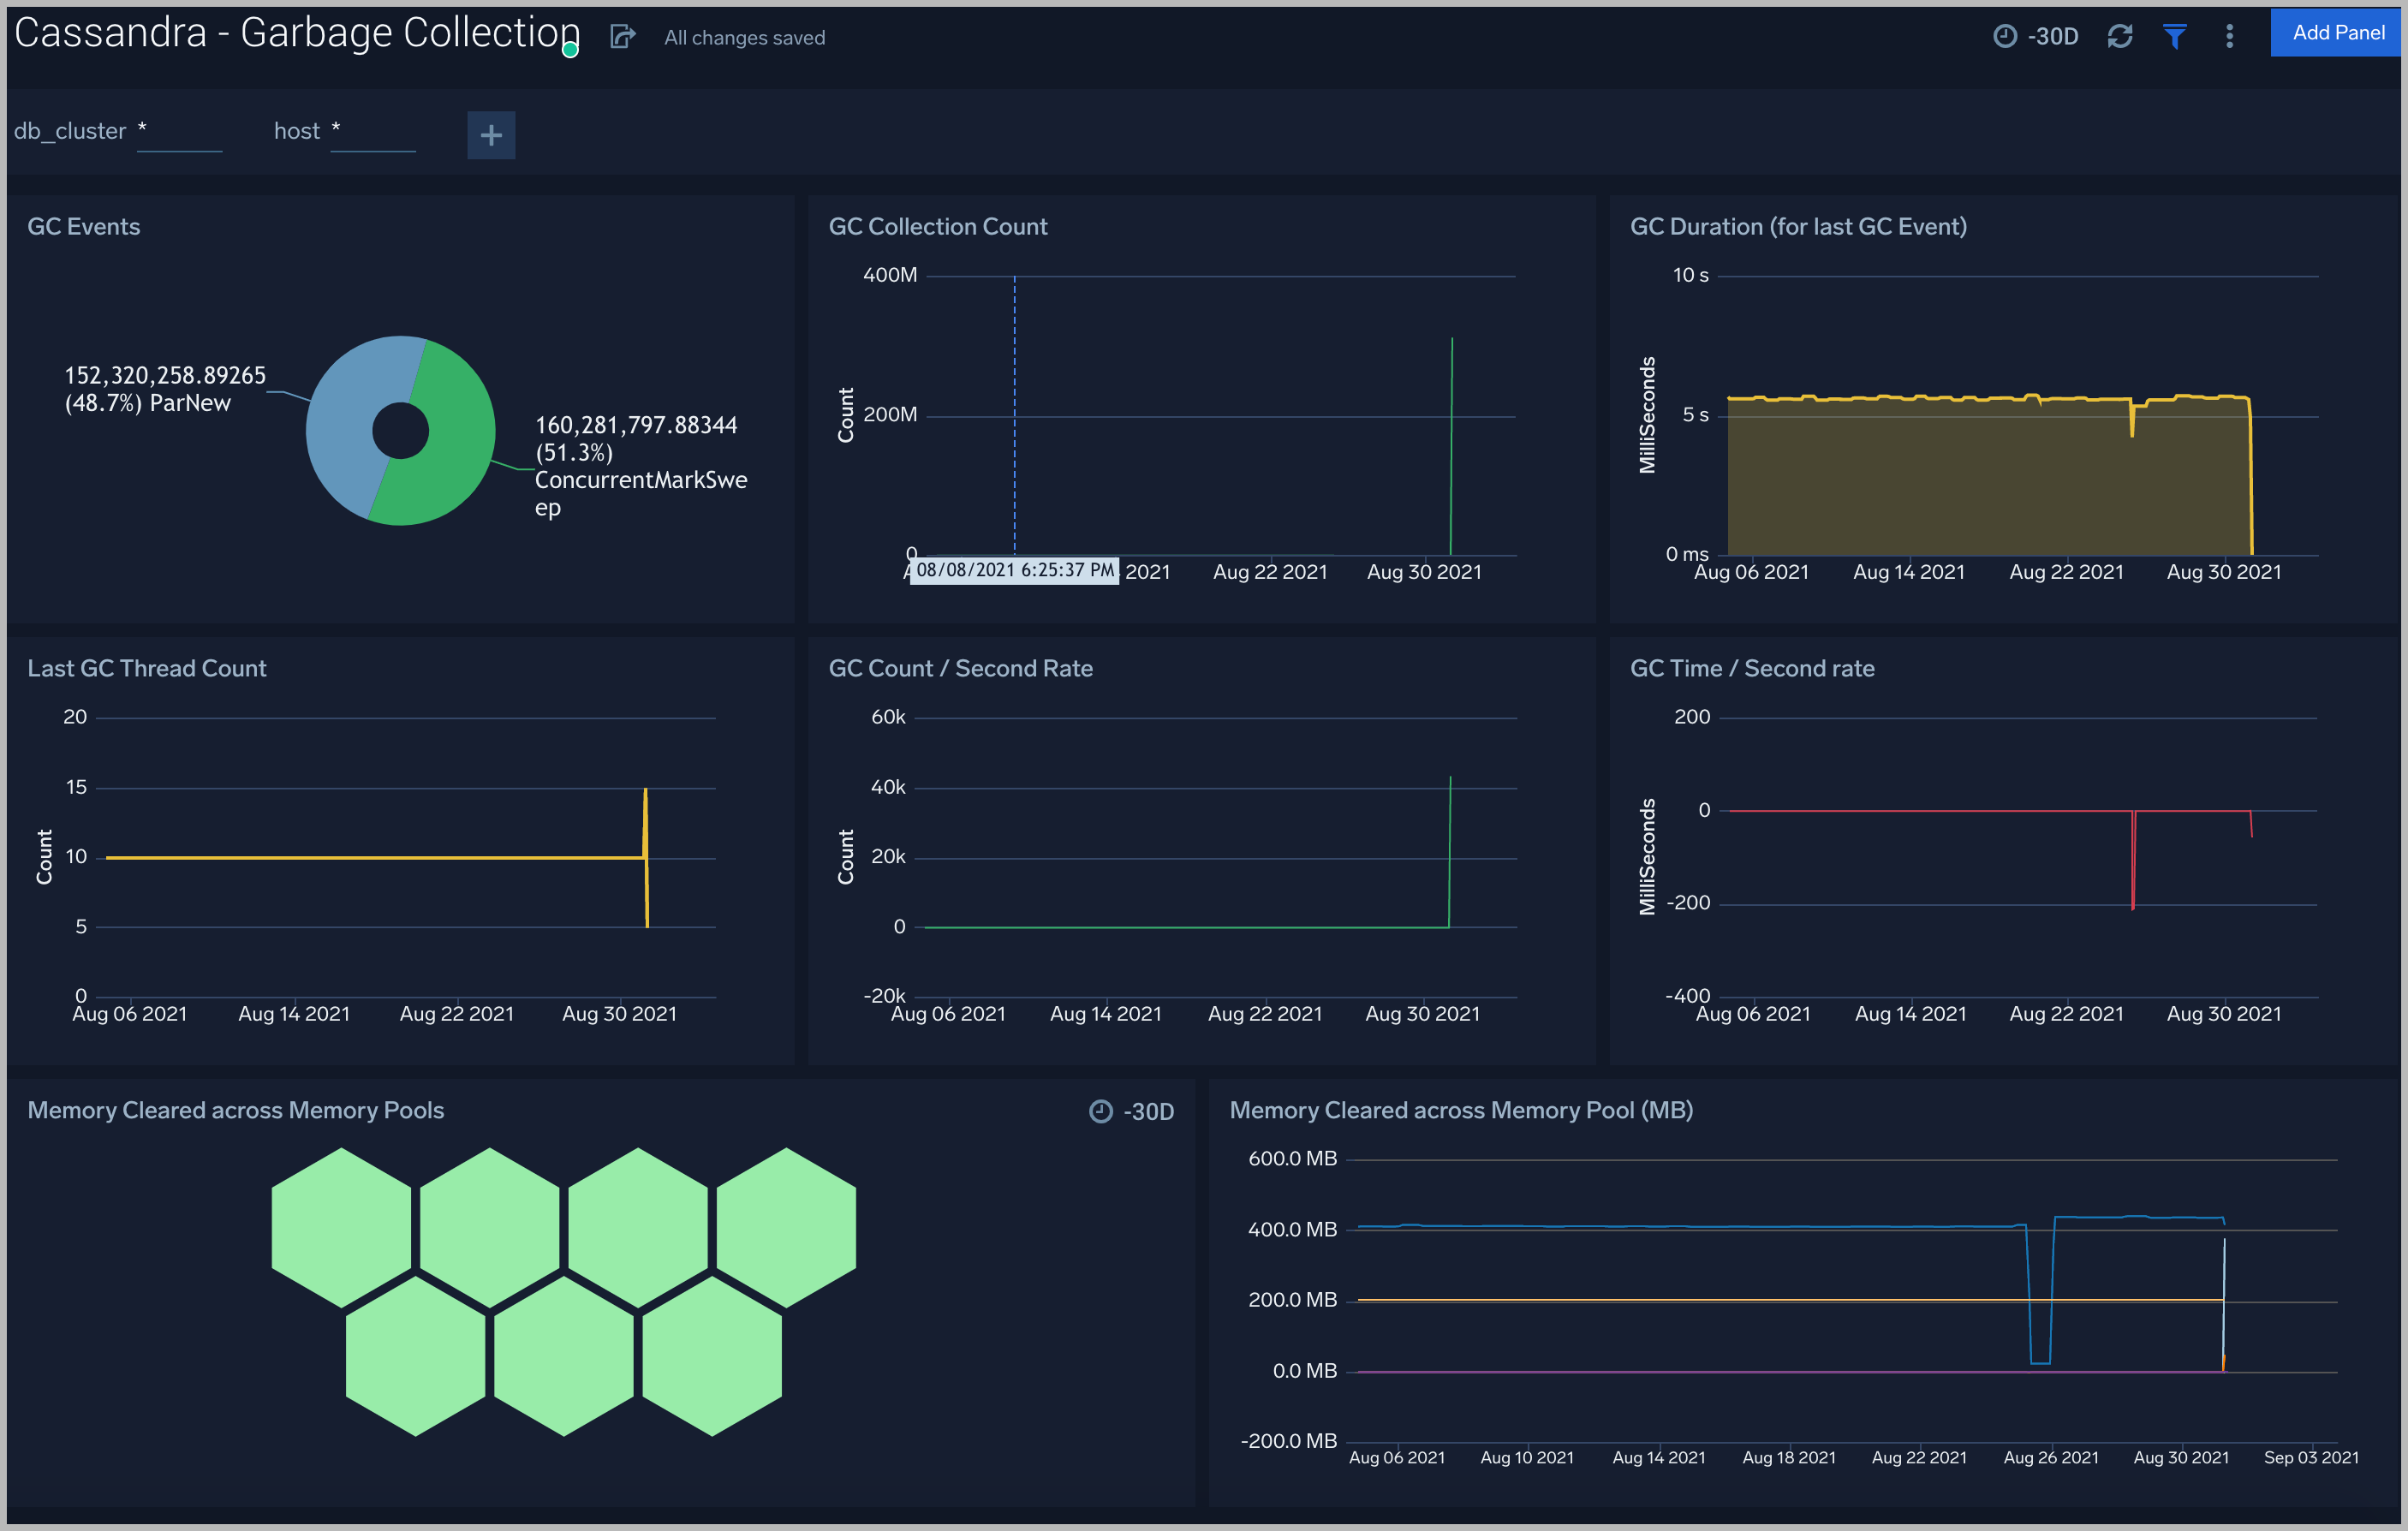
Garbage Collection
The Cassandra (Classic) - Garbage Collection dashboard shows key Garbage Collector statistics like the duration of the last GC run, objects collected, threads used, and memory cleared in the last GC run.
Use this dashboard to:
- Understand the garbage collection time. If the time keeps on increasing, you may have more CPU usage.
- Understand the amount of memory cleared by garbage collectors across memory pools and its impact on the Heap memory.
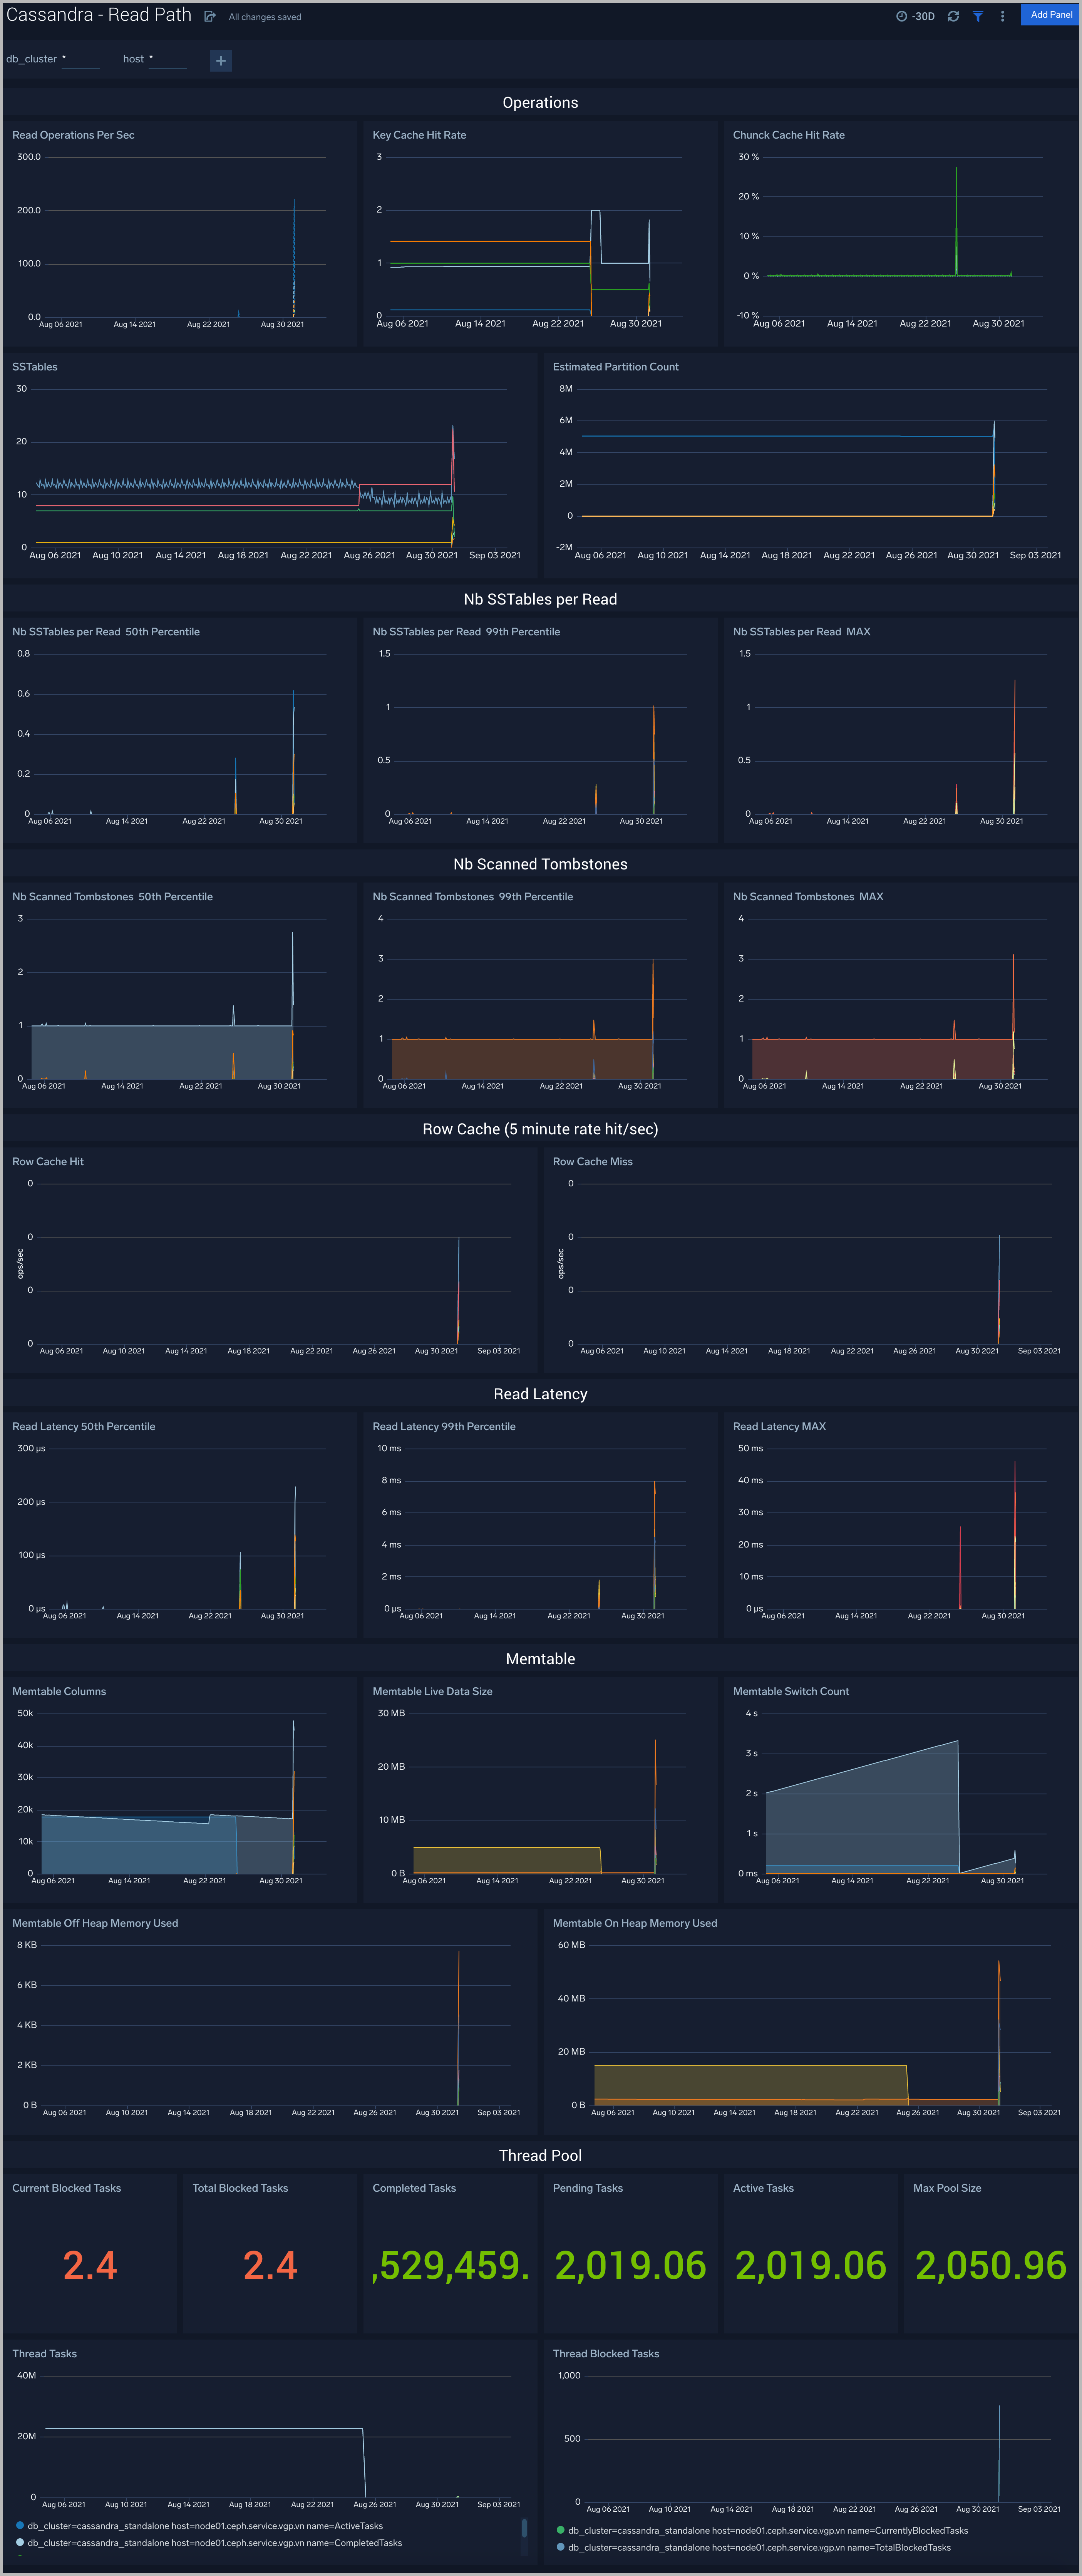
Read Path
The Cassandra (Classic) - Read Path dashboard shows read operation statistics.
Use this dashboard to:
- Gather insights into read operations, cache statistics, Tombstone, and SSTTables summary.
- Review thread pool and memtable usage for read operations.
Resource Usage
The Cassandra (Classic) - Resource Usage dashboard provides details of resource utilization across Cassandra clusters.
Use this dashboard to:
- Identify resource utilization. This can help you to determine resources over or under allocation.
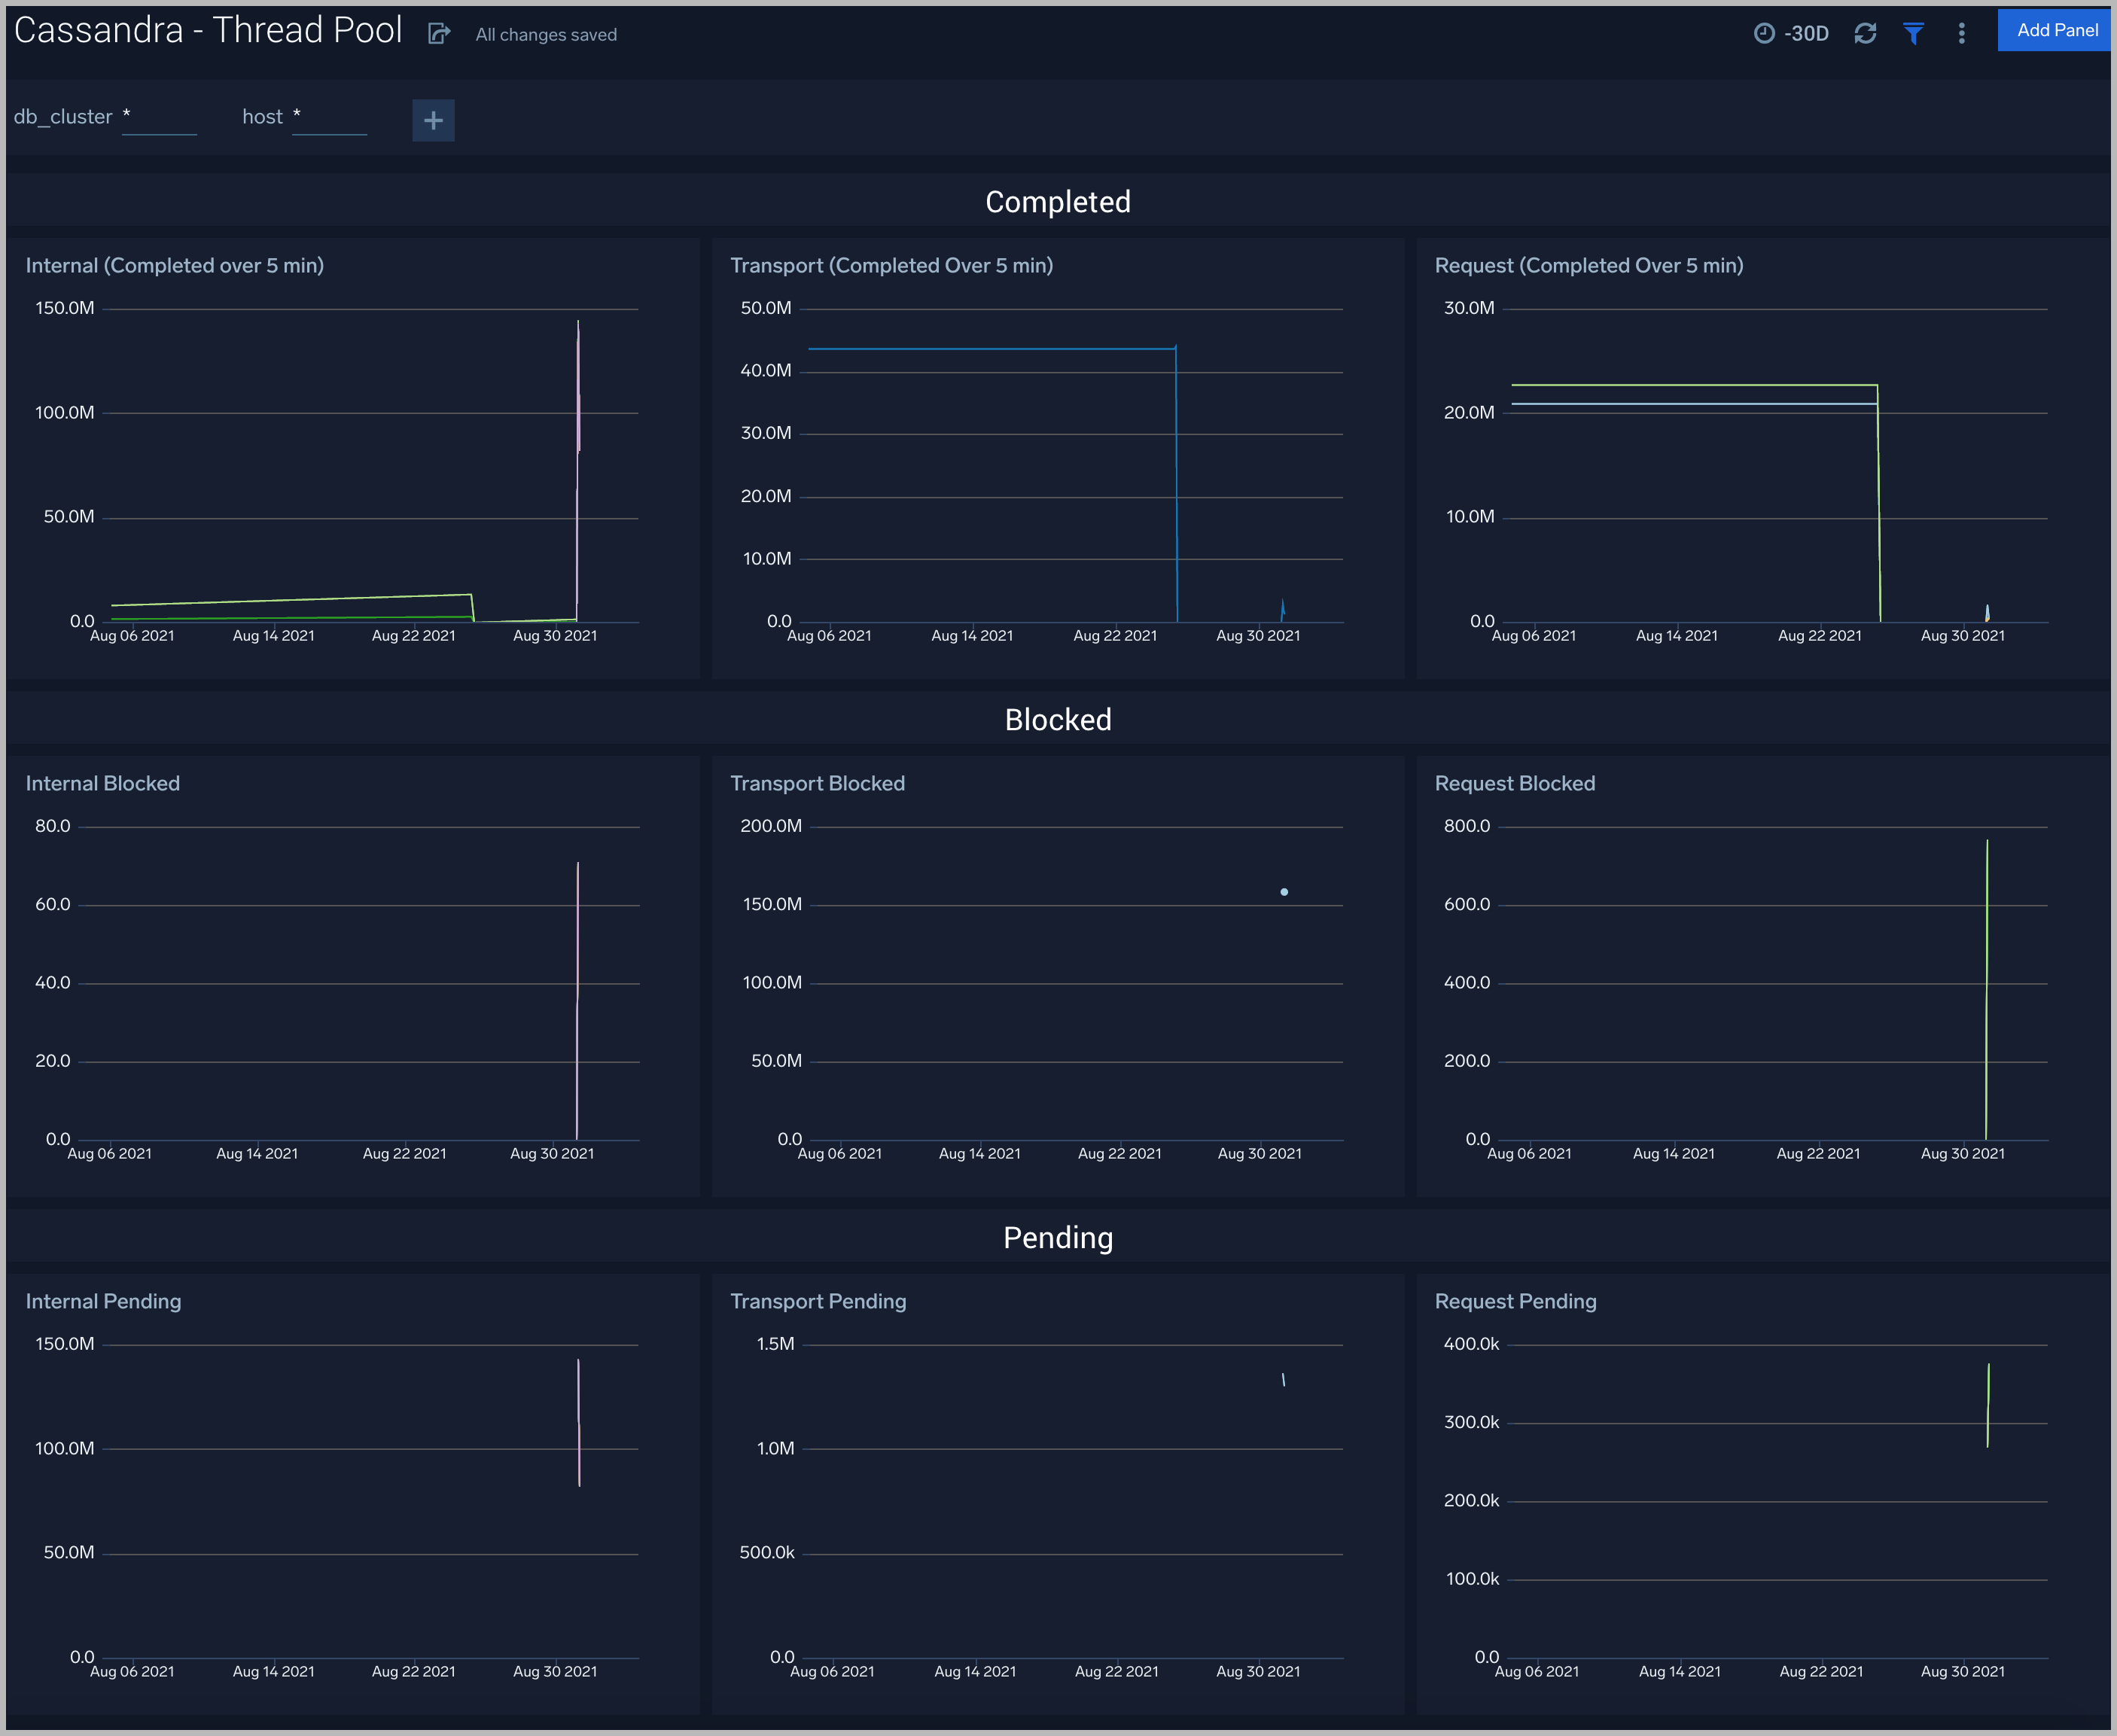
Thread Pool
The Cassandra (Classic) - Thread Pool dashboard shows thread pool statistics.
Use this dashboard to:
- Review thread pool usage and statistics for different kinds of operations.
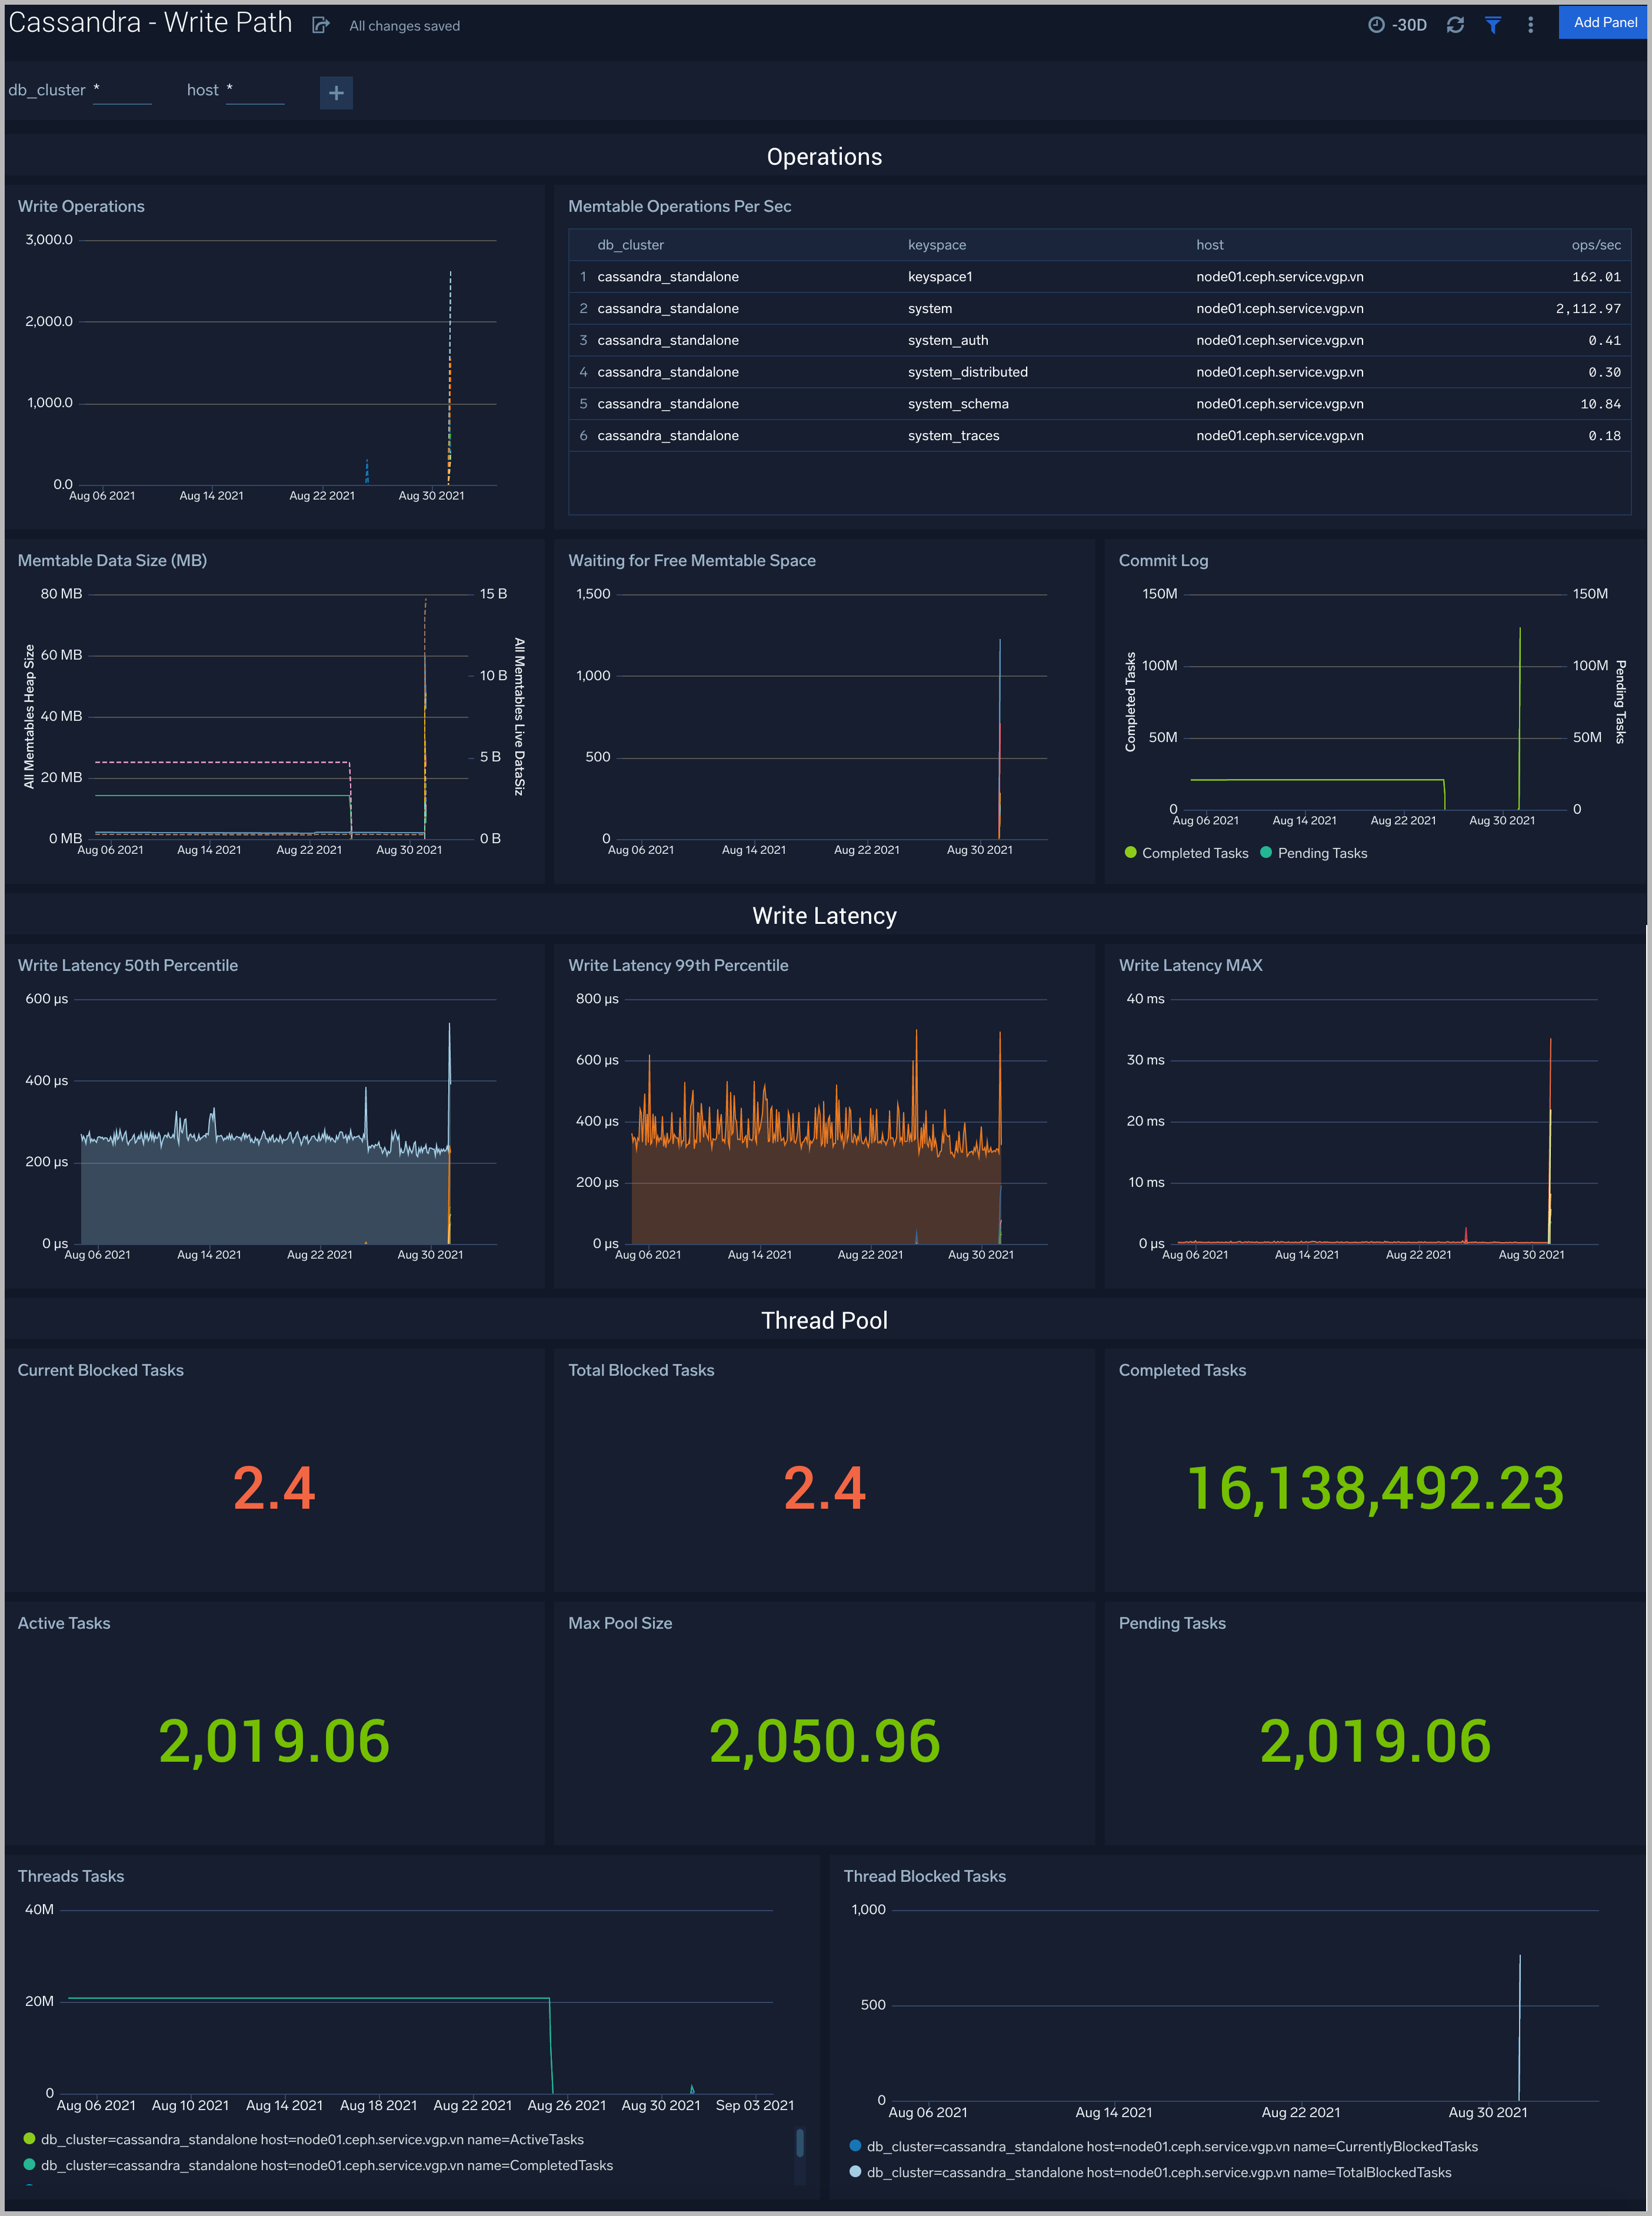
Write Path
The Cassandra (Classic) - Write Path dashboard shows write operation statistics.
Use this dashboard to:
- Gather insights into write operations, cache statistics, Tombstone, and SSTTables summary.
- Review thread pool and memtable usage for write operations.
Create monitors for Cassandra app
From your App Catalog:
- From the Sumo Logic navigation, select App Catalog.
- In the Search Apps field, search for and then select your app.
- Make sure the app is installed.
- Navigate to What's Included tab and scroll down to the Monitors section.
- Click Create next to the pre-configured monitors. In the create monitors window, adjust the trigger conditions and notifications settings based on your requirements.
- Scroll down to Monitor Details.
- Under Location click on New Folder.
note
By default, monitor will be saved in the root folder. So to make the maintenance easier, create a new folder in the location of your choice.
- Enter Folder Name. Folder Description is optional.
tip
Using app version in the folder name will be helpful to determine the versioning for future updates.
- Click Create. Once the folder is created, click on Save.
Cassandra Alerts
| Alert Name | Alert Description | Alert Condition | Recover Condition |
|---|---|---|---|
| Cassandra (Classic) - Increase in Authentication Failures | This alert fires when there is an increase of Cassandra authentication failures. | >5 | <= 5 |
| Cassandra (Classic) - Cache Hit Rate below 85 Percent | This alert fires when the cache key hit rate is below 85%. | <85 | >= 85 |
| Cassandra (Classic) - High Commitlog Pending Tasks | This alert fires when there are more than 15 Commitlog tasks that are pending. | >15 | <= 15 |
| Cassandra (Classic) - High Number of Compaction Executor Blocked Tasks | This alert fires when there are more than 15 compaction executor tasks blocked for more than 5 minutes. | >15 | <= 15 |
| Cassandra (Classic) - Compaction Task Pending | This alert fires when there are many Cassandra compaction tasks that are pending. You might need to increase I/O capacity by adding nodes to the cluster. | >100 | <= 100 |
| Cassandra (Classic) - High Number of Flush Writer Blocked Tasks | This alert fires when there is a high number of flush writer tasks which are blocked. | >15 | <= 15 |
| Cassandra (Classic) - Many Compaction Tasks Are Pending | Many Cassandra compaction tasks are pending | >100 | <= 100 |
| Cassandra (Classic) - Node Down | This alert fires when one or more Cassandra nodes are down | >0 | <= 0 |
| Cassandra (Classic) - Blocked Repair Tasks | This alert fires when the repair tasks are blocked | >2 | <= 2 |
| Cassandra (Classic) - Repair Tasks Pending | This alert fires when repair tasks are pending. | >2 | <= 2 |
| Cassandra (Classic) - High Tombstone Scanning | This alert fires when tombstone scanning is very high (>1000 99th Percentile) in queries. | >1000 | <= 1000 |