Couchbase - Classic Collector
Couchbase, a modern database for enterprise applications, is a distributed document database with a powerful search engine and in-built operational and analytical capabilities. It brings the power of NoSQL to the edge and provides fast, efficient bidirectional synchronization of data between the edge and the cloud.
The Sumo Logic app for Couchbase helps you monitor activity in Couchbase. The pre-configured dashboards provide insight into the Health of the Cluster, the Status of the Buckets, I/O of Reading/Writing, Errors, the Events of Couchbase Servers that help you understand your clusters.
This app has been tested with the following Couchbase with Telegraf versions:
- Kubernetes: Couchbase version: 7.0.2 - enterprise with Telegraf version 1.21.1
- Non-Kubernetes: Couchbase version: 7.0.2 - enterprise with Telegraf version 1.21.1
Telegraf 1.14 default of Kubernetes Collection will not work.
Collecting logs and metrics for the Couchbase app
This section provides instructions for configuring log and metric collection for the Sumo Logic app for Couchbase.
Configure Collection for Couchbase
Sumo Logic supports the collection of logs and metrics data from Couchbase in both Kubernetes and non-Kubernetes environments. Click on the appropriate tab below based on the environment where your Couchbase clusters are hosted.
- Kubernetes environments
- Non-Kubernetes environments
The following diagram illustrates how data is collected from Couchbase in Kubernetes environments. There are four services that make up the metric collection pipeline: Telegraf, Telegraf Operator, Prometheus, and Sumo Logic Distribution for OpenTelemetry Collector.
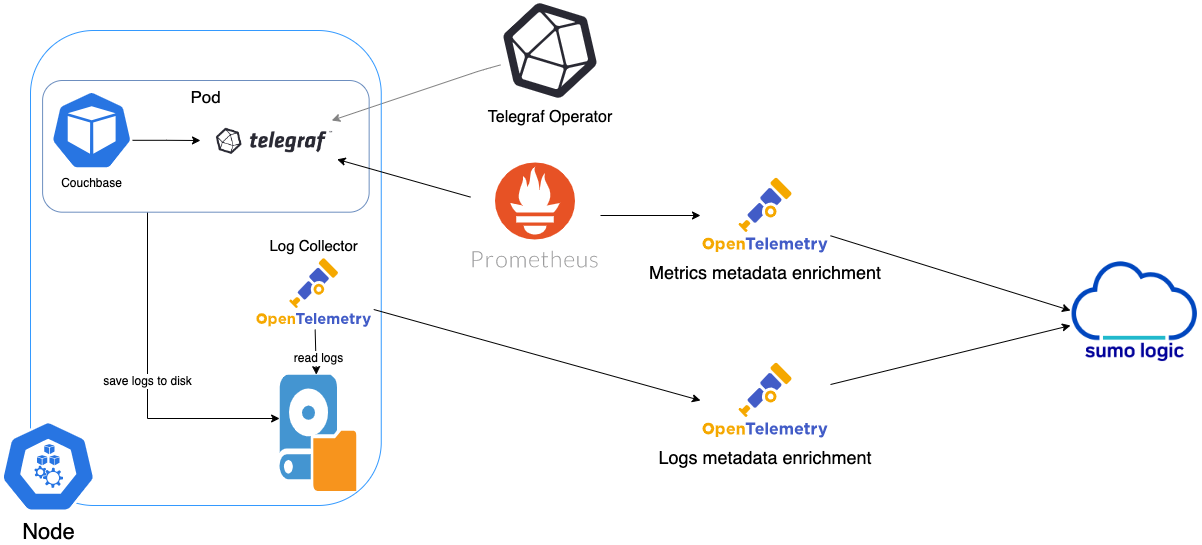
The first service in the metrics pipeline is Telegraf. Telegraf collects metrics from Couchbase. Note that we’re running Telegraf in each pod we want to collect metrics from as a sidecar deployment that is Telegraf runs in the same pod as the containers it monitors. Telegraf uses the Couchbase input plugin to obtain metrics. For simplicity, the diagram doesn’t show the input plugins. The injection of the Telegraf sidecar container is done by the Telegraf Operator. Prometheus pulls metrics from Telegraf and sends them to Sumo Logic Distribution for OpenTelemetry Collector which enriches metadata and sends metrics to Sumo Logic.
In the logs pipeline, Sumo Logic Distribution for OpenTelemetry Collector collects logs written to standard out and forwards them to another instance of Sumo Logic Distribution for OpenTelemetry Collector, which enriches metadata and sends logs to Sumo Logic.
It’s assumed that you are using the latest helm chart version if not, upgrade using the instructions here. When you upgrade the helm chart, you must upgrade telegraf version to 1.21.1 by adding the statement below in the upgrade command helm chart:
--set telegraf-operator.image.sidecarImage=telegraf:1.21.1
Configure Metrics Collection
To collect Couchbase metrics from a Kubernetes environment, we use the Telegraf Operator, which is packaged with our Kubernetes collection. You can learn more about this here.
- Set up Kubernetes Collection with the Telegraf Operator.
- On your Couchbase Pods, add the following annotations:
annotations:
  telegraf.influxdata.com/class: sumologic-prometheus
  prometheus.io/scrape: "true"
  prometheus.io/port: "9273"
  telegraf.influxdata.com/inputs: |+
[[inputs.couchbase]]
  servers = ["http://<USER_TO_BE_CHANGED>:<PASS_TO_BE_CHANGED>@A@localhost:8091"]
  bucket_stats_included = ["*"]
  [inputs.couchbase.tags]
    db_cluster ="ENV_TO_BE_CHANGED"--If you haven’t defined a cluster in Couchbase, enter `default`
    component ="database"
    environment ="ENV_TO_BE_CHANGED"
    db_system ="couchbase"
    db_cluster_address = "ENV_TO_BE_CHANGED"
    db_cluster_port = "ENV_TO_BE_CHANGED"
- Enter in values for the following parameters (marked
ENV_TO_BE_CHANGEDabove):
-
telegraf.influxdata.com/inputs. This contains the required configuration for the Telegraf Couchbase Input plugin. Refer to this doc for more information on configuring the Couchbase input plugin for Telegraf. Note: As telegraf will be run as a sidecar, the host should always be localhost. -
In the Input plugins section (
[[inputs.couchbase]]):servers: This is the endpoint of the management portal of couchbase server. For detail, see this doc .
-
In the tags section (
[inputs.couchbase.tags]):environment. This is the deployment environment where the Couchbase cluster identified by the value of servers resides. For example: dev, prod or qa. While this value is optional we highly recommend setting it.db_cluster. Enter a name to identify this Couchbase cluster. This cluster name will be shown in the Sumo Logic dashboards.db_cluster_address- Enter the cluster hostname or ip address that is used by the application to connect to the database. It could also be the load balancer or proxy endpoint.db_cluster_port- Enter the database port. If not provided, a default port will be used.
notedb_cluster_addressanddb_cluster_portshould reflect exact configuration of DB client configuration in your application, especially if you instrument it with OT tracing. The values of these fields should match exactly the connection string used by the database client (reported as values fornet.peer.nameandnet.peer.portmetadata fields). For example, if your application uses “couchbase-prod.sumologic.com:3306” as the connection string, the field values should be set as follows:db_cluster_address=couchbase-prod.sumologic.com db_cluster_port=3306If your application connects directly to a given Couchbase node, rather than the whole cluster, use the application connection string to override the value of the “host” field in the Telegraf configuration:
host=couchbase-prod.sumologic.comPivoting to Tracing data from Entity Inspector is possible only for “Couchbase address” Entities.
-
Do not modify the following values as it will cause the Sumo Logic apps to not function correctly.
telegraf.influxdata.com/class: sumologic-prometheus. This instructs the Telegraf operator what output to use. This should not be changed.prometheus.io/scrape: "true". This ensures our Prometheus will scrape the metrics.prometheus.io/port: "9273". This tells prometheus what ports to scrape on. This should not be changed.telegraf.influxdata.com/inputs.- In the tags section ([inputs.couchbase.tags]):component: “database”- This value is used by Sumo Logic apps to identify application components.db_system: “couchbase”- This value identifies the database system.
-
See this doc for more parameters that can be configured in the Telegraf agent globally.
- Sumo Logic Kubernetes collection will automatically start collecting metrics from the pods having the labels and annotations defined in the previous step.
- Verify metrics in Sumo Logic.
Configure Logs Collection
This section explains the steps to collect Couchbase logs from a Kubernetes environment.
-
Add labels on your Couchbase pods to capture logs from standard output on Kubernetes (recommended).
- Apply following labels to the Couchbase pod:
environment = "prod_CHANGEME"
component = "database"
db_system = "couchbase"
db_cluster = "<cluster_CHANGEME>"
db_cluster_address: <your cluster’s hostname or ip address or service endpoint>
db_cluster_port: <database port>- Enter in values for the following parameters (marked
CHANGE_MEabove):
environment. This is the deployment environment where the Couchbase cluster identified by the value of servers resides. For example:- dev, prod, or QA. While this value is optional we highly recommend setting it.db_cluster. Enter a name to identify this Couchbase cluster. This cluster name will be shown in the Sumo Logic dashboards. If you haven’t defined a cluster in Couchbase, then enterdefaultfordb_cluster.db_cluster_address- Enter the cluster hostname or ip address that is used by the application to connect to the database. It could also be the load balancer or proxy endpoint.db_cluster_port- Enter the database port. If not provided, a default port will be used.
notedb_cluster_addressanddb_cluster_portshould reflect exact configuration of DB client configuration in your application, especially if you instrument it with OT tracing. The values of these fields should match exactly the connection string used by the database client (reported as values fornet.peer.nameandnet.peer.portmetadata fields). For example, if your application uses“couchbase-prod.sumologic.com:3306”as the connection string, the field values should be set as follows:db_cluster_address=couchbase-prod.sumologic.com db_cluster_port=3306.If your application connects directly to a given Couchbase node, rather than the whole cluster, use the application connection string to override the value of the “host” field in the Telegraf configuration:
host=couchbase-prod.sumologic.com.Pivoting to Tracing data from Entity Inspector is possible only for “Couchbase address” Entities.
- Do not modify the following values as it will cause the Sumo Logic apps to not function correctly.
component: “database”- This value is used by Sumo Logic apps to identify application components.db_system: “couchbase”- This value identifies the database system. See this doc for more parameters that can be configured in the Telegraf agent globally.
- The Sumologic-Kubernetes-Collection will automatically capture the logs from stdout and will send the logs to Sumologic. For more information on deploying Sumologic-Kubernetes-Collection, visit here.
- Verify logs in Sumo Logic.
-
Collecting Couchbase Logs from a Log File on Kubernetes (optional).
- Determine the location of the Couchbase log file on Kubernetes. This can be determined from the config file /opt/couchbase/etc/couchbase/static_config squid.conf for your Couchbase cluster along with the mounts on the Couchbase pods.
- Install the Sumo Logic tailing sidecar operator.
- Add the following annotation in addition to the existing annotations.
annotations:
  tailing-sidecar: sidecarconfig;<mount>:<path_of_Couchbase_log_file>/<Couchbase_log_file_name>
Example:
annotations:
tailing-sidecar: sidecarconfig;data:/opt/couchbase/var/lib/couchbase/logs/audit.log- Make sure that the Couchbase pods are running and annotations are applied by using the command:
kubectl describe pod <Couchbase_pod_name>- Sumo Logic Kubernetes collection will automatically start collecting logs from the pods having the annotations defined above.
- Verify logs in Sumo Logic.
FER to normalize the fields in Kubernetes environments. Labels created in Kubernetes environments automatically are prefixed with pod_labels. To normalize these for our app to work, a Field Extraction Rule named AppObservabilityCouchbaseDatabaseFER is automatically created for Database Application Components.
For non-Kubernetes environments, we use the Telegraf operator for Couchbase metric collection and the Installed Collector for collecting Couchbase logs. The diagram below illustrates the components of the Couchbase collection in a non-Kubernetes environment. Telegraf uses the Couchbase input plugin to obtain Couchbase metrics and the Sumo Logic output plugin to send the metrics to Sumo Logic. Logs from Couchbase are collected by a Local File Source.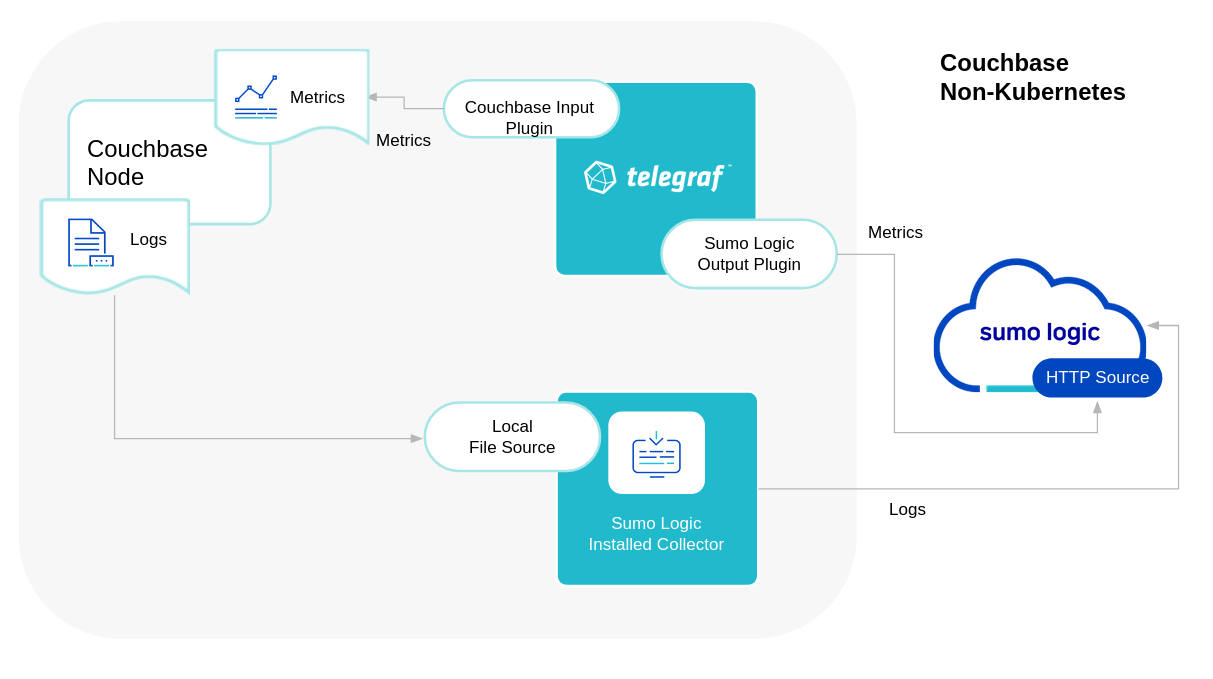
The process to set up collection for Couchbase data is done through the following steps.
Configure Logs Collection
The Sumo Logic Couchbase app supports the audit log, query log, error log, access log. For details, refer to Couchbase logging documentation.
- Configure logging in Couchbase. By default, the Couchbase will write the log to the log directory that was configured during installation. For example, on Linux, the log directory would be
/opt/couchbase/var/lib/couchbase/logs. By default, the Audit log is disabled, you must enable the audit log following these instructions. Query log, error log, the access log will be enabled by default. - Configure a Collector. Use one of the following Sumo Logic Collector options:
- To collect logs directly from the Couchbase machine, configure an Installed Collector.
- If you're using a service like Fluentd, or you would like to upload your logs manually, configure a Hosted Collector.
- Configure a local file source. Choose one of the options:
3A. For an Installed Collector (click to expand)
To collect logs directly from your Couchbase machine, use an Installed Collector and Multi Local File Source. Repeat the below steps for each log source: audit log, query log, error log, access log.
- Add a Local File Source.
- Configure the Local File Source fields as follows:
- Name. (Required)
- Description. (Optional)
- File Path (Required). Enter the path to your log files: The files are typically located in folder /opt/couchbase/var/lib/couchbase/logs.
- For Audit Log: /opt/couchbase/var/lib/couchbase/logs/audit.log
- For Error Log: /opt/couchbase/var/lib/couchbase/logs/error.log
- For Access Log: /opt/couchbase/var/lib/couchbase/logs/http_access.log
- For Query Log: /opt/couchbase/var/lib/couchbase/logs/query.log
- Source Host. Sumo Logic uses the hostname assigned by the OS unless you enter a different hostname.
- Source Category. Enter any string to tag the output collected from this Source, such as Couchbase/AccessLog for access log. (The Source Category metadata field is a fundamental building block to organize and label Sources. For details, see Best Practices.)
- Fields. Set the following fields
Enter Default if you do not have one.
component = database
db_system = couchbase
db_cluster = <Your_Couchbase_Cluster_Name><environment = <Your_Environment_Name>(for example, Dev, QA, or Prod). db_cluster_address- Enter the cluster hostname or ip address that is used by the application to connect to the database. It could also be the load balancer or proxy endpoint.db_cluster_port- Enter the database port. If not provided, a default port will be used.
db_cluster_address and db_cluster_port should reflect the exact configuration of DB client configuration in your application, especially if you instrument it with OT tracing. The values of these fields should match exactly the connection string used by the database client (reported as values for the net.peer.name and net.peer.port metadata fields).
For example, if your application uses “couchbase-prod.sumologic.com:3306” as the connection string, the field values should be set as follows: db_cluster_address=couchbase-prod.sumologic.com db_cluster_port=3306
If your application connects directly to a given Couchbase node, rather than the whole cluster, use the application connection string to override the value of the “host” field in the Telegraf configuration: host=couchbase-prod.sumologic.com
Pivoting to Tracing data from Entity Inspector is possible only for “Couchbase address” Entities.
- Configure the **Advanced **section:
- Enable Timestamp Parsing. Select Extract timestamp information from log fileentries.
- Time Zone. Automatically detect.
- Timestamp Format. The timestamp format is automatically detected.
- Encoding. Select UTF-8 (Default).
- Enable Multiline Processing.
- Error logs. Select Detect messages spanning multiple lines and Infer Boundaries - Detect message boundaries automatically.
- Access logs. These are single-line logs, uncheck Detect messages spanning multiple lines.
- Click Save.
3B. For a Hosted Collector (click to expand)
If you're using a service like Fluentd, or you would like to upload your logs manually, use a Hosted Collector and an HTTP Source.
- Add an HTTP Source.
- Configure the HTTP Source fields as follows:
- Name. (Required)
- Description. (Optional)
- Source Host. Sumo Logic uses the hostname assigned by the OS unless you enter a different hostname.
- Source Category. Enter any string to tag the output collected from this Source, such as Couchbase/AccessLog for access log. (The Source Category metadata field is a fundamental building block to organize and label Sources. For details, see Best Practices.)
- Fields. Set the following fields:
component = databasedb_system = couchbasedb_cluster = <Your_Couchbase_Cluster_Name>environment = <Environment_Name>, such as Dev, QA or Prod.db_cluster_address- Enter the cluster hostname or ip address that is used by the application to connect to the database. It could also be the load balancer or proxy endpoint.db_cluster_port- Enter the database port. If not provided, a default port will be used.
- Configure the **Advanced **section:
- Enable Timestamp Parsing. Select Extract timestamp information from log file entries.
- Time Zone. For Access logs, use the time zone from the log file. For Error logs, make sure to select the correct time zone.
- Timestamp Format. The timestamp format is automatically detected.
- Enable Multiline Processing.
- Error logs: Select Detect messages spanning multiple lines and Infer Boundaries - Detect message boundaries automatically.
- Access logs: These are single-line logs, uncheck Detect messages spanning multiple lines.
- Click Save.
- When the URL associated with the HTTP Source is displayed, copy the URL so you can add it to the service you are using, such as Fluentd.
Configure Metrics Collection
- To set up a Sumo Logic HTTP Source, you'll need to configure a Hosted Collector for Metrics. To create a new Sumo Logic hosted collector, perform the steps in Configure a Hosted Collector.
- Configure an HTTP Logs and Metrics source:
- On the created Hosted Collector on the Collection Management screen, select Add Source.
- Select HTTP Logs & Metrics.
- Name. (Required). Enter a name for the source.
- Description. (Optional).
- Source Category (Recommended). Be sure to follow the Best Practices for Source Categories. A recommended Source Category may be Prod/DBServer/Couchbase/Metrics.
- Select Save.
- Take note of the URL provided once you click Save. You can retrieve it again by selecting the Show URL next to the source on the Collection Management screen.
- Install Telegraf, if you haven’t already, using the following steps.
- Configure and start Telegraf. As part of collecting metrics data from Telegraf, we will use the Couchbase input plugin to get data from Telegraf and the Sumo Logic output plugin to send data to Sumo Logic. Create or modify
telegraf.confand copy and paste the text below:
[[inputs.couchbase]]
  servers = ["http://<USER_TO_BE_CHANGED>:<PASS_TO_BE_CHANGED>@localhost:8091"]
  bucket_stats_included = ["*"]
  [inputs.couchbase.tags]
    db_cluster ="<ClusterName_TO_BE_CHANGED>"
    component ="database"
    environment ="<env_TO_BE_CHANGED>"
    db_system ="couchbase"
    db_cluster_address = "ENV_TO_BE_CHANGED"
    db_cluster_port = "ENV_TO_BE_CHANGED"
[[outputs.sumologic]]
  url = "<URL_from_HTTP_Logs_and_Metrics_Source>"
  data_format = "prometheus"
Enter values for fields annotated with <_TO_BE_CHANGED> to the appropriate values. Do not include the brackets (< >) in your final configuration.
- Input plugins section, which is
[[inputs.couchbase]]:servers: This is the endpoint of the management portal of couchbase server. For details, see this doc .
- In the tags section (
[inputs.couchbasesnmp.tags]):environment. This is the deployment environment where the Couchbase server identified by the value ofserversresides. For example; dev, prod, or QA. While this value is optional we highly recommend setting it.
db_cluster. Enter a name to identify this Couchbase cluster. This cluster name will be shown in our dashboards. If you haven’t defined a cluster in Couchbase, then enter ‘default’ for this.db_cluster_address- Enter the cluster hostname or ip address that is used by the application to connect to the database. It could also be the load balancer or proxy endpoint.db_cluster_port- Enter the database port. If not provided, a default port will be used.
db_cluster_address and db_cluster_port should reflect the exact configuration of DB client configuration in your application, especially if you instrument it with OT tracing. The values of these fields should match exactly the connection string used by the database client (reported as values for net.peer.name and net.peer.port metadata fields).
For example, if your application uses “couchbase-prod.sumologic.com:3306” as the connection string, the field values should be set as follows: db_cluster_address=couchbase-prod.sumologic.com db_cluster_port=3306.
If your application connects directly to a given Couchbase node, rather than the whole cluster, use the application connection string to override the value of the “host” field in the Telegraf configuration: host=couchbase-prod.sumologic.com
Pivoting to Tracing data from Entity Inspector is possible only for “Couchbase address” Entities.
- In the output plugins section (
[[outputs.sumologic]]):url- This is the HTTP source URL created previously. See this doc for more information on additional parameters for configuring the Sumo Logic Telegraf output plugin.
Do not modify the following values set by this Telegraf configuration as it will cause the Sumo Logic app to not function correctly.
data_format: “prometheus”. In the output[[outputs.sumologic]]plugins section. Metrics are sent in the Prometheus format to Sumo Logic.component - “database”- In the input[[inputs.couchbase]]plugins section. This value is used by Sumo Logic apps to identify application components.db_system- “couchbase”- In the input plugins sections. This value identifies the database system.
See this doc for all other parameters that can be configured in the Telegraf agent globally.
After you have finalized your telegraf.conf file, you can start or reload the telegraf service using instructions from this doc.
At this point, Telegraf should start collecting the Couchbase metrics and forward them to the Sumo Logic HTTP Source.
Installing the Couchbase app
This section demonstrates how to install the Couchbase app.
To install the app, do the following:
Next-Gen App: To install or update the app, you must be an account administrator or a user with Manage Apps, Manage Monitors, Manage Fields, Manage Metric Rules, and Manage Collectors capabilities depending upon the different content types part of the app.
- Select App Catalog.
- In the 🔎 Search Apps field, run a search for your desired app, then select it.
- Click Install App.
note
Sometimes this button says Add Integration.
- Click Next in the Setup Data section.
- In the Configure section of your respective app, complete the following fields.
- Is K8S deployment involved. Specify if resources being monitored are partially or fully deployed on Kubernetes (K8s)
- Click Next. You will be redirected to the Preview & Done section.
Post-installation
Once your app is installed, it will appear in your Installed Apps folder, and dashboard panels will start to fill automatically.
Each panel slowly fills with data matching the time range query received since the panel was created. Results will not immediately be available but will be updated with full graphs and charts over time.
As part of the app installation process, the following fields will be created by default:
componentenvironmentdb_systemdb_clusterpoddb_cluster_addressdb_cluster_port
Additionally, if you're using Couchbase in the Kubernetes environment, the following additional fields will be created by default during the app installation process:
pod_labels_componentpod_labels_environmentpod_labels_db_systempod_labels_db_clusterpod_labels_db_cluster_addresspod_labels_db_cluster_port
For information on setting up fields, see Fields.
Viewing Couchbase Dashboards
All dashboards have a set of filters that you can apply to the entire dashboard. Use these filters to drill down and examine the data to a granular level.
- You can change the time range for a dashboard or panel by selecting a predefined interval from a drop-down list, choosing a recently used time range, or specifying custom dates and times. Learn more.
- You can use template variables to drill down and examine the data on a granular level. For more information, see Filtering Dashboards with Template Variables.
- Most Next-Gen apps allow you to provide the scope at the installation time and are comprised of a key (
_sourceCategoryby default) and a default value for this key. Based on your input, the app dashboards will be parameterized with a dashboard variable, allowing you to change the dataset queried by all panels. This eliminates the need to create multiple copies of the same dashboard with different queries.
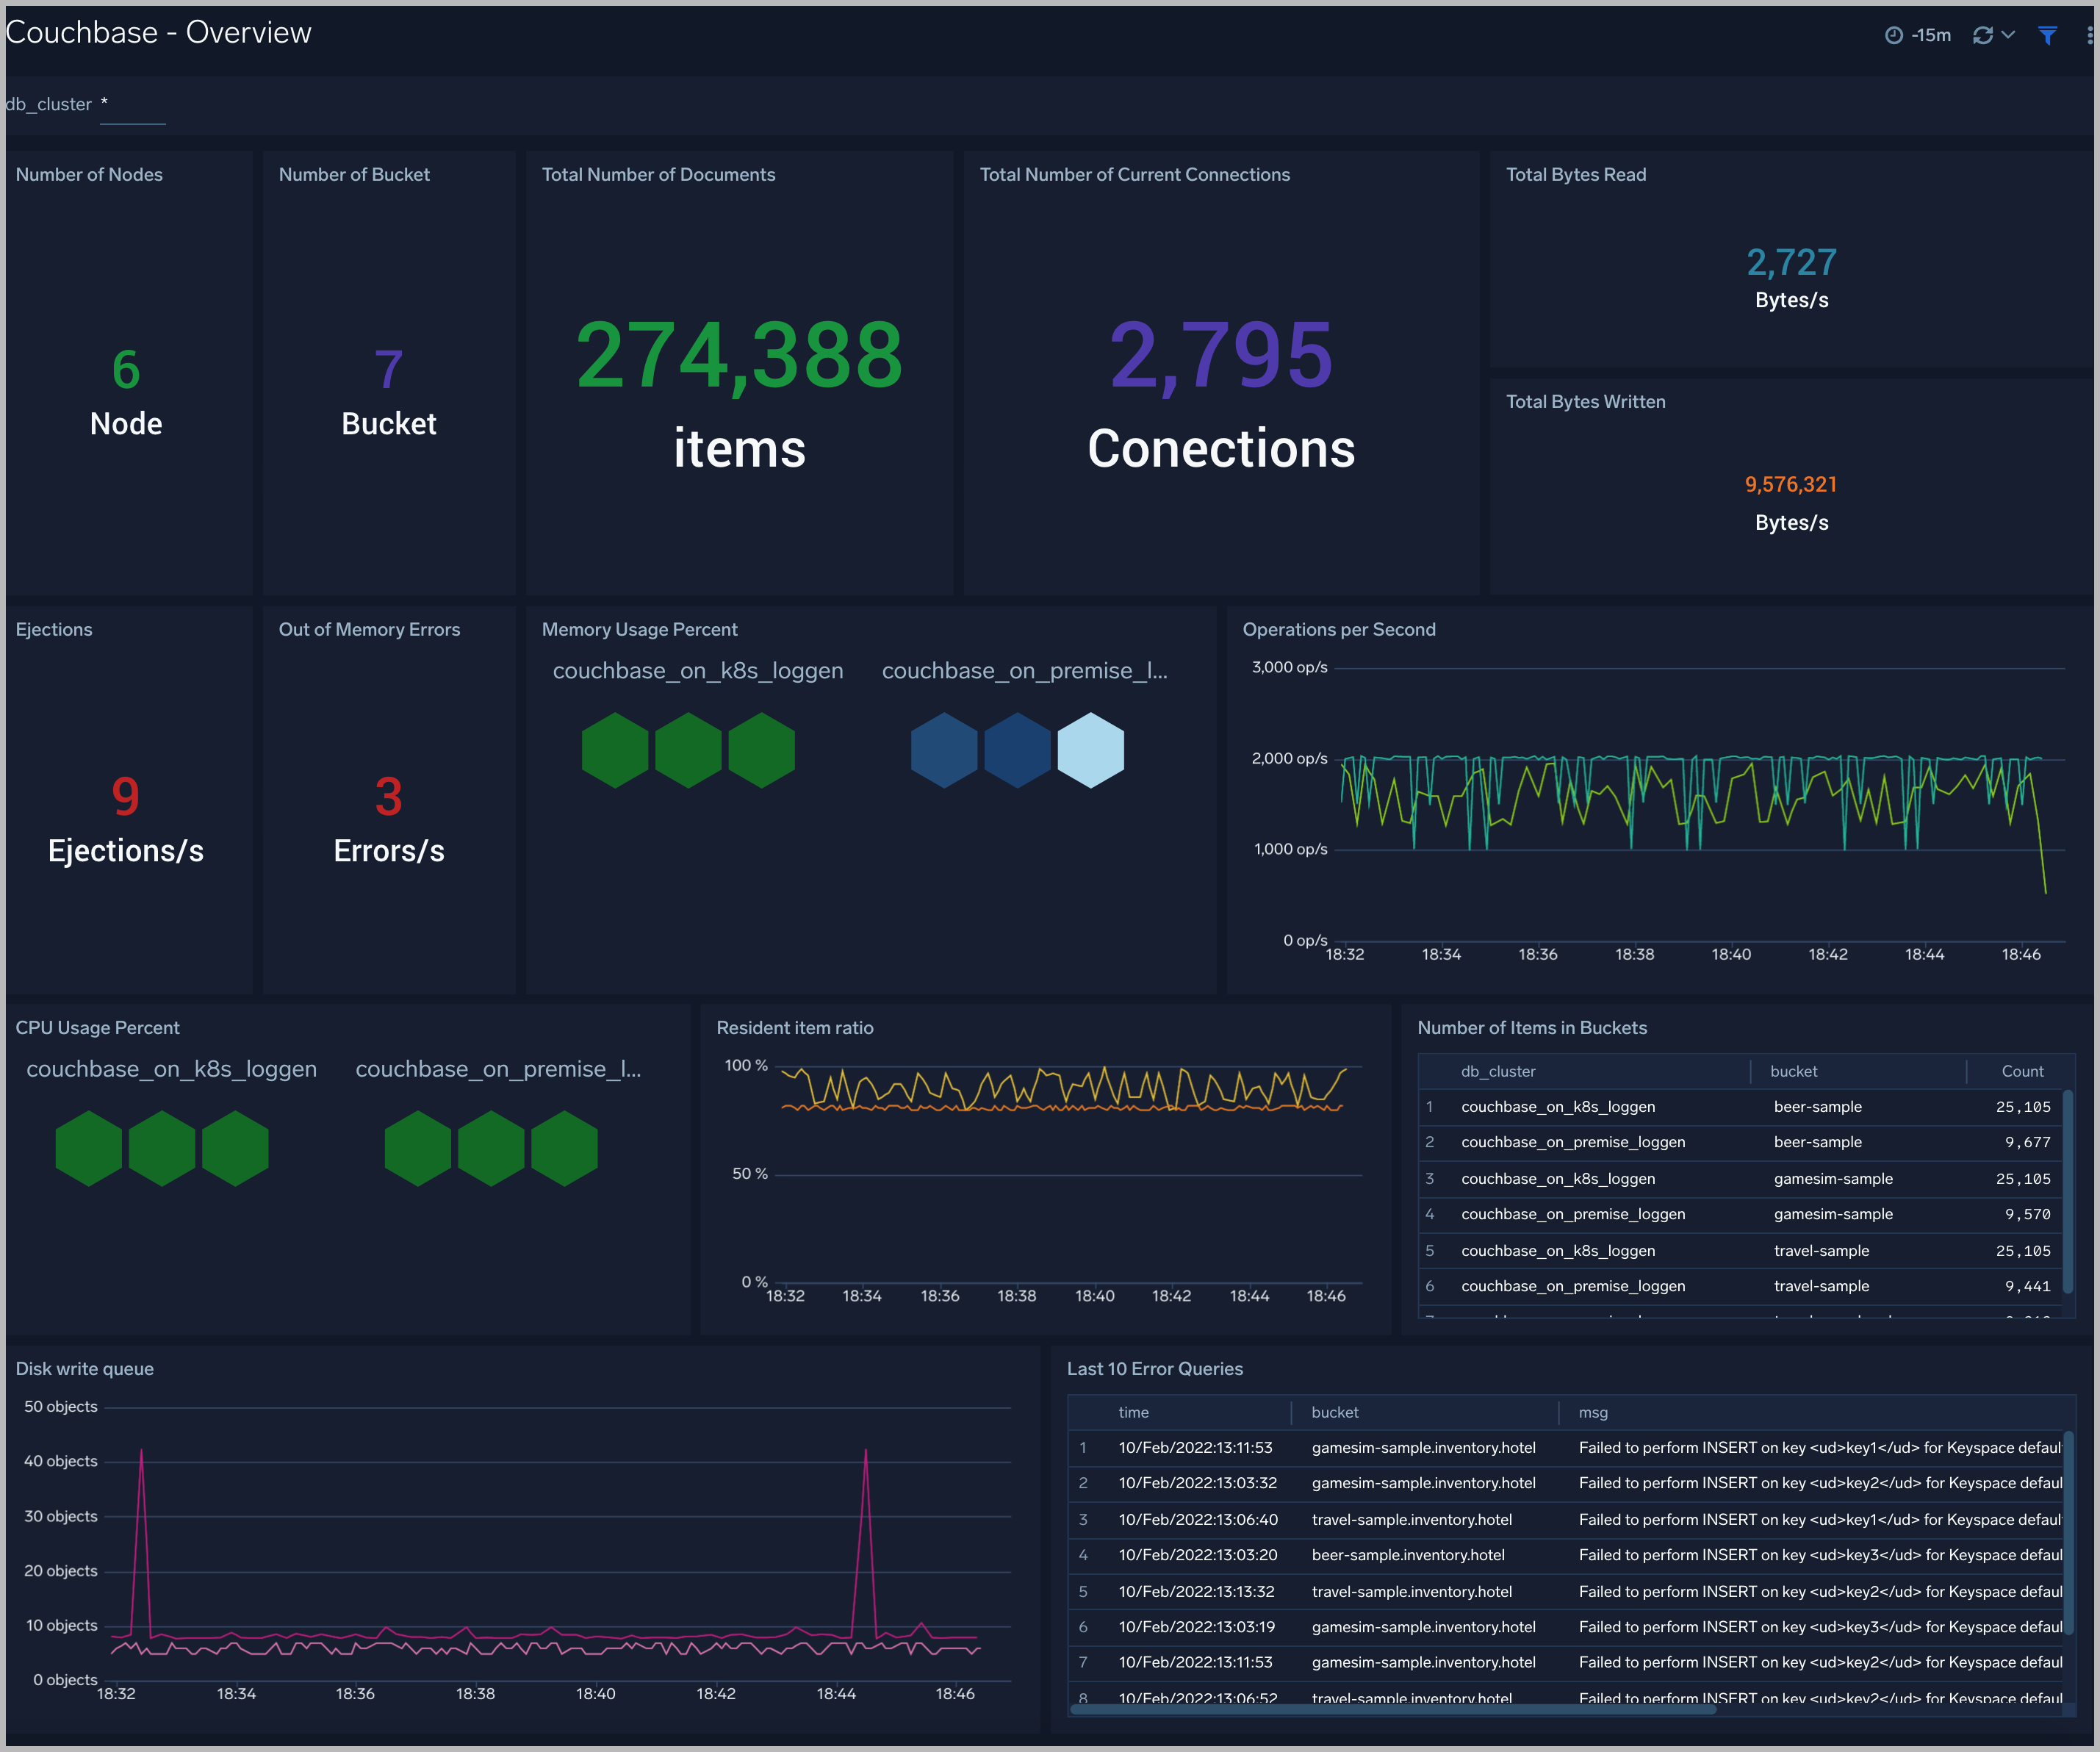
Overview
The Couchbase - Overview dashboard provides an at-a-glance view of the health of the Couchbase clusters and servers, performance, and problems causing errors.
Use this dashboard to:
- Gain insights into information about the number of nodes, number of buckets, connections, number items, total bytes transferred.
- Determine errors in clusters: enjections, out of memory errors and error queries.
- Gain insights into information about the workload of the cluster: percent of used memory, percent of used CPU.
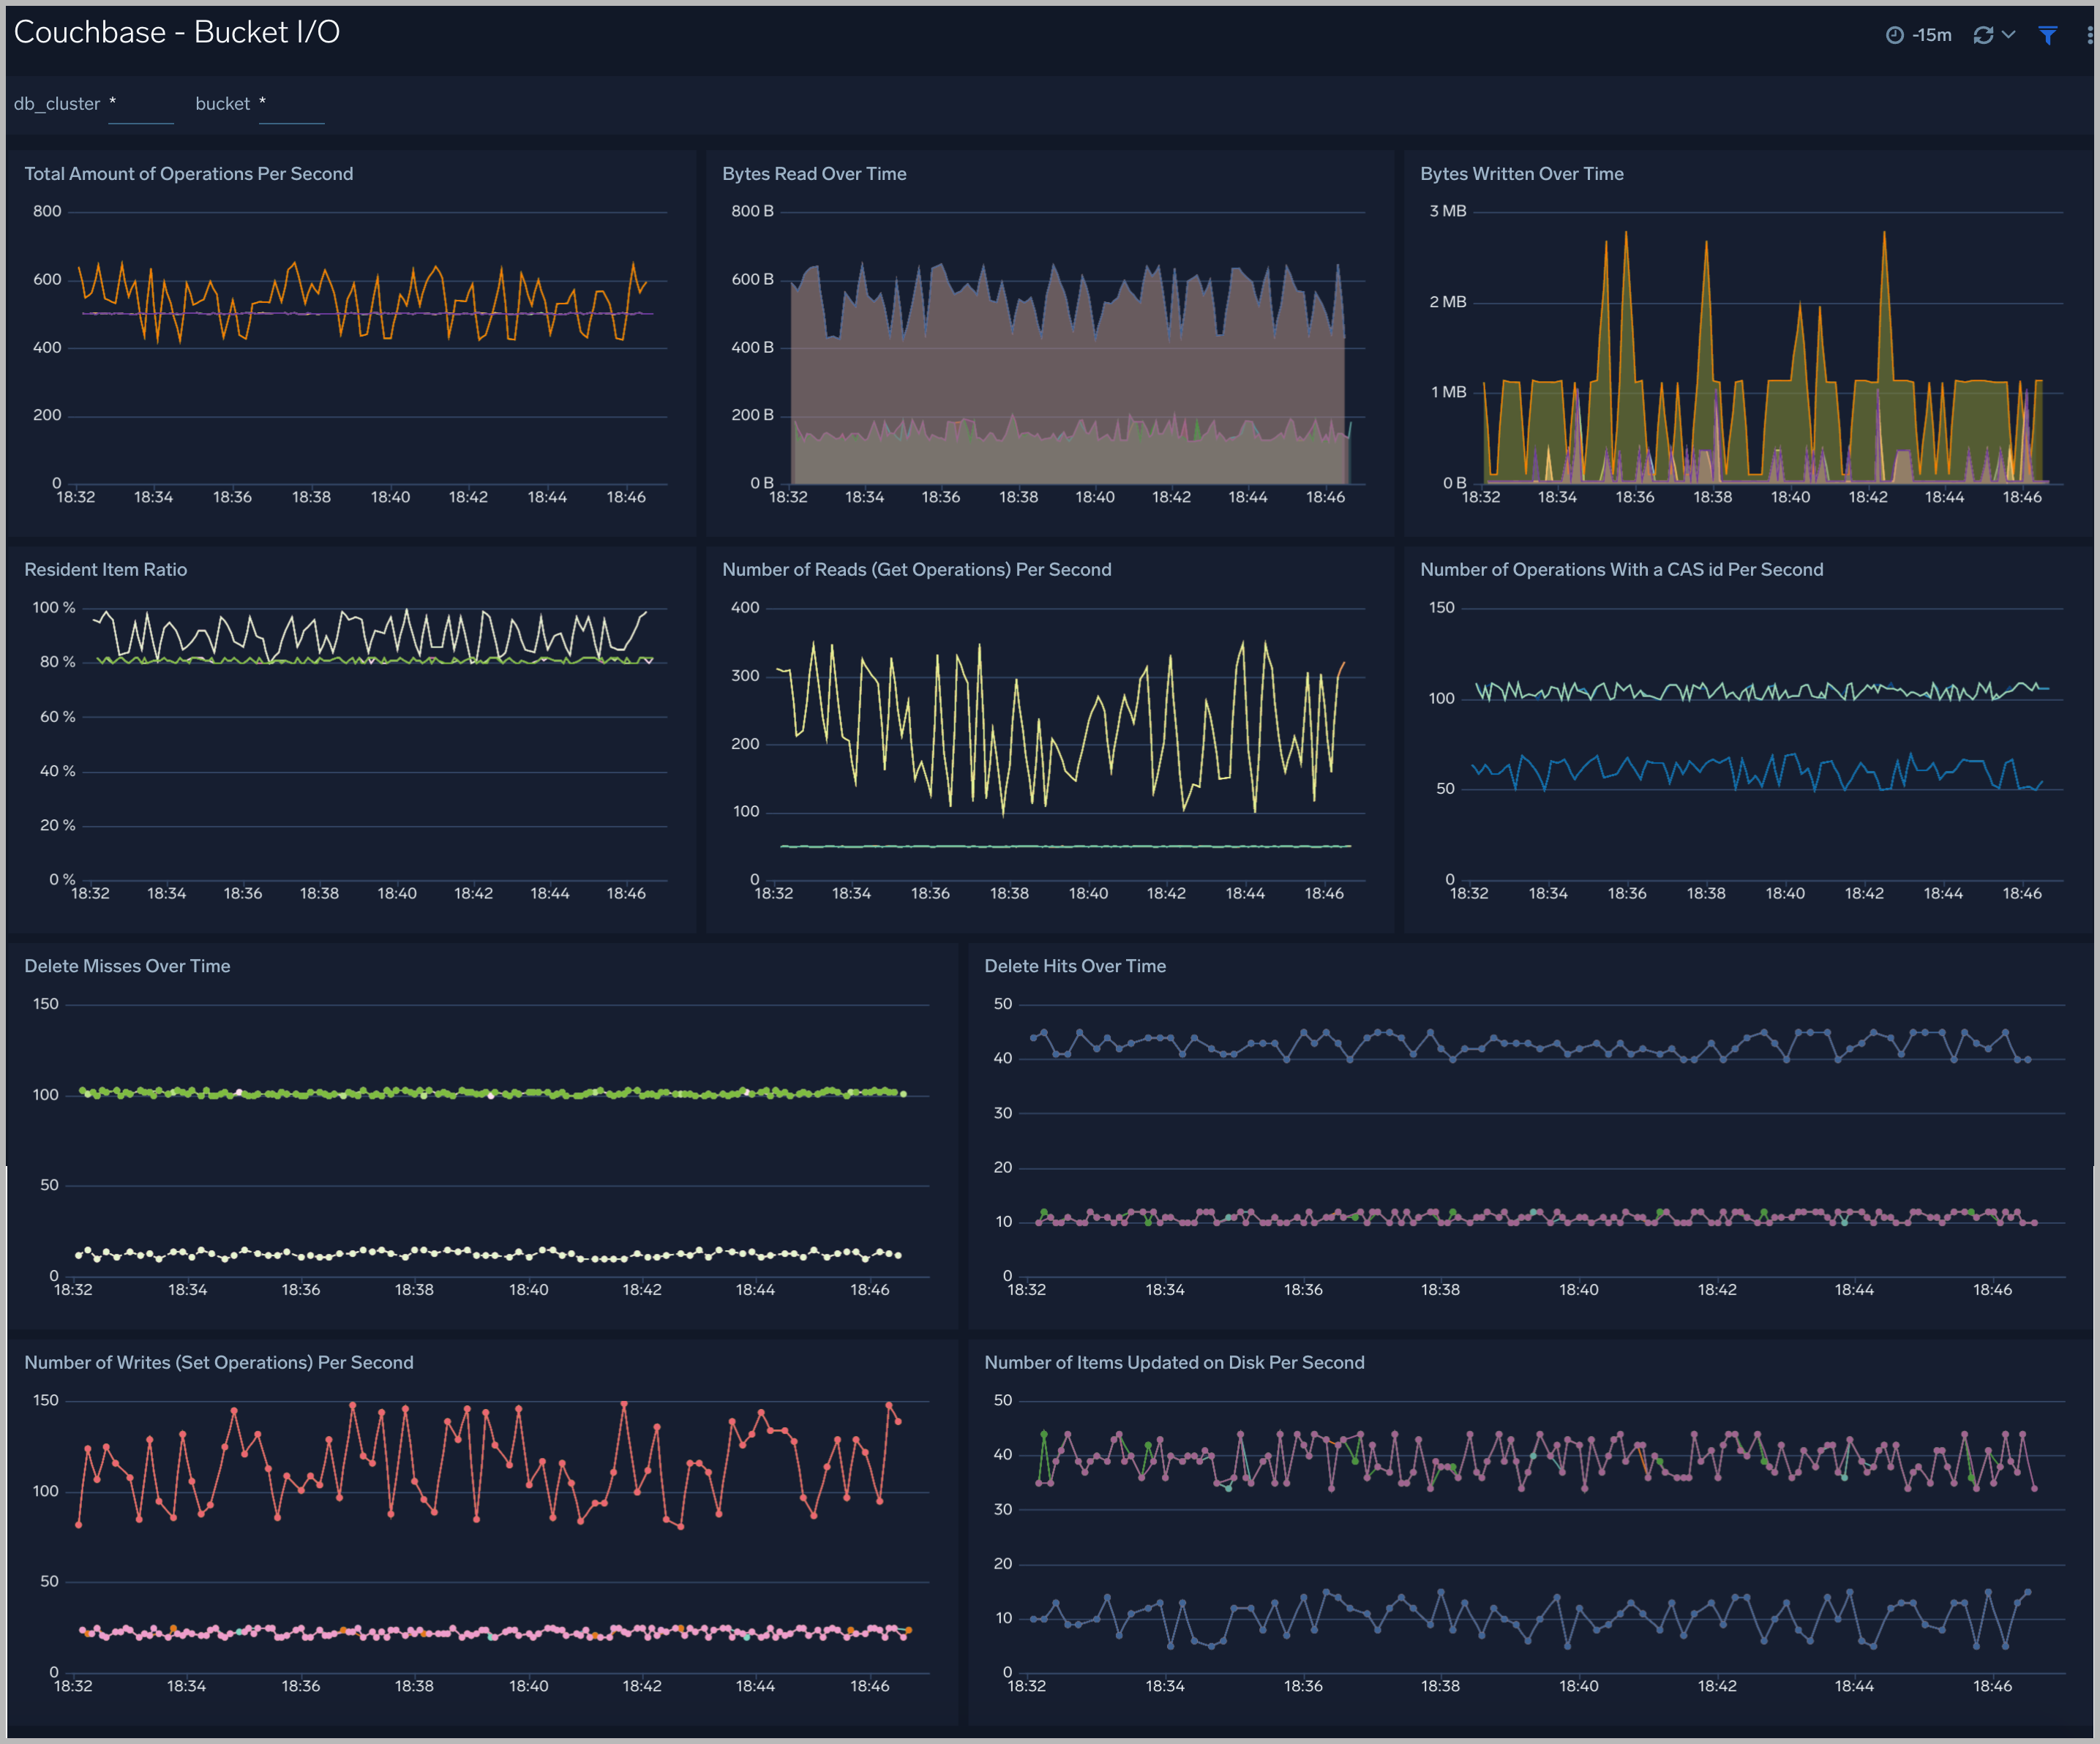
Bucket I/O
The Couchbase - Bucket I/O dashboard provides an insight into the operators of buckets in clusters: the number of getting operations, the number of set operations, the number of delete operations, the bytes read/write.
Use this dashboard to:
- Get insights into information about the total amount of operations in buckets per second; the number of delete misses operations, get operations, set operations, update operations in buckets per second.
- Get insights into information about the number of bytes read, bytes written over time.
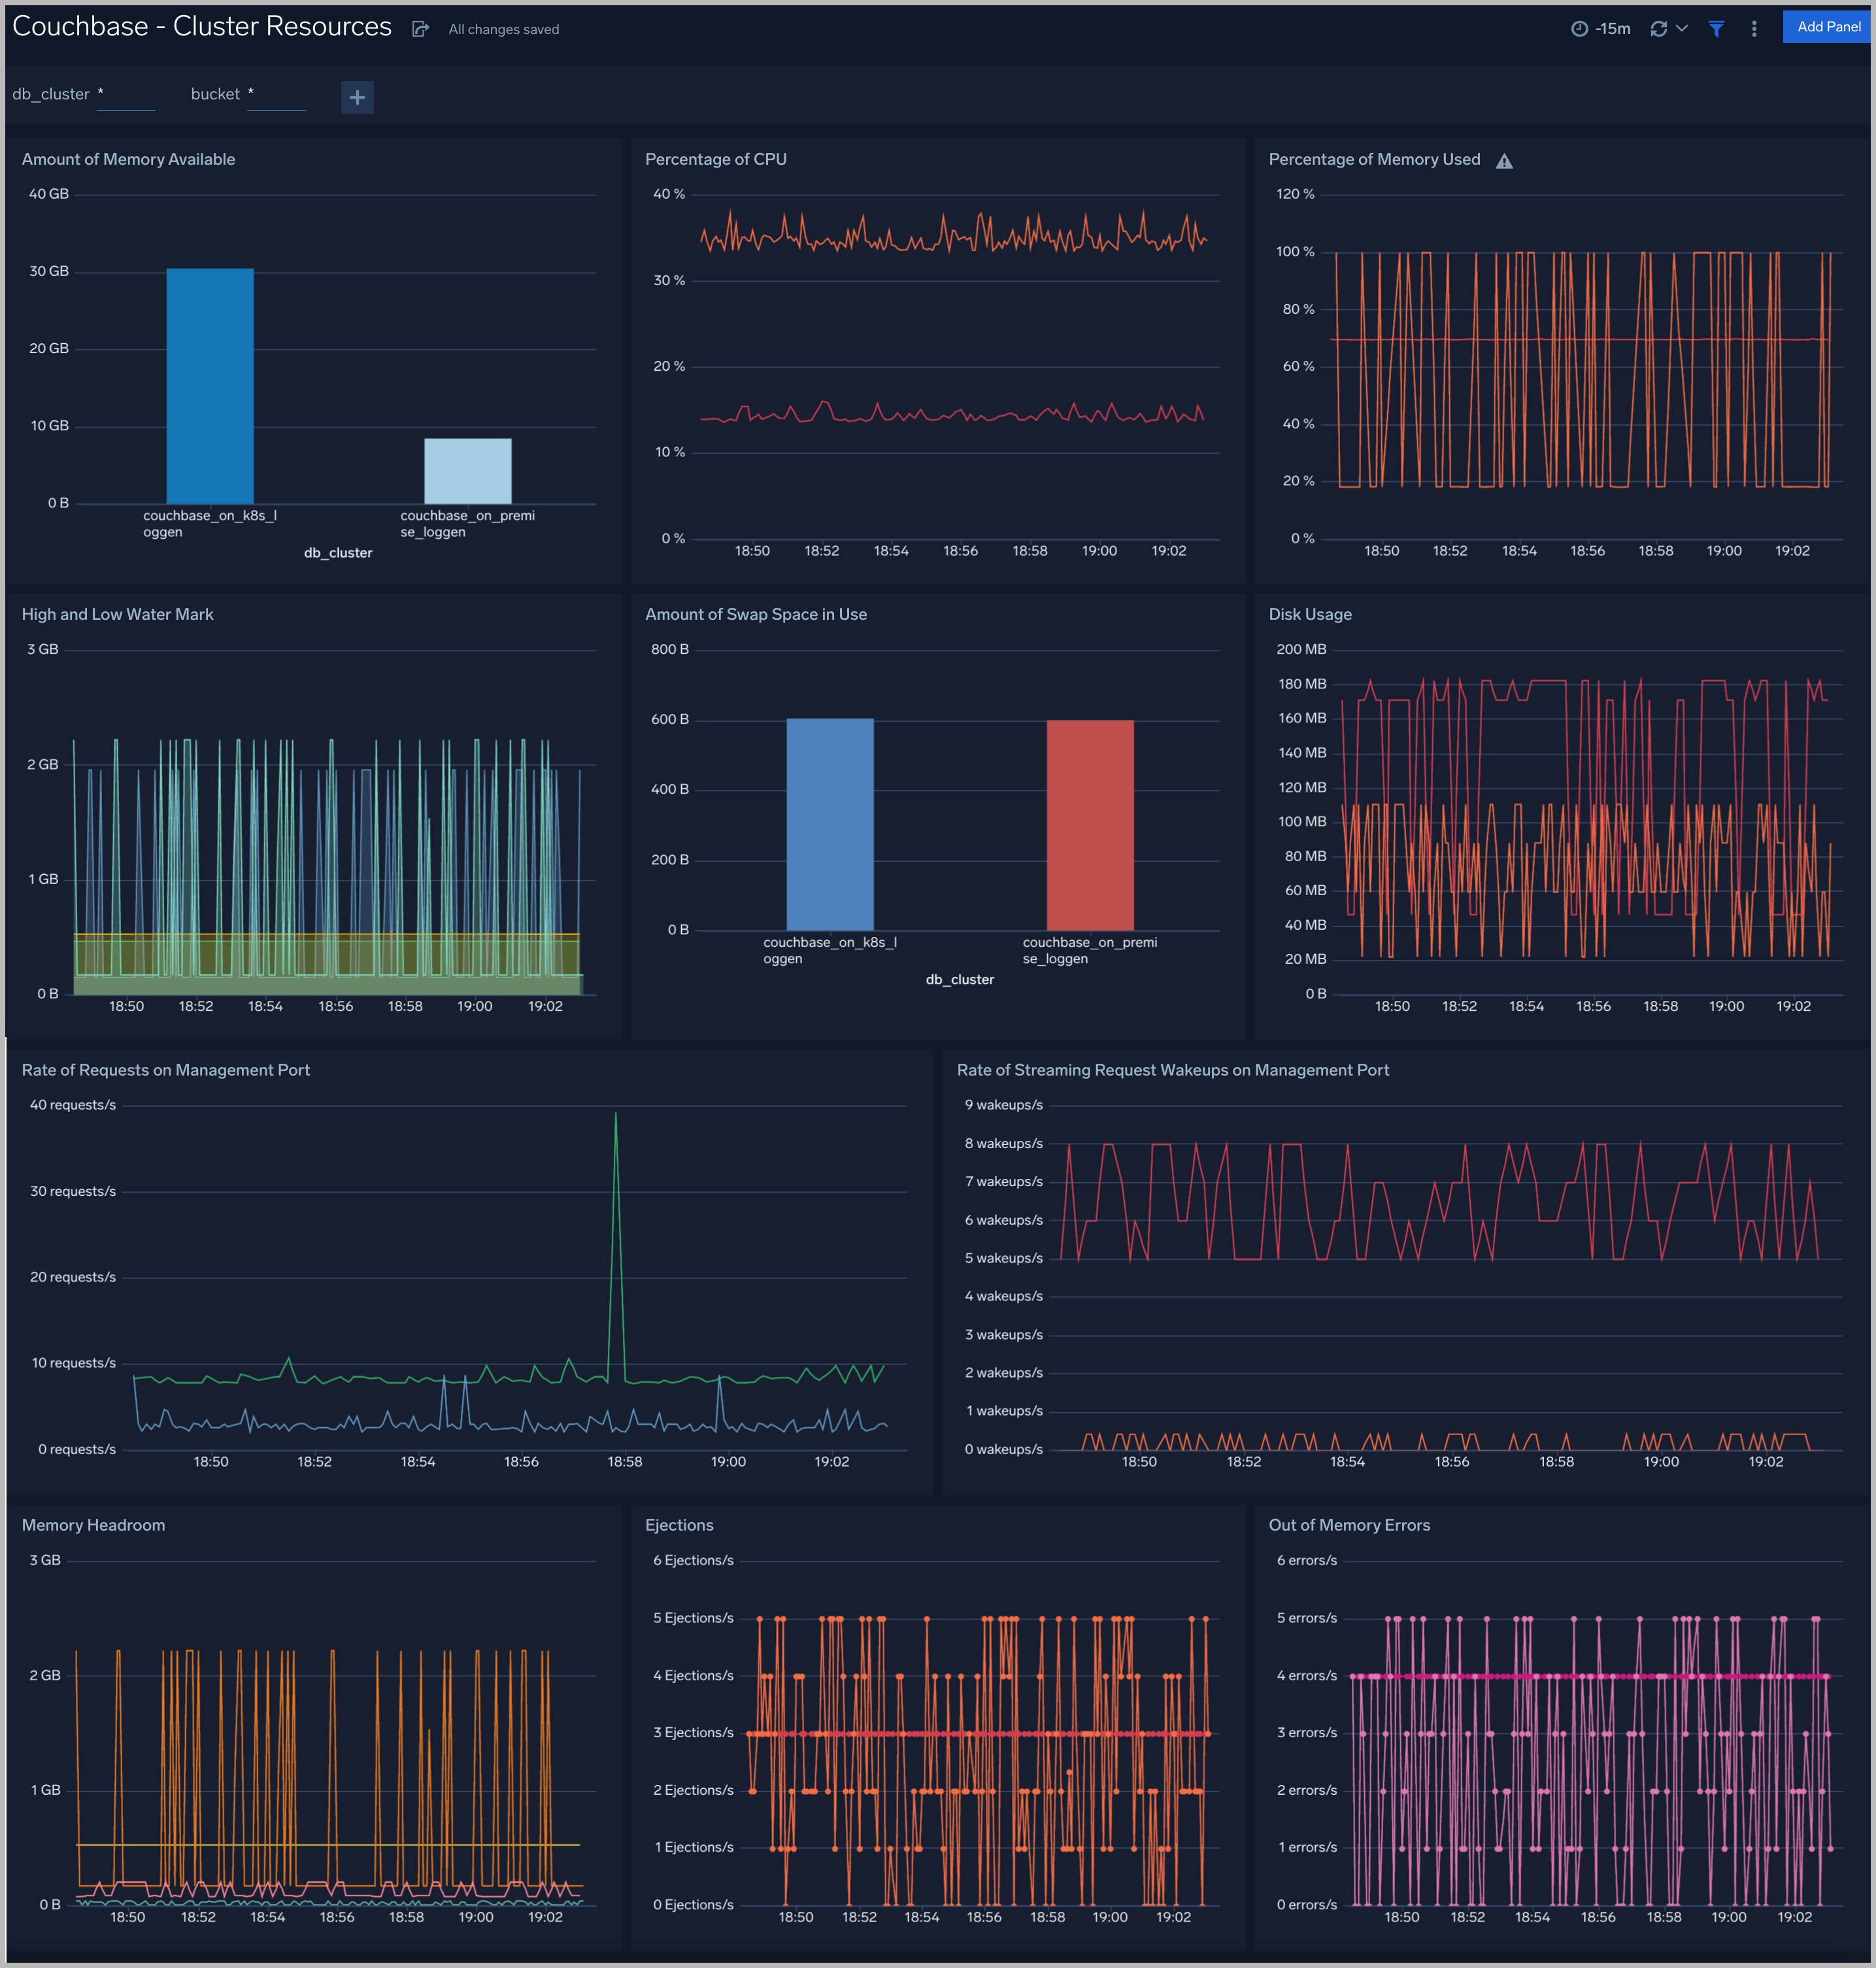
Cluster Resources
The Couchbase - Cluster Resources dashboard provides an insight into the resources of clusters: the memory resource usage, the CPU resource usage, the disk resource usage.
Use this dashboard to:
- Gain insights into the workload of Couchbase clusters such as the percent of CPU used, the percent of Memory used, the High Low watermark.
- Gain insights into the used resources of Couchbase clusters such as the Disk usage, the Swap space usage, the Memory available.
- Gain insights into the rate requests, rate of streaming requests on the management port.
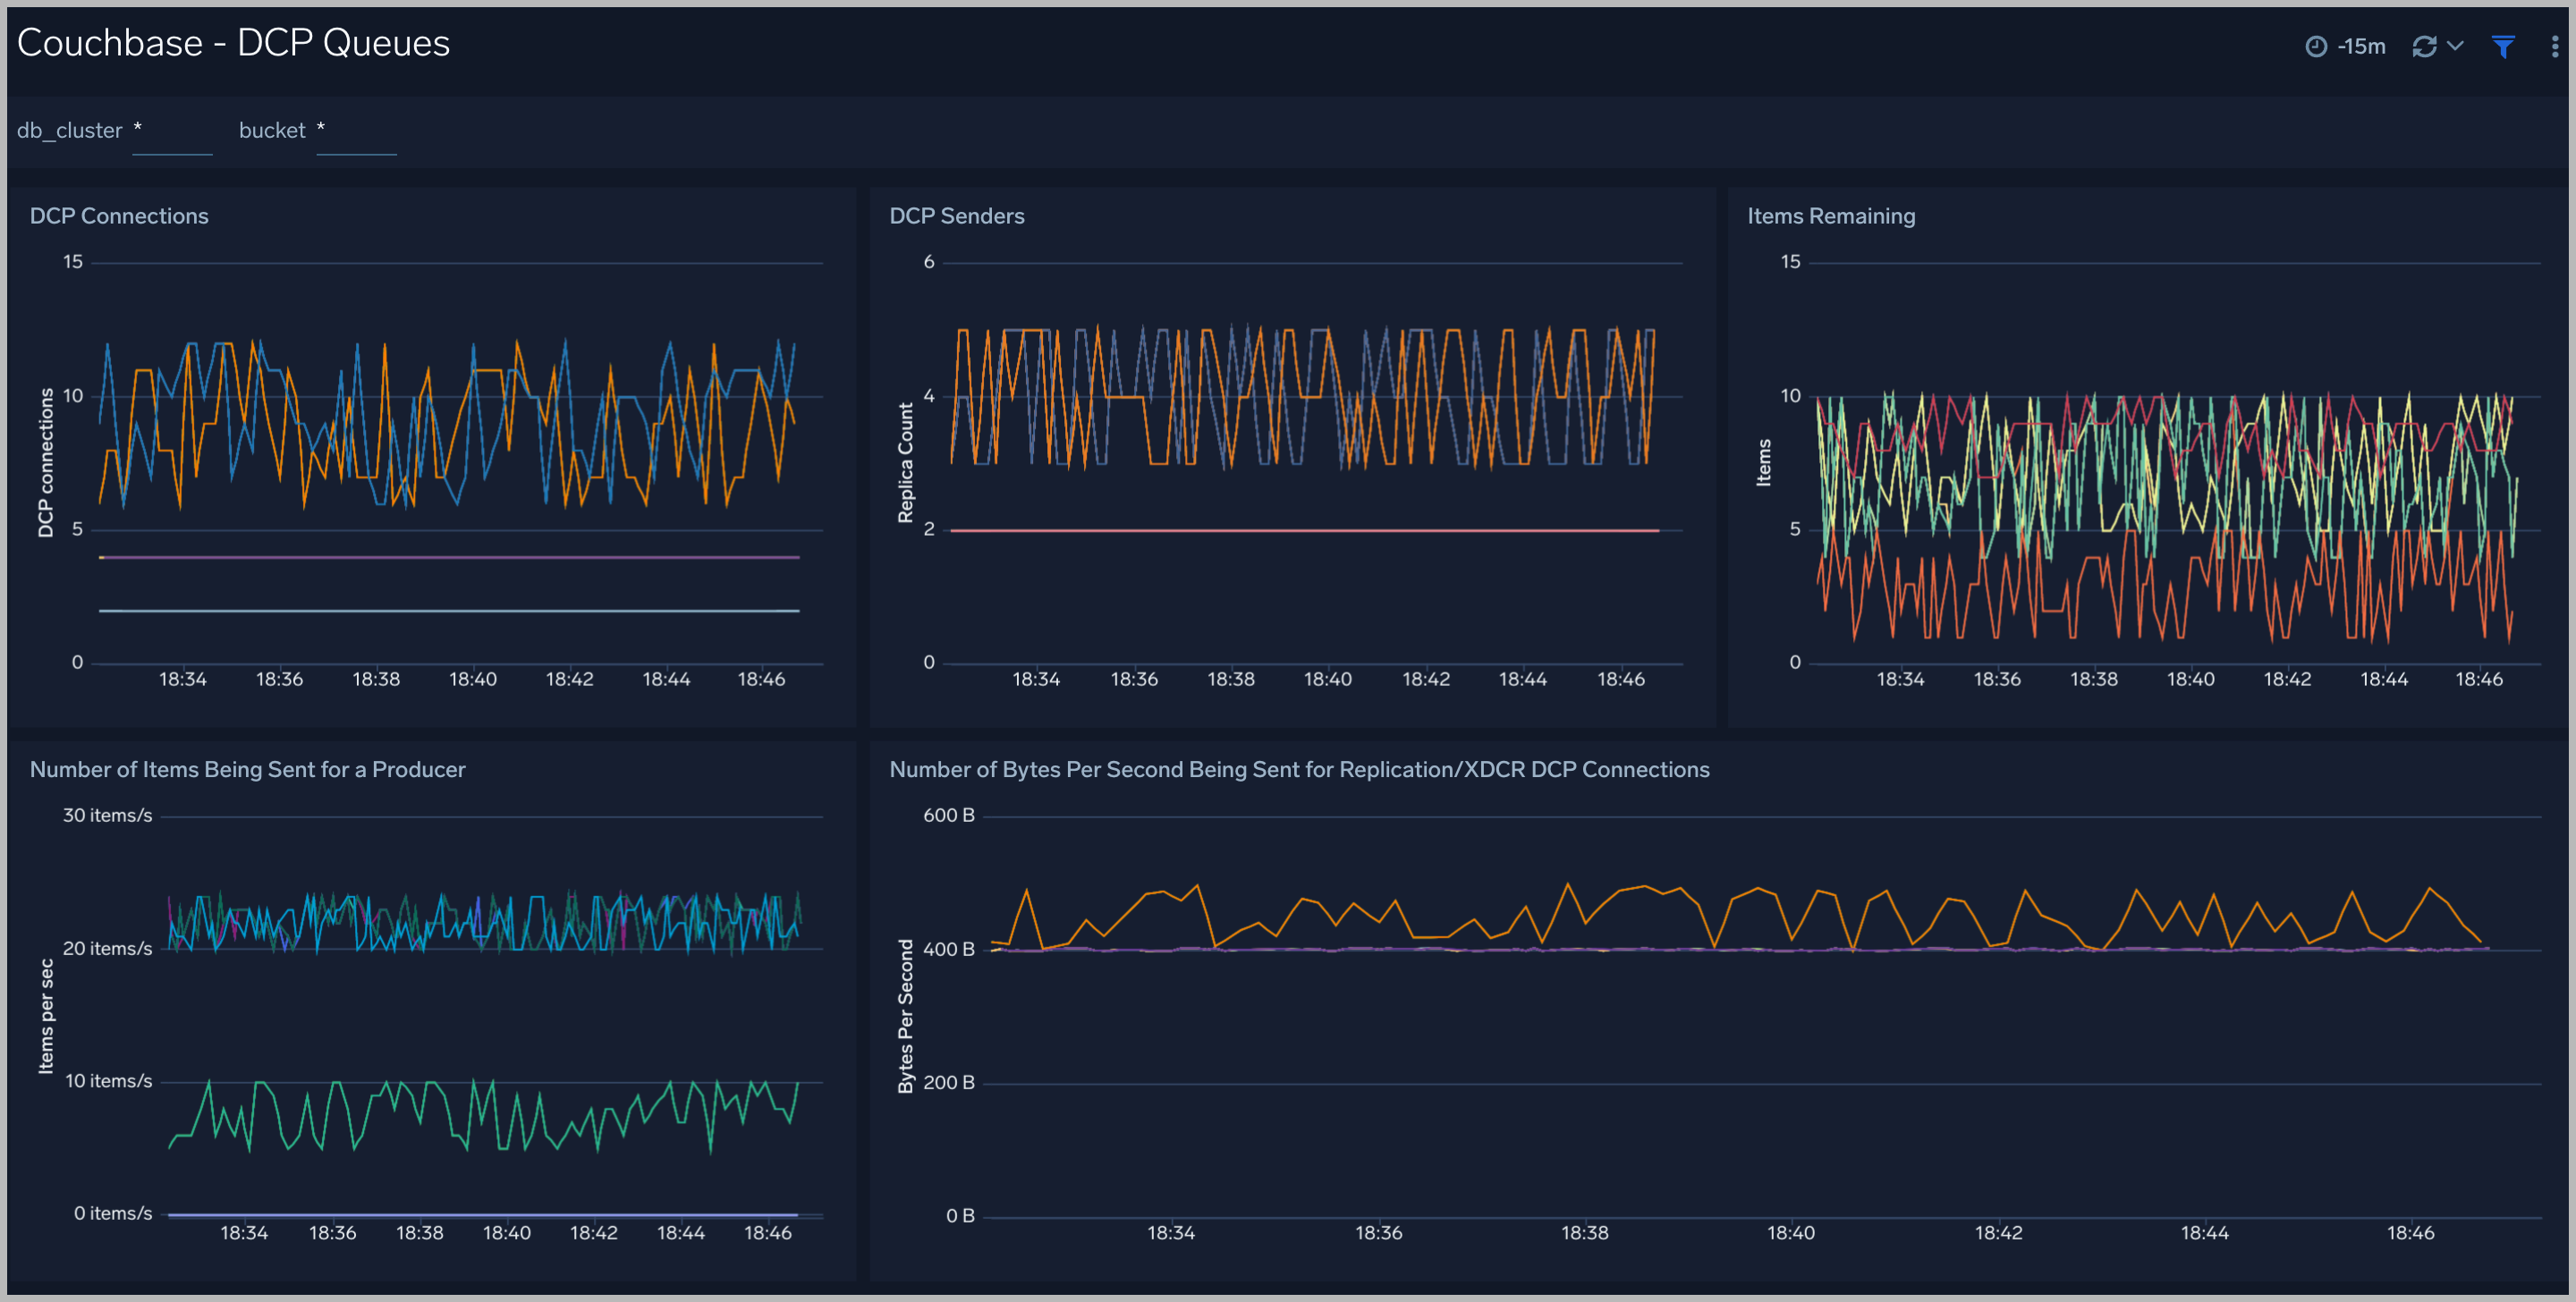
DCP Queues
The Couchbase - DCP Queues dashboard provides an insight into the DCP queues of buckets in couchbase clusters: the number of DCP connections, DCP senders, the number of items in DCP Queues.
Use this dashboard to:
- Gain insights into the operations of DCP queues. This helps you identify the performance of your clusters when your cluster rebalance
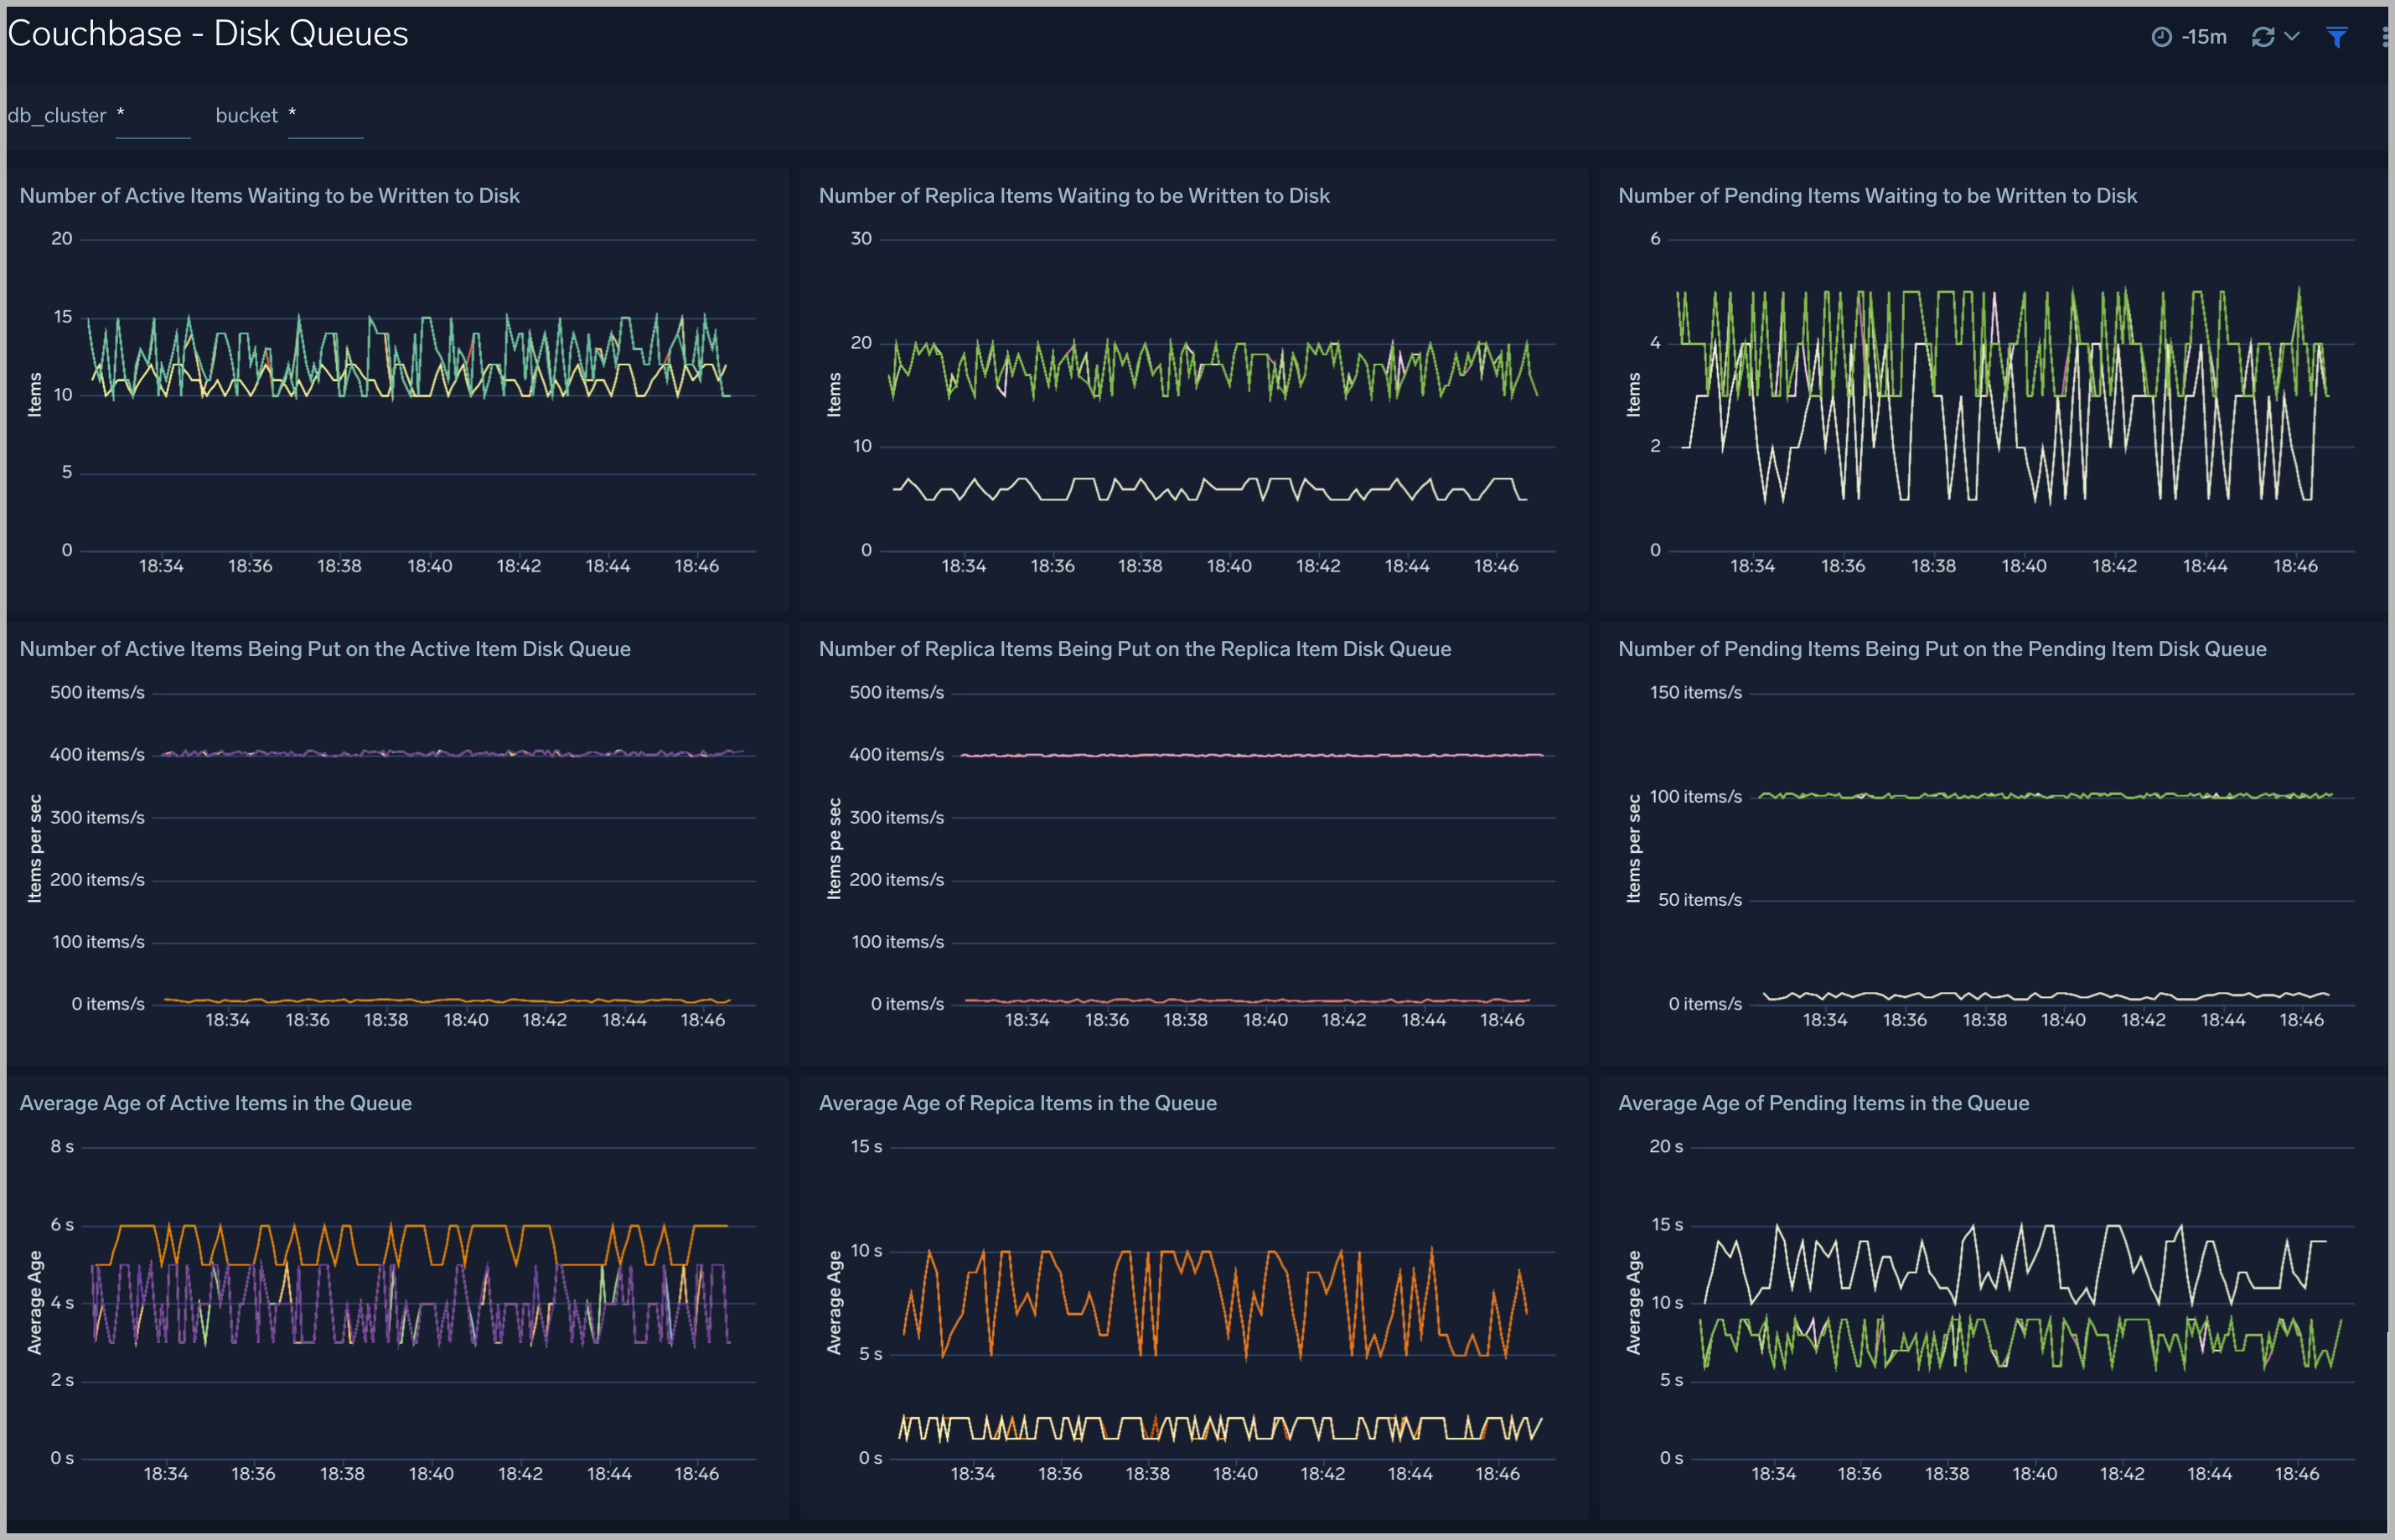
Disk Queues
The Couchbase - Disk Queues dashboard provides an insight into the DCP queues of buckets in couchbase clusters: the number of active items waiting to be written to disk, the number of items being put to disk queue, the average age of items in queues.
Use this dashboard to:
- Gain insights into the operations of disk queues. This helps you identify performance about read/write of your clusters.
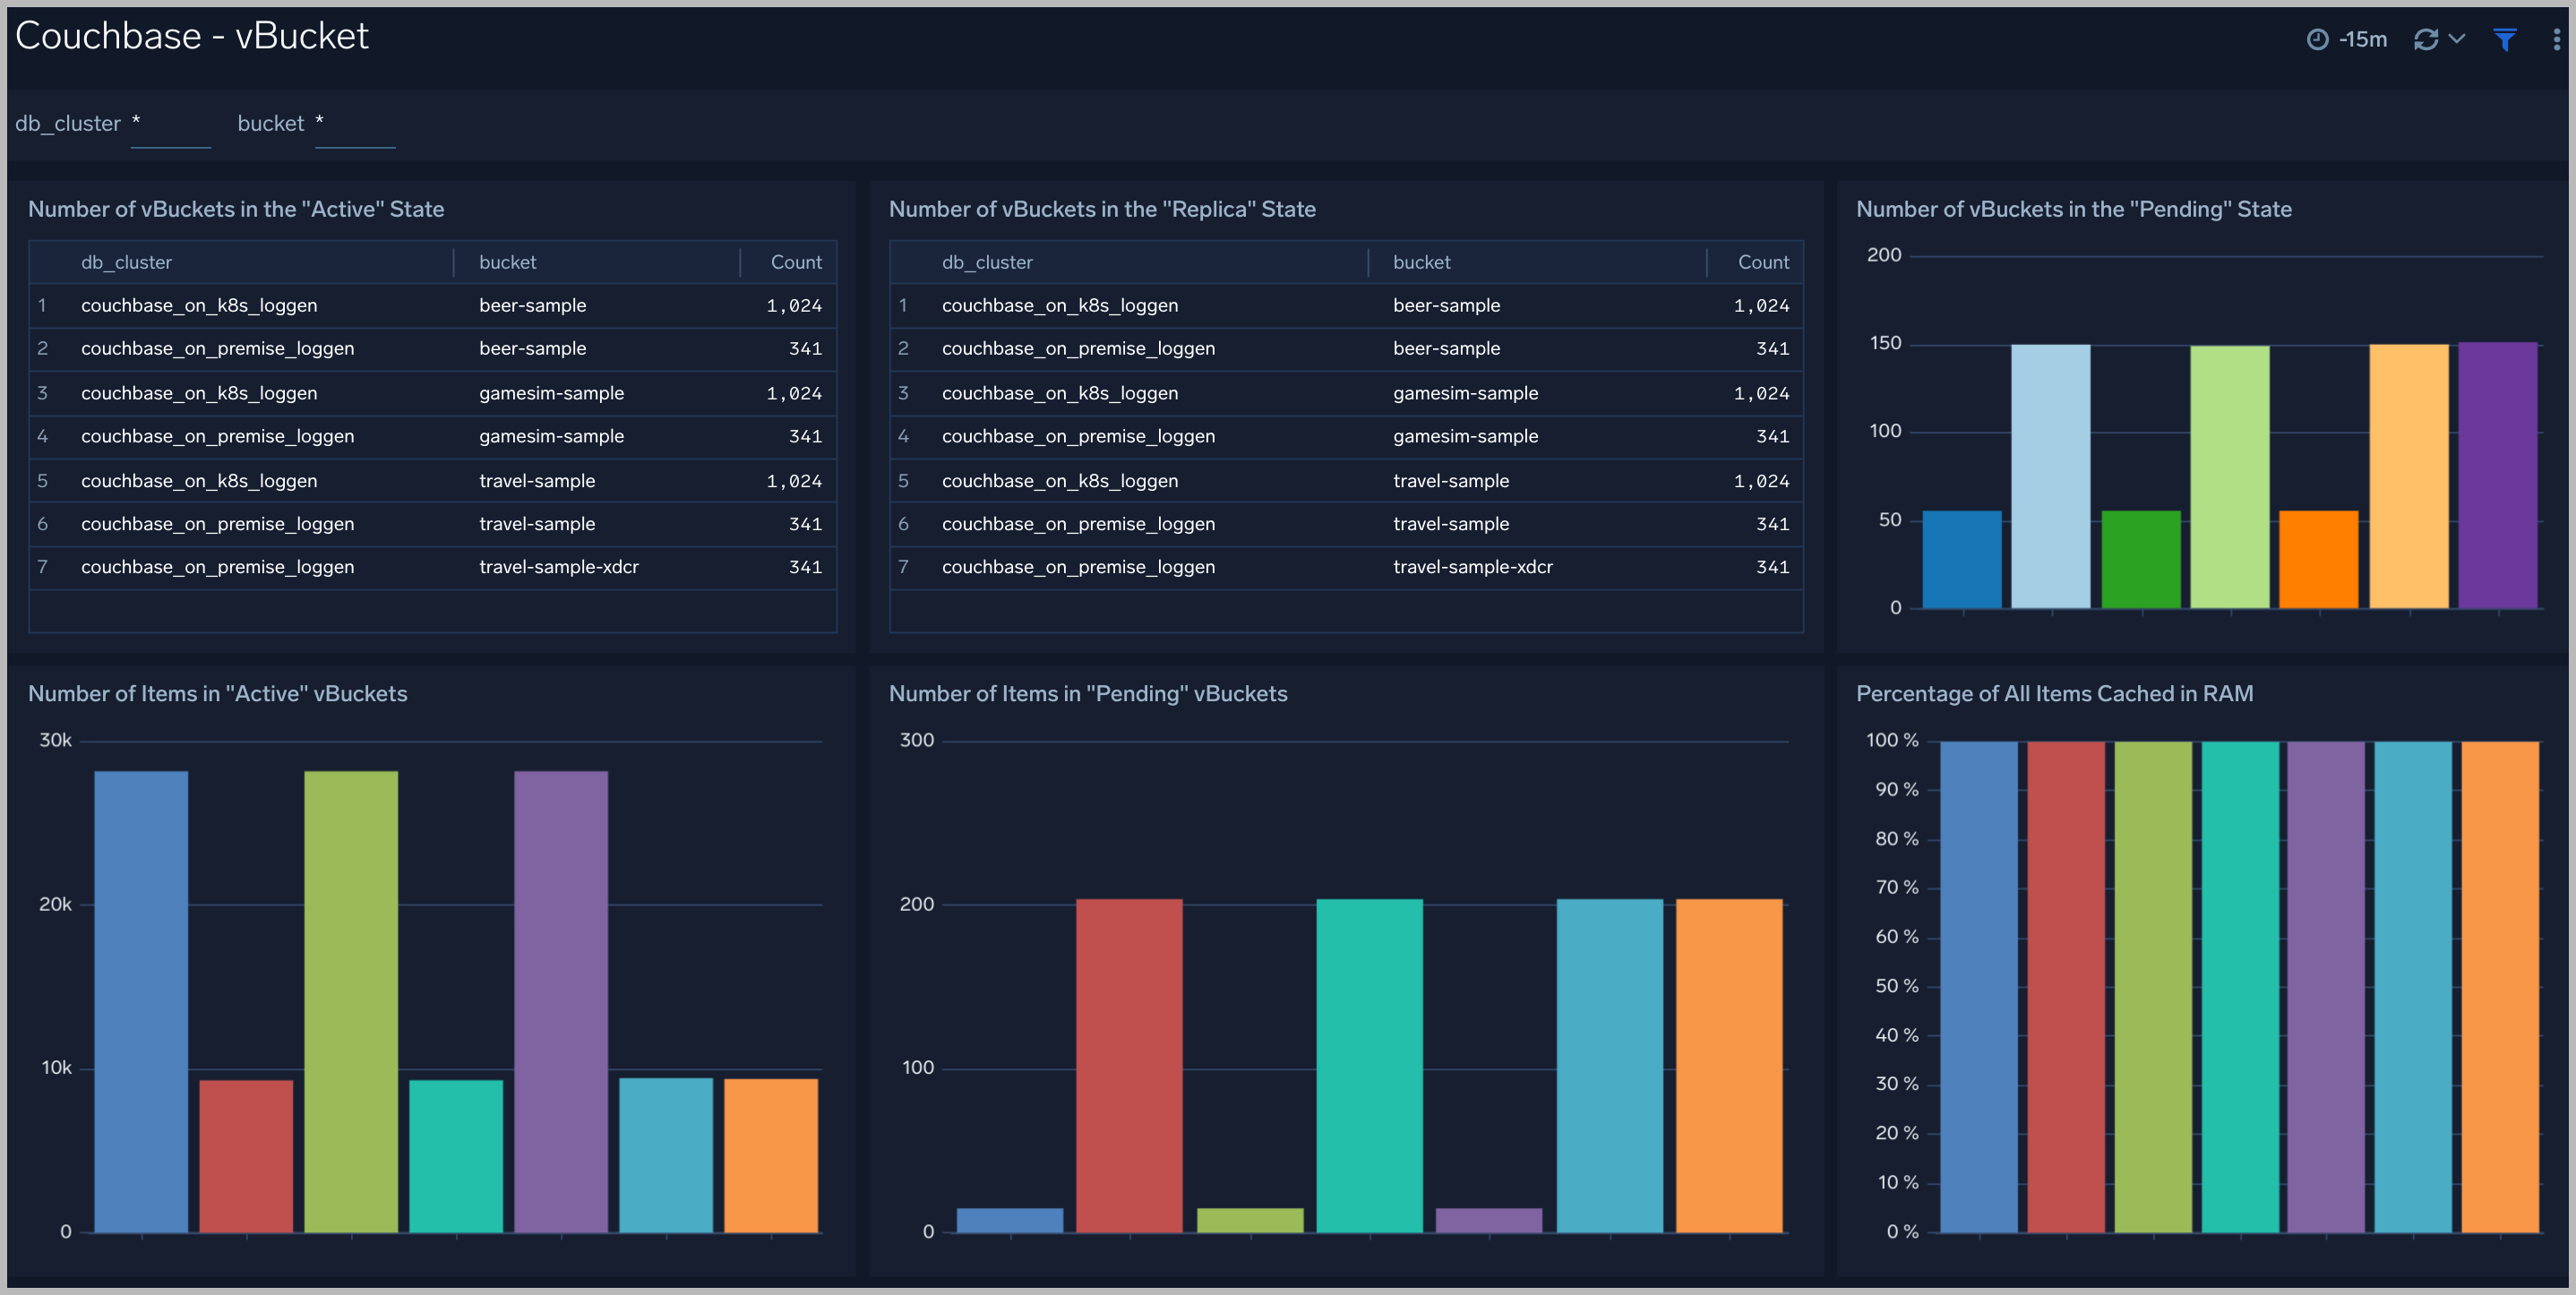
vBucket
The Couchbase - vBucket dashboard provides insights into the state of vBucket of buckets in couchbase clusters: the number of vBucket of buckets, the number items in vBuckets, the state of vBuckets.
Use this dashboard to:
- To determine the number and status of vBucket in your clusters.
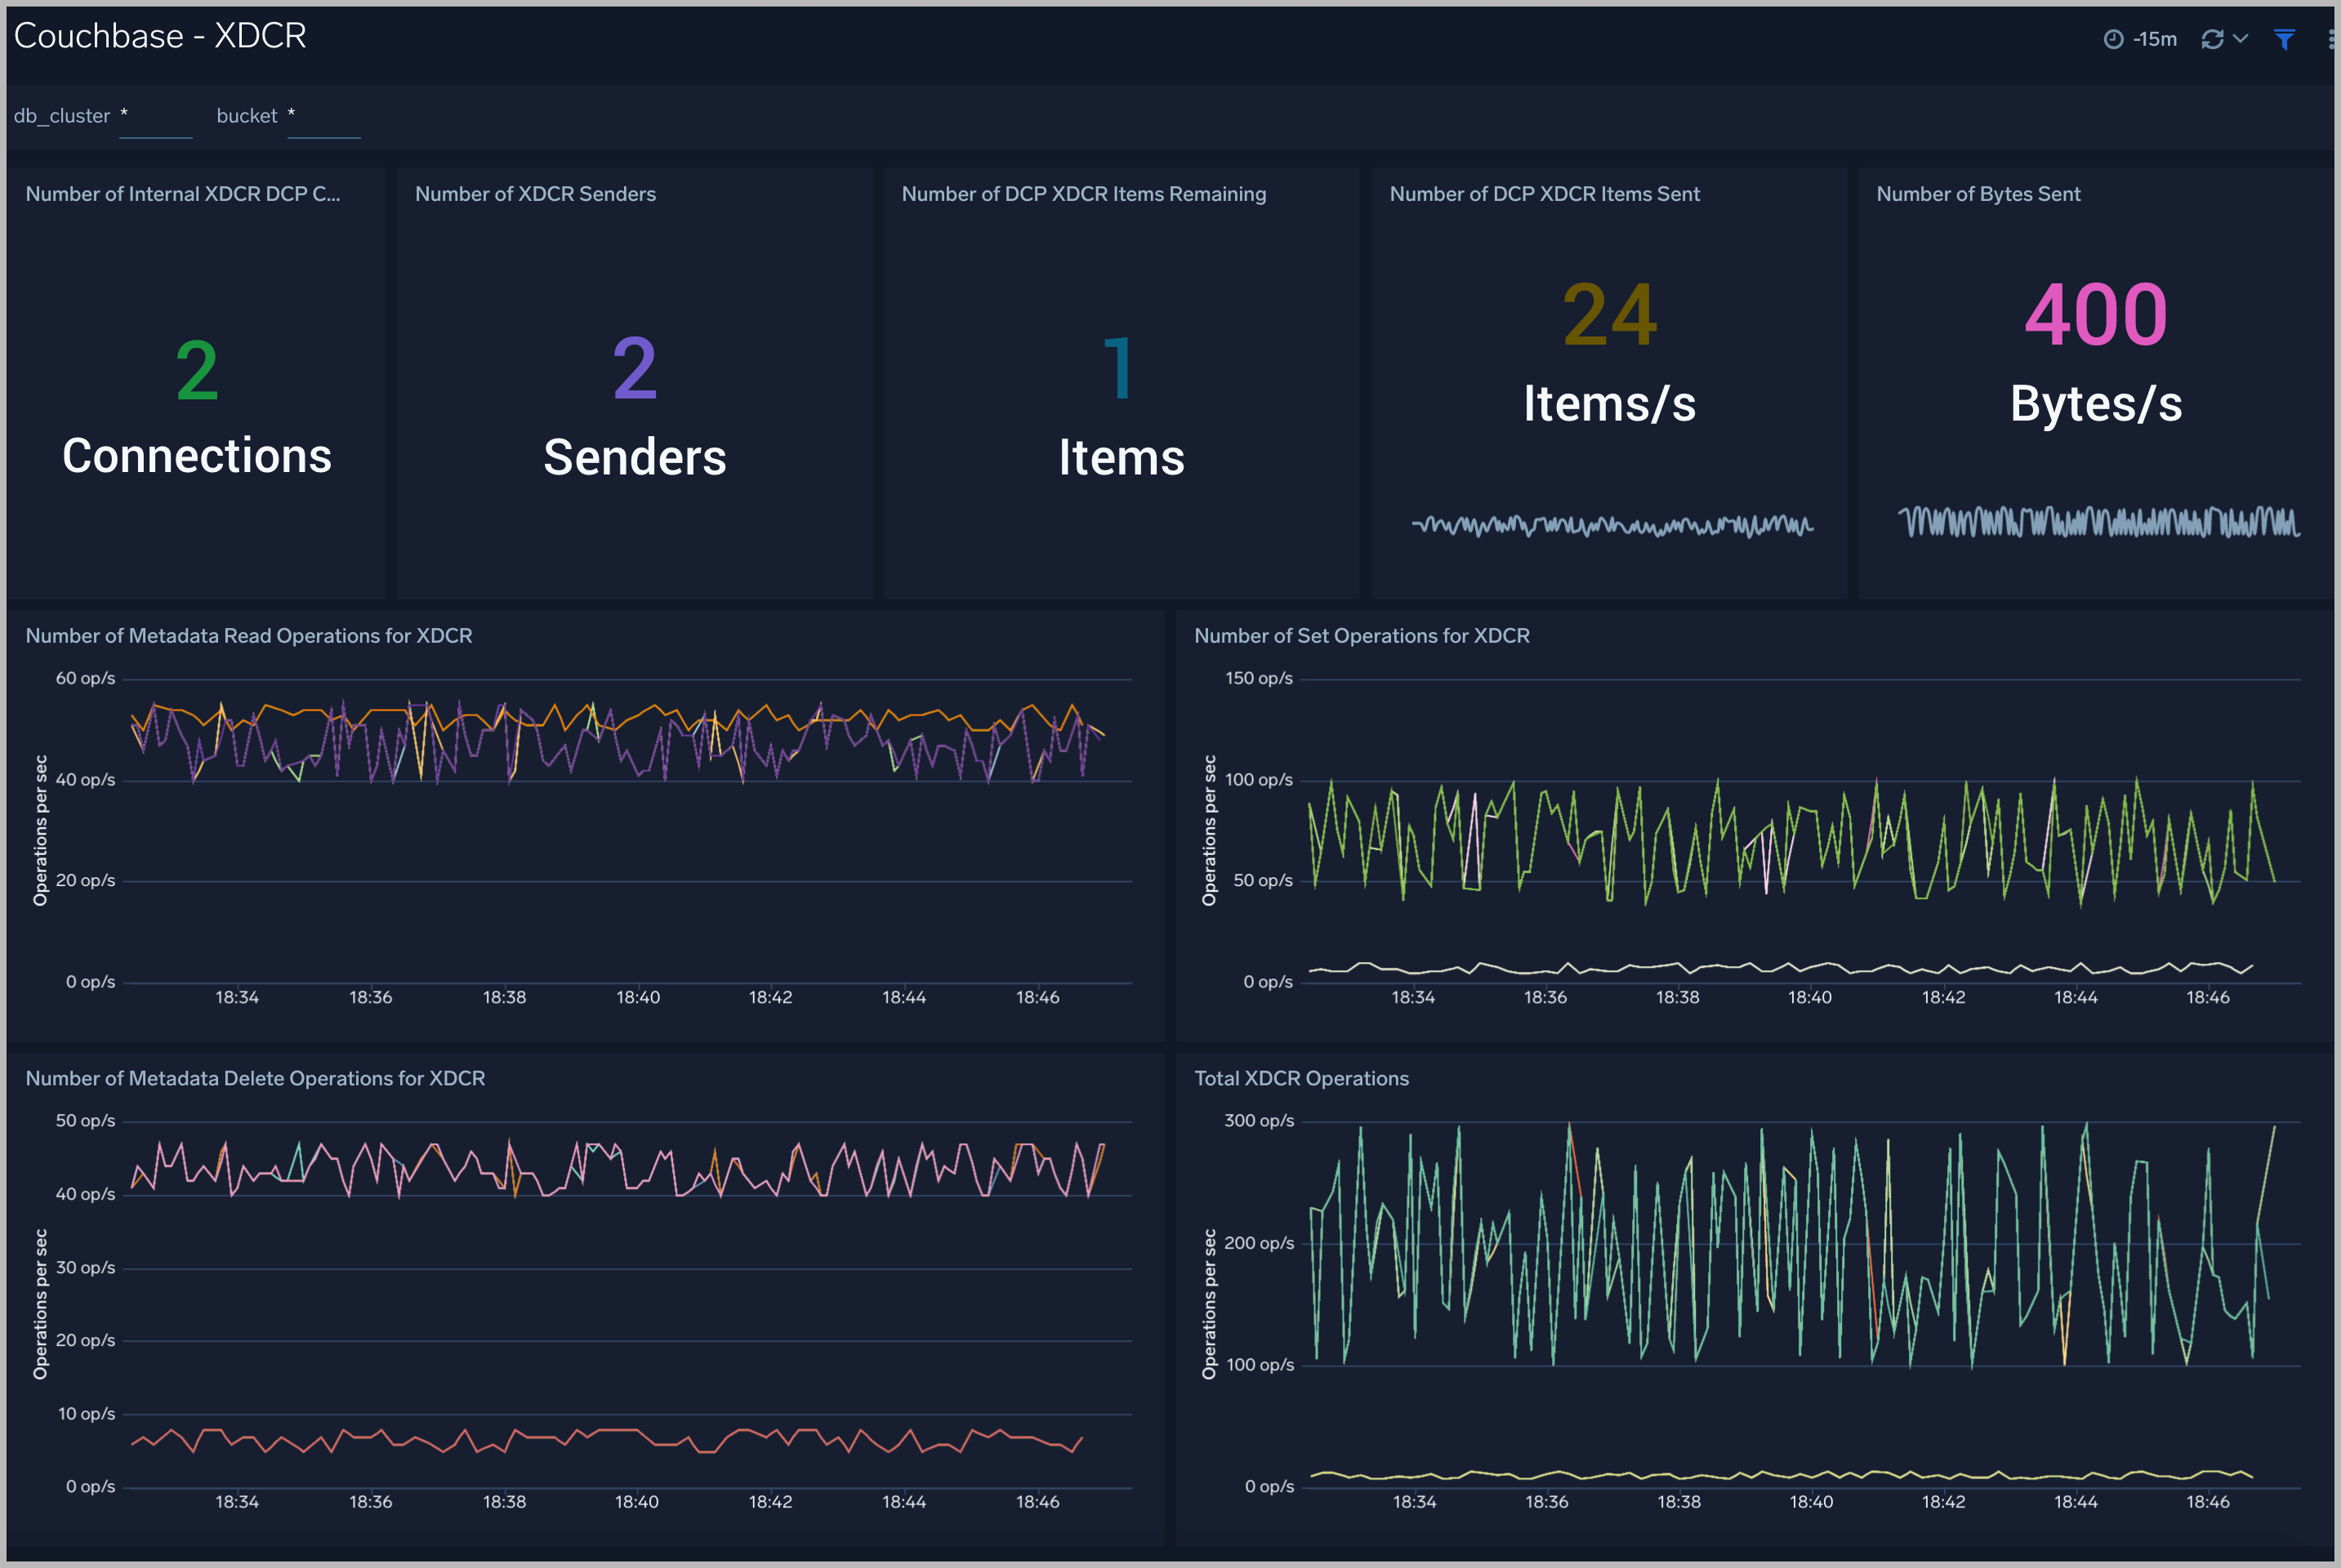
XDCR
The Couchbase - XDCR dashboard provides insights into replicate operations of buckets cross-cluster: the number of XDCR connections, the number of XDCR items remaining, the number of read-set-delete operations for XDCR.
Use this dashboard to:
- Gain insights into replicate operations of buckets cross-cluster
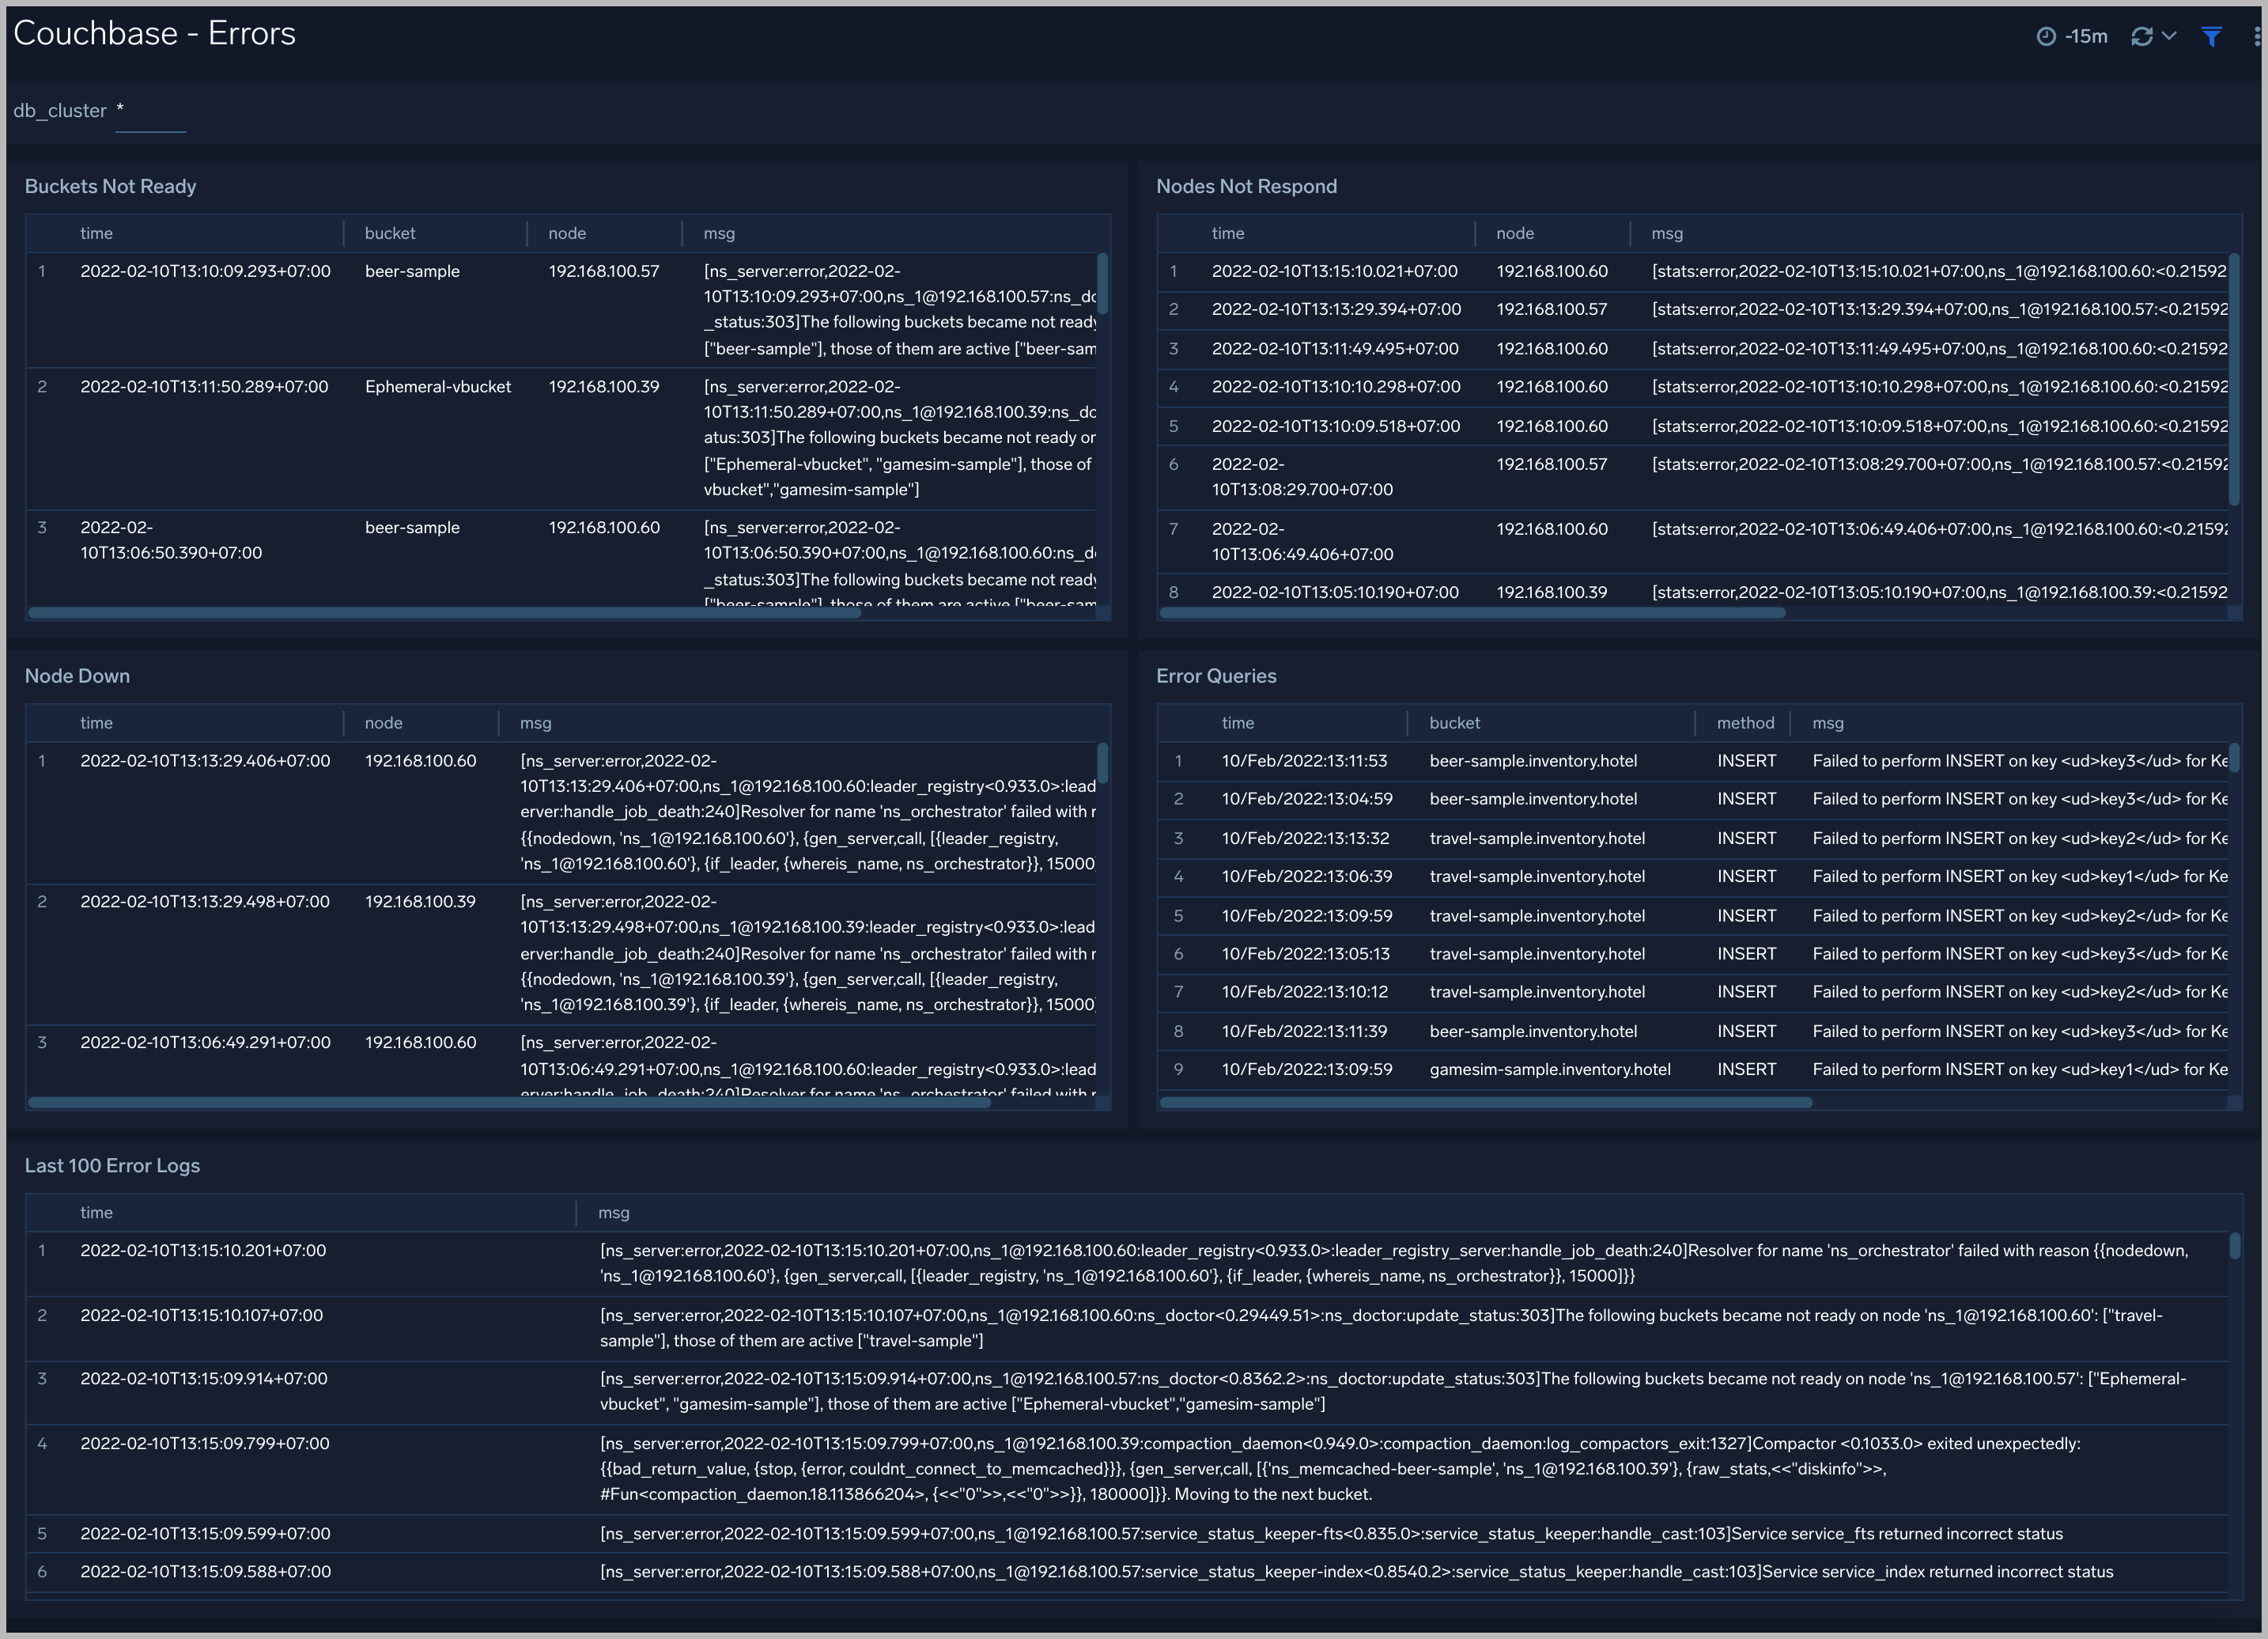
Errors
The Couchbase - Errors dashboard provides insights into errors from error logs in couchbase servers and couchbase clusters: buckets not ready, nodes not responding, node down, error queries, last error logs.
Use this dashboard to:
- Quickly identify critical errors affecting your couchbase servers.
- Identify SQL error queries from clients.
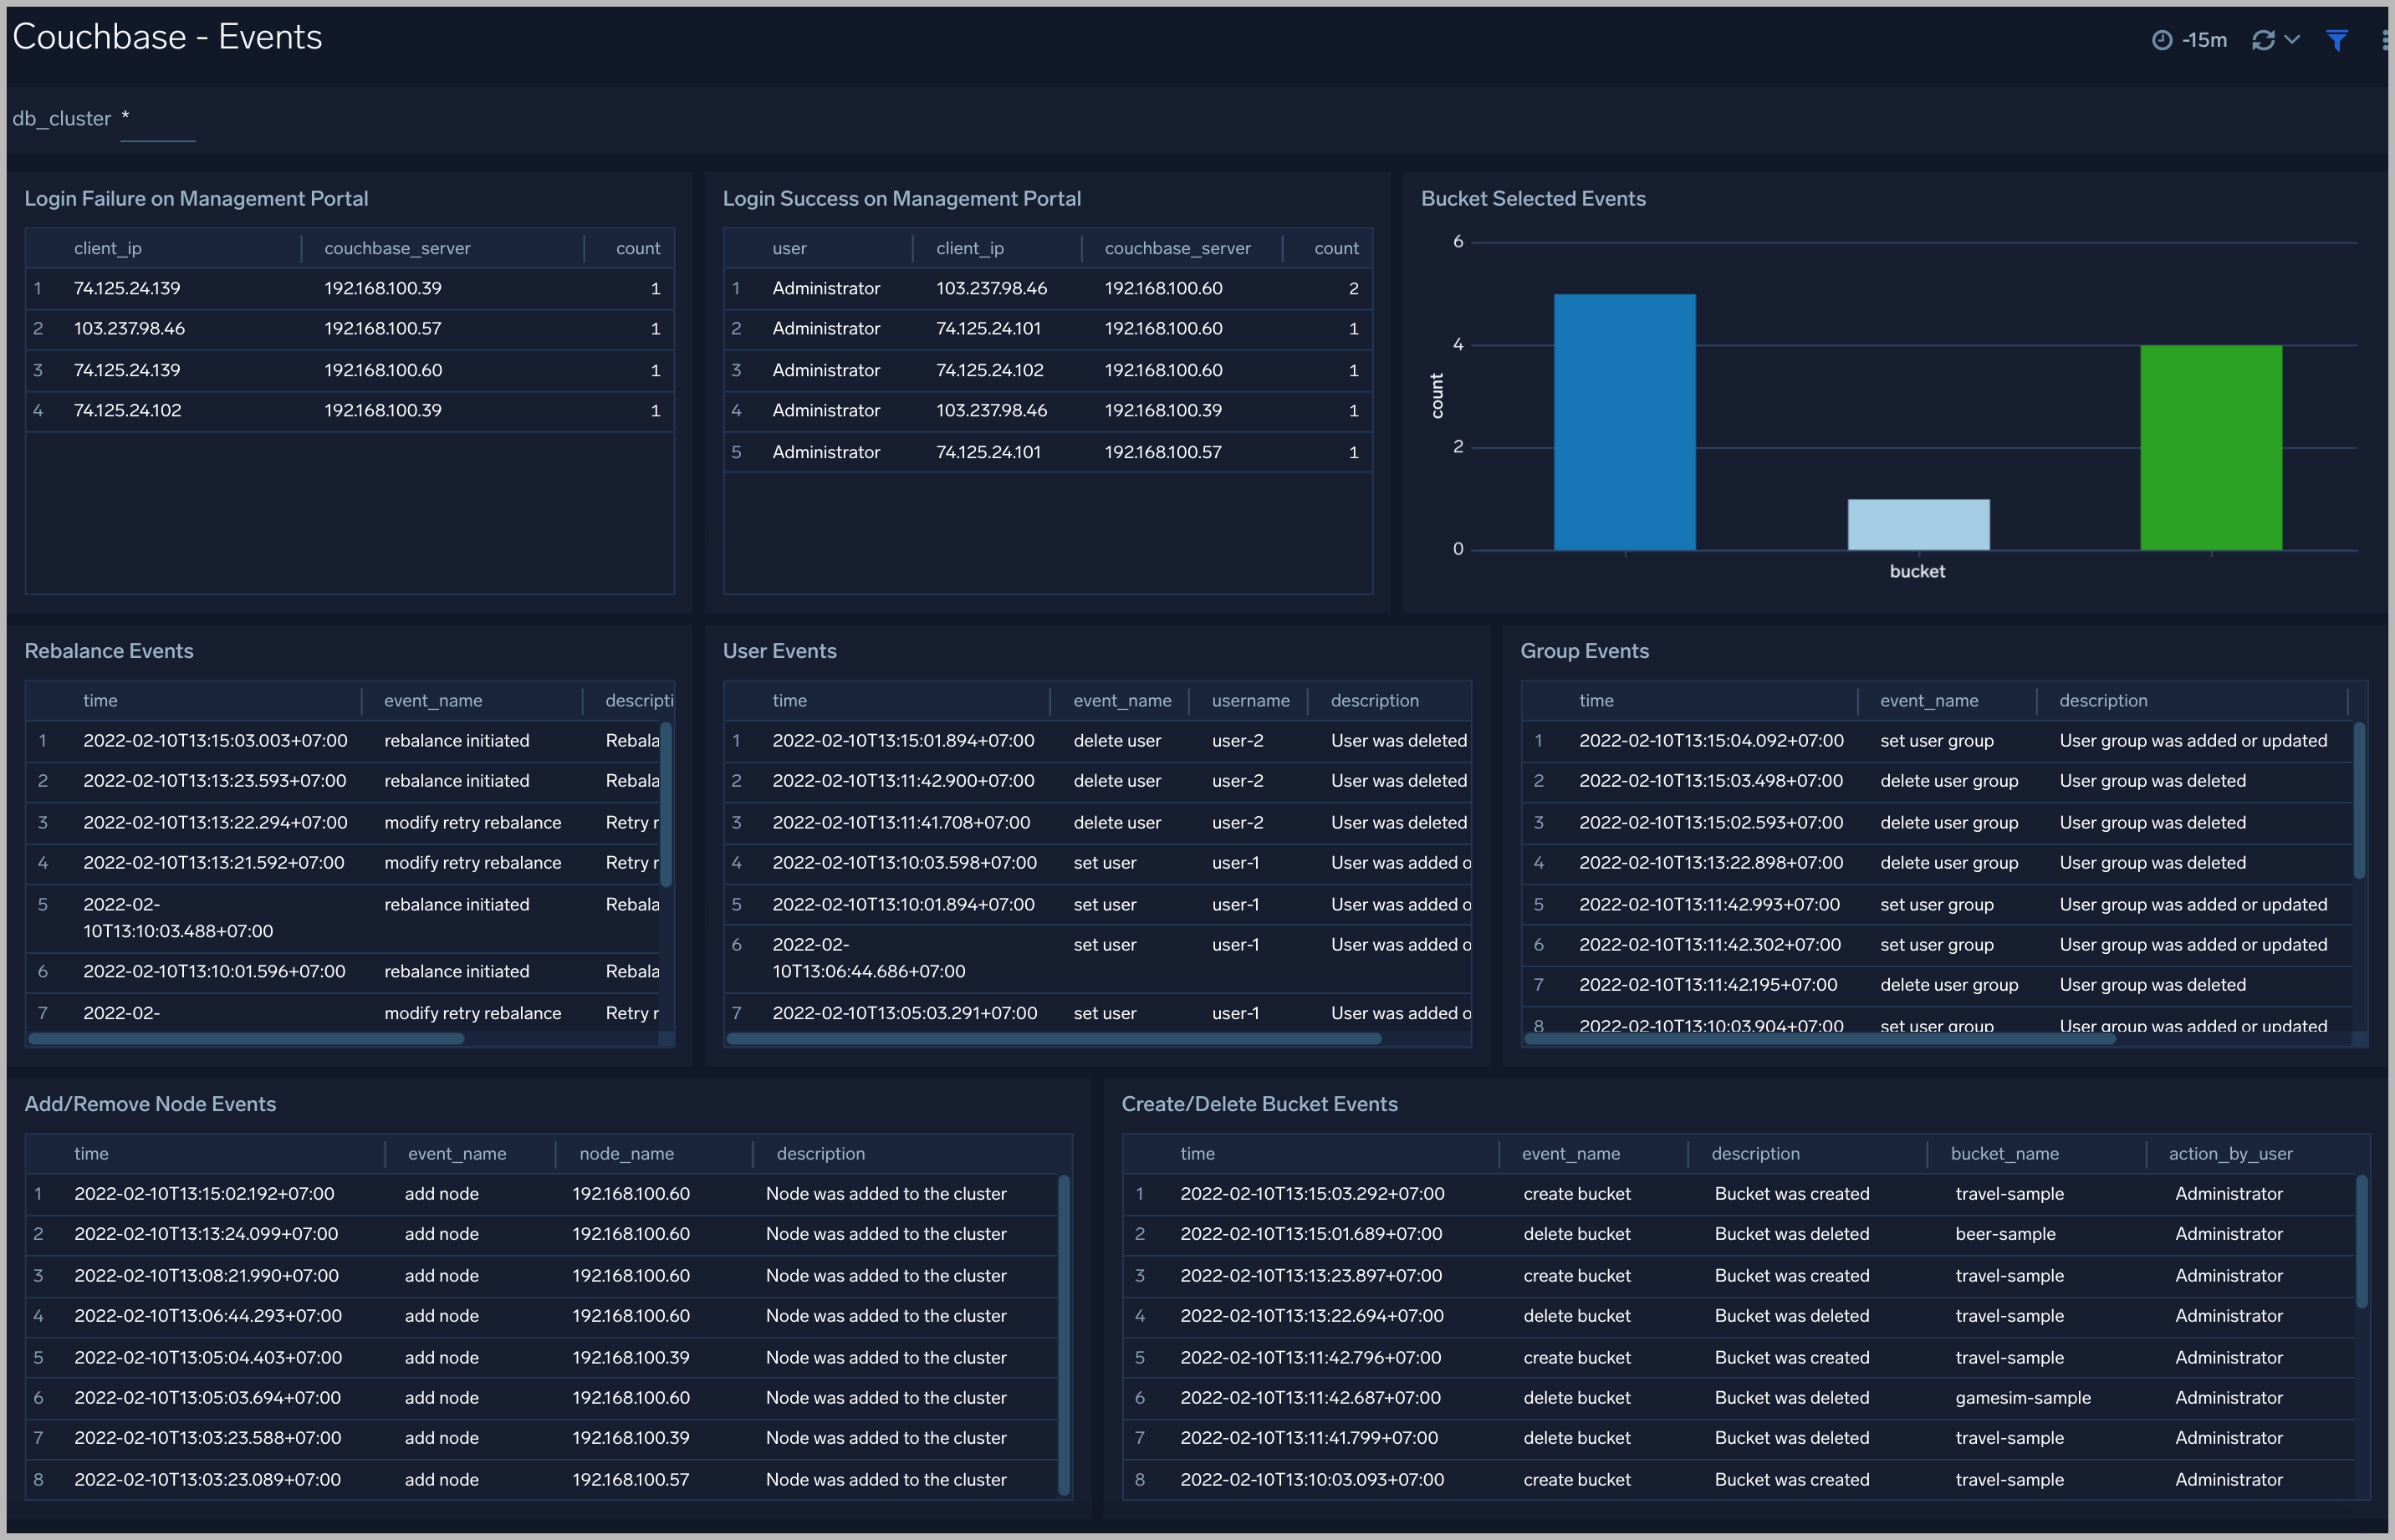
Events
The Couchbase - Events dashboard provides insights into events from couchbase servers and couchbase clusters: the number of login failure, login success from clients, add/remove node events, add/remove bucket events, rebalance events.
Use this dashboard to:
- To audit the activities happening in the cluster. This helps to determine what activities have occurred in the system, helping to control system security.
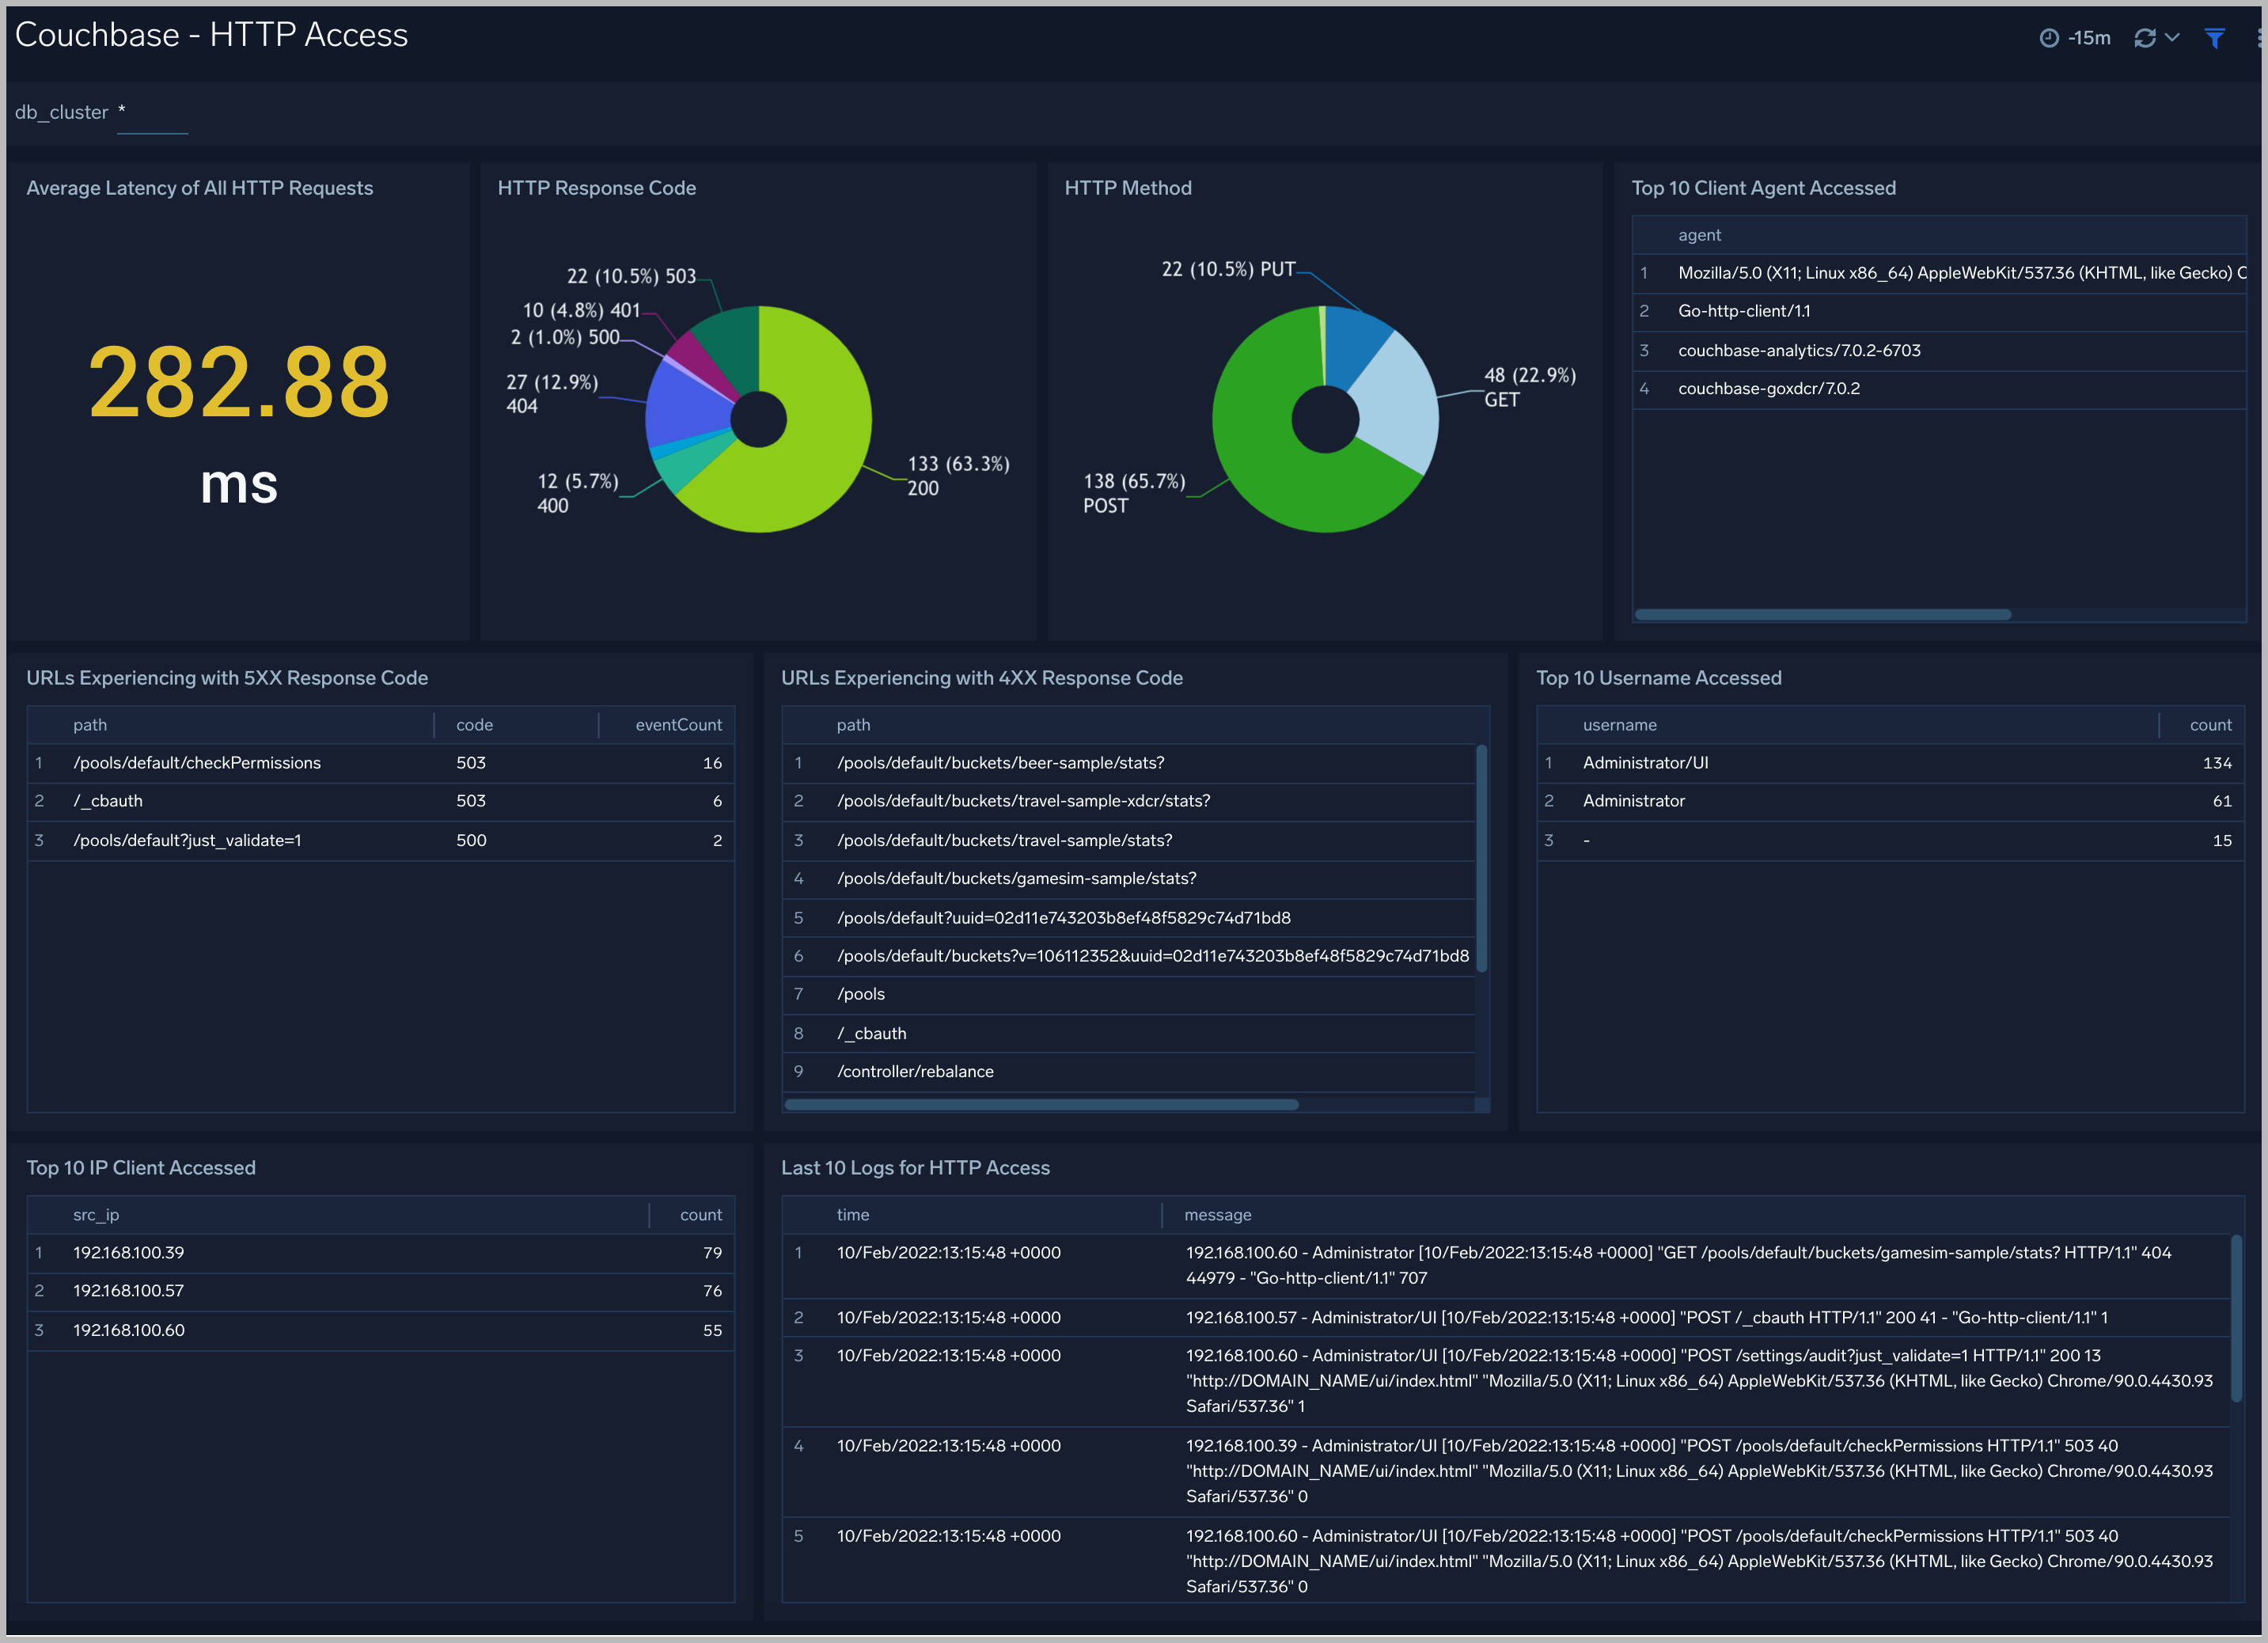
HTTP Access
The Couchbase - HTTP Access dashboard provides insights into HTTP Rest API requests from clients to couchbase servers and couchbase clusters: the latency, HTTP codes, client agents, IP clients, errors with 4XX 5XX response code.
Use this dashboard to:
- To understand user behavior accessing clusters and servers through Rest API.
Create monitors for Couchbase app
From your App Catalog:
- From the Sumo Logic navigation, select App Catalog.
- In the Search Apps field, search for and then select your app.
- Make sure the app is installed.
- Navigate to What's Included tab and scroll down to the Monitors section.
- Click Create next to the pre-configured monitors. In the create monitors window, adjust the trigger conditions and notifications settings based on your requirements.
- Scroll down to Monitor Details.
- Under Location click on New Folder.
note
By default, monitor will be saved in the root folder. So to make the maintenance easier, create a new folder in the location of your choice.
- Enter Folder Name. Folder Description is optional.
tip
Using app version in the folder name will be helpful to determine the versioning for future updates.
- Click Create. Once the folder is created, click on Save.
Couchbase alerts
| Alert Type (Metrics/Logs) | Alert Name | Alert Description | Trigger Type (Critical / Warning) | Alert Condition | Recover Condition |
| Logs | Couchbase - Bucket Not Ready | This alert fires when a bucket in the Couchbase cluster is not ready. | Critical | < 0 | < =0 |
| Logs | Couchbase - Node Down | This alert fires when a node in the Couchbase cluster is down. | Critical | > | < =0 |
| Logs | Couchbase - Node Not Respond | This alert fires when a node in the Couchbase cluster does not respond too many times. | Critical | > = 10 | < 10 |
| Logs | Couchbase - Too Many Error Queries on Buckets | This alert fires when there are too many errors queries on a bucket in a Couchbase cluster. | Critical | > = 1000 | < 1000 |
| Logs | Couchbase - Too Many Login Failures | This alert fires when there are too many login failures to a node in a Couchbase cluster. | Critical | > = 1000 | < 1000 |
| Metrics | Couchbase - High CPU Usage | This alert fires when CPU usage on a node in a Couchbase cluster is high. | Critical | > = 80 | < 80 |
| Metrics | Couchbase - High Memory Usage | This alert fires when memory usage on a node in a Couchbase cluster is high. | Critical | > = 80 | < 80 |