Elasticsearch - Classic Collector

The Elasticsearch app is a unified logs and metrics app that helps you monitor the availability, performance, health, and resource utilization of your Elasticsearch clusters. Preconfigured dashboards provide insight into cluster health, resource utilization, sharding, garbage collection, and search, index, and cache performance.
Sample log messages
- Kubernetes environments
- Non-Kubernetes environments
{
	"type":"server",
	"timestamp":"2021-07-12T05:12:07,101+0000",
	"level":"WARN",
	"component":"o.e.c.NodeConnectionsService",
	"cluster.name":"elasticsearch",
	"node.name":"elasticsearch-master-0",
	"cluster.uuid":"pQ372ZkIQiaHkSVp6hlxZw",
	"node.id":"7PdqQlHYRjqbzClkTeoVdA",
	"message":"failed to connect to {elasticsearch-master-1}{OfUoMAwoRoKr2sAlYAYuEA}{RnYfI0DUT9uqtF4h5aVDQg}{10.42.1.143}{10.42.1.143:9300}{dim}{ml.machine_memory=2147483648, ml.max_open_jobs=20, xpack.installed=true} (tried [1] times)"
}
{
	"type":"server",
	"timestamp":"2021-07-12T11:42:25,862+07:00",
	"level":"INFO",
	"component":"o.e.x.s.a.s.FileRolesStore",
	"cluster.name":"elasticsearch",
	"node.name":"v103-157-218-134.3stech.vn",
	"message":"parsed [0] roles from file [/etc/elasticsearch/roles.yml]"
}
Collecting logs and metrics for the Elasticsearch app
Configuring log and metric collection for the Elasticsearch app includes the following tasks.
Configure Collection for Elasticsearch
- Kubernetes environments
- Non-Kubernetes environments
In Kubernetes environments, we use the Telegraf Operator, which is packaged with our Kubernetes collection. You can learn more about it here. The diagram below illustrates how data is collected from Elasticsearch in a Kubernetes environment. Four services in the architecture shown below make up the metric collection pipeline: Telegraf, Telegraf Operator, Prometheus, and Sumo Logic Distribution for OpenTelemetry Collector.
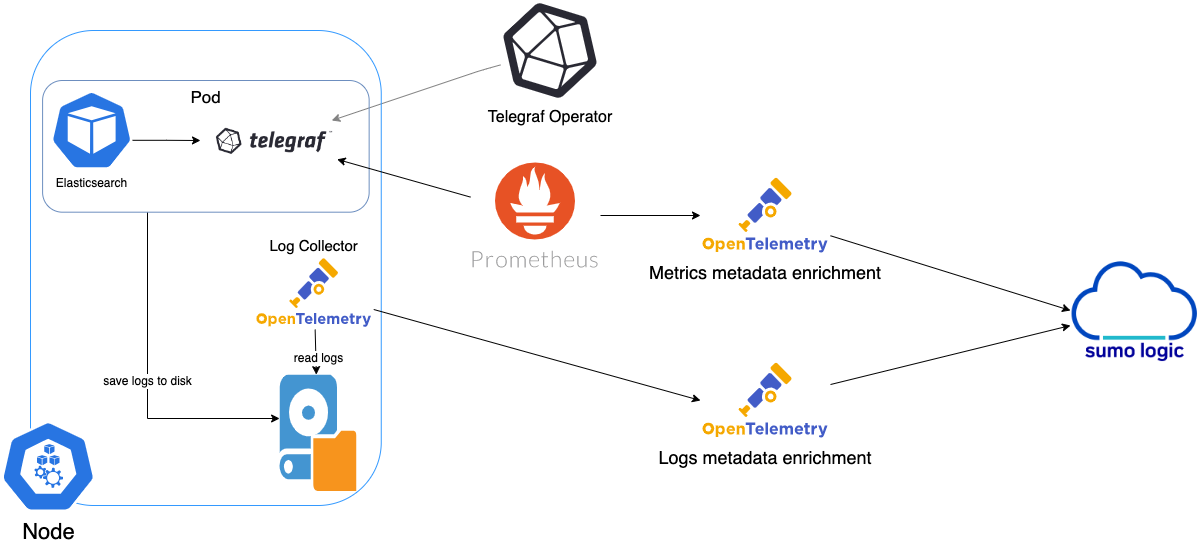
The first service in the metrics pipeline is Telegraf. Telegraf collects metrics from Elasticsearch. Note that we’re running Telegraf in each pod we want to collect metrics from as a sidecar deployment, for example, Telegraf runs in the same pod as the containers it monitors. Telegraf uses the Elasticsearch input plugin to obtain metrics. For simplicity, the diagram doesn’t show the input plugins. The injection of the Telegraf sidecar container is done by the Telegraf Operator. Prometheus pulls metrics from Telegraf and sends them to Sumo Logic Distribution for OpenTelemetry Collector which enriches metadata and sends metrics to Sumo Logic.
In the logs pipeline, Sumo Logic Distribution for OpenTelemetry Collector collects logs written to standard out and forwards them to another instance of Sumo Logic Distribution for OpenTelemetry Collector, which enriches metadata and sends logs to Sumo Logic.
Follow the below instructions to set up the logs and metric collection:
It’s assumed that you are using the latest helm chart version. If not, upgrade using the instructions here.
Configure Logs Collection
This section explains the steps to collect Elasticsearch logs from a Kubernetes environment.
-
(Recommended Method) Add labels on your Elasticsearch pods to capture logs from standard output on Kubernetes.
- Apply the following labels to the Elasticsearch pods:
environment = "dev_CHANGE_ME"
component = "database"
db_system = "elasticsearch"
db_cluster = "elasticsearch_on_k8s_CHANGE_ME"
db_cluster_address = `ENV_TO_BE_CHANGED`
db_cluster_port = `ENV_TO_BE_CHANGED`- Enter in values for the following parameters (marked
ENV_TO_BE_CHANGEDabove):
environment. This is the deployment environment where the Elasticsearch cluster identified by the value of servers resides. For example, dev, prod, or QA. While this value is optional we highly recommend setting it.db_cluster. Enter a name to identify this Elasticsearch cluster. This cluster name will be shown in the Sumo Logic dashboards.db_cluster_address- Enter the cluster hostname or ip address that is used by the application to connect to the database. It could also be the load balancer or proxy endpoint.db_cluster_port- Enter the database port. If not provided, a default port will be used.
notedb_cluster_addressanddb_cluster_portshould reflect the exact configuration of DB client configuration in your application, especially if you instrument it with OT tracing. The values of these fields should match exactly the connection string used by the database client (reported as values fornet.peer.nameandnet.peer.portmetadata fields). For example, if your application uses “elasticsearch-prod.sumologic.com:3306” as the connection string, the field values should be set as follows:db_cluster_address=elasticsearch-prod.sumologic.com db_cluster_port=3306. If your application connects directly to a given elasticsearch node, rather than the whole cluster, use the application connection string to override the value of the “host” field in the Telegraf configuration:host=elasticsearch-prod.sumologic.com. Pivoting to Tracing data from Entity Inspector is possible only for “Elasticsearch address” Entities.- Do not modify the following values as they will cause the Sumo Logic apps to not function correctly.
component: “database”- This value is used by Sumo Logic apps to identify application components.db_system: “elasticsearch”- This value identifies the database system.
- See this doc for more parameters that can be configured in the Telegraf agent globally.
- The Sumologic-Kubernetes-Collection will automatically capture the logs from stdout and will send the logs to Sumologic. For more information on deploying Sumologic-Kubernetes-Collection, visit here.
- Verify logs in Sumo Logic.
-
(Optional) Collecting Elasticsearch Logs from a Log File. Follow the steps below to capture Elasticsearch logs from a log file on Kubernetes.
- Determine the location of the Elasticsearch log file on Kubernetes. This can be determined from the log4j.properties for your Elasticsearch cluster along with the mounts on the Elasticsearch pods.
- Install the Sumo Logic tailing sidecar operator.
- Add the following annotation in addition to the existing annotations.
annotations:
   tailing-sidecar: sidecarconfig;<mount>:<path_of_Elasticsearch_log_file>/<Elasticsearch_log_file_name>
Example:
annotations:
tailing-sidecar: sidecarconfig;data:/usr/share/elasticsearch/logs/gc.log- Make sure that the Elasticsearch pods are running and annotations are applied by using the command:
kubectl describe pod <Elasticsearch_pod_name>- Sumo Logic Kubernetes collection will automatically start collecting logs from the pods having the annotations defined above.
- Verify logs in Sumo Logic.
-
Add a FER to normalize the fields in Kubernetes environments. This step is not needed if using application components solution terraform script. Labels created in Kubernetes environments automatically are prefixed with
pod_labels. To normalize these for our app to work, we need to create a Field Extraction Rule if not already created for Database Application Components. To do so:- New UI. In the main Sumo Logic menu select Data Management, and then under Logs select Field Extraction Rules. You can also click the Go To... menu at the top of the screen and select Field Extraction Rules.
Classic UI. In the main Sumo Logic menu, select Manage Data > Logs > Field Extraction Rules. - Click the + Add button on the top right of the table.
- The Add Field Extraction Rule form will appear:
- Enter the following options:
- Rule Name. Enter the name as App Observability - Database.
- Applied At. Choose Ingest Time
- Scope. Select Specific Data
- Scope: Enter the following keyword search expression:
pod_labels_environment=* pod_labels_component=database pod_labels_db_system=* pod_labels_db_cluster=*- Parse Expression.Enter the following parse expression:
if (!isEmpty(pod_labels_environment), pod_labels_environment, "") as environment
    | pod_labels_component as component
    | pod_labels_db_system as db_system
| if (!isEmpty(pod_labels_db_cluster), pod_labels_db_cluster, null) as db_cluster- Click Save to create the rule.
- New UI. In the main Sumo Logic menu select Data Management, and then under Logs select Field Extraction Rules. You can also click the Go To... menu at the top of the screen and select Field Extraction Rules.
Configure Metrics Collection
This section explains the steps to collect Elasticsearch metrics from a Kubernetes environment, where we use the Telegraf Operator, which is packaged with our Kubernetes collection. You can learn more about this here. Follow the steps listed below to collect metrics from a Kubernetes environment:
- Set up Kubernetes Collection with the Telegraf Operator.
- On your Elasticsearch Pods, add the following annotations:
 annotations:
    telegraf.influxdata.com/class: sumologic-prometheus
    prometheus.io/scrape: "true"
    prometheus.io/port: "9273"
    telegraf.influxdata.com/inputs: |+

  servers = ["http://<USER_CHANGE_ME>:<PASS_CHANGE_ME>@localhost:9200"]
  http_timeout = "5s"
  local = true
  cluster_health = true
  cluster_stats = true
  cluster_stats_only_from_master = false
  indices_include = ["_all"]
  indices_level = "cluster"
  [inputs.elasticsearch.tags]
    environment = "ENV_TO_BE_CHANGED"
    component = "database"
    db_system = "elasticsearch"
    db_cluster = "ENV_TO_BE_CHANGED"
    db_cluster_address = `ENV_TO_BE_CHANGED`
    db_cluster_port = `ENV_TO_BE_CHANGED`
- Enter in values for the following parameters (marked ENV_TO_BE_CHANGED above):
-
telegraf.influxdata.com/inputs. This contains the required configuration for the Telegraf Elasticsearch Input plugin. Please refer to this doc for more information on configuring the Elasticsearch input plugin for Telegraf. Note: As telegraf will be run as a sidecar the host should always be localhost. -
In the input plugins section, that is
[[inputs.elasticsearch]]:servers- The URL to the Elasticsearch server. This can be a comma-separated list to connect to multiple Elasticsearch servers. Please see this doc for more information on additional parameters for configuring the Elasticsearch input plugin for Telegraf.
-
In the tags section, which is
[inputs.elasticsearch]environment. This is the deployment environment where the Elasticsearch cluster identified by the value of servers resides. For example dev, prod, or QA. While this value is optional we highly recommend setting it.db_cluster. Enter a name to identify this Elasticsearch cluster. This cluster name will be shown in the Sumo Logic dashboards.db_cluster_address- Enter the cluster hostname or ip address that is used by the application to connect to the database. It could also be the load balancer or proxy endpoint.db_cluster_port- Enter the database port. If not provided, a default port will be used.
notedb_cluster_addressanddb_cluster_portshould reflect exact configuration of DB client configuration in your application, especially if you instrument it with OT tracing. The values of these fields should match exactly the connection string used by the database client (reported as values for net.peer.name and net.peer.port metadata fields).For example, if your application uses “elasticsearch-prod.sumologic.com:3306” as the connection string, the field values should be set as follows:
db_cluster_address=elasticsearch-prod.sumologic.com db_cluster_port=3306If your application connects directly to a given elasticsearch node, rather than the whole cluster, use the application connection string to override the value of the
“host”field in the Telegraf configuration:host=elasticsearch-prod.sumologic.comPivoting to Tracing data from Entity Inspector is possible only for “Elasticsearch address” Entities.
-
Do not modify the following values as it will cause the Sumo Logic app to not function correctly.
telegraf.influxdata.com/class: sumologic-prometheus. This instructs the Telegraf operator what output to use. This should not be changed.prometheus.io/scrape: "true". This ensures our Prometheus will scrape the metrics.prometheus.io/port: "9273". This tells prometheus what ports to scrape on. This should not be changed.telegraf.influxdata.com/inputs- In the tags section
[inputs.elasticsearch.tags]component: “database”- This value is used by Sumo Logic apps to identify application components.db_system: “elasticsearch”- This value identifies the database system.
- See this doc for more parameters that can be configured in the Telegraf agent globally.
-
- Sumo Logic Kubernetes collection will automatically start collecting metrics from the pods having the labels and annotations defined in the previous step.
- Verify metrics in Sumo Logic.
For non-Kubernetes environments, we use the Telegraf operator for Elasticsearch metric collection and Sumo Logic Installed Collector for collecting Elasticsearch logs. The diagram below illustrates the components of the Elasticsearch collection in a non-Kubernetes environment. Telegraf runs on the same system as Elasticsearch to obtain Elasticsearch metrics. The Sumo Logic output plugin to send the metrics to Sumo Logic. Logs from Elasticsearch on the other hand are sent to a Sumo Logic Local File source.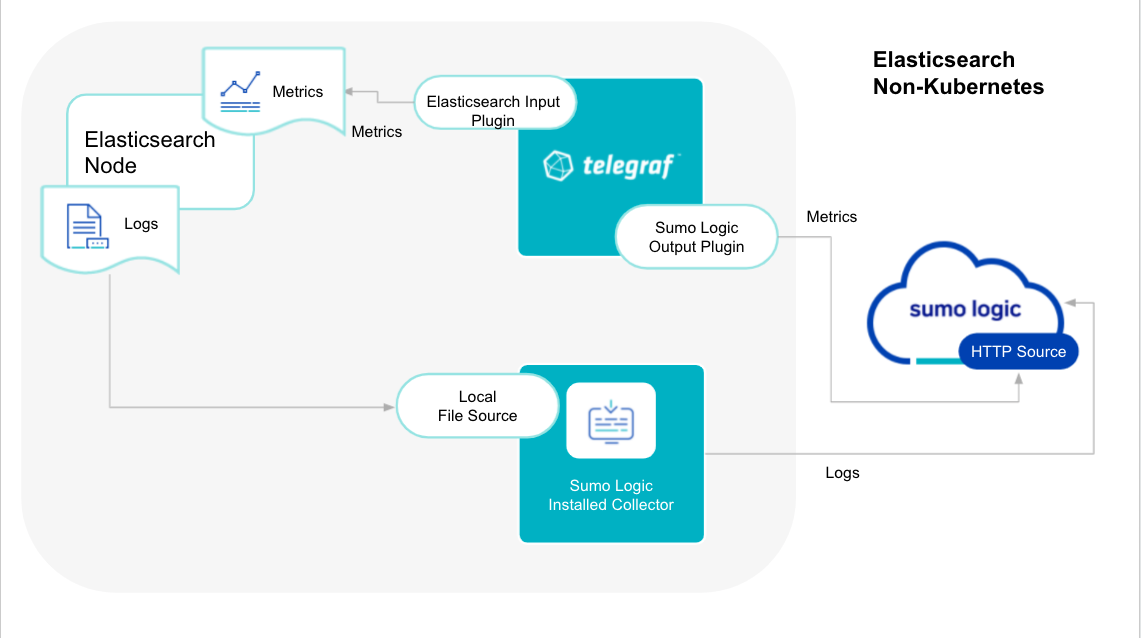
This section provides instructions for configuring logs and metrics collection for the Sumo Logic app for Elasticsearch.
Configure Metrics Collection
- Configure a Hosted Collector. To create a new Sumo Logic hosted collector, perform the steps in theCreate a Hosted Collector section of the Sumo Logic documentation.
- Configure an HTTP Logs and Metrics Source. Create a new HTTP Logs and Metrics Source in the hosted collector created above by following these instructions. . Make a note of the HTTP Source URL.
- Install Telegraf. Use the following steps to install Telegraf.
- Configure and start Telegraf. As part of collecting metrics data from Telegraf, we will use the elasticsearch input plugin to get data from Telegraf and the Sumo Logic output plugin to send data to Sumo Logic. Create or modify telegraf.conf and copy and paste the text below:
[[inputs.elasticsearch]]
  servers = ["http://<USER_CHANGE_ME>:<PASS_CHANGE_ME>@localhost:9200"]
  http_timeout = "5s"
  local = true
  cluster_health = true
  cluster_stats = true
  cluster_stats_only_from_master = true
  indices_include = ["_all"]
  indices_level = "cluster"
  node_stats = ["indices", "os", "process", "jvm", "thread_pool", "fs", "transport", "http"]
  [inputs.elasticsearch.tags]
    environment ="ENV_TO_BE_CHANGED"
    component ="database"
    db_system ="elasticsearch"
    db_cluster ="ENV_TO_BE_CHANGED"
    db_cluster_address = `ENV_TO_BE_CHANGED`
    db_cluster_port = `ENV_TO_BE_CHANGED`
[[outputs.sumologic]]
  url = "<URL Created in Step 3_CHANGEME>"
  data_format = "prometheus"
- Please enter values for the following parameters (marked
ENV_TO_BE_CHANGEDabove):
- In the input plugins section, that is
[[inputs.elasticsearch]]:-
servers- The URL to the elasticsearch server. Please see this doc for more information on additional parameters for configuring the Elasticsearch input plugin for Telegraf. -
In the tags section (
[inputs.Elasticsearch.tags]):environment. This is the deployment environment where the Elasticsearch cluster identified by the value of servers resides. For example dev, prod, or QA. While this value is optional we highly recommend setting it.db_cluster. Enter a name to identify this Elasticsearch cluster. This cluster name will be shown in the Sumo Logic dashboards.db_cluster_address- Enter the cluster hostname or ip address that is used by the application to connect to the database. It could also be the load balancer or proxy endpoint.db_cluster_port- Enter the database port. If not provided, a default port will be used.
notedb_cluster_addressanddb_cluster_portshould reflect exact configuration of DB client configuration in your application, especially if you instrument it with OT tracing. The values of these fields should match exactly the connection string used by the database client (reported as values fornet.peer.nameandnet.peer.portmetadata fields).For example, if your application uses “elasticsearch-prod.sumologic.com:3306” as the connection string, the field values should be set as follows:
db_cluster_address=elasticsearch-prod.sumologic.com db_cluster_port=3306.If your application connects directly to a given elasticsearch node, rather than the whole cluster, use the application connection string to override the value of the “host” field in the Telegraf configuration:
host=elasticsearch-prod.sumologic.com.Pivoting to Tracing data from Entity Inspector is possible only for “Elasticsearch address” Entities.
-
In the output plugins section (
[[outputs.sumologic]]):url- This is the HTTP source URL created in step 3. Please see this doc for more information on additional parameters for configuring the Sumo Logic Telegraf output plugin.
-
- Here’s an explanation for additional values set by this Telegraf configuration. If you haven’t defined a cluster in Elasticsearch, then enter
defaultfordb_cluster. There are additional values set by the Telegraf configuration, which we recommend not to modify these values as they might cause the Sumo Logic app to not function correctly.data_format - “prometheus”In the output plugins section ([[outputs.sumologic]]), metrics are sent in the Prometheus format to Sumo Logiccomponent: “database”- In the input plugins section ([[inputs.Elasticsearch]]), this value is used by Sumo Logic apps to identify application components.- See this doc for more parameters that can be configured in the Telegraf agent globally.
- After you've finalized your telegraf.conf file, you can start or reload the telegraf service using instructions from the doc.
At this point, Elasticsearch metrics should start flowing into Sumo Logic.
Configure Logs Collection
This section provides instructions for configuring log collection for Sumo Logic app for Elasticsearch, running on a non-Kubernetes environment. By default, Elasticsearch logs are stored in a log file. Local log files can be collected via Installed collectors. The installed collector will require you to allow outbound traffic to Sumo Logic endpoints for collection to work. For detailed requirements for Installed collectors, see this page.
- Configure logging in Elasticsearch. Elasticsearch supports logging via local text log files. Elasticsearch logs have four levels of verbosity. To select a level, set loglevel to one of:
debug: a lot of information, useful for development/testingverbose: includes information not often needed, but logs less than debugnotice(default value): moderately verbose, ideal for production environmentswarning: only very important/critical messages are logged
All logging settings are located in Elasticsearch.conf. By default, Elasticsearch logs are stored in /var/log/elasticsearch/ELK-<Clustername>.log. The default directory for log files is listed in the Elasticsearch.conf file. Logs from the Elasticsearch log file can be collected via a Sumo Logic Installed collector and a Local File Source as explained in the next section.
2. Configure an Installed Collector. To collect logs directly from the Elasticsearch machine, configure an Installed Collector and a Local File Source.
3. Configure a Local File Source, editing the fields as follows:
-
Name. (Required)
-
Description. (Optional)
-
File Path (Required). Enter the path to your error.log or access.log. The files are typically located in
/var/log/elasticsearch/elasticsearch-<clustername>.log. If you're using a customized path, check the Elasticsearch.conf file for this information. -
Source Host. Sumo Logic uses the hostname assigned by the OS unless you enter a different hostname
-
Source Category. Enter any string to tag the output collected from this Source, such as elasticsearch/Logs. (The Source Category metadata field is a fundamental building block to organize and label Sources. For details, see Best Practices.)
-
Fields. Set the following fields:
component = databasedb_system = elasticsearchdb_cluster = <Your_Elasticsearch_Cluster_Name>environment = <Environment_Name>, such as Dev, QA or Prod.db_cluster_address- Enter the cluster hostname or ip address that is used by the application to connect to the database. It could also be the load balancer or proxy endpoint.db_cluster_port- Enter the database port. If not provided, a default port will be used
notedb_cluster_addressanddb_cluster_portshould reflect exact configuration of DB client configuration in your application, especially if you instrument it with OT tracing. The values of these fields should match exactly the connection string used by the database client (reported as values fornet.peer.nameandnet.peer.portmetadata fields).For example, if your application uses “elasticsearch-prod.sumologic.com:3306” as the connection string, the field values should be set as follows:
db_cluster_address=elasticsearch-prod.sumologic.com db_cluster_port=3306If your application connects directly to a given elasticsearch node, rather than the whole cluster, use the application connection string to override the value of the “host” field in the Telegraf configuration:
host=elasticsearch-prod.sumologic.comPivoting to Tracing data from Entity Inspector is possible only for “Elasticsearch address” Entities.
- Configure the Advanced section:
- Enable Timestamp Parsing. Select Extract timestamp information from log file entries.
- Time Zone. Choose the option, Ignore time zone from the log file and instead use, and then select your Elasticsearch Server’s time zone.
- Timestamp Format. The timestamp format is automatically detected.
- Encoding. Select UTF-8 (Default).
- Enable Multiline Processing. Detect messages spanning multiple lines
- Infer Boundaries - Detect message boundaries automatically
- Click Save.
At this point, Elasticsearch logs should start flowing into Sumo Logic.
Installing the Elasticsearch app
To install the app, do the following:
Next-Gen App: To install or update the app, you must be an account administrator or a user with Manage Apps, Manage Monitors, Manage Fields, Manage Metric Rules, and Manage Collectors capabilities depending upon the different content types part of the app.
- Select App Catalog.
- In the 🔎 Search Apps field, run a search for your desired app, then select it.
- Click Install App.
note
Sometimes this button says Add Integration.
- Click Next in the Setup Data section.
- In the Configure section of your respective app, complete the following fields.
- Is K8S deployment involved. Specify if resources being monitored are partially or fully deployed on Kubernetes (K8s)
- Click Next. You will be redirected to the Preview & Done section.
Post-installation
Once your app is installed, it will appear in your Installed Apps folder, and dashboard panels will start to fill automatically.
Each panel slowly fills with data matching the time range query received since the panel was created. Results will not immediately be available but will be updated with full graphs and charts over time.
As part of the app installation process, the following fields will be created by default:
componentenvironmentdb_systemdb_clusterpoddb_cluster_addressdb_cluster_port
Additionally, if you're using Elasticsearch in the Kubernetes environment, the following additional fields will be created by default during the app installation process:
pod_labels_componentpod_labels_environmentpod_labels_db_systempod_labels_db_clusterpod_labels_db_cluster_addresspod_labels_db_cluster_port
For information on setting up fields, see Fields.
Viewing Elasticsearch dashboards
All dashboards have a set of filters that you can apply to the entire dashboard. Use these filters to drill down and examine the data to a granular level.
- You can change the time range for a dashboard or panel by selecting a predefined interval from a drop-down list, choosing a recently used time range, or specifying custom dates and times. Learn more.
- You can use template variables to drill down and examine the data on a granular level. For more information, see Filtering Dashboards with Template Variables.
- Most Next-Gen apps allow you to provide the scope at the installation time and are comprised of a key (
_sourceCategoryby default) and a default value for this key. Based on your input, the app dashboards will be parameterized with a dashboard variable, allowing you to change the dataset queried by all panels. This eliminates the need to create multiple copies of the same dashboard with different queries.
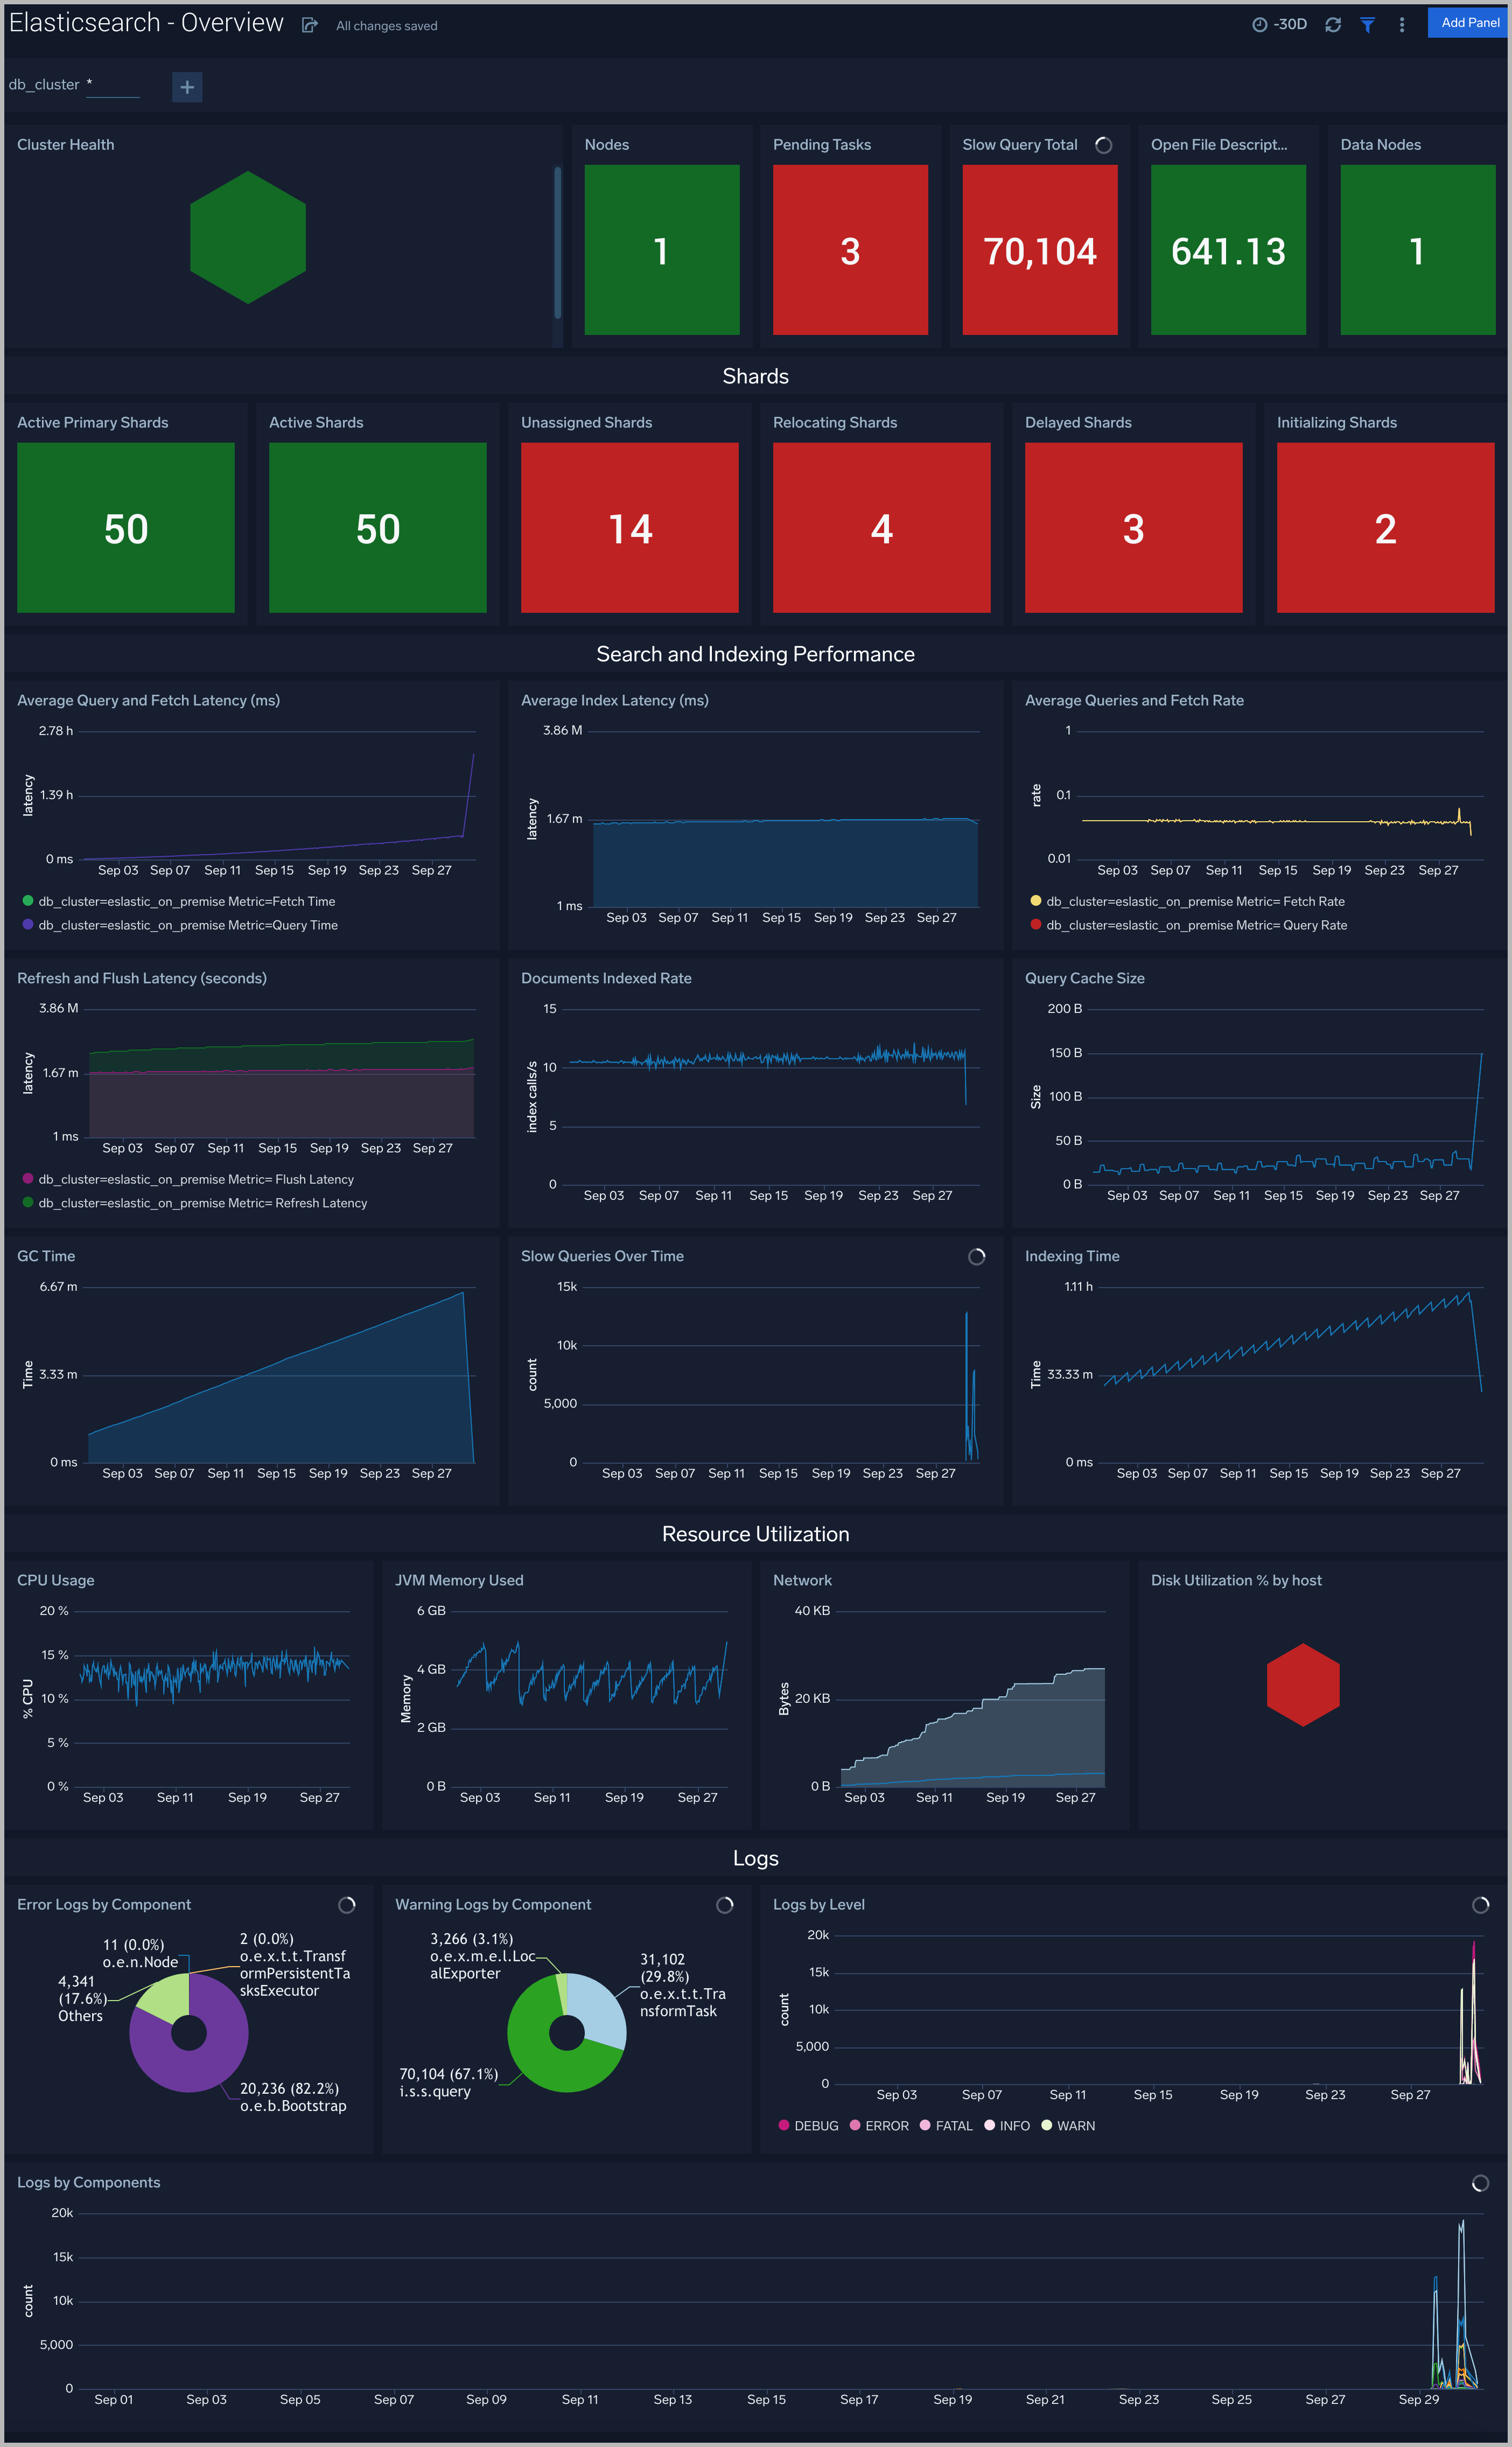
Overview
The Elasticsearch - Overview dashboard provides the health of Elasticsearch clusters, shards analysis, resource utilization of Elasticsearch host & clusters, search and indexing performance.
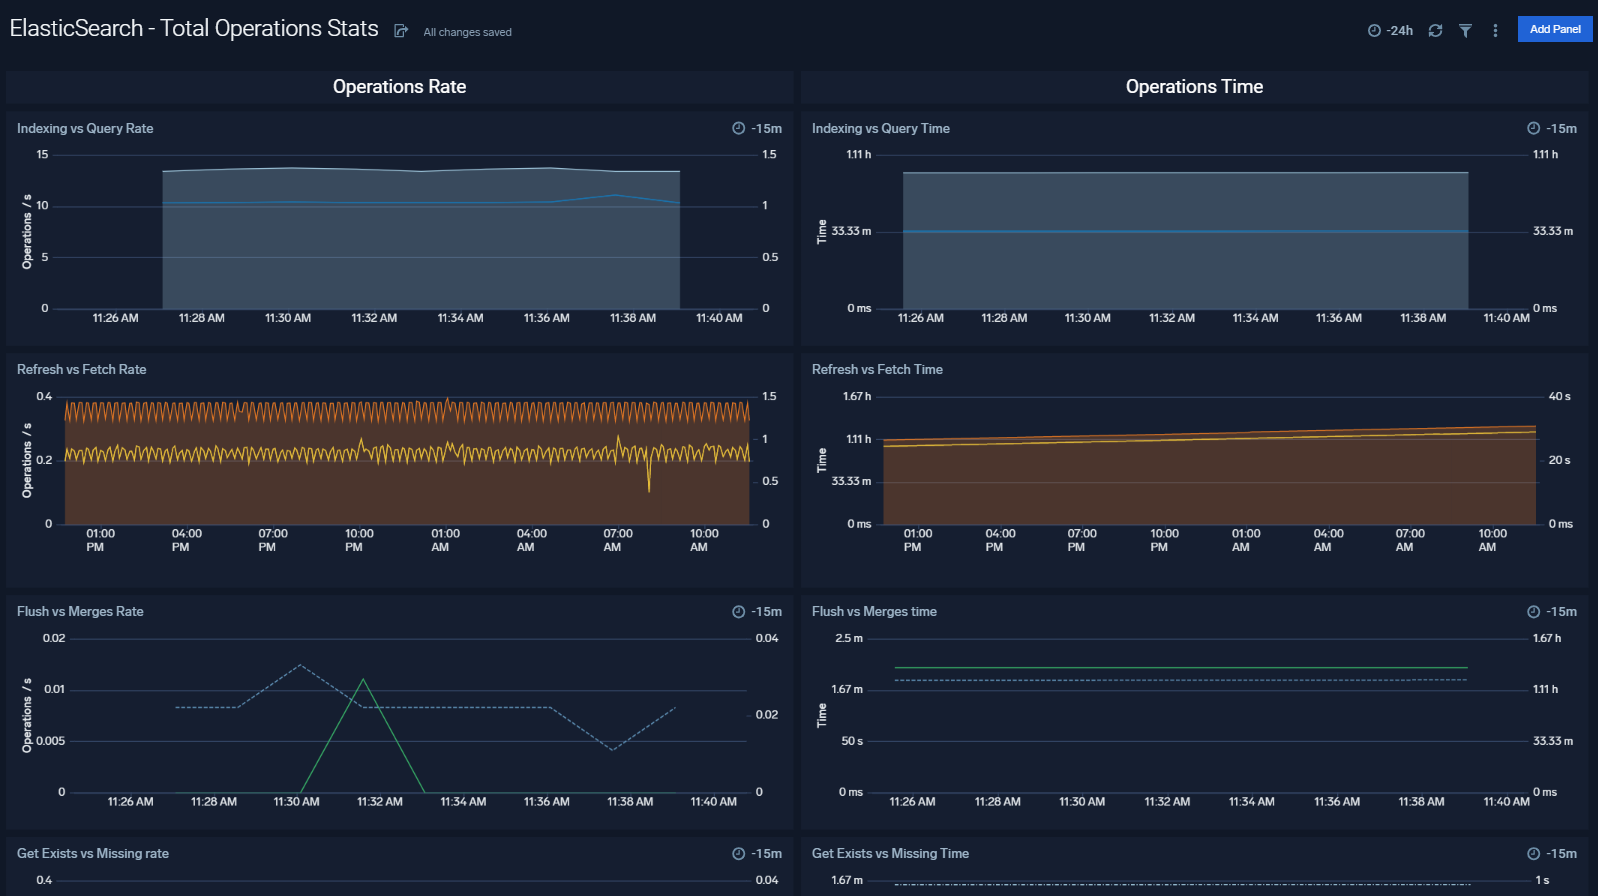
Total Operations Stats
The Elasticsearch - Total Operations Stats dashboard provides information on the operations of the Elasticsearch system.
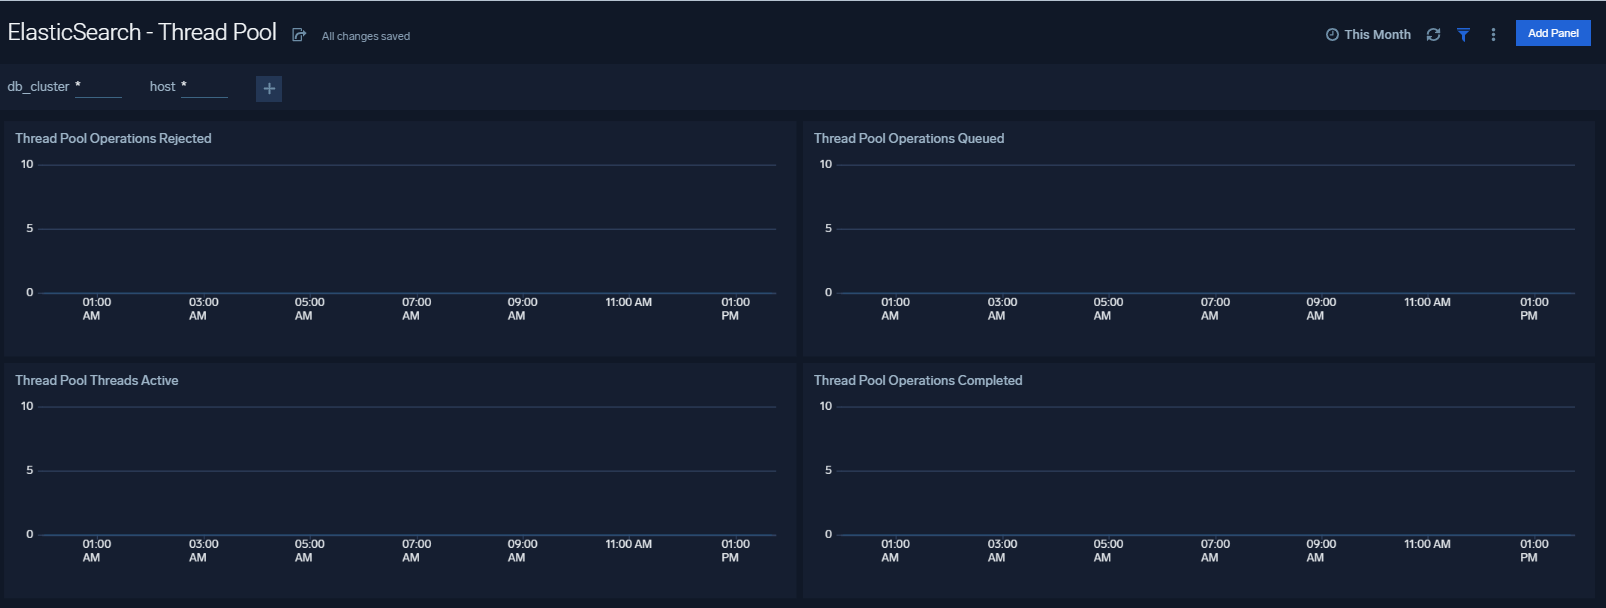
Thread Pool
The Elasticsearch- Thread Pool dashboard analyzes thread pools operations to manage memory consumption of nodes in the cluster.
Resource
The Elasticsearch - Resource dashboard monitors JVM Memory, Network, Disk, Network and CPU of Elasticsearch node.

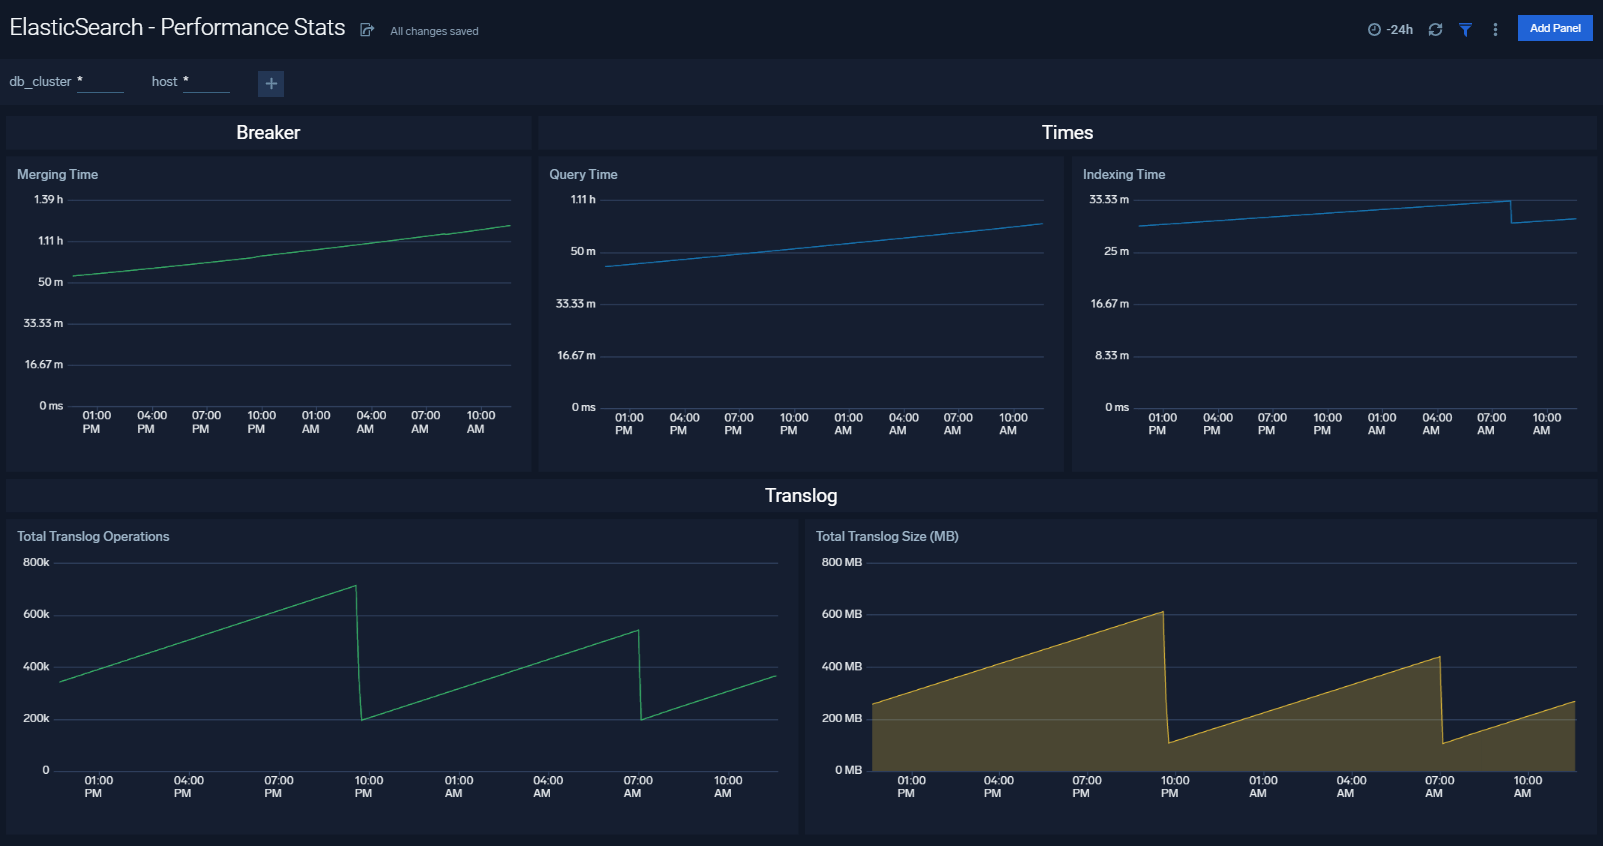
Performance Stats
The Elasticsearch - Performance Stats dashboard performance statistics such as latency and Translog operations and size.
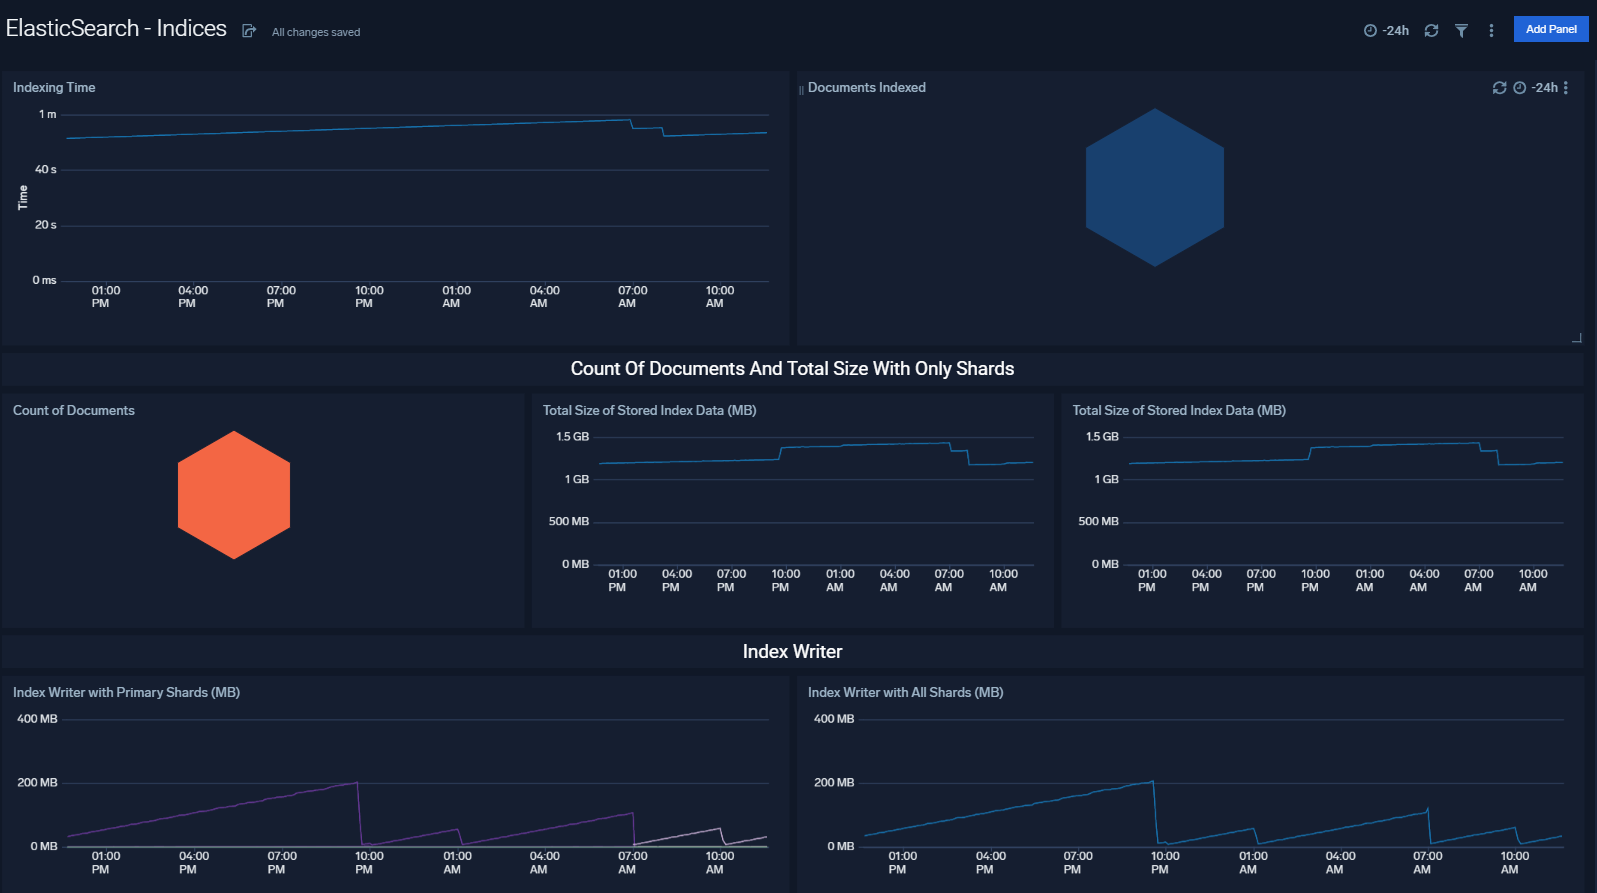
Indices
The Elasticsearch - Indices dashboard monitors Index operations, size and latency. It also provides analytics on doc values, fields, fixed bitsets, and terms memory.
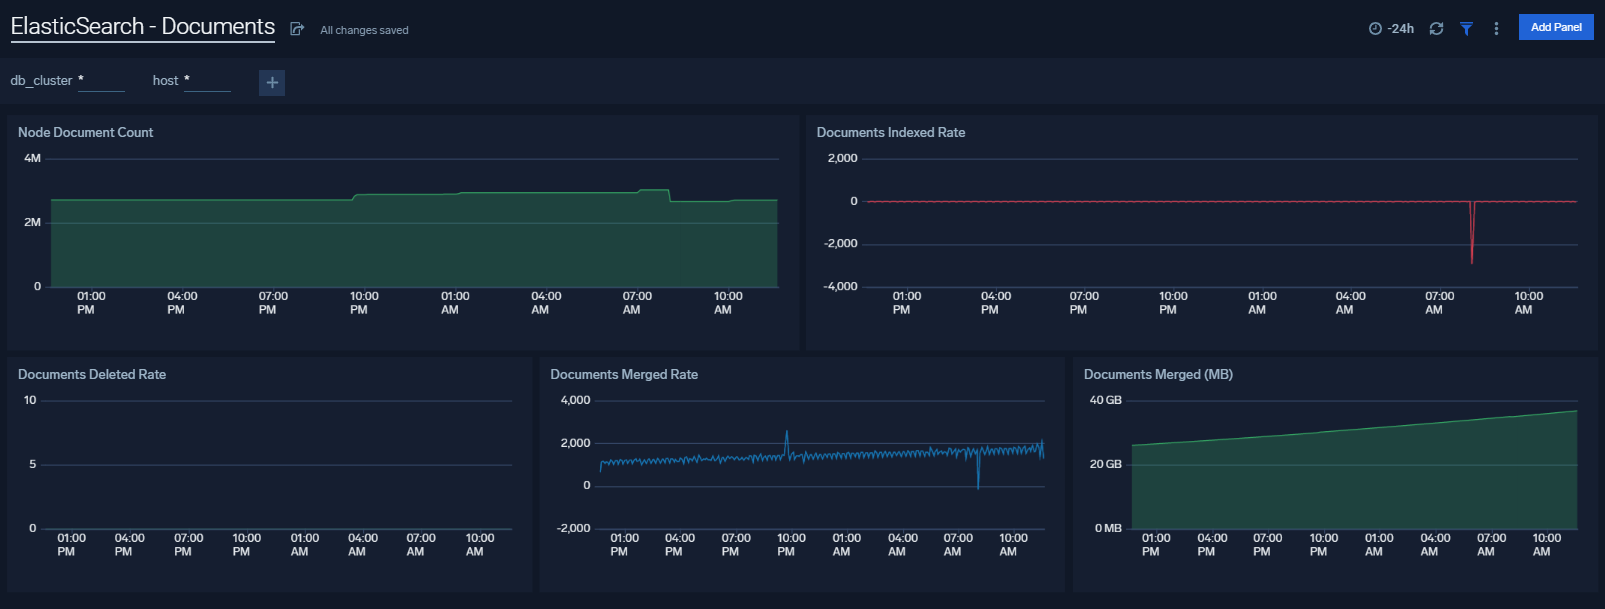
Documents
The Elasticsearch - Documents dashboard provides analytics and monitoring on Elasticsearch documents.
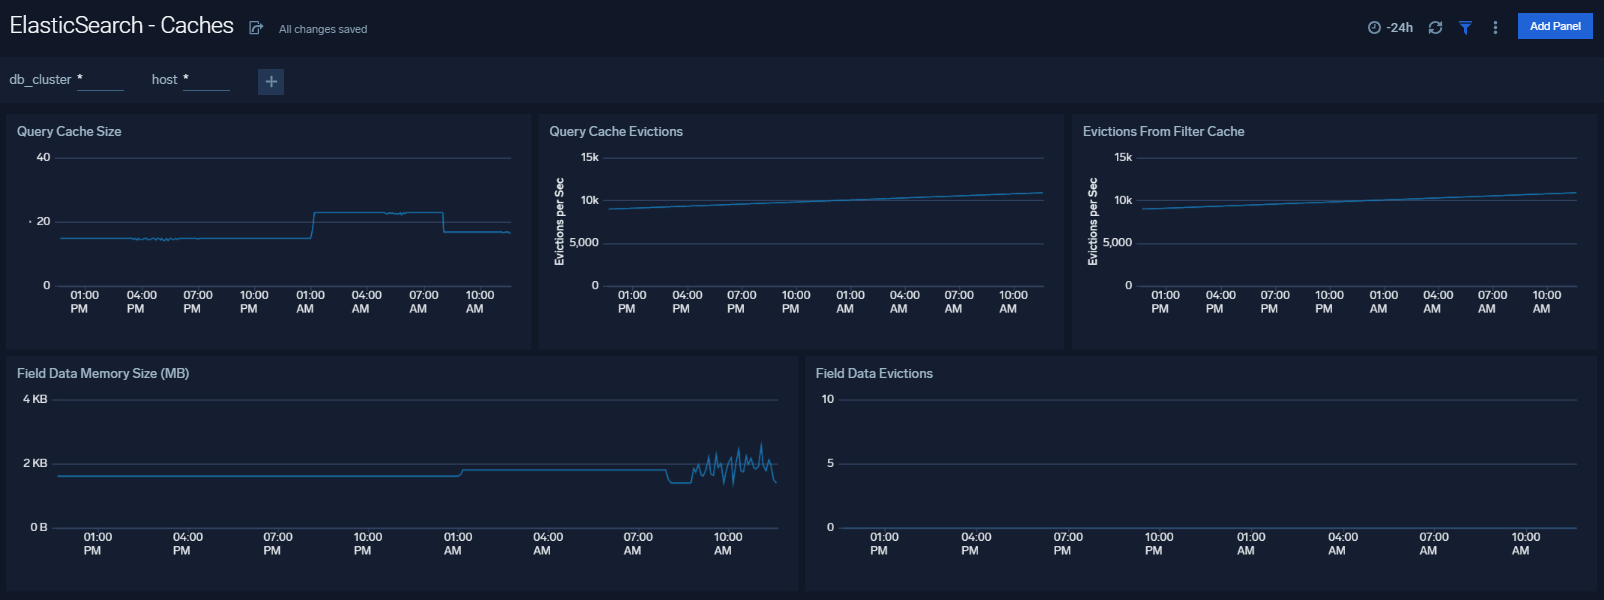
Caches
The Elasticsearch - Caches dashboard allows you to monitor query cache size, evictions and field data memory size.
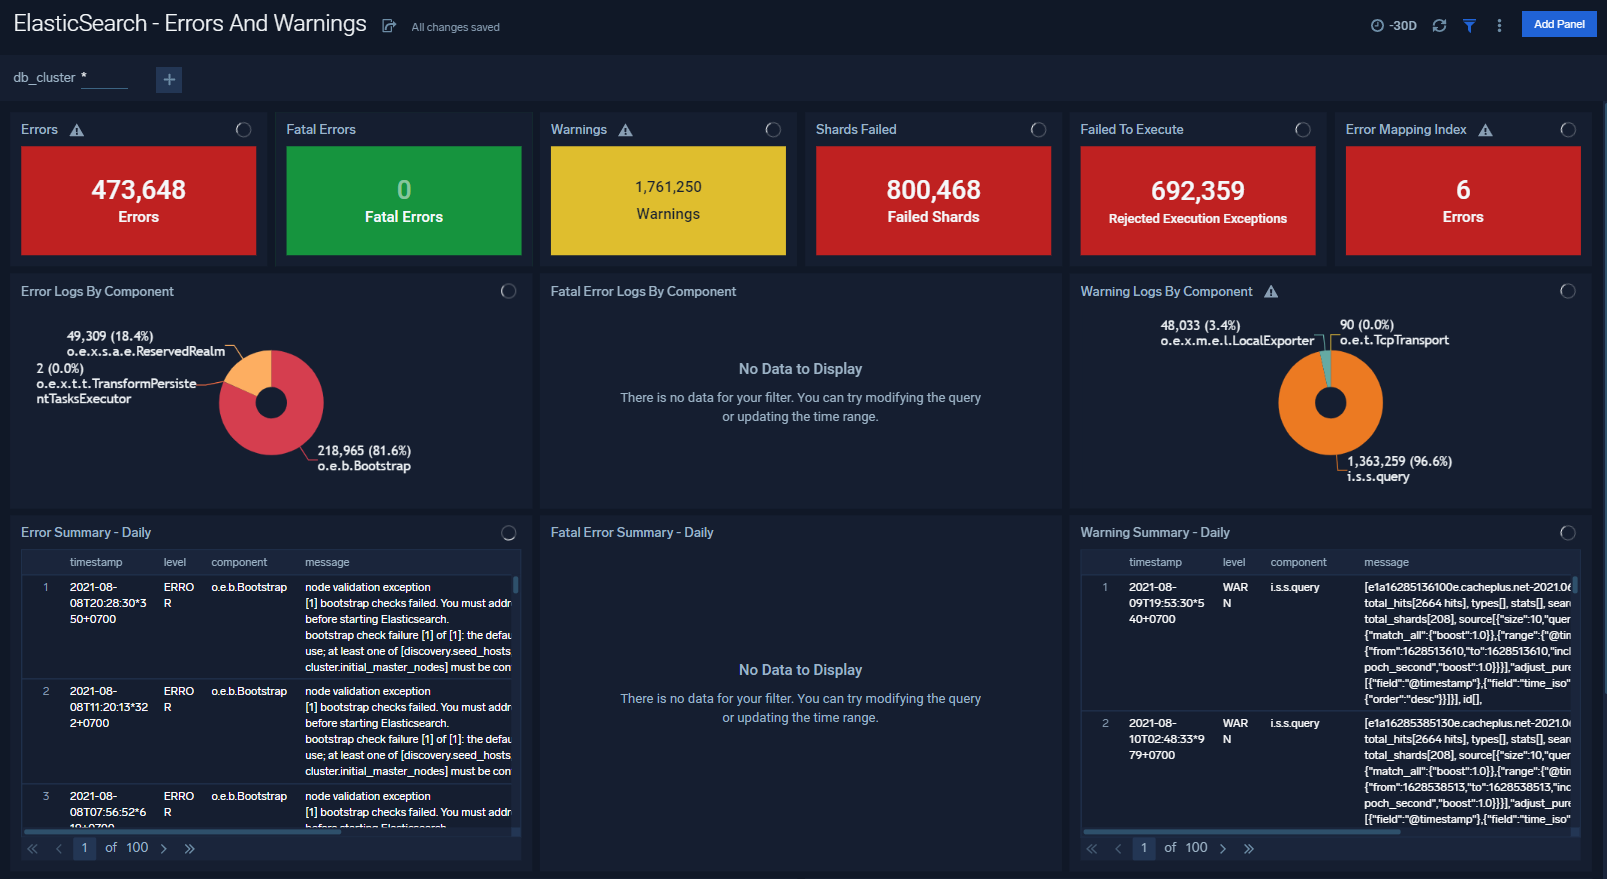
Errors And Warnings
The ElasticSearch - Errors And Warnings dashboard shows errors and warnings by Elasticsearch components.
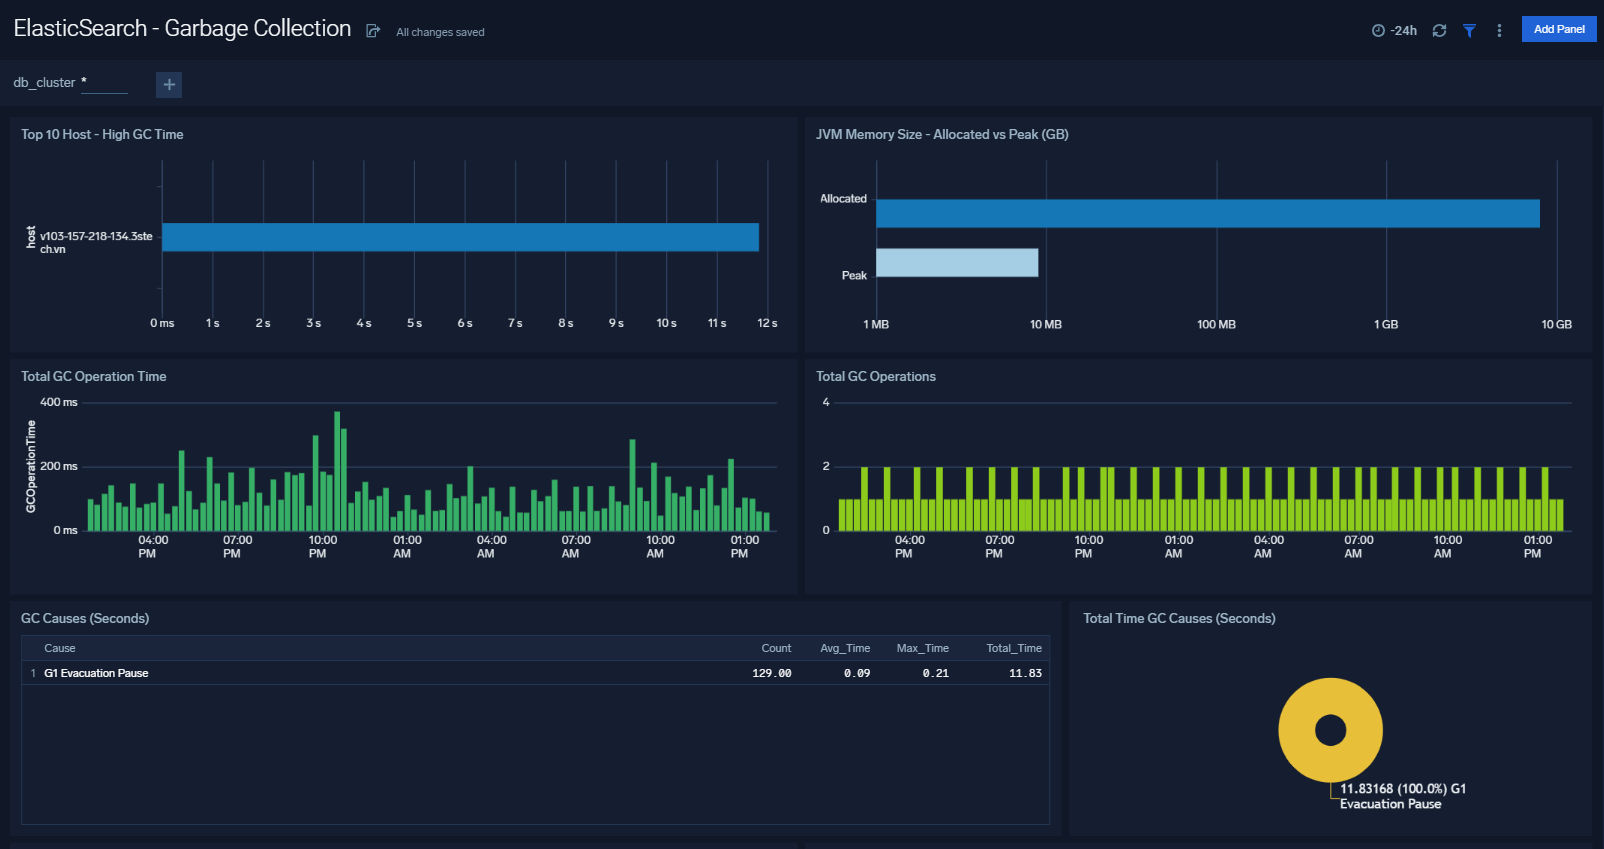
Garbage Collection
The Elasticsearch - Garbage Collection dashboard provides information on the garbage collection of the Java Virtual Machine.
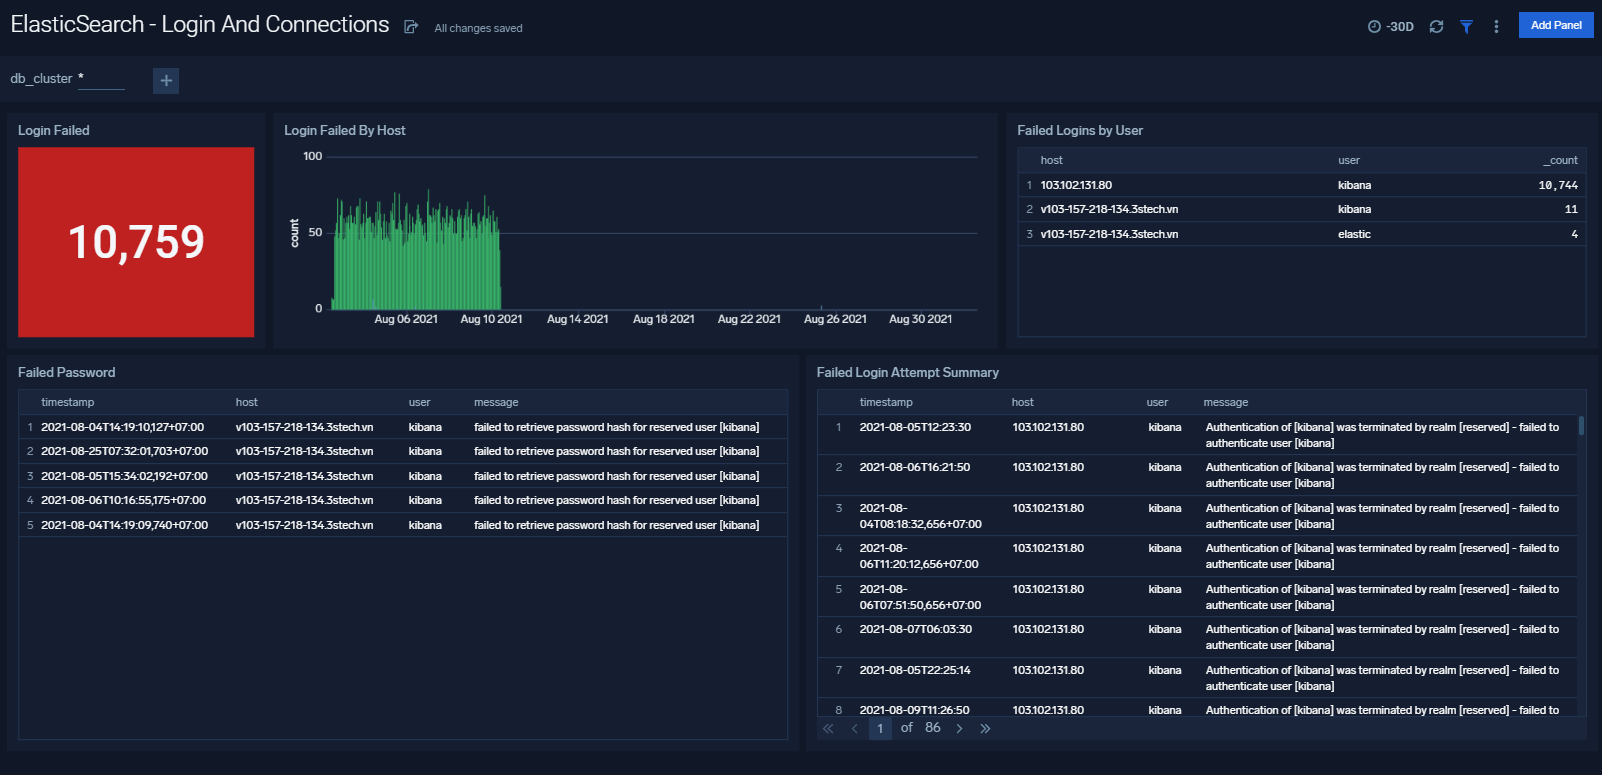
Login And Connections
The ElasticSearch - Login And Connections dashboard shows geo location of client connection requests, failed connection logins and count of failed login attempts.
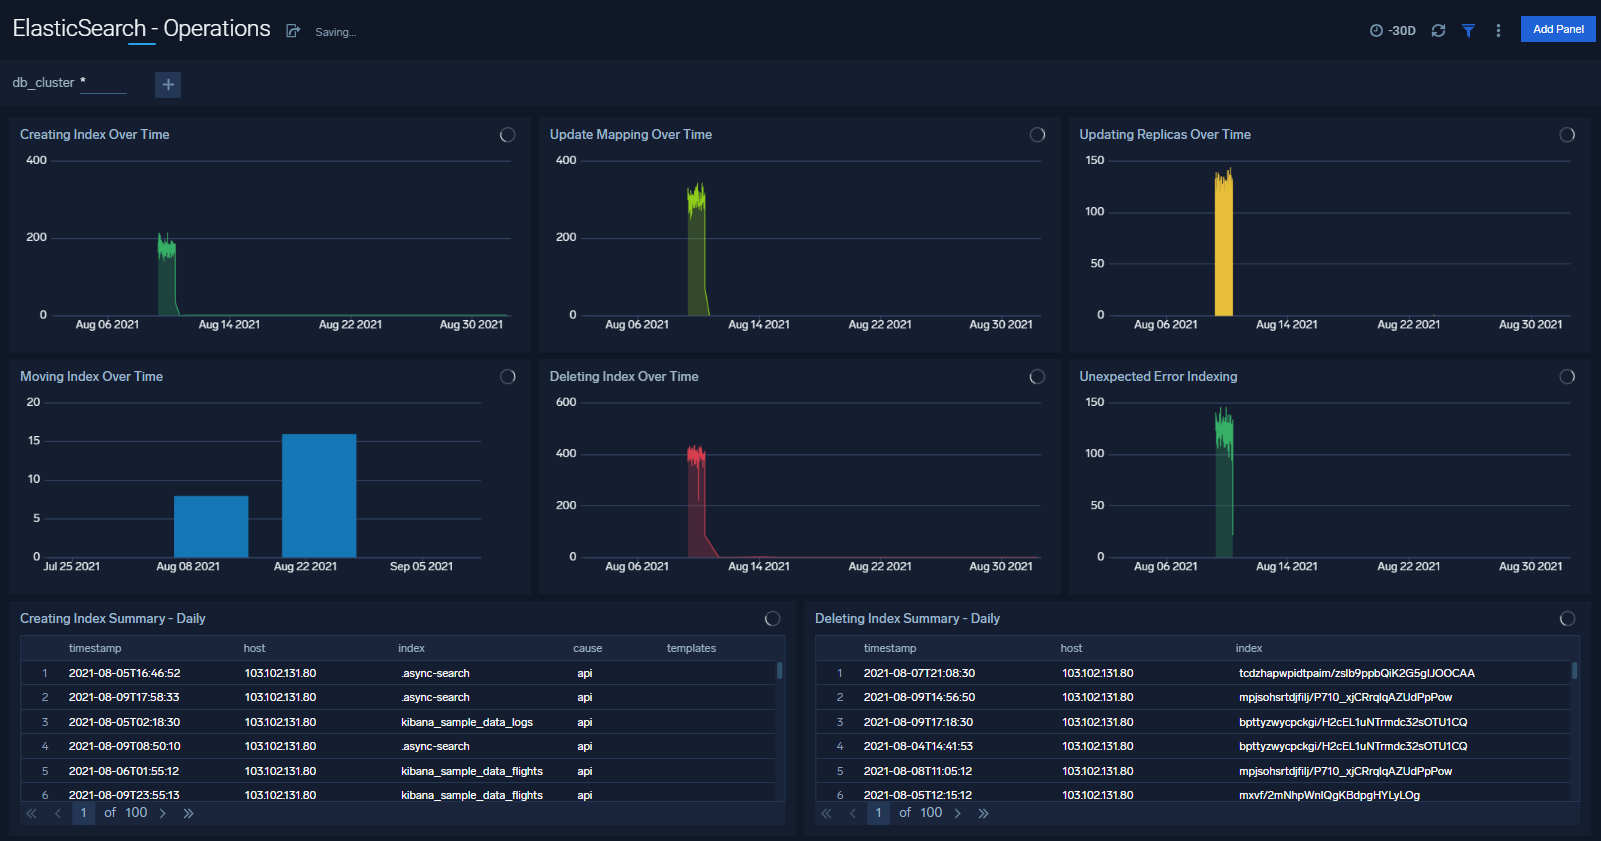
Operations
The Elasticsearch - Operations dashboard allows you to monitor server stats and events such as node up/down, index creation/deletion. It also provides disk usage and cluster health status.
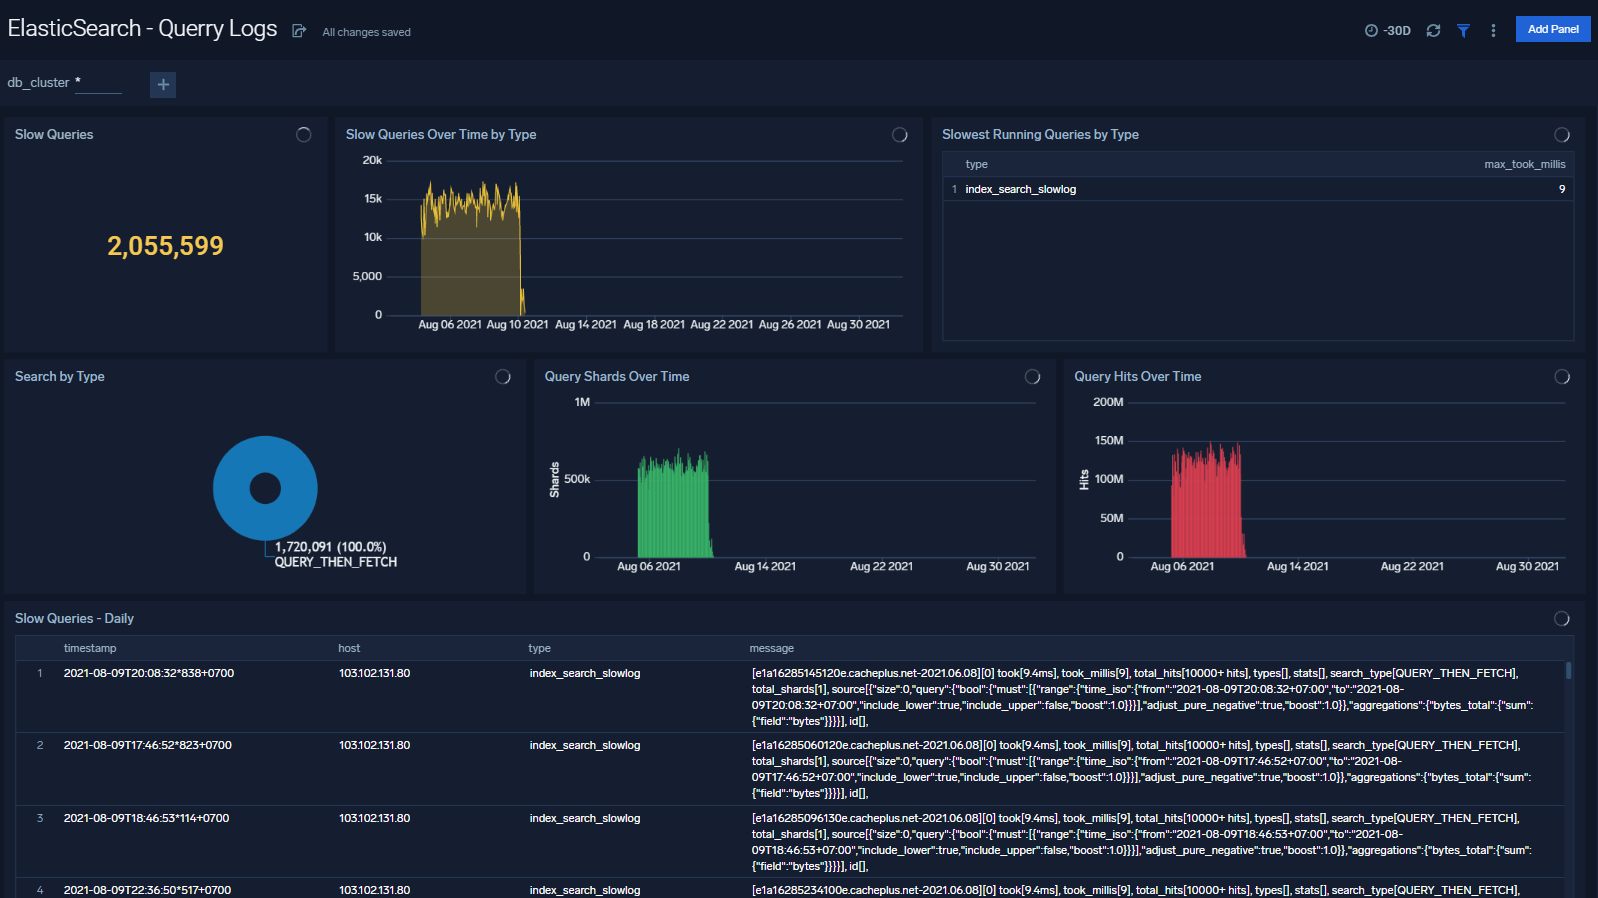
Queries
The ElasticSearch - Queries dashboard shows Elasticsearch provides analytics on slow queries, and query shards.
Create monitors for Elasticsearch app
From your App Catalog:
- From the Sumo Logic navigation, select App Catalog.
- In the Search Apps field, search for and then select your app.
- Make sure the app is installed.
- Navigate to What's Included tab and scroll down to the Monitors section.
- Click Create next to the pre-configured monitors. In the create monitors window, adjust the trigger conditions and notifications settings based on your requirements.
- Scroll down to Monitor Details.
- Under Location click on New Folder.
note
By default, monitor will be saved in the root folder. So to make the maintenance easier, create a new folder in the location of your choice.
- Enter Folder Name. Folder Description is optional.
tip
Using app version in the folder name will be helpful to determine the versioning for future updates.
- Click Create. Once the folder is created, click on Save.
Elasticsearch Alerts
| Alert Type (Metrics/Logs) | Alert Name | Alert Description | Trigger Type (Critical / Warning) | Alert Condition | Recover Condition |
|---|---|---|---|---|---|
| Metrics | Elasticsearch - Cluster Red | This alert fires when Elasticsearch Cluster status is RED | Critical | >=3 | <3 |
| Metrics | Elasticsearch - Cluster Yellow | This alert fires when Elasticsearch Cluster status is YELLOW | Warning | >=2 | <2 |
| Metrics | Elasticsearch - Disk Out of Space | This alert fires when the disk usage is over 90% | Critical | >90 | < =90 |
| Metrics | Elasticsearch - Disk Space Low | This alert fires when the disk usage is over 80% | Warning | >80 | < = 80 |
| Metrics | Elasticsearch - Healthy Data Nodes | This alert fires when there missing data node in Elasticsearch cluster | Critical | <3 | >=3 |
| Metrics | Elasticsearch - Healthy Nodes | This alert fires when there is missing node in Elasticsearch cluster | Critical | <3 | >=3 |
| Metrics | Elasticsearch - Heap Usage Too High | This alert fires when the heap usage is over 90% | Critical | >90 | < =90 |
| Metrics | Elasticsearch - Heap Usage Warning | This alert fires when the heap usage is over 80% | Warning | >80 | < =80 |
| Metrics | Elasticsearch - Initializing Shards Too Long | This alert fires when elasticsearch has been initializing shards for 5 min | Warning | >0 | < =0 |
| Metrics | Elasticsearch - Pending Tasks | This alert fires when elasticsearch has pending tasks. | Warning | >0 | < =0 |
| Metrics | Elasticsearch - Relocating Shards Too Long | This alert fires when elasticsearch has been relocating shards for 5min | Warning | >0 | < =0 |
| Metrics | Elasticsearch - Unassigned Shards | This alert fires when Elasticsearch has unassigned shards | Critical | >0 | < =0 |
| Logs | Elasticsearch - Query Time Too Slow | This alert fires when queries are slow to execute | Critical | >0 | < =0 |
| Logs | Elasticsearch - Query Time Slow | This alert fires when query time is greater than 5 ms | Warning | >0 | < =0 |
| Logs | Elasticsearch - Too Many Slow Query | This alert fires when there aret oo Many Slow Query in 5 minutes | Warning | >100 | < =100 |
| Logs | Elasticsearch - Error Log Too Many | Error Log Too Many | Critical | >1000 | < =1000 |