MariaDB - Classic Collector
The MariaDB app is a unified logs and metrics app that helps you monitor MariaDB database cluster availability, performance, and resource utilization. Pre-configured dashboards and searches provide insight into the health of your database clusters, performance metrics, resource metrics, schema metrics, replication, error logs, slow queries, Innodb operations, failed logins, and error logs.
This app is tested with the following MariaDB versions:
- Kubernetes: MariaDB - Version 10.5.11
- Non-Kubernetes: MariaDB - Version 10.7.1
Collecting logs and metrics for the MariaDB app
Configuring log and metric collection for the MariaDB app includes the following tasks.
Configure Collection
Sumo Logic supports the collection of logs and metrics data from MariaDB in both Kubernetes and non-Kubernetes environments. Click on the appropriate links below based on the environment where your MariaDB clusters are hosted.
- Kubernetes environments
- Non-Kubernetes environments
In Kubernetes environments, we use the Telegraf Operator, which is packaged with our Kubernetes collection. You can learn more about it here. The diagram below illustrates how data is collected from MariaDB in Kubernetes environments. In the architecture shown below, there are four services that make up the metric collection pipeline: Telegraf, Telegraf Operator, Prometheus, and Sumo Logic Distribution for OpenTelemetry Collector.
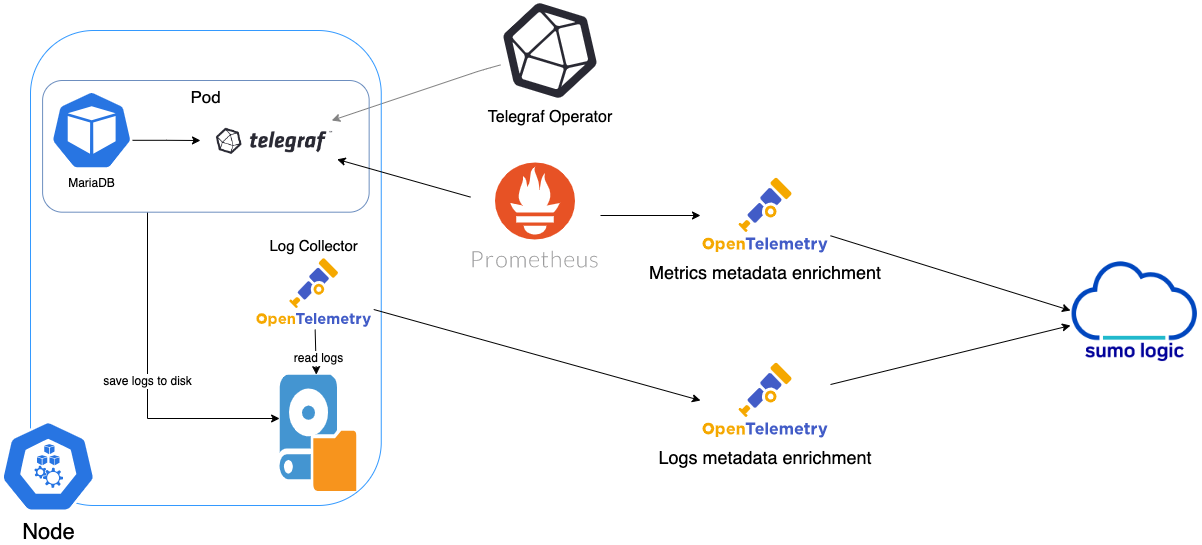
The first service in the metrics pipeline is Telegraf. Telegraf collects metrics from MariaDB. Note that we’re running Telegraf in each pod we want to collect metrics from as a sidecar deployment, that is Telegraf runs in the same pod as the containers it monitors. Telegraf uses the MySQL Input Plugin to obtain metrics. (For simplicity, the diagram doesn’t show the input plugins.) The injection of the Telegraf sidecar container is done by the Telegraf Operator.
Prometheus pulls metrics from Telegraf and sends them to Sumo Logic Distribution for OpenTelemetry Collector which enriches metadata and sends metrics to Sumo Logic.
In the logs pipeline, Sumo Logic Distribution for OpenTelemetry Collector collects logs written to standard out and forwards them to another instance of Sumo Logic Distribution for OpenTelemetry Collector, which enriches metadata and sends logs to Sumo Logic.
These instructions assume that you are using the latest Helm chart version. If not, upgrade using the instructions here.
Configure Metrics Collection
This section explains the steps to collect MariaDB metrics from a Kubernetes environment.
- Set up Kubernetes Collection with the Telegraf Operator
- On your MariaDB Pods, add the following annotations:
annotations:
    telegraf.influxdata.com/class: sumologic-prometheus
    prometheus.io/scrape: "true"
    prometheus.io/port: "9273"
    telegraf.influxdata.com/inputs: |+
[[inputs.mysql]]
  servers = ["user_TO_BE_CHANGED:password_TO_BE_CHANGED@tcp(IP_ADDRESS_MARIADB_TO_BE_CHANGED:PORT_MARIADB_TO_BE_CHANGED)/?tls=false"]
  metric_version = 2
  table_schema_databases = []
  perf_summary_events = []
  gather_table_schema = true
  gather_process_list = true
  gather_info_schema_auto_inc = true
  gather_user_statistics = true
  gather_slave_status = true
  gather_table_io_waits = true
  gather_table_lock_waits = true
  gather_index_io_waits = true
  gather_event_waits = true
  gather_file_events_stats = true
  gather_perf_events_statements = true
  interval_slow = "30m"
  [inputs.mysql.tags]
    environment ="ENV_TO_BE_CHANGED"
    component ="database"
    db_system ="mariadb"
    db_cluster ="ENV_TO_BE_CHANGED"
    db_cluster_address = "ENV_TO_BE_CHANGED"
    db_cluster_port = "ENV_TO_BE_CHANGED" --Enter `default` if you haven’t defined a cluster in MariaDB
- Enter in values for the following parameters (marked
ENV_TO_BE_CHANGEDin the snippet above):
-
telegraf.influxdata.com/inputs. This contains the required configuration for the Telegraf exec Input plugin. Please refer to this doc for more information on configuring the MySQL input plugin for Telegraf. Note: As telegraf will be run as a sidecar, the host should always be localhost. -
In the input plugins section, that is:
servers- The URL of your MariaDB server. For information about additional input plugin configuration options, see the Readme for the MySQL input plugin.
-
In the tags section (
[inputs.mysql.tags]):environment. This is the deployment environment where the MariaDB cluster identified by the value of servers resides. For example: dev, prod or qa. While this value is optional we highly recommend setting it.db_cluster. Enter a name to identify this MariaDB cluster. This cluster name will be shown in the Sumo Logic dashboards.db_cluster_address. Enter the cluster hostname or ip address that is used by the application to connect to the database. It could also be the load balancer or proxy endpoint.db_cluster_port. Enter the database port. If not provided, a default port will be used.
notedb_cluster_addressanddb_cluster_portshould reflect exact configuration of DB client configuration in your application, especially if you instrument it with OT tracing. The values of these fields should match exactly the connection string used by the database client (reported as values for net.peer.name and net.peer.port metadata fields).For example, if your application uses
“mariadb-prod.sumologic.com:3306”as the connection string, the field values should be set as follows:db_cluster_address=mariadb-prod.sumologic.com db_cluster_port=3306.If your application connects directly to a given sqlserver node, rather than the whole cluster, use the application connection string to override the value of the “host” field in the Telegraf configuration:
host=mariadb-prod.sumologic.comPivoting to Tracing data from Entity Inspector is possible only for “MariaDB address” Entities.
-
Do not modify the following values as it will cause the Sumo Logic app to not function correctly.
telegraf.influxdata.com/class: sumologic-prometheus. This instructs the Telegraf operator what output to use. This should not be changed.prometheus.io/scrape: "true". This ensures our Prometheus will scrape the metrics.prometheus.io/port: "9273". This tells prometheus what ports to scrape on. This should not be changed.telegraf.influxdata.com/inputs- In the tags section (
[inputs.mysql.tags]):component: “database”- This value is used by Sumo Logic apps to identify application components.db_system: “mariadb”- This value identifies the database system.
- See this doc for more parameters that can be configured in the Telegraf agent globally.
- Sumo Logic Kubernetes collection will automatically start collecting metrics from the pods having the labels and annotations defined in the previous step.
- Verify metrics in Sumo Logic.
Configure Logs Collection
This section explains the steps to collect MariaDB logs from a Kubernetes environment.
- (Recommended Method) Add labels on your MariaDB pods to capture logs from standard output. Make sure that the logs from MariaDB are sent to stdout. Follow the instructions below to capture MariaDB logs from stdout on Kubernetes.
- Apply following labels to the MariaDB pod:
environment: "prod_ENV_TO_BE_CHANGED"
component: "database"
db_system: "mariadb"
db_cluster "Cluster_ENV_TO_BE_CHANGED"
db_cluster_address = "ENV_TO_BE_CHANGED"
db_cluster_port = "ENV_TO_BE_CHANGED"- Enter in values for the following parameters (marked in "
ENV_TO_BE_CHANGED" above):
environment. This is the deployment environment where the MariaDB cluster identified by the value ofserversresides. For example: dev, prod, or QA. While this value is optional, we highly recommend setting it.db_cluster. Enter a name to identify this MariaDB cluster. This cluster name will be shown in the Sumo Logic dashboards. If you haven’t defined a cluster in MariaDB, then enterdefaultfor db_cluster.- Do not modify the following values as it will cause the Sumo Logic apps to not function correctly.
component: “database”- This value is used by Sumo Logic apps to identify application components.db_system: “mariadb”- This value identifies the database system.
- See this doc for more parameters that can be configured in the Telegraf agent globally.
- The Sumologic-Kubernetes-Collection will automatically capture the logs from stdout and will send the logs to Sumologic. For more information on deploying Sumologic-Kubernetes-Collection, visit here.
- Verify logs in Sumo Logic.
- (Optional) Collecting MariaDB Logs from a Log File. Follow the steps below to capture MariaDB logs from a log file on Kubernetes.
- Determine the location of the MariaDB log file on Kubernetes. This can be determined from the server.conf for your MariaDB cluster along with the mounts on the MariaDB pods.
- Install the Sumo Logic tailing sidecar operator.
- Add the following annotation in addition to the existing annotations.
Example:annotations:
tailing-sidecar: sidecarconfig;<mount>:<path_of_MariaDB_log_file>/<MariaDB_log_file_name>annotations:
tailing-sidecar: sidecarconfig;data:/var/opt/MariaDB/errorlog- Make sure that the MariaDB pods are running and annotations are applied by using the command:
kubectl describe pod <MariaDB_pod_name>- Sumo Logic Kubernetes collection will automatically start collecting logs from the pods having the annotations defined above.
- Verify logs in Sumo Logic.
FER to normalize the fields in Kubernetes environments. Labels created in Kubernetes environments automatically are prefixed with pod_labels. To normalize these for our app to work, a Field Extraction Rule named AppObservabilityMariaDBDatabaseFER is automatically created for Database Application Components.
For non-Kubernetes environments, Sumo Logic uses the Telegraf operator for MariaDB metric collection and the Installed Collector for collecting MariaDB logs. The diagram below illustrates the components of the MariaDB collection in a non-Kubernetes environment.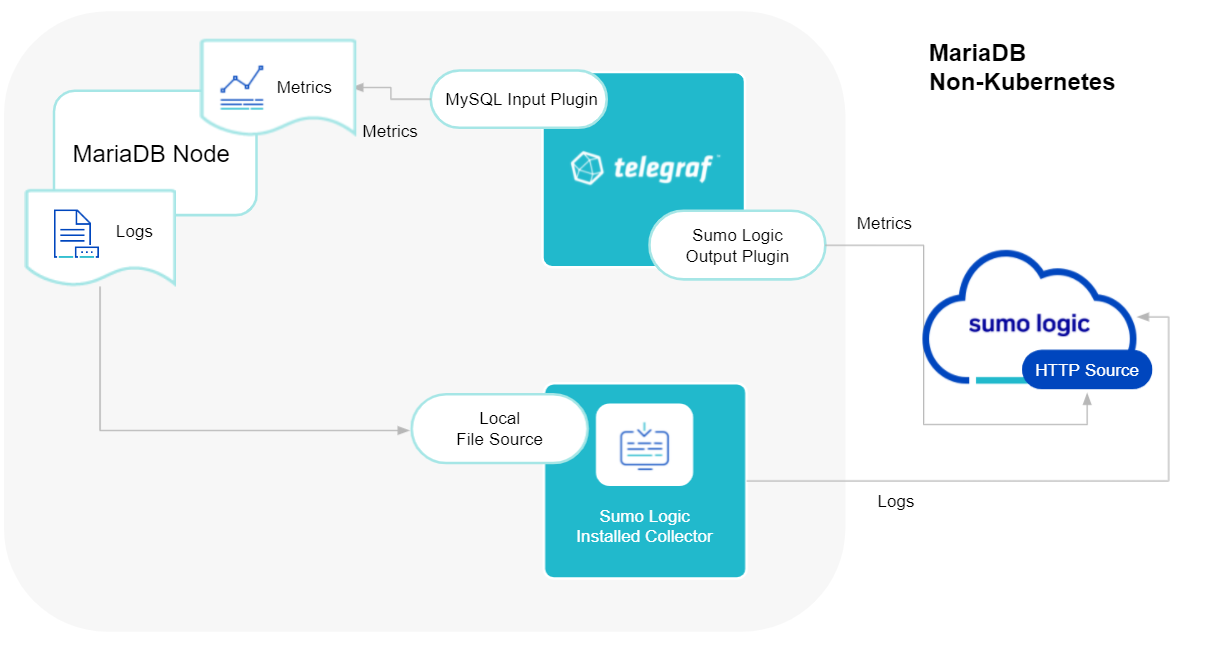
Telegraf uses the MySQL Input Plugin to obtain MariaDB metrics and the Sumo Logic output plugin to send the metrics to Sumo Logic. Logs from MariaDB are collected by a Local File Source.
The process to set up collection for MariaDB data is done through the following steps.
Configure Logs Collection
This section provides instructions for configuring log collection for MariaDB running on a non-Kubernetes environment for the Sumo Logic app for MariaDB. By default, MariaDB logs are stored in a log file. MariaDB also supports forwarding logs via Syslog Audit Logs.
Sumo Logic supports collecting logs both via Syslog and a local log file. Utilizing Sumo Logic Cloud Syslog will require TCP TLS Port 6514 to be open in your network. Local log files can be collected via Installed collectors or FluentD. Installed collector will require you to allow outbound traffic to Sumo Logic endpoints for collection to work. To view more requirements, see Installed Collector requirements.
Based on your infrastructure and networking setup, choose one of these methods to collect MariaDB logs and follow the instructions below to set up log collection: MariaDB logs written to a log file can be collected via the Local File Source of a Sumo Logic Installed Collector. To collect logs directly from the MariaDB machine, configure an Installed Collector. This section demonstrates how to configure sources for Error Logs and Slow Query Logs. This section demonstrates how to configure a Local File Source for MariaDB Error Logs, for use with an Installed Collector. You may configure a Remote File Source, but the configuration is more complex. Sumo Logic recommends using a Local File Source whenever possible. On the Collection Management screen, click Add, next to the collector, then select Add Source. Select Local File as the source type. Configure the Local File Source fields as follows: If you set Collection should begin to a collection time that overlaps with data that was previously ingested on a source, it may result in duplicated data to be ingested into Sumo Logic. For example, if your application uses If your application connects directly to a given sqlserver node, rather than the whole cluster, use the application connection string to override the value of the “host” field in the Telegraf configuration: Pivoting to Tracing data from Entity Inspector is possible only for “MariaDB address” Entities. In the Advanced section, select the following options: Click Save. After a few minutes, your new Source should be propagated down to the Collector and will begin submitting your MariaDB log files to the Sumo Logic service. This section demonstrates how to configure a Local File Source for MariaDB Slow Query Logs, for use with an Installed Collector. After a few minutes, your new Source should be propagated down to the Collector and will begin submitting your MariaDB log files to the Sumo Logic service.Method A: Configure MariaDB to log to a local file.
[mariadb] section:[mariadb]
log_error=/var/log/mariadb/mariadb-error.log
log_output=FILE
slow_query_log=1
slow_query_log_file = /var/log/mariadb/slow_query.log
long_query_time=2
systemctl restart mariadbMethod B: Configure a Sumo Logic Collector
Method C: Configure a Source
Configure Source for MariaDB Error Logs
component = databasedb_system = mariadbdb_cluster = <Your_MariaDB_Cluster_Name>. Enter Default if you do not have one.environment = <Your_Environment_Name> (for example, Dev, QA, or Prod)db_cluster_address. Enter the cluster hostname or ip address that is used by the application to connect to the database. It could also be the load balancer or proxy endpoint.db_cluster_port. Enter the database port. If not provided, a default port will be used.db_cluster_address and db_cluster_port should reflect exact configuration of DB client configuration in your application, especially if you instrument it with OT tracing. The values of these fields should match exactly the connection string used by the database client (reported as values for net.peer.name and net.peer.port metadata fields).“mariadb-prod.sumologic.com:3306” as the connection string, the field values should be set as follows: db_cluster_address=mariadb-prod.sumologic.com db_cluster_port=3306.host=mariadb-prod.sumologic.com.
Configure Source for MariaDB Slow Query Logs
component = databasedb_system = mariadbdb_cluster = <Your_mariadb_Cluster_Name>. Enter Default if you do not have one.environment = <Your_Environment_Name> (for example, Dev, QA, or Prod)
^#\sTime:\s.
Configure Metrics Collection
- Set up a Sumo Logic HTTP Source.
- Configure a Hosted Collector for Metrics. To create a new Sumo Logic hosted collector, perform the steps in the Configure a Hosted Collector documentation.
- Configure an HTTP Logs & Metrics source. On the created Hosted Collector on the Collection Management screen, select Add Source.
- Select HTTP Logs & Metrics.
- Name. (Required). Enter a name for the source.
- Description. (Optional).
- Source Category. (Recommended). Be sure to follow the Best Practices for Source Categories. A recommended Source Category may be Prod/DB/MariaDB/Metrics.
- Select Save.
- Note the URL provided once you click Save. You can retrieve it again by selecting the Show URL next to the source on the Collection Management screen.
- Select HTTP Logs & Metrics.
- Set up Telegraf.
- Install Telegraf, if you haven’t already, using the following steps to install Telegraf.
- Configure and start Telegraf to begin collecting metrics data from Telegraf. We will use the MySQL Input Plugin to get data from Telegraf and the Sumo Logic output plugin to send data to Sumo Logic. Create or modify
telegraf.confand copy and paste the text below:
[[inputs.mysql]]
 servers = ["user_TO_BE_CHANGED:password_TO_BE_CHANGED@tcp(IP_ADDRESS_MARIADB_TO_BE_CHANGED:PORT_MARIADB_TO_BE_CHANGED)/?tls=false"]
 metric_version = 2
 table_schema_databases = []
 perf_summary_events = []
 gather_table_schema = true
 gather_process_list = true
 gather_info_schema_auto_inc = true
 gather_user_statistics = true
 gather_slave_status = true
 gather_table_io_waits = true
 gather_table_lock_waits = true
 gather_index_io_waits = true
 gather_event_waits = true
 gather_file_events_stats = true
 gather_perf_events_statements = true
 interval_slow = "30m"
 [inputs.mysql.tags]
   environment ="dev_ENV_TO_BE_CHANGED"
   component ="database"
   db_system ="mariadb"
   db_cluster ="mariadb_on_premise_ENV_TO_BE_CHANGED"
   db_cluster_address = "ENV_TO_BE_CHANGED"
   db_cluster_port = "ENV_TO_BE_CHANGED"
[[outputs.sumologic]]
  url = "<URL_from_HTTP_Logs_and_Metrics_Source>"
data_format = "prometheus"- Enter values for fields marked
ENV_TO_BE_CHANGEDabove to the appropriate values. Do not include the brackets (< >) in your own configuration.
-
Input plugins section, which is
[[inputs.mysql]]:servers. The the URL of your MariaDB server. For information about additional input plugin configuration options, see the Readme for the MySQL input plugin.
-
In the tags section,
[inputs.mysql.tags]:environment. This is the deployment environment where the MariaDB cluster identified by the value of servers resides. For example; dev, prod, or QA. While this value is optional we highly recommend setting it.db_cluster. Enter a name to identify this MariaDB cluster. This cluster name will be shown in our dashboards.db_cluster_address- Enter the cluster hostname or ip address that is used by the application to connect to the database. It could also be the load balancer or proxy endpoint.db_cluster_port- Enter the database port. If not provided, a default port will be used.
notedb_cluster_addressanddb_cluster_portshould reflect the exact configuration of DB client configuration in your application, especially if you instrument it with OT tracing. The values of these fields should match exactly the connection string used by the database client (reported as values fornet.peer.nameandnet.peer.portmetadata fields).For example, if your application uses
“mariadb-prod.sumologic.com:3306”as the connection string, the field values should be set as follows:db_cluster_address=mariadb-prod.sumologic.com db_cluster_port=3306If your application connects directly to a given sqlserver node, rather than the whole cluster, use the application connection string to override the value of the “host” field in the Telegraf configuration:
host=mariadb-prod.sumologic.comPivoting to Tracing data from Entity Inspector is possible only for “MariaDB address” Entities.
-
In the output plugins section,
[[outputs.sumologic]]:URL- This is the HTTP source URL created previously. See this doc for more information on additional parameters for configuring the Sumo Logic Telegraf output plugin.
-
Below is an explanation for additional values set by this Telegraf configuration. If you haven’t defined a cluster in MariaDB, then enter
defaultfor db_cluster. There are additional values set by the Telegraf configuration. We recommend not to modify these values as they might cause the Sumo Logic app to not function correctly.data_format=“prometheus”. In the output[[outputs.sumologic]]plugins section. Metrics are sent in the Prometheus format to Sumo Logic.component=“database”- In the input[[inputs.mysql]]plugins section. This value is used by Sumo Logic apps to identify application components.db_system=“mariadb”- In the input plugins sections. This value identifies the database system.
-
See this doc for all other parameters that can be configured in the Telegraf agent globally.
- After you have finalized your telegraf.conf file, you can start or reload the telegraf service using instructions from this doc.
At this point, Telegraf should start collecting the MariaDB metrics and forward them to the Sumo Logic HTTP Source.
Installing the MariaDB app
This section demonstrates how to install the MariaDB app. To install the app:
To install the app, do the following:
Next-Gen App: To install or update the app, you must be an account administrator or a user with Manage Apps, Manage Monitors, Manage Fields, Manage Metric Rules, and Manage Collectors capabilities depending upon the different content types part of the app.
- Select App Catalog.
- In the 🔎 Search Apps field, run a search for your desired app, then select it.
- Click Install App.
note
Sometimes this button says Add Integration.
- Click Next in the Setup Data section.
- In the Configure section of your respective app, complete the following fields.
- Is K8S deployment involved. Specify if resources being monitored are partially or fully deployed on Kubernetes (K8s)
- Click Next. You will be redirected to the Preview & Done section.
Post-installation
Once your app is installed, it will appear in your Installed Apps folder, and dashboard panels will start to fill automatically.
Each panel slowly fills with data matching the time range query received since the panel was created. Results will not immediately be available but will be updated with full graphs and charts over time.
As part of the app installation process, the following fields will be created by default:
componentenvironmentdb_systemdb_clusterdb_cluster_addressdb_cluster_port
Additionally, if you are using MariaDB in the Kubernetes environment, the following additional fields will be created by default during the app installation process:
pod_labels_componentpod_labels_environmentpod_labels_db_systempod_labels_db_clusterpod_labels_db_cluster_addresspod_labels_db_cluster_port
For information on setting up fields, see Fields.
Viewing MariaDB Dashboards
All dashboards have a set of filters that you can apply to the entire dashboard. Use these filters to drill down and examine the data to a granular level.
- You can change the time range for a dashboard or panel by selecting a predefined interval from a drop-down list, choosing a recently used time range, or specifying custom dates and times. Learn more.
- You can use template variables to drill down and examine the data on a granular level. For more information, see Filtering Dashboards with Template Variables.
- Most Next-Gen apps allow you to provide the scope at the installation time and are comprised of a key (
_sourceCategoryby default) and a default value for this key. Based on your input, the app dashboards will be parameterized with a dashboard variable, allowing you to change the dataset queried by all panels. This eliminates the need to create multiple copies of the same dashboard with different queries.
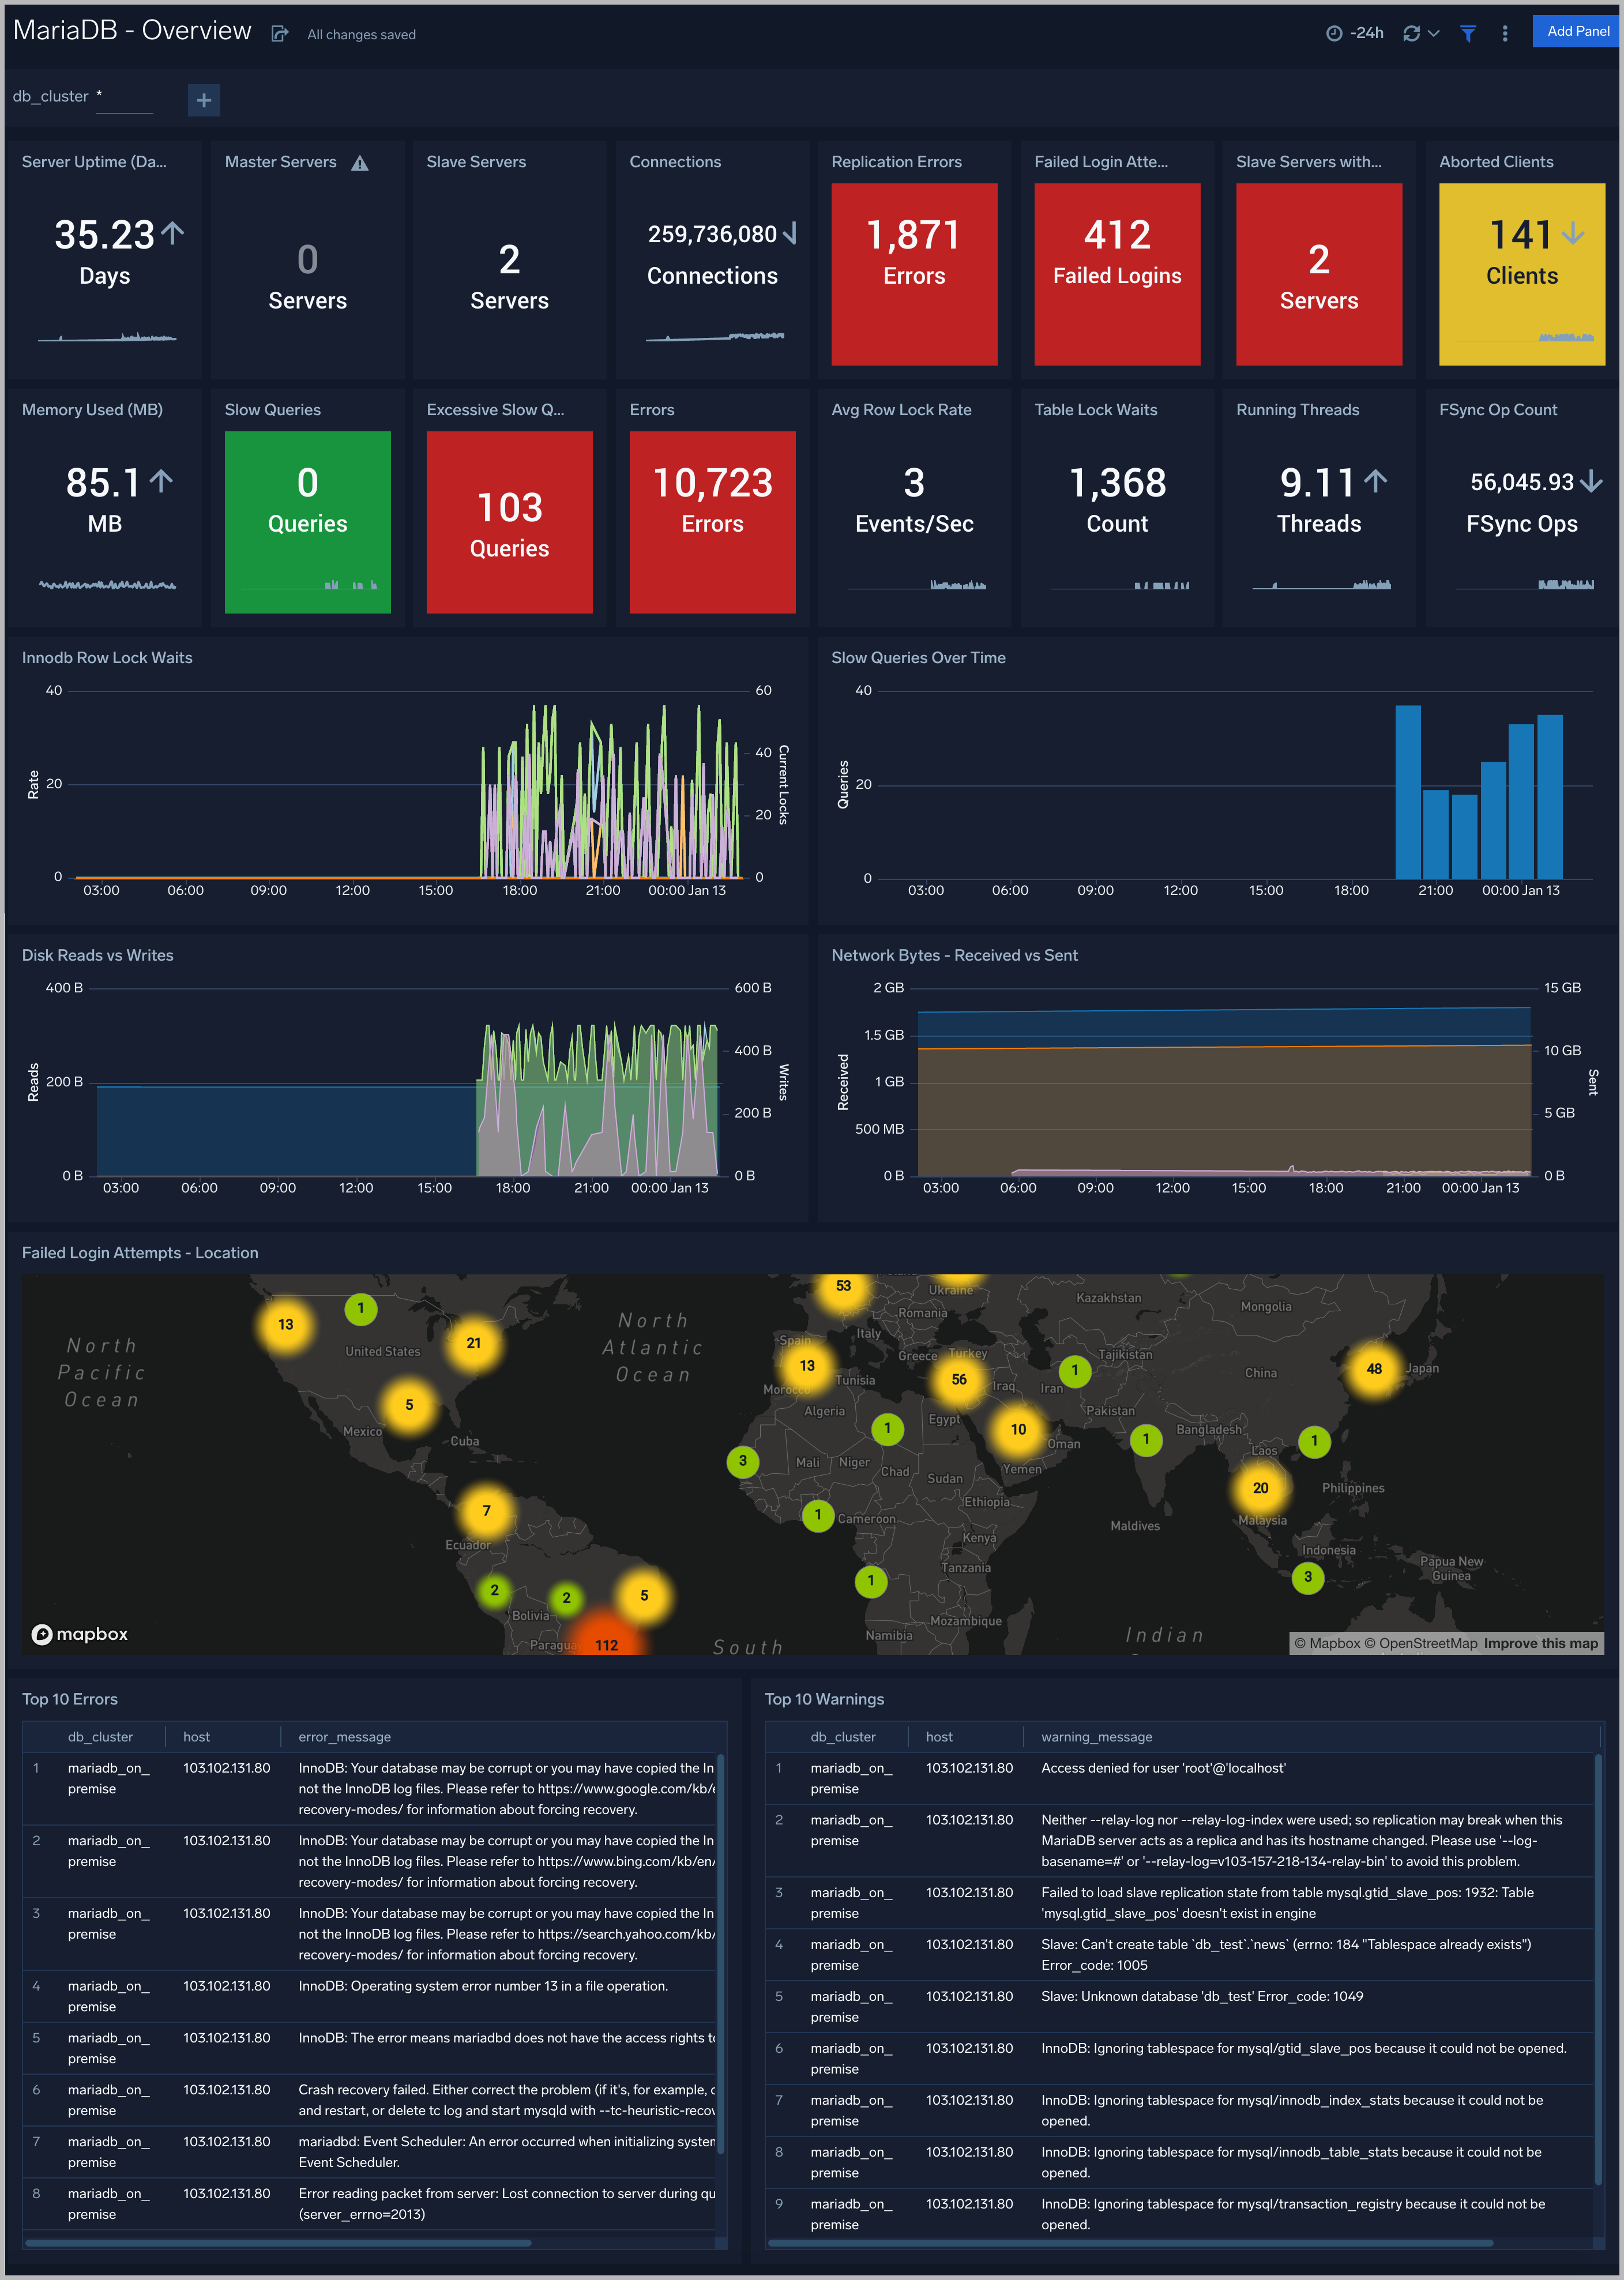
Overview
The MariaDB - Overview dashboard gives you an at-a-glance view of the state of your database clusters by monitoring key cluster information such as errors, failed logins, errors, queries executed, slow queries, lock waits, uptime, and more.
Use this dashboard to:
- Quickly identify the state of a given database cluster
Error Logs
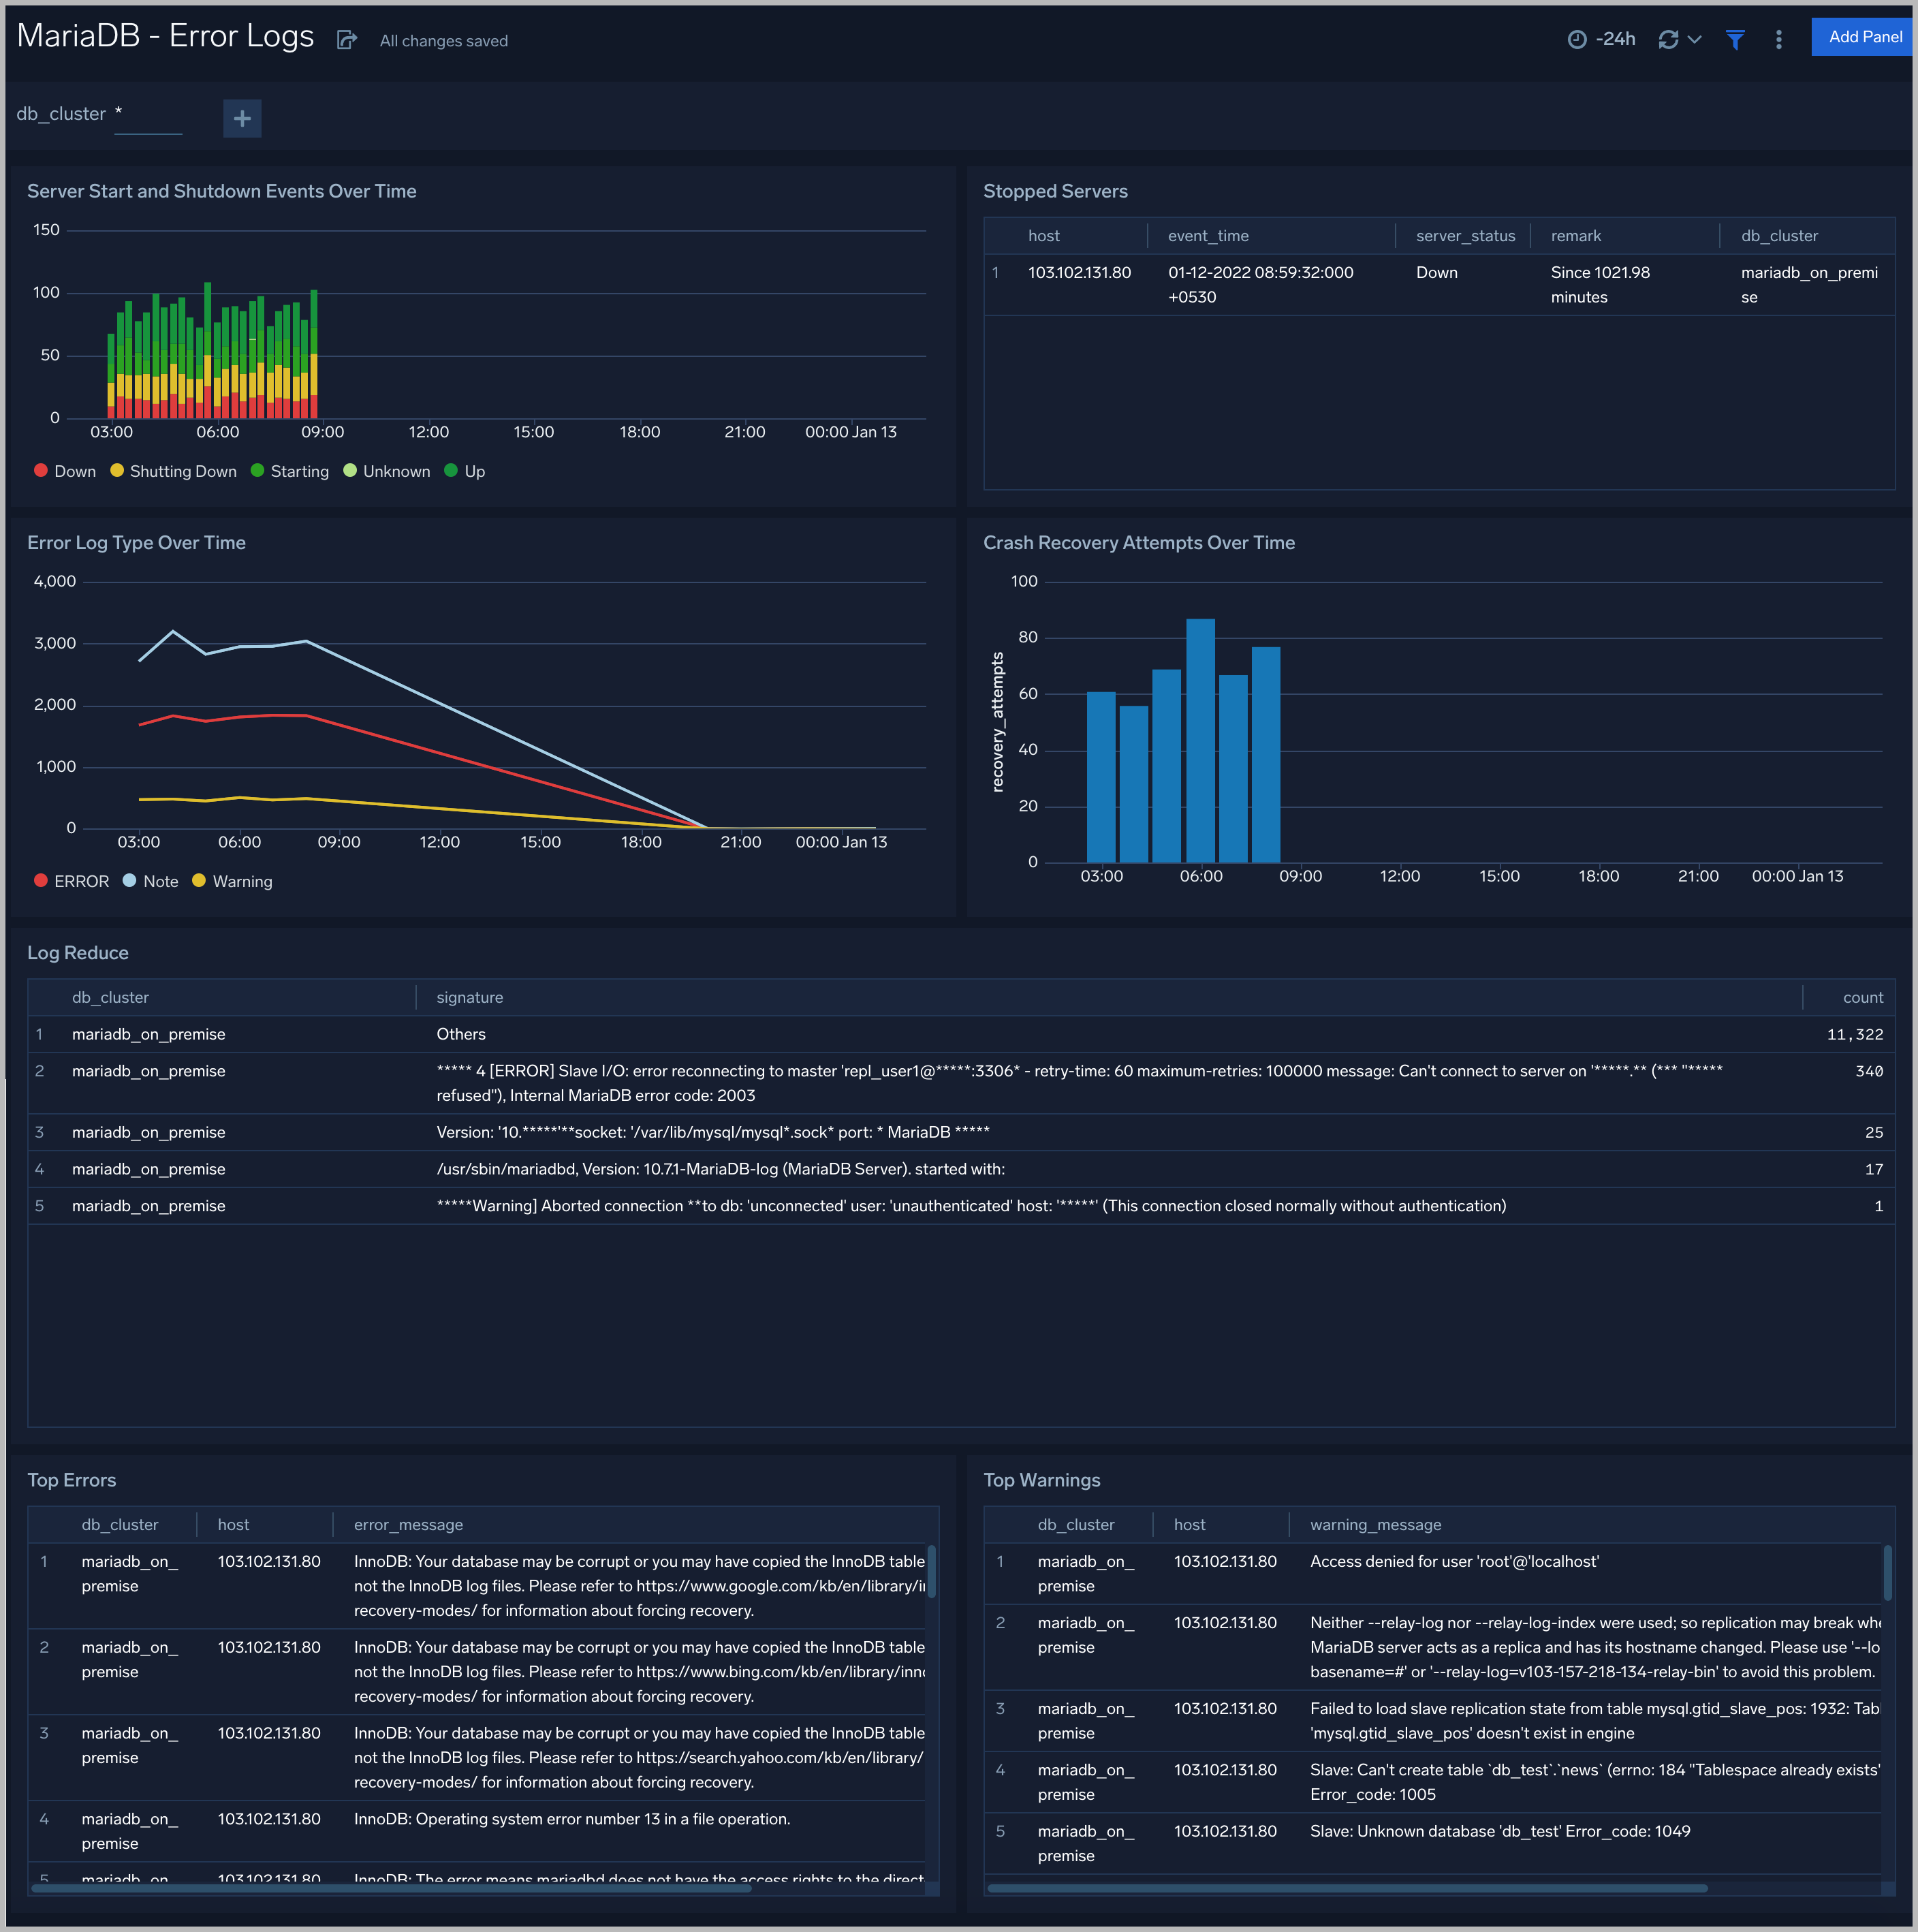
The MariaDB - Error Logs dashboard provides insight into database error logs by specifically monitoring database shutdown/start events, errors over time, errors, warnings, and crash recovery attempts.
Use this dashboard to:
- Quickly identify errors and patterns in logs for troubleshooting.
- Monitor trends in the error log and identify outliers.
- Ensure that server start, server stop, and crash recovery events are in line with expectations.
- Dashboard filters allow you to narrow a search for the database clusters..
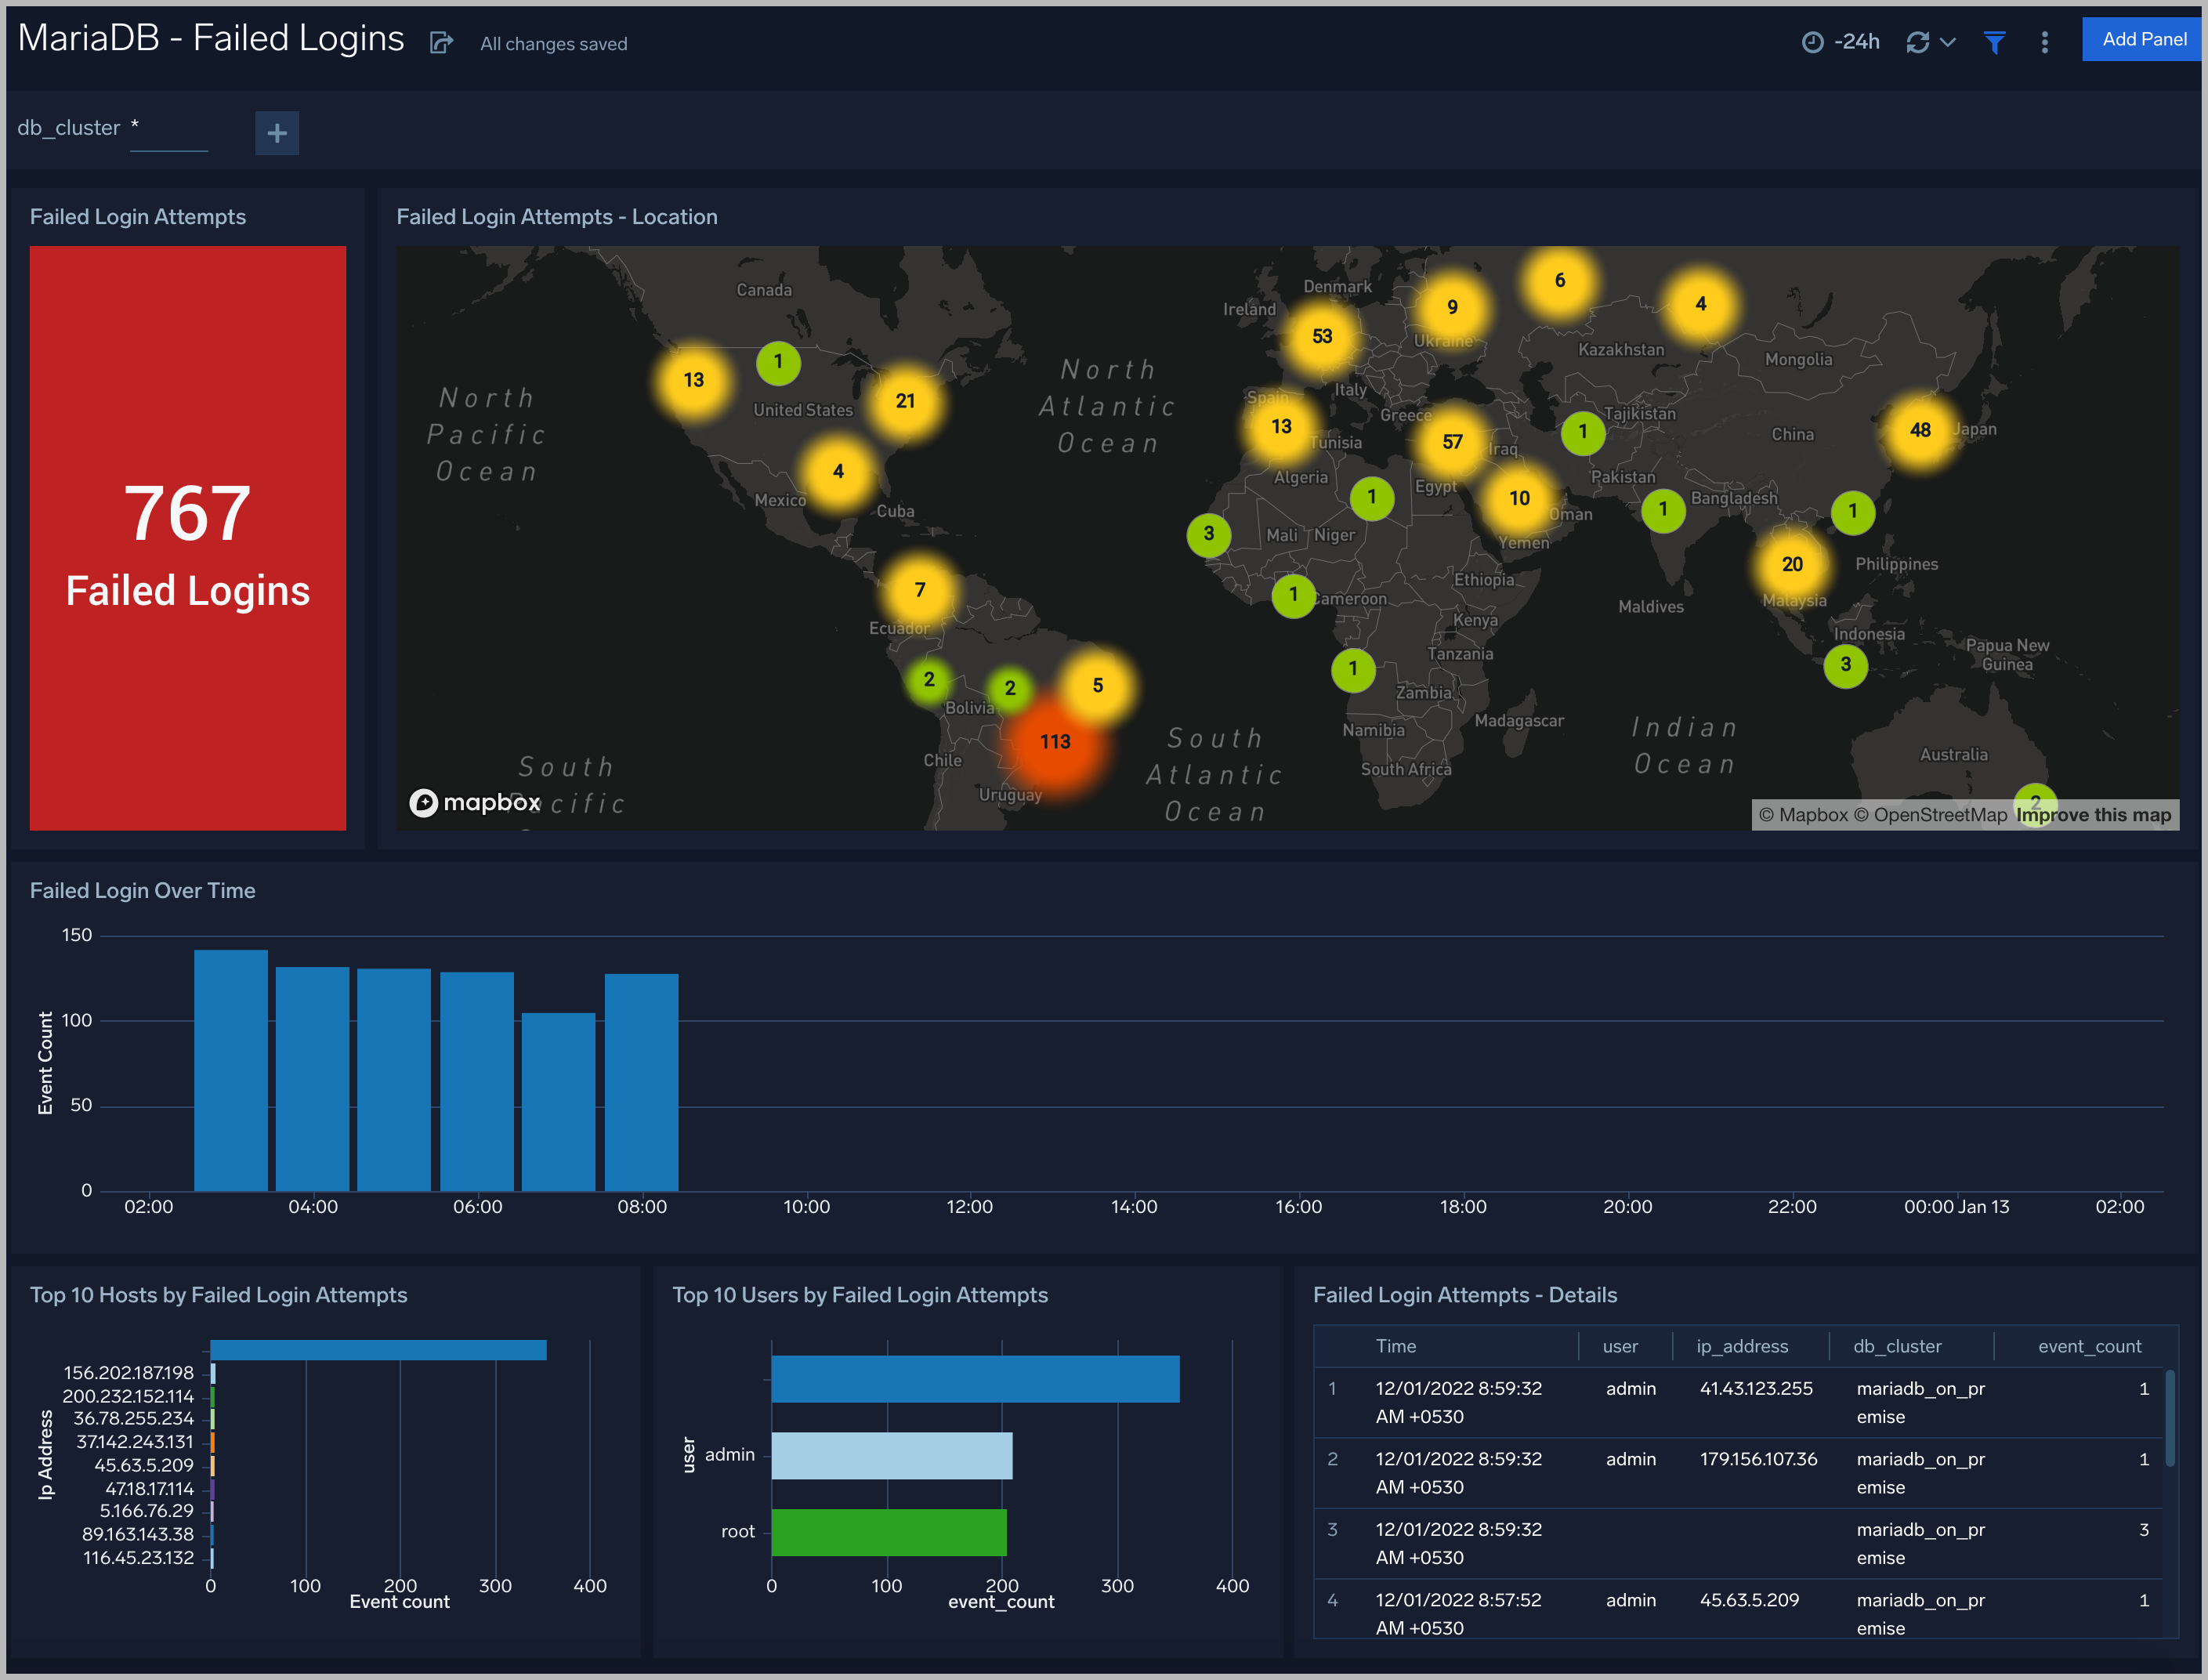
Failed Logins
The MariaDB - Failed Logins dashboard provides insights into all failed login attempts by location, users and hosts.
Use this dashboard to:
- Monitor all failed login attempts and identify any unusual or suspicious activity.
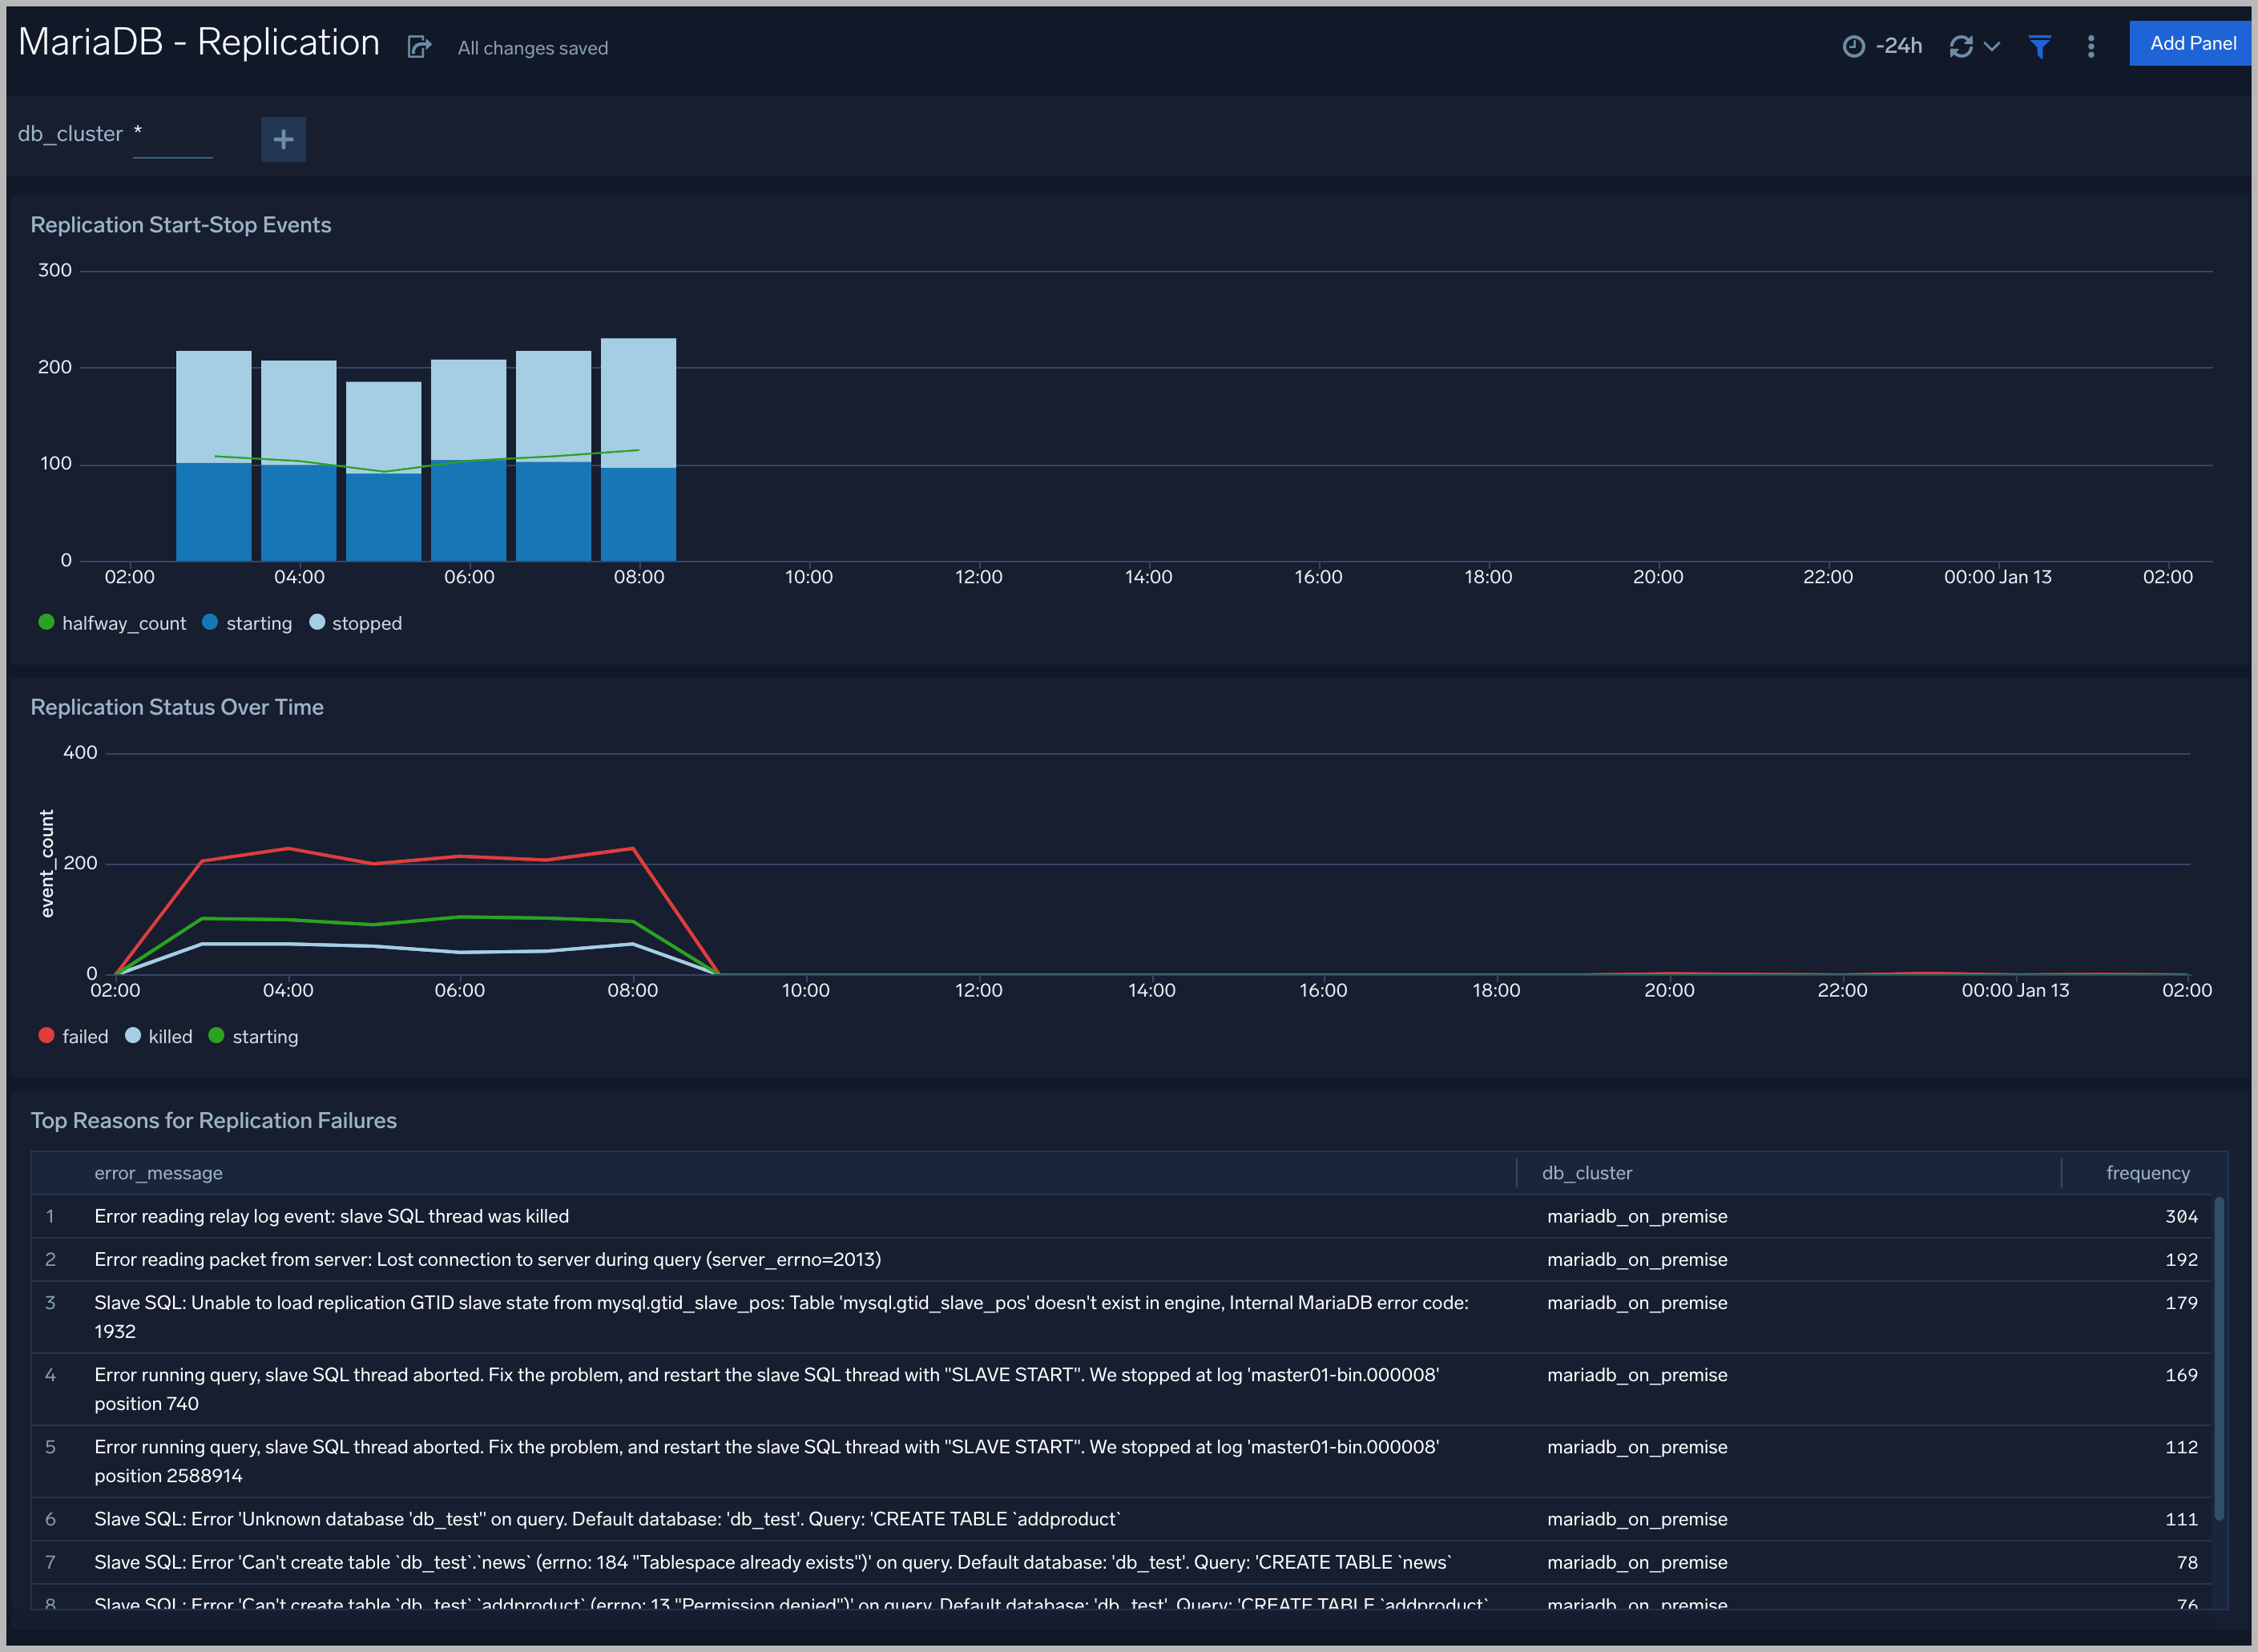
Replication
The MariaDB - Replication dashboard provides insights into the state of database replication.
Use this dashboard to:
- Quickly determine reasons for replication failures.
- Monitor replication status trends.
Slow Queries
The MariaDB - Slow Queries dashboard provides insights into all slow queries executed on the database.
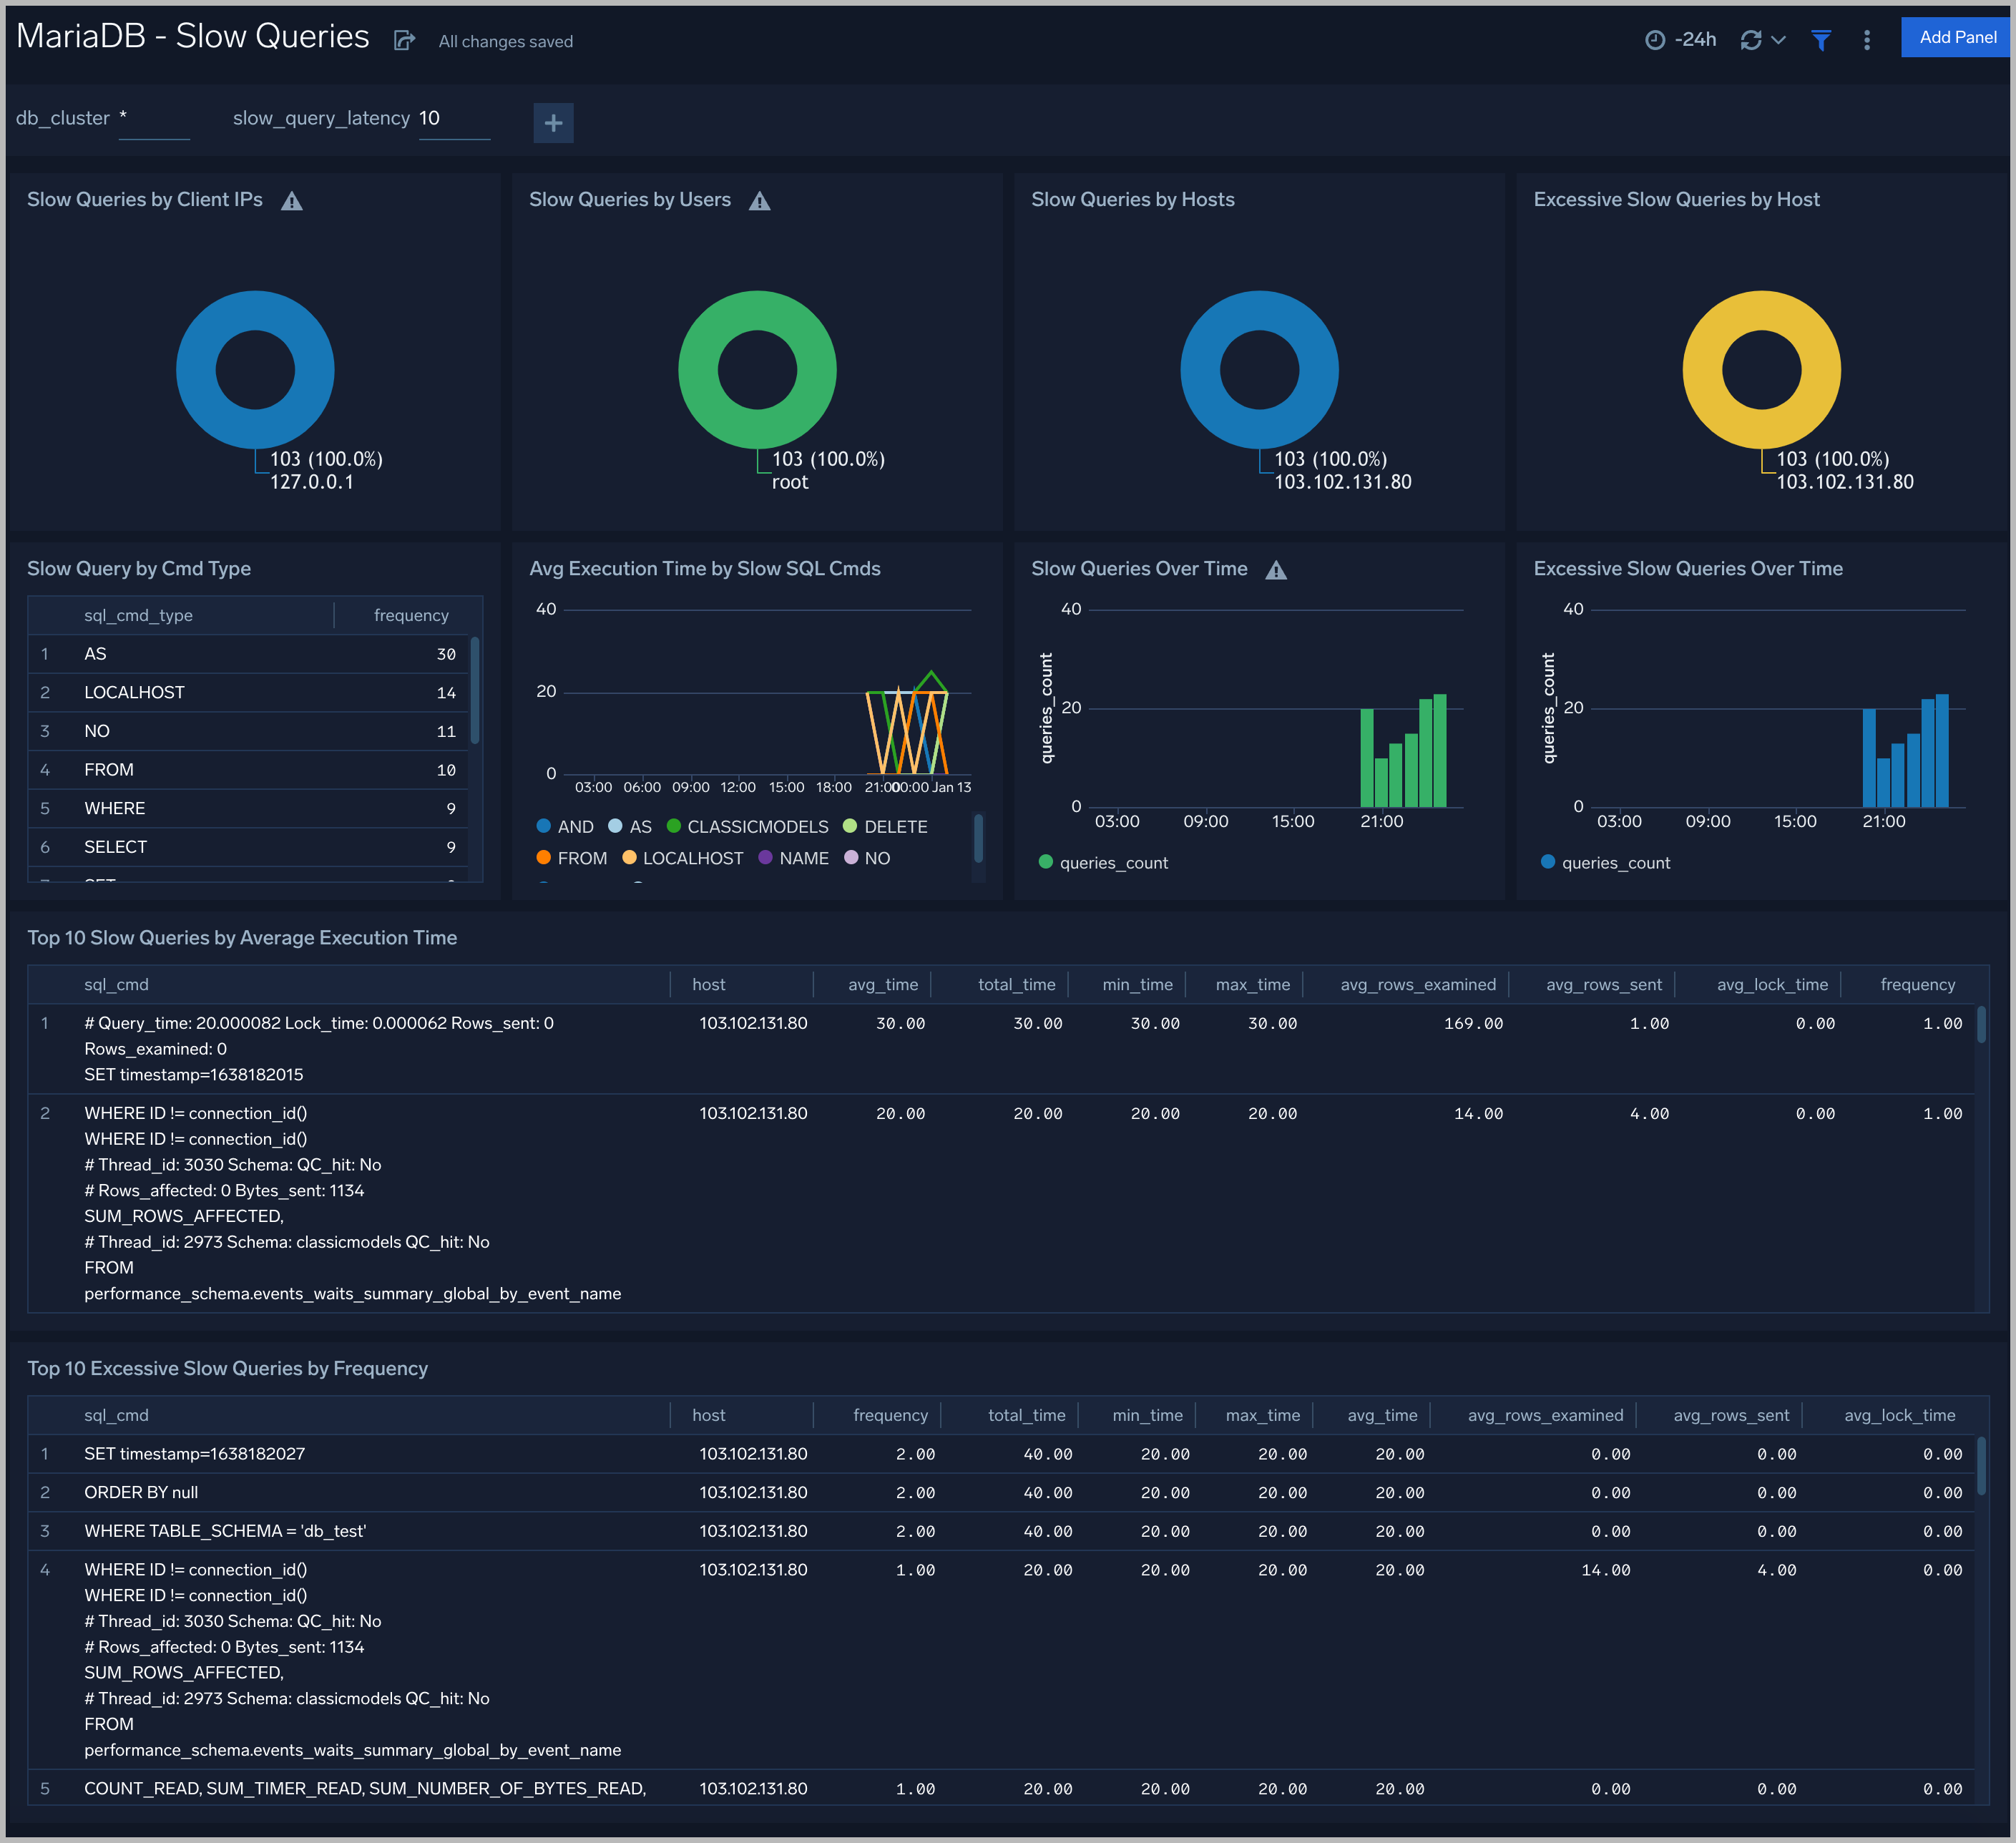
Slow queries are queries that take 10 seconds or more to execute (default value is 10 seconds as per MariaDB configuration which can be altered) and excessive slow queries are those that take 15 seconds or more to execute.
Use this dashboard to:
- Identify all slow queries.
- Quickly determine which queries have been identified as slow or excessive slow queries.
- Monitor users and hosts running slow queries.
- Determine which SQL commands are slower than others.
- Examine slow query trends to determine if there are periodic performance bottlenecks in your database clusters.
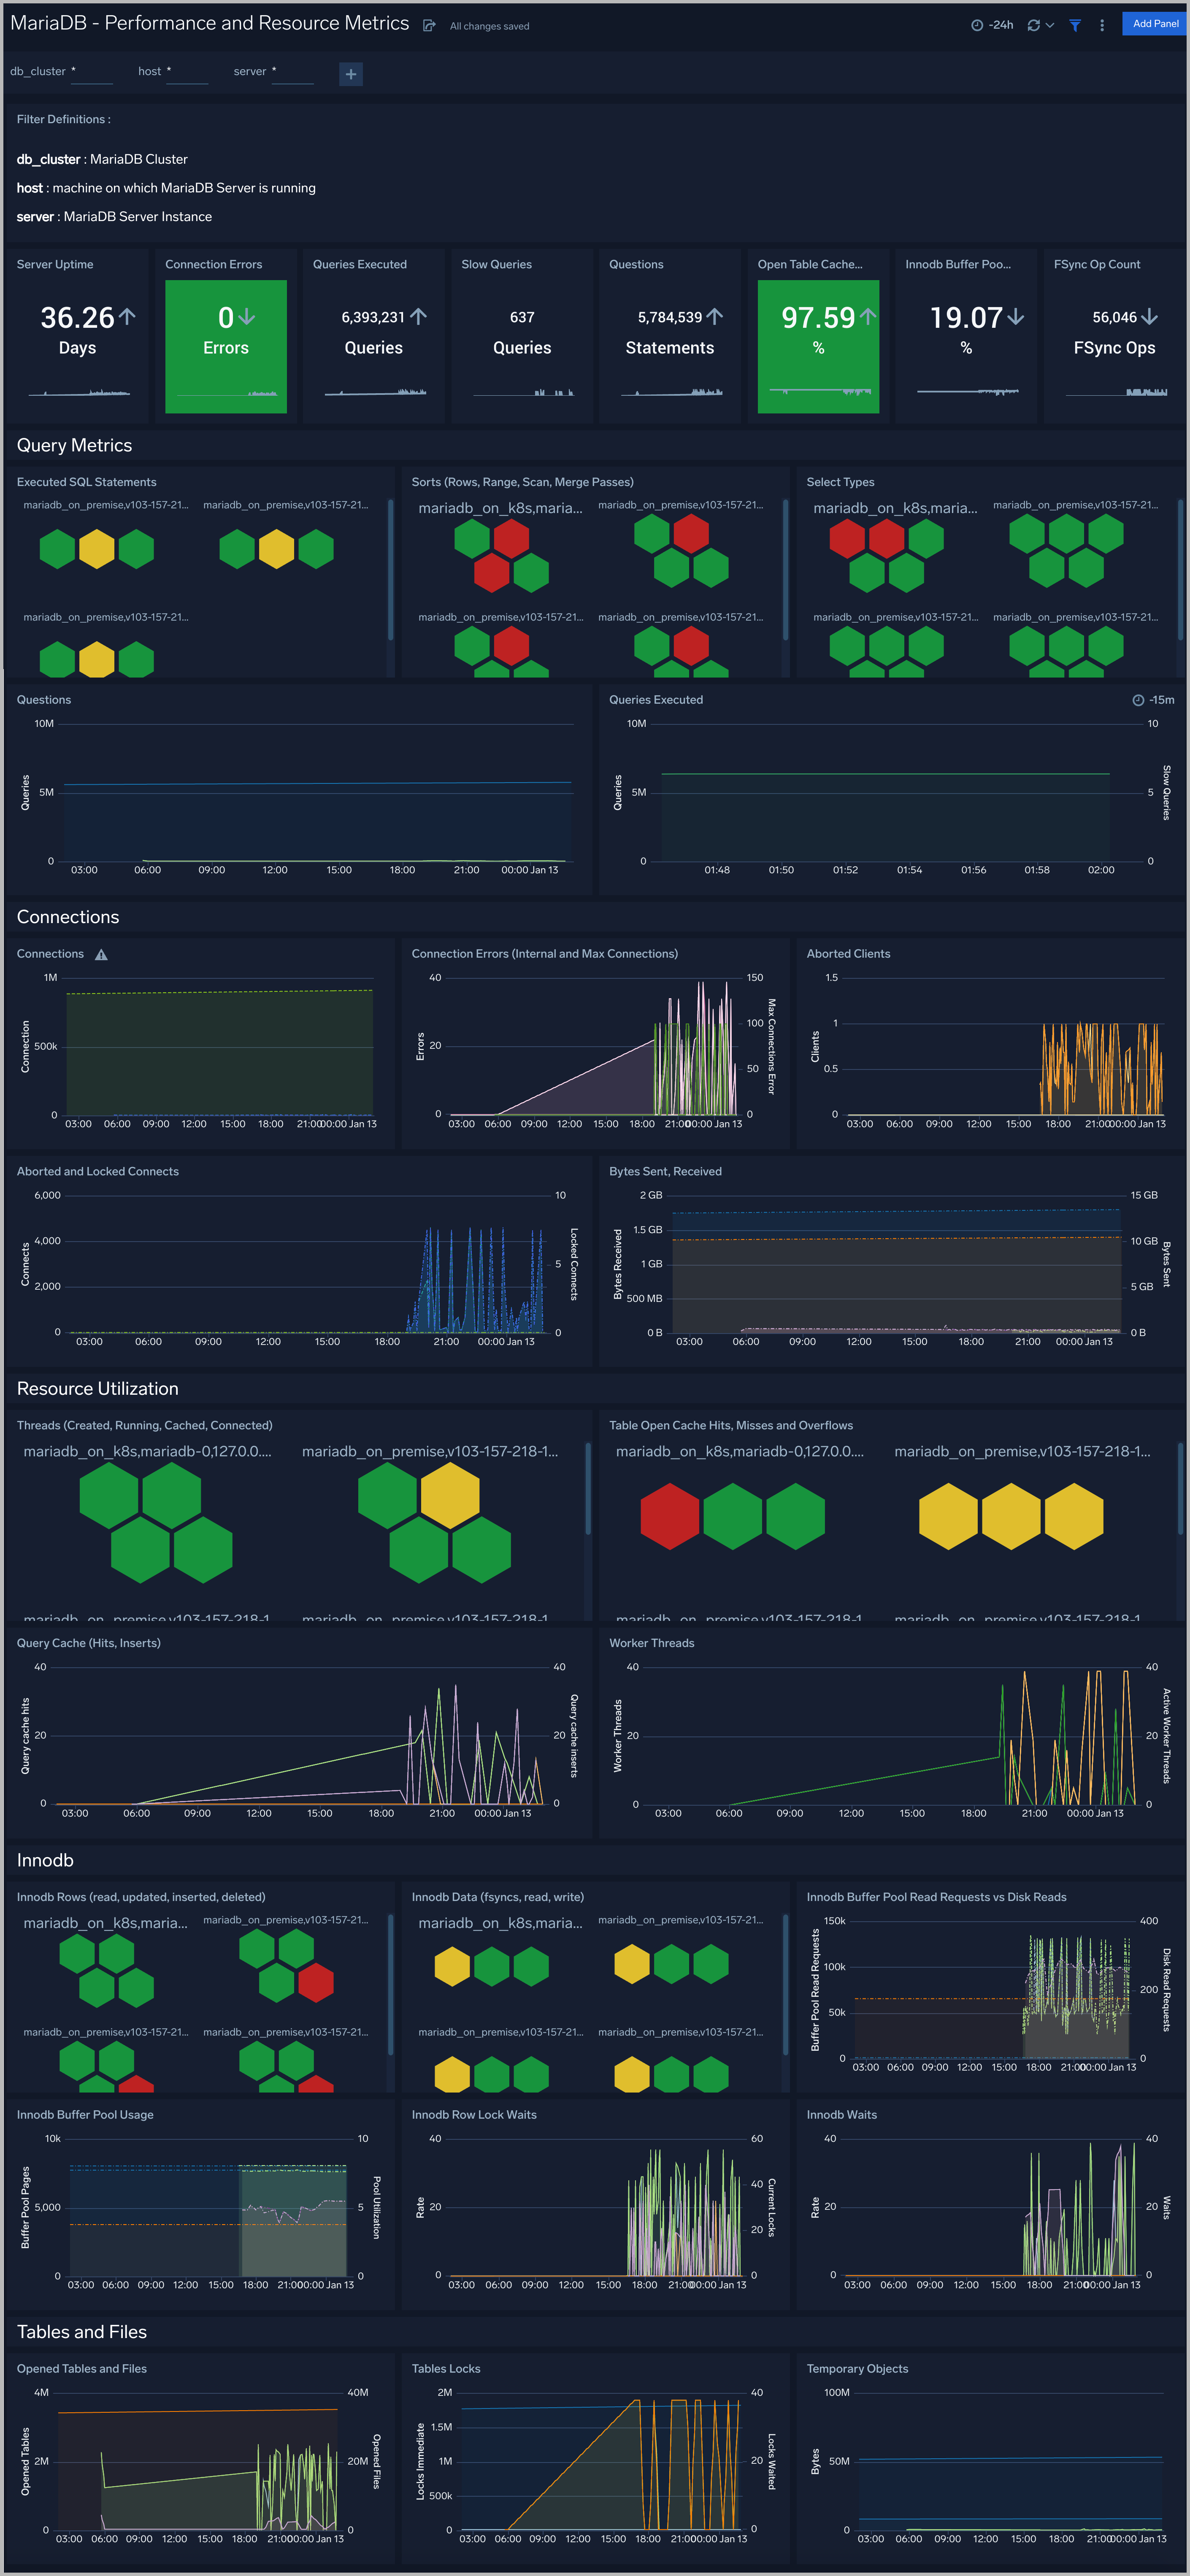
Performance and Resource Metrics
The MariaDB - Performance and Resource Metrics dashboard allows you to monitor the performance and resource usage of your database clusters.
Use this dashboard to:
- Understand the behavior and performance of your database clusters.
- Monitor key operational metrics around connections, network traffic, threads running, innodb waits, and locks.
- Monitor query execution trends to ensure they match up with expectations.
- Dashboard filters allow you to narrow a search for a specific database cluster.
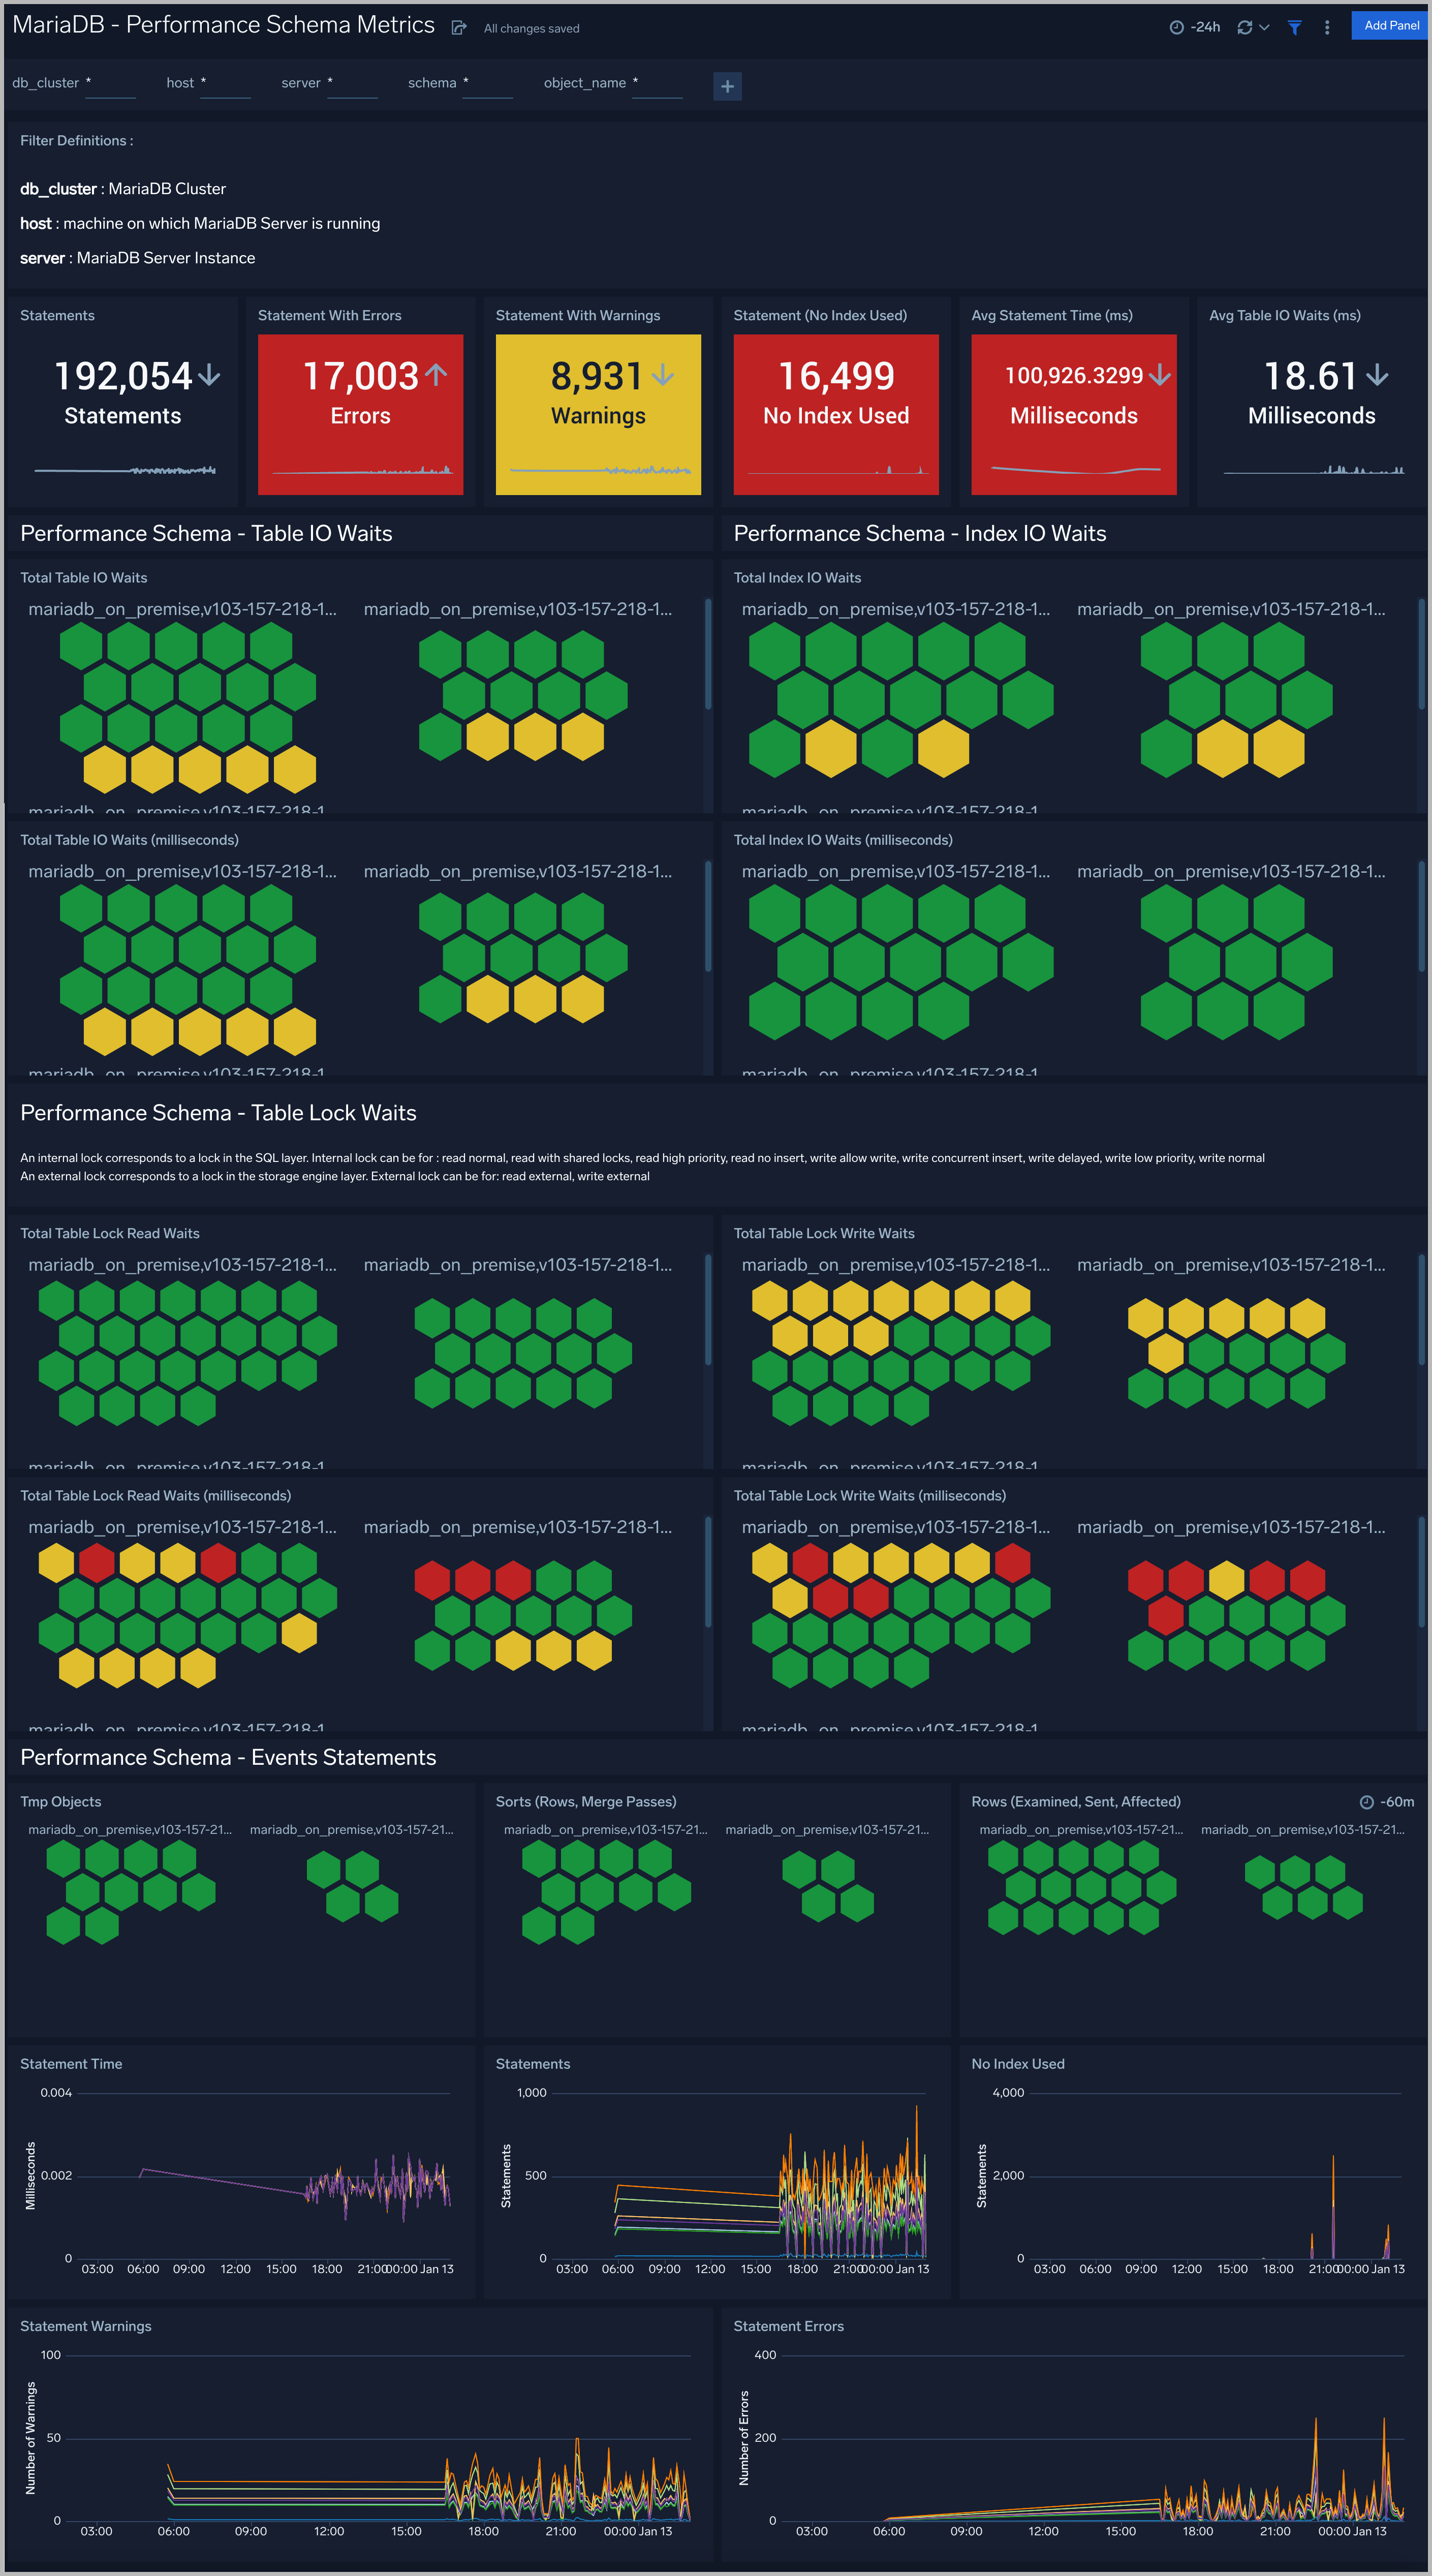
Performance Schema Metrics
The MariaDB - Performance Schema Metrics Dashboard provides insights into the metrics provided by the MariaDB Performance Schema, which is a feature for monitoring MariaDB Server execution at a low level.
Use this dashboard to:
- Monitor errors and warning for SQL statements.
- Monitor statements running without use of index columns.
- Monitor statistics such as Table and Index waits and read and write lock waits to optimize the performance of your database.
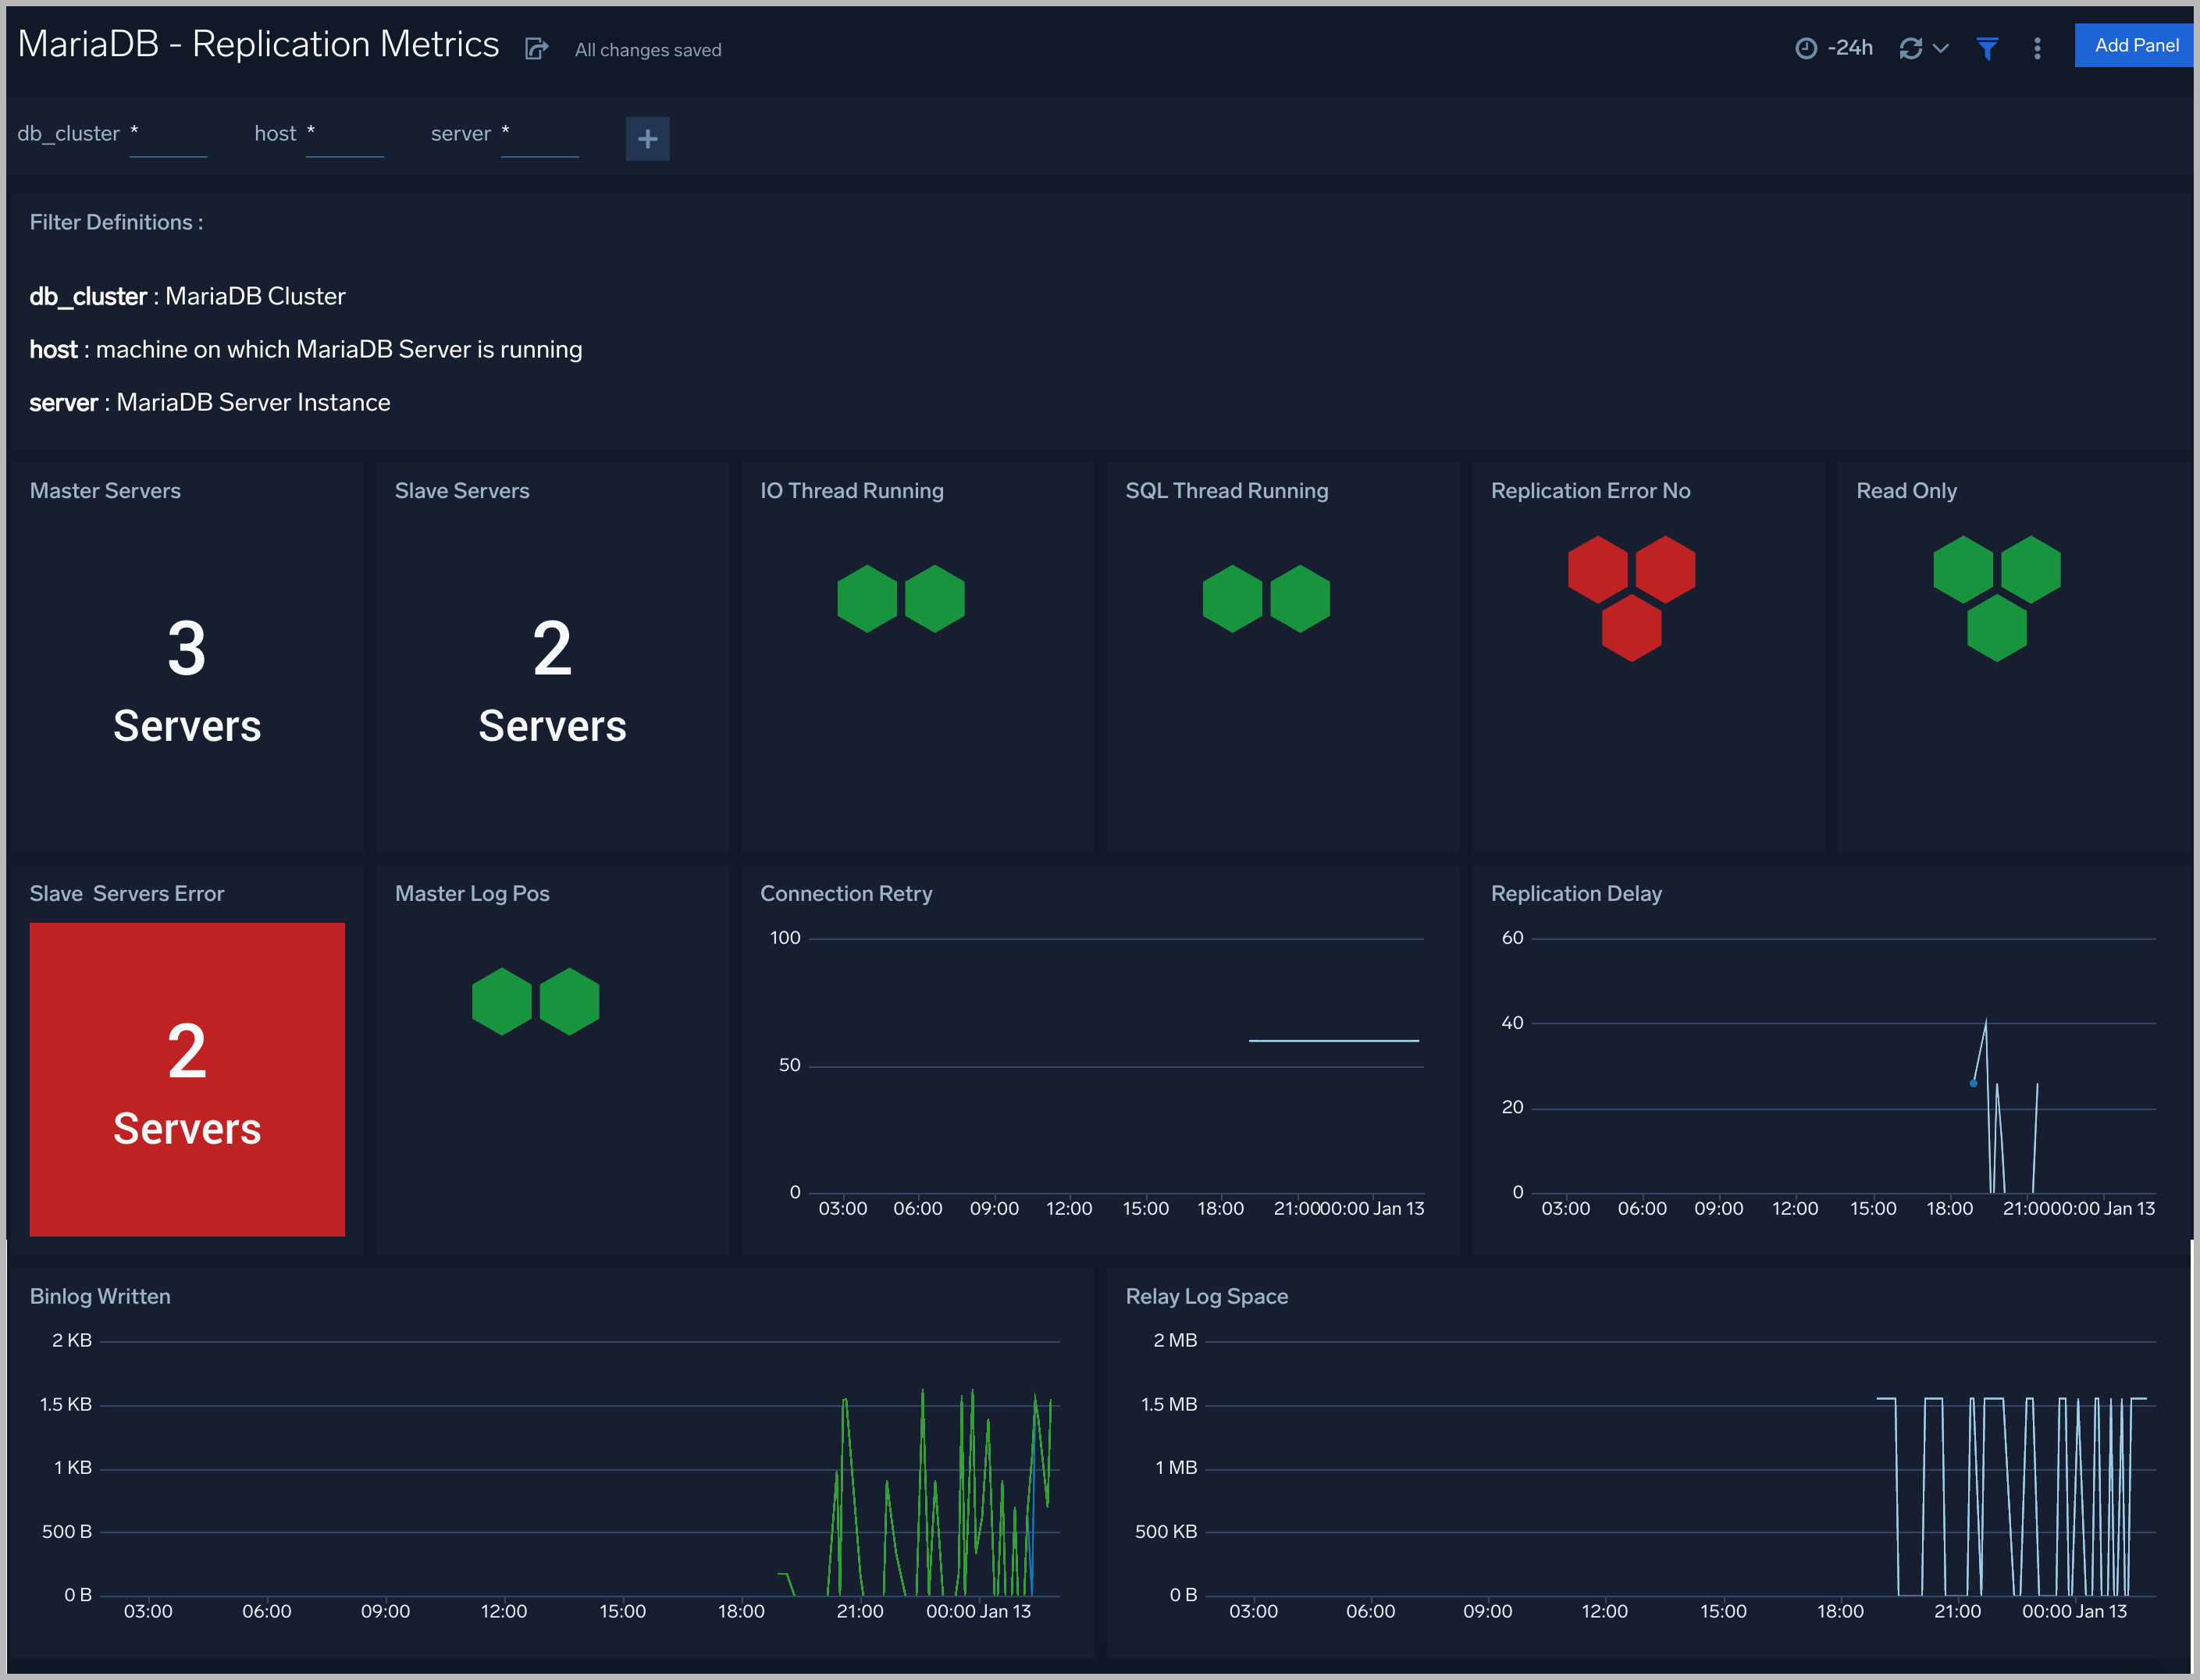
Replication Metrics
The MariaDB - Replication Metrics dashboard shows replication events, errors, warnings, and nodes.
InnoDB Metrics
The MariaDB - InnoDB Metrics dashboard shows replication events, errors, warnings, and nodes.
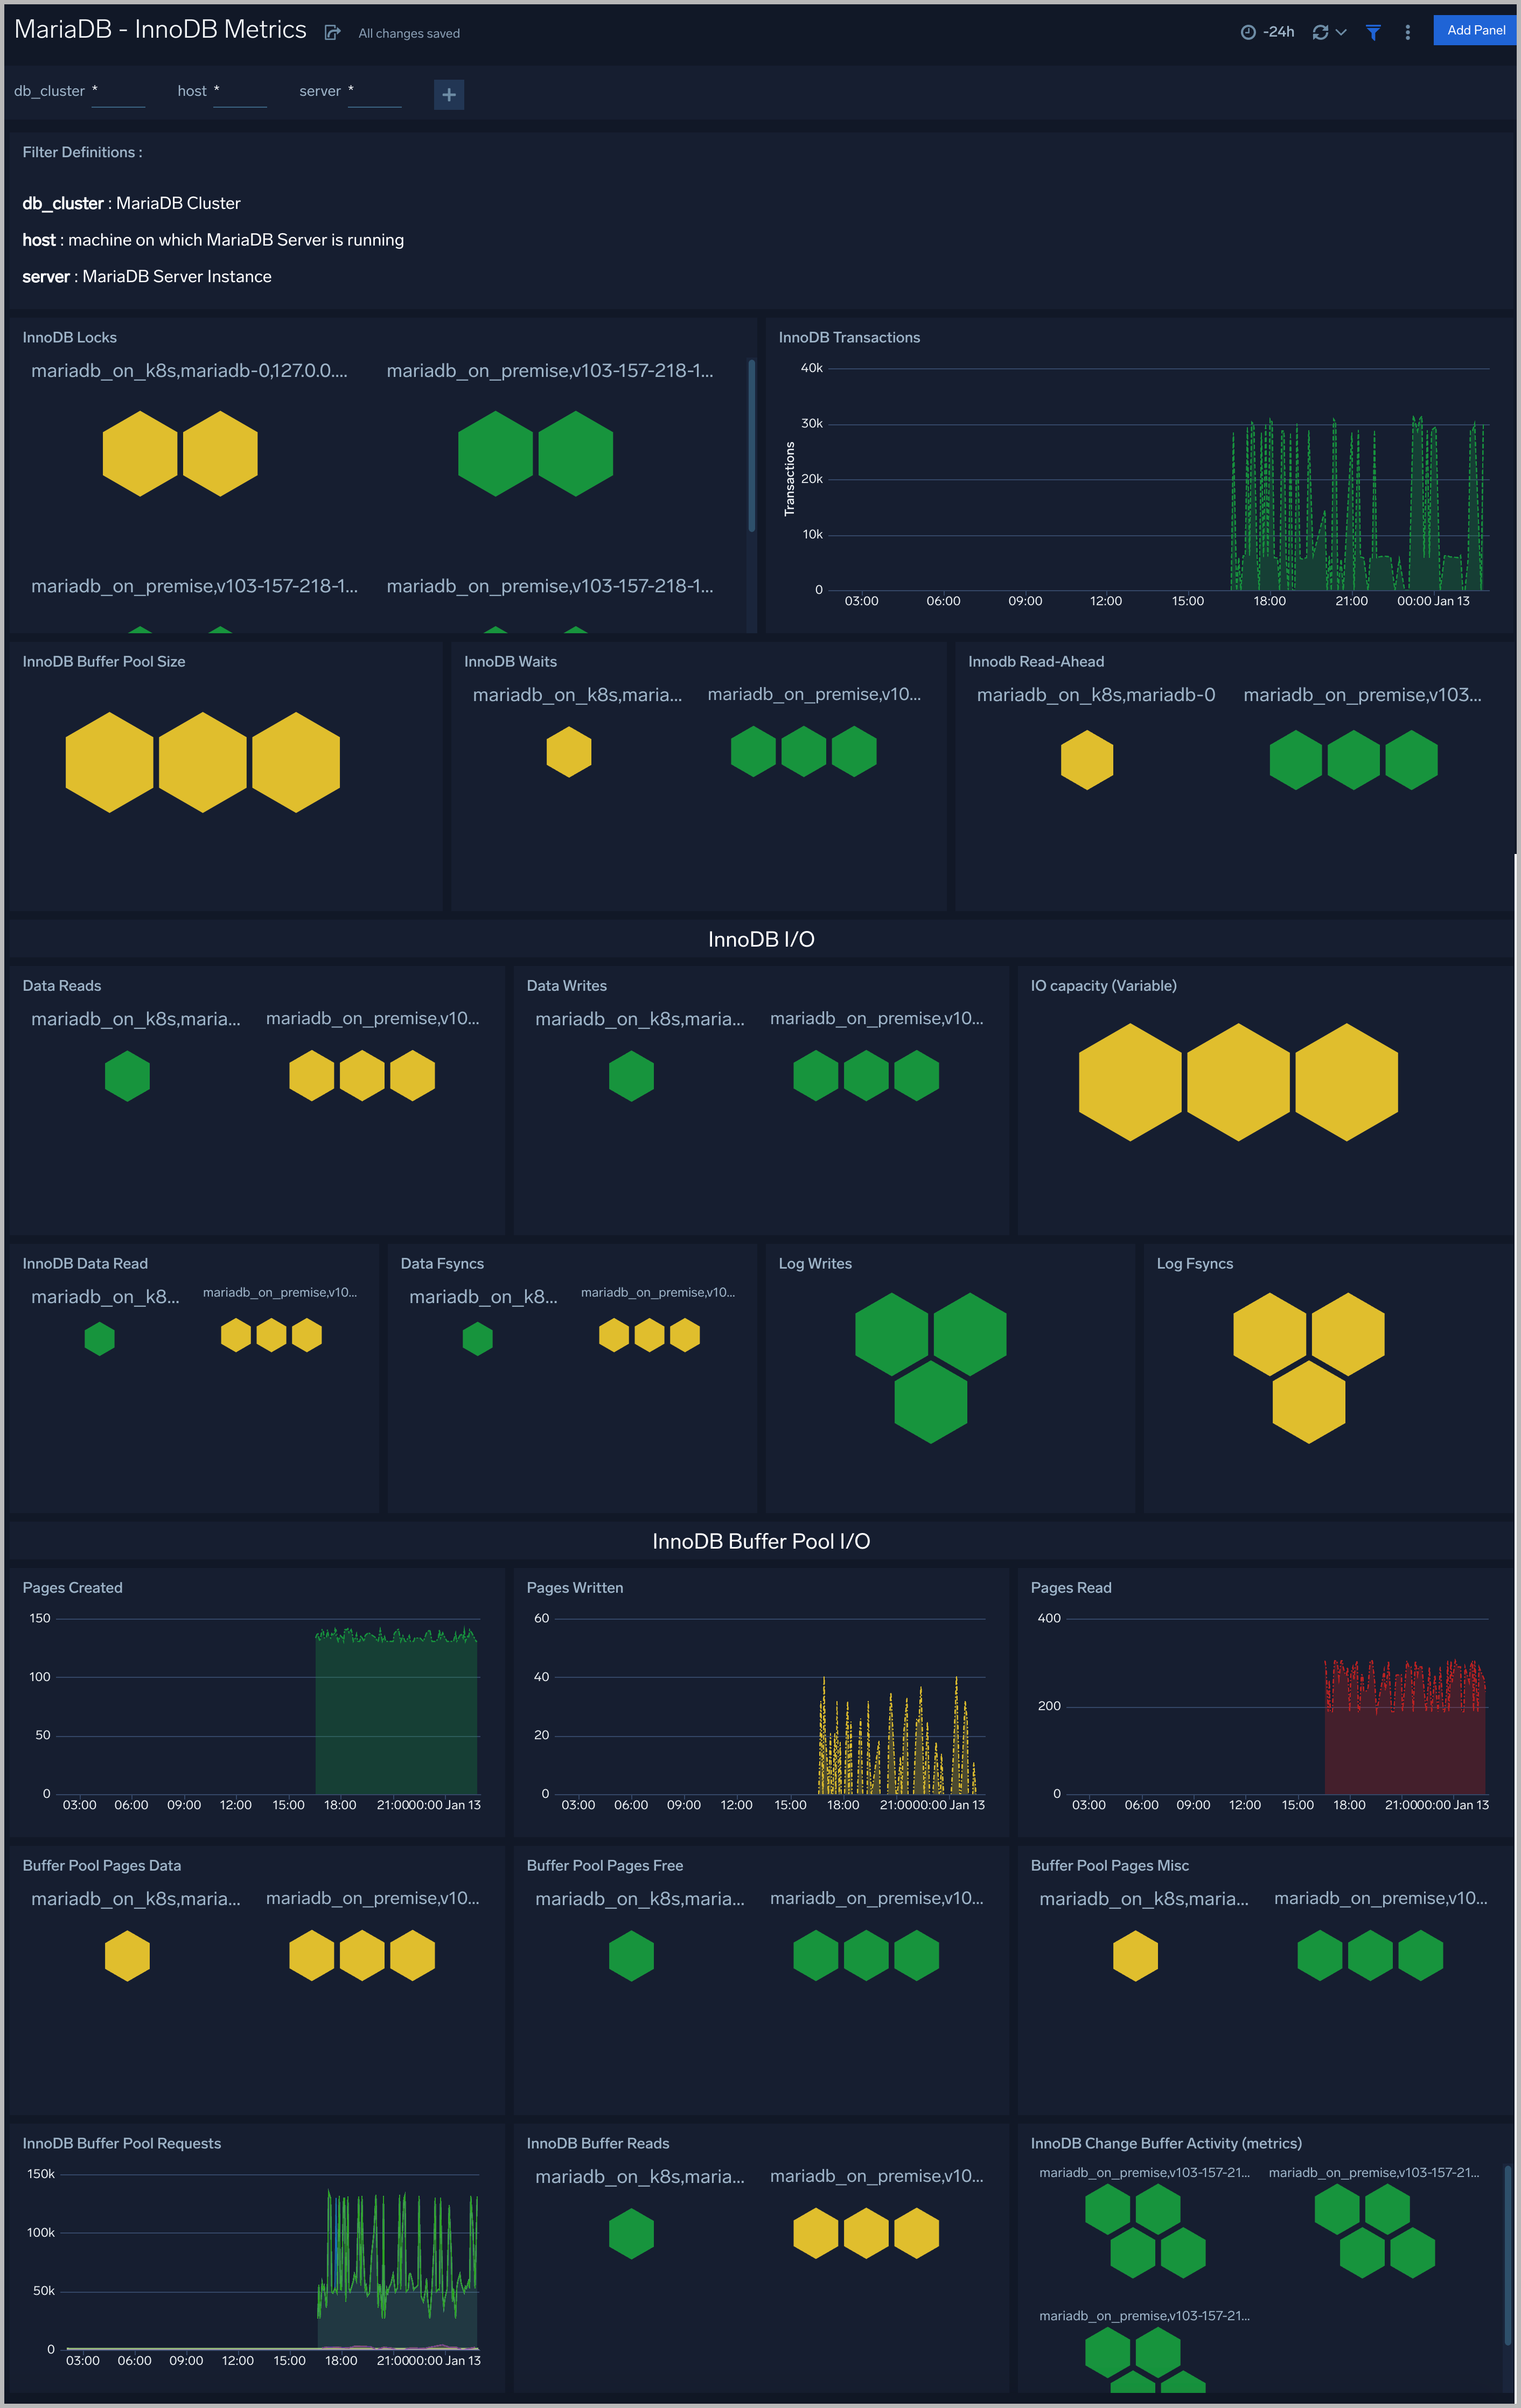
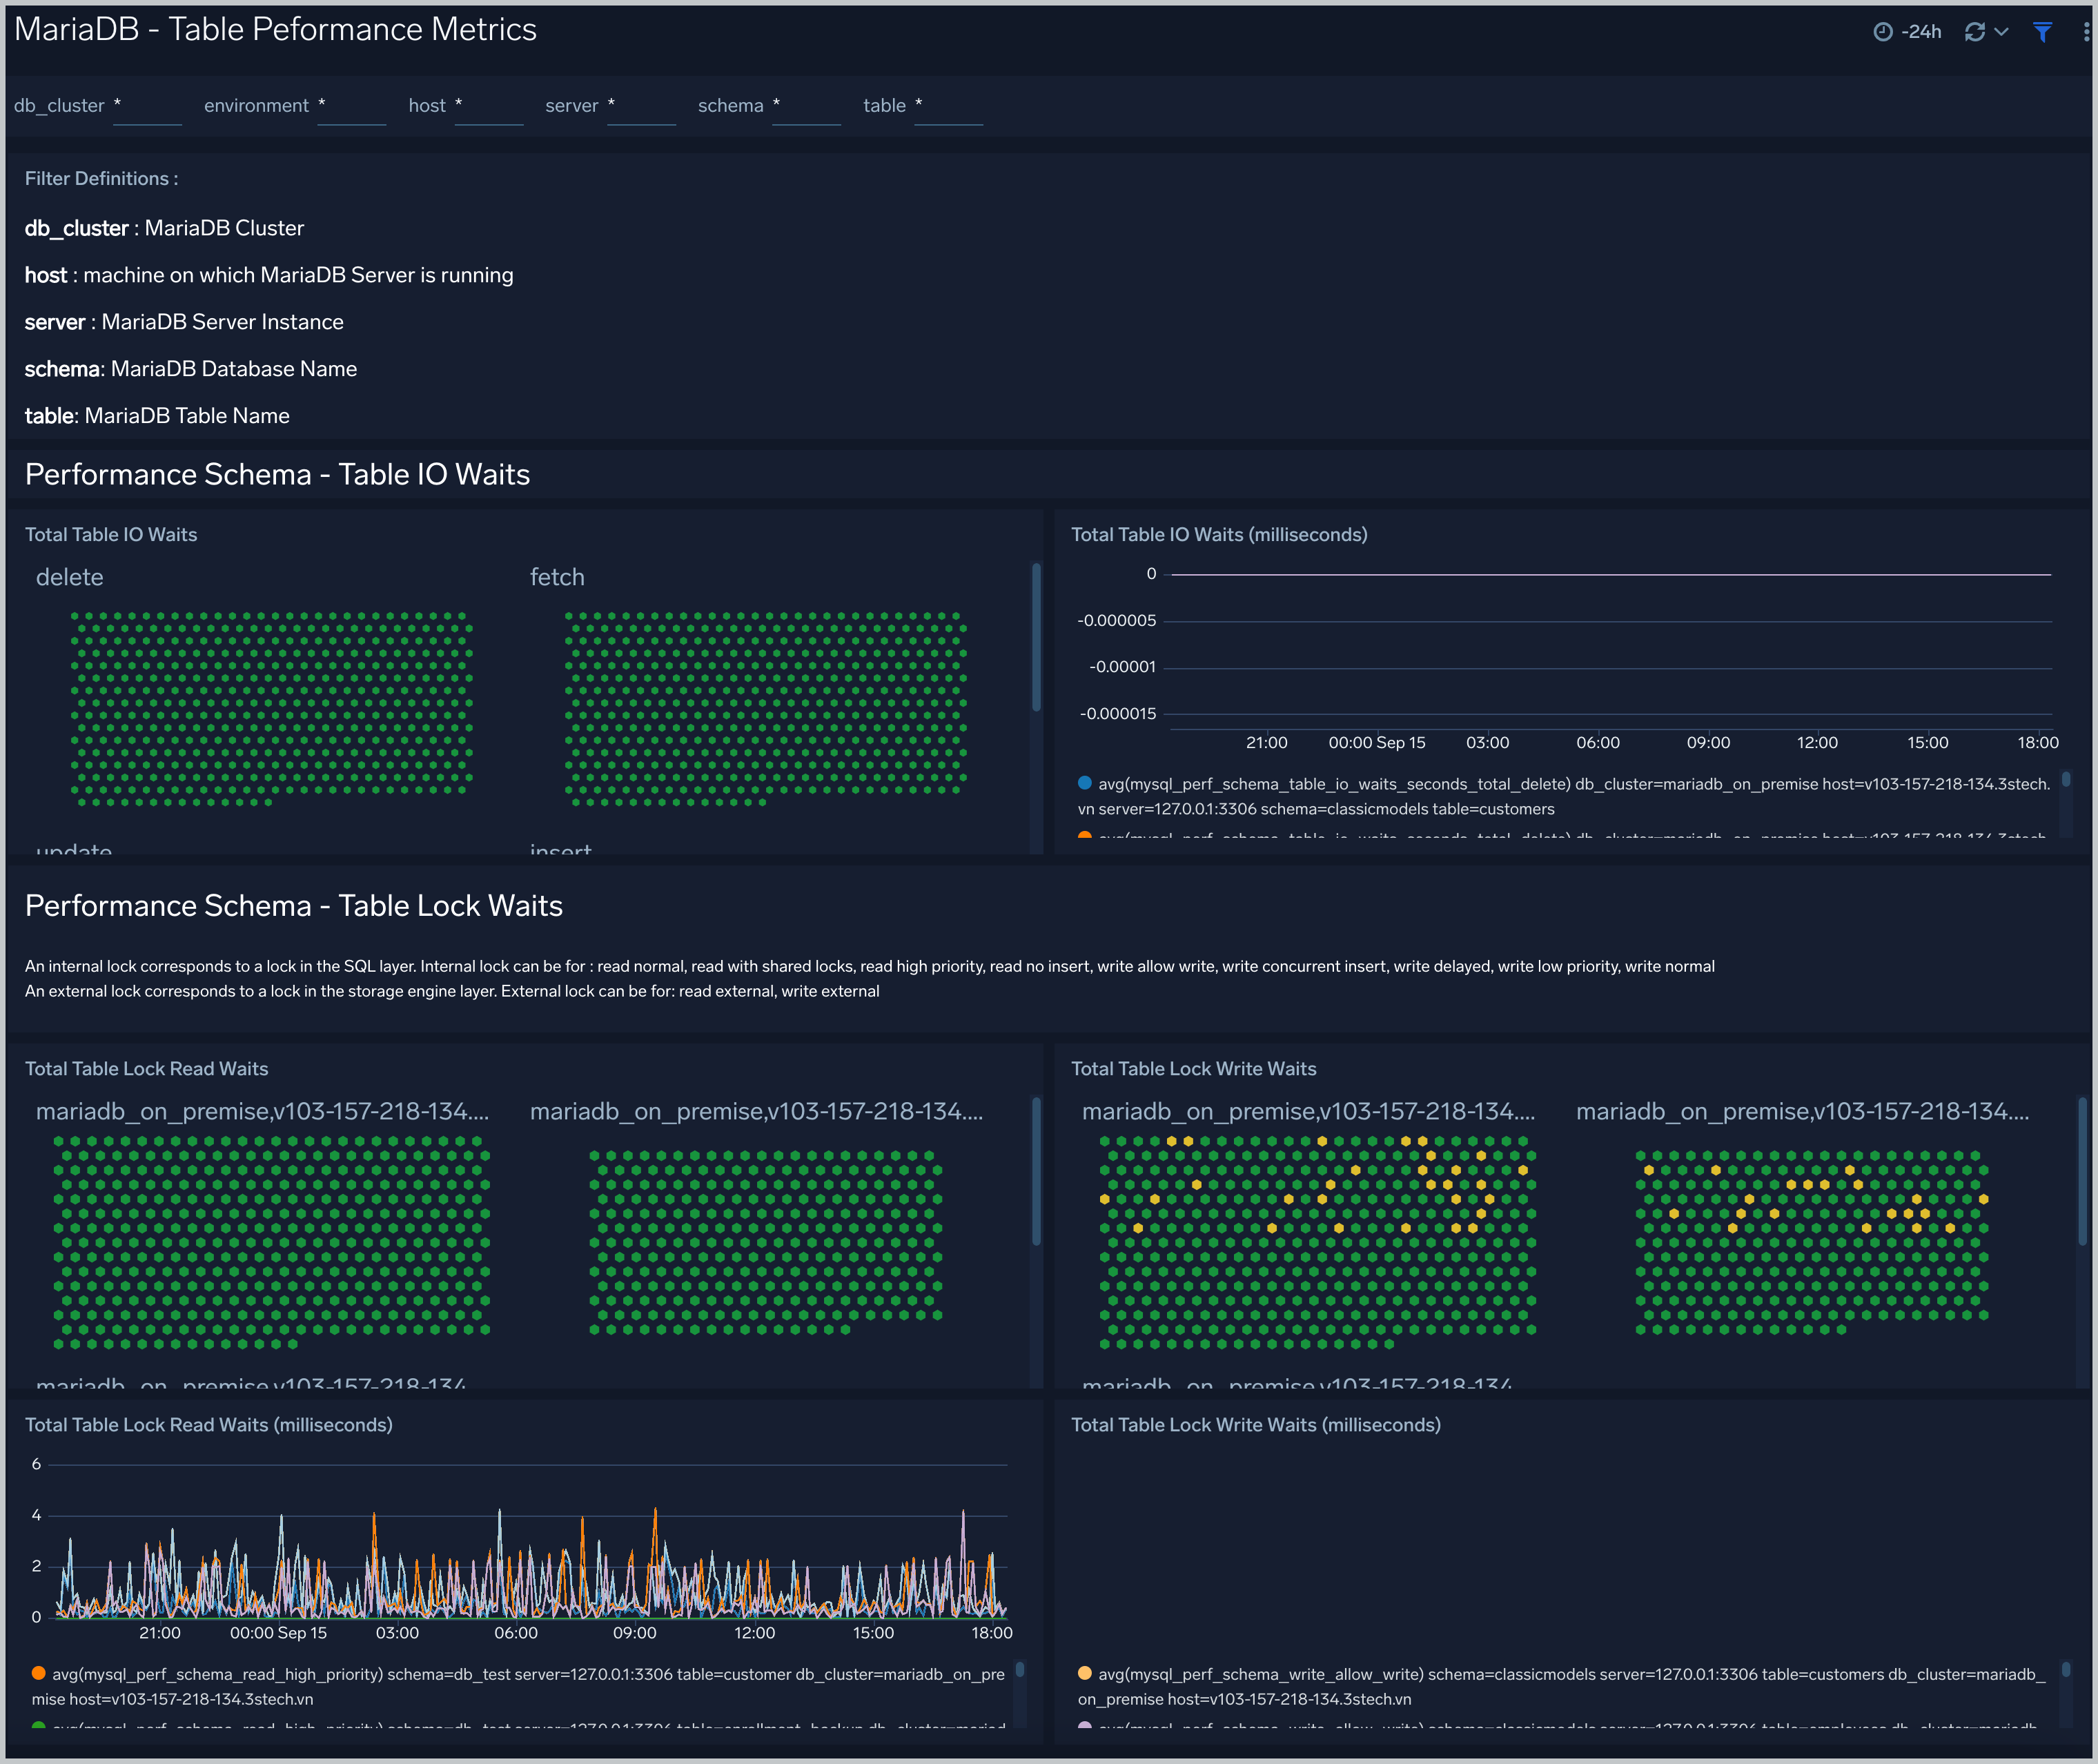
Table Performance Metrics
The MariaDB - Table Performance dashboard provides insights into performance like table i/o wait and table lock waits.
Use this dashboard to:
- Identify root cause of slow queries performed on database table.
- Compare read and write lock waits time with timeshift operator to compare baseline and current trend.
Create monitors for MariaDB app
From your App Catalog:
- From the Sumo Logic navigation, select App Catalog.
- In the Search Apps field, search for and then select your app.
- Make sure the app is installed.
- Navigate to What's Included tab and scroll down to the Monitors section.
- Click Create next to the pre-configured monitors. In the create monitors window, adjust the trigger conditions and notifications settings based on your requirements.
- Scroll down to Monitor Details.
- Under Location click on New Folder.
note
By default, monitor will be saved in the root folder. So to make the maintenance easier, create a new folder in the location of your choice.
- Enter Folder Name. Folder Description is optional.
tip
Using app version in the folder name will be helpful to determine the versioning for future updates.
- Click Create. Once the folder is created, click on Save.
MariaDB alerts
| Alert Type (Metrics/Logs) | Alert Name | Alert Description | Trigger Type (Critical / Warning) | Alert Condition | Recover Condition |
|---|---|---|---|---|---|
| Logs | MariaDB - Excessive Slow Query Detected | This alert fires when the average time to execute a query is more than 15 seconds for a 5 minute time interval. | Critical | >=1 | <1 |
| Logs | MariaDB - Instance down | This alert fires when we detect that a MariaDB instance is down | Critical | >=1 | <1 |
| Metrics | MariaDB - Connection refused | This alert fires when connections are refused when the limit of maximum connections is reached. | Critical | >=1 | <1 |
| Metrics | MariaDB - Follower replication lag detected | This alert fires when we detect that the average replication lag within a 5 minute time interval is greater than or equal to 900 seconds . | Critical | >=900 | <900 |
| Metrics | MariaDB - High average query run time | This alert fires when the average run time of MariaDB queries within a 5 minute time interval for a given schema is greater than or equal to one second. | Critical | >=1 | <1 |
| Metrics | MariaDB - High Innodb buffer pool utilization | This alert fires when the InnoDB buffer pool utilization is high (>=90%) within a 5 minute time interval. | Critical | >=90 | <90 |
| Metrics | MariaDB - Large number of aborted connections | This alert fires when there are 5 or more aborted connections detected within a 5 minute time interval. | Critical | >=5 | <5 |
| Metrics | MariaDB - Large number of internal connection errors | This alert fires when there are 5 or more internal connection errors within a 5 minute time interval. | Critical | >=5 | <5 |
| Metrics | MariaDB - Large number of slow queries | This alert fires when there are 5 or more slow queries within a 5 minute time interval. | Critical | >=5 | <5 |
| Metrics | MariaDB - Large number of statement errors | This alert fires when there are 5 or more statement errors within a 5 minute time interval. | Critical | >=5 | <5 |
| Metrics | MariaDB - Large number of statement warnings | This alert fires when there are 20 or more statement warnings within a 5 minute time interval. | Critical | >=20 | <20 |
| Metrics | MariaDB - No index used in the SQL statements | This alert fires when there are 5 or more statements not using an index in the SQL query within a 5 minute time interval. | Critical | >=5 | <5 |
| Metrics | MariaDB - Slave Server Error | This alert fires when there are slave server errors within a 5 minute time interval. | Critical | >0 | <=0 |