Memcached - Classic Collector

The Memcached app is a unified logs and metrics app that helps you monitor the availability, performance, health, and resource utilization of your Memcached clusters. Preconfigured dashboards provide insight into uptime, operational metrics, cache performance, resource utilization, errors, warnings, and commands executed.
The Sumo Logic app for Memcached is tested for Version: 1.4.15.
Sample log messages
- Kubernetes environments
- Non-Kubernetes environments
{
	"timestamp":1626248704386,
	"log":"28: going from conn_closing to conn_closed",
	"stream":"stderr",
	"time":"2021-07-14T07:45:01.839243101Z"
}
Jun 23 07:35:01 node03 memcached: \
<31 set GFcIh47CswfCnwk3JkmJ 0 0 4096
Collecting logs and metrics for Memcached
Configuring log and metric collection for the Memcached app includes the following tasks.
Configure Logs and Metrics Collection for Memcached
- Kubernetes environments
- Non-Kubernetes environments
In Kubernetes environments, we use the Telegraf Operator, which is packaged with our Kubernetes collection. You can learn more about it here.
The diagram below illustrates how data is collected from Memcached in a Kubernetes environment. In the architecture shown below, there are four services that make up the metric collection pipeline: Telegraf, Telegraf Operator, Prometheus, and Sumo Logic Distribution for OpenTelemetry Collector.
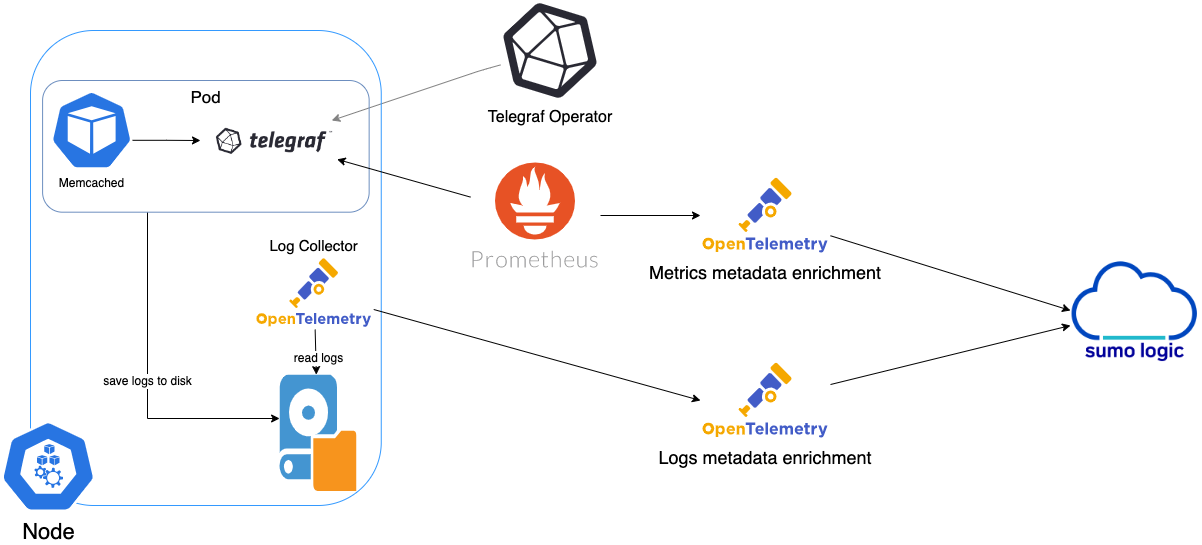
The first service in the metrics pipeline is Telegraf. Telegraf collects metrics from Memcached. Note that we’re running Telegraf in each pod we want to collect metrics from as a sidecar deployment, for example, Telegraf runs in the same pod as the containers it monitors. Telegraf uses the Memcached input plugin to obtain metrics. (For simplicity, the diagram doesn’t show the input plugins.) The injection of the Telegraf sidecar container is done by the Telegraf Operator. Prometheus pulls metrics from Telegraf and sends them to Sumo Logic Distribution for OpenTelemetry Collector which enriches metadata and sends metrics to Sumo Logic.
In the logs pipeline, Sumo Logic Distribution for OpenTelemetry Collector collects logs written to standard out and forwards them to another instance of Sumo Logic Distribution for OpenTelemetry Collector, which enriches metadata and sends logs to Sumo Logic.
It’s assumed that you are using the latest helm chart version. If not, upgrade using the instructions here.
Configure Metrics Collection
Follow the steps listed below to collect Memcached metrics from a Kubernetes environment.
- Set up Kubernetes Collection with the Telegraf Operator.
- On your Memcached Pods, add the following annotations:
 annotations:
    telegraf.influxdata.com/class: sumologic-prometheus
    prometheus.io/scrape: "true"
    prometheus.io/port: "9273"
    telegraf.influxdata.com/inputs: |+
  servers = ["localhost:11211"]
  [inputs.memcached.tags]
    environment ="dev_ENV_TO_BE_CHANGED"
    component ="database"
    db_system ="memcached"
    db_cluster ="memcached_on_k8s_ENV_TO_BE_CHANGED"
    db_cluster_address = "ENV_TO_BE_CHANGED"
    db_cluster_port = "ENV_TO_BE_CHANGED"
- Enter in values for the following parameters (marked
ENV_TO_BE_CHANGEDabove):telegraf.influxdata.com/inputs. This contains the required configuration for the Telegraf Memcached Input plugin. Please refer to this doc for more information on configuring the Memcached input plugin for Telegraf. Note: As telegraf will be run as a sidecar the host should always be localhost.- In the input plugins section (
[[inputs.memcached]]):servers. An array of addresses to gather stats about. Specify an IP on the hostname. Please see this doc for more information on additional parameters for configuring the Memcached input plugin for Telegraf.
- In the tags section (
[inputs.memcached.tags]):environment. This is the deployment environment where the Memcached cluster identified by the value of servers resides. For example: dev, prod or qa. While this value is optional we highly recommend setting it.db_cluster. Enter a name to identify this Memcached cluster. This cluster name will be shown in the Sumo Logic dashboards.db_cluster_address. Enter the cluster hostname or ip address that is used by the application to connect to the database. It could also be the load balancer or proxy endpoint.db_cluster_port. Enter the database port. If not provided, a default port will be used.
db_cluster_address and db_cluster_port should reflect the exact configuration of DB client configuration in your application, especially if you instrument it with OT tracing. The values of these fields should match exactly the connection string used by the database client (reported as values for net.peer.name and net.peer.port metadata fields).
For example, if your application uses “memcached-prod.sumologic.com:3306” as the connection string, the field values should be set as follows: db_cluster_address=memcached-prod.sumologic.com db_cluster_port=3306.
If your application connects directly to a given Memcached node, rather than the whole cluster, use the application connection string to override the value of the “host” field in the Telegraf configuration: host=memcached-prod.sumologic.com
Pivoting to Tracing data from Entity Inspector is possible only for “Memcached address” Entities.
- Do not modify the following values set by this configuration as it will cause the Sumo Logic app to not function correctly.
telegraf.influxdata.com/class: sumologic-prometheus. This instructs the Telegraf operator what output to use. This should not be changed.prometheus.io/scrape: "true". This ensures our Prometheus will scrape the metrics.prometheus.io/port: "9273". This tells prometheus what ports to scrape on. This should not be changed.telegraf.influxdata.com/inputs- In the tags section,
[inputs.memcached.tags]:component: “database”. This value is used by Sumo Logic apps to identify application components.db_system: “memcached”. This value identifies the database system.
- For all other parameters, see this doc for more parameters that can be configured in the Telegraf agent globally.
- Sumo Logic Kubernetes collection will automatically start collecting metrics from the pods having the labels and annotations defined in the previous step.
- Verify metrics in Sumo Logic.
Configure Logs Collection
This section explains the steps to collect Memcached logs from a Kubernetes environment.
-
Add labels on your Memcached pods to capture logs from standard output (recommended method).
- Apply the following labels to the Memcached pods:
environment: "prod_ENV_TO_BE_CHANGED"
component: "database"
db_system: "memcached"
db_cluster: "memcached_on_k8s_ENV_TO_BE_CHANGED"
db_cluster_address = "ENV_TO_BE_CHANGED"
db_cluster_port = "ENV_TO_BE_CHANGED"- Enter in values for the following parameters:
environment. This is the deployment environment where the Memcached cluster identified by the value of servers resides. For example dev, prod, or QA. While this value is optional we highly recommend setting it.db_cluster. Enter a name to identify this Memcached cluster. This cluster name will be shown in the Sumo Logic dashboards.db_cluster_address. Enter the cluster hostname or ip address that is used by the application to connect to the database. It could also be the load balancer or proxy endpoint.db_cluster_port. Enter the database port. If not provided, a default port will be used.
notedb_cluster_addressanddb_cluster_portshould reflect the exact configuration of DB client configuration in your application, especially if you instrument it with OT tracing. The values of these fields should match exactly the connection string used by the database client (reported as values for net.peer.name and net.peer.port metadata fields).For example, if your application uses “memcached-prod.sumologic.com:3306” as the connection string, the field values should be set as follows:
db_cluster_address=memcached-prod.sumologic.com db_cluster_port=3306.If your application connects directly to a given Memcached node, rather than the whole cluster, use the application connection string to override the value of the “host” field in the Telegraf configuration:
host=memcached-prod.sumologic.com.Pivoting to Tracing data from Entity Inspector is possible only for “Memcached address” Entities.
- Do not modify the following values as it will cause the Sumo Logic app to not function correctly.
component: “database”. This value is used by Sumo Logic apps to identify application components.db_system: “memcached”. This value identifies the database system.- See this doc for more parameters that can be configured in the Telegraf agent globally.
- The Sumologic-Kubernetes-Collection will automatically capture the logs from stdout and will send the logs to Sumologic. For more information on deploying Sumologic-Kubernetes-Collection, visit here.
- Verify logs in Sumo Logic.
-
Collecting Memcached Logs from a Log File (Optional). If your Memcached chart/pod is writing its logs to log files, you can use a sidecar to send log files to standard out. To do this:
- Install the Sumo Logic tailing sidecar operator.
- Add the following annotation in addition to the existing annotations.
annotations:
  tailing-sidecar: sidecarconfig;<mount>:<path_of_Memcached_log_file>/<Memcached_log_file_name>
Example:
annotations:
tailing-sidecar: sidecarconfig;data:/var/bitnami/memcached/logs/memcached.log- Make sure that the Memcached pods are running and annotations are applied by using the command:
kubectl describe pod <Memcached_pod_name>- Sumo Logic Kubernetes collection will automatically start collecting logs from the pods having the annotations defined above.
FER to normalize the fields in Kubernetes environments. Labels created in Kubernetes environments automatically are prefixed with pod_labels. To normalize these for our app to work, a Field Extraction Rule named AppObservabilityMemcachedDatabaseFER is automatically created for Database Application Components.
In non-Kubernetes environments, we use the Telegraf operator for Memcached metric collection and Sumo Logic Installed Collector for collecting Memcached logs. The diagram below illustrates the components of the Memcached collection in a non-Kubernetes environment. 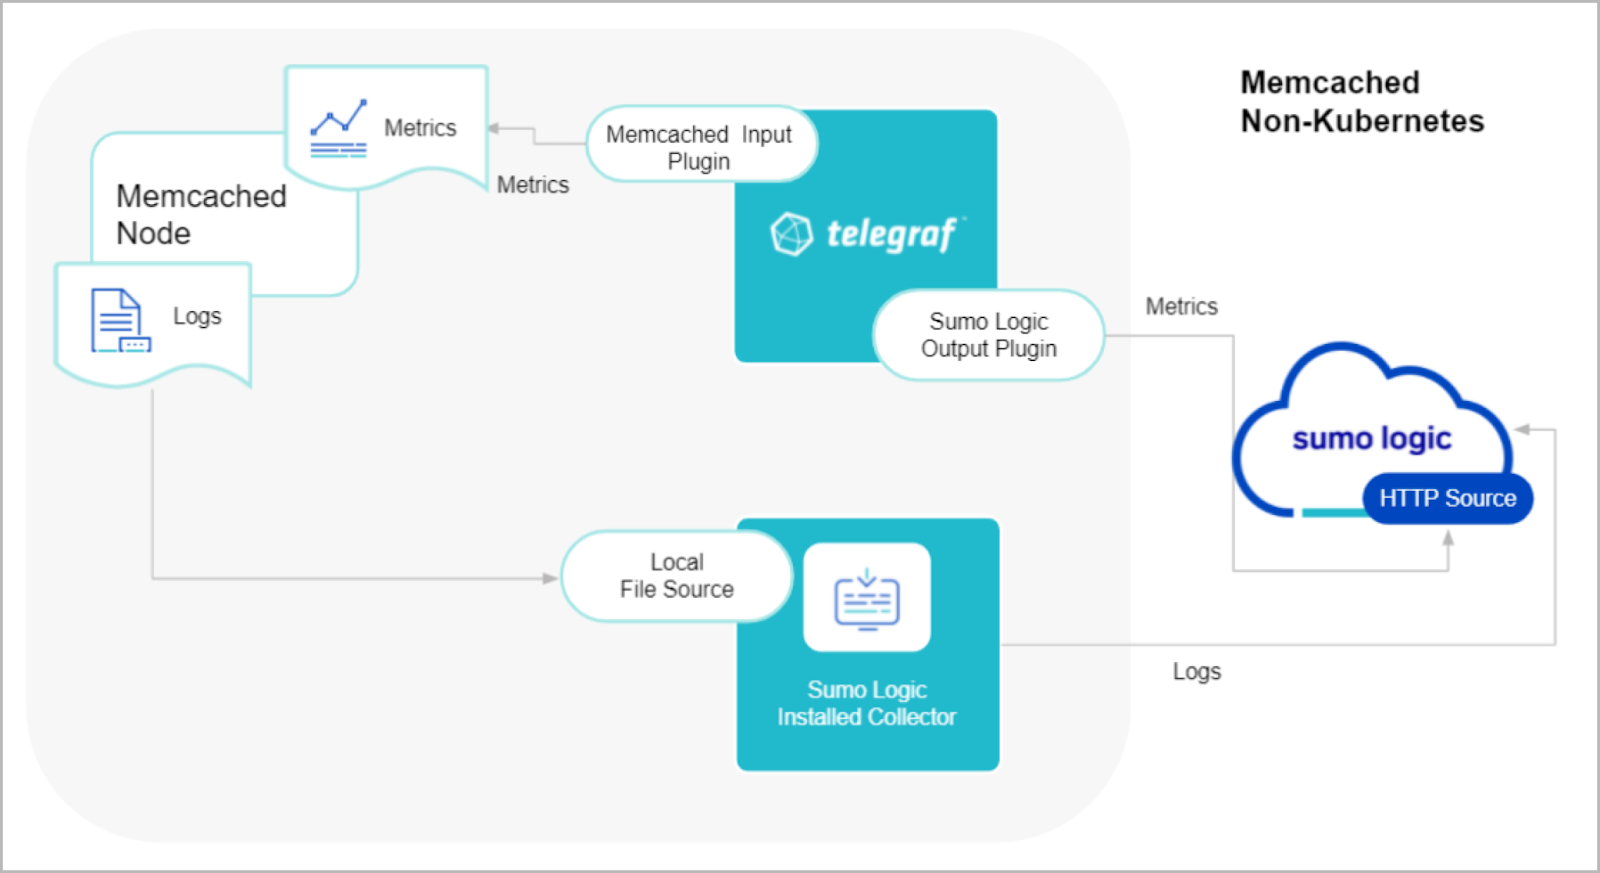
Telegraf runs on the same system as Memcached and uses the Memcached input plugin to obtain Memcached metrics. The Sumo Logic output plugin to send the metrics to Sumo Logic. Logs from Memcached on the other hand are sent to a Sumo Logic Local File source.
This section provides instructions for configuring logs and metrics collection for the Sumo Logic app for Memcached. Follow the below instructions to set up the logs and metrics collection:
Configure Metrics Collection
- Configure a Hosted Collector. To create a new Sumo Logic hosted collector, perform the steps in the Configure a Hosted Collector section of the Sumo Logic documentation.
- Configure an HTTP Logs and Metrics Source. Create a new HTTP Logs and Metrics Source in the hosted collector created above by following these instructions. Make a note of the HTTP Source URL.
- Install Telegraf using the following steps to install Telegraf.
- Configure and start Telegraf. As part of collecting metrics data from Telegraf, we will use the Memcached input plugin to get data from Telegraf and the Sumo Logic output plugin to send data to Sumo Logic. Create or modify
telegraf.confand copy and paste the text below:
 servers = ["localhost:11211"]
  [inputs.memcached.tags]
    environment ="dev_ENV_TO_BE_CHANGED"
    component ="database"
    db_system ="memcached"
    db_cluster="memcached_on_premise_ENV_TO_BE_CHANGED"
    db_cluster_address = "ENV_TO_BE_CHANGED"
    db_cluster_port = "ENV_TO_BE_CHANGED"
    url = "<URL Created in Step 3_ENV_TO_BE_CHANGED>"
    data_format = "prometheus"
- Please enter values for the following parameters (marked in
ENV_TO_BE_CHANGEDabove):
- In the input plugins section (
[[inputs.memcached]]):-
servers. An array of addresses to gather stats about. Specify an IP on hostname. Please see this doc for more information on additional parameters for configuring the Memcached input plugin for Telegraf. -
In the tags section (
[inputs.memcached.tags]):environment. This is the deployment environment where the Memcached cluster identified by the value of servers resides. For example: dev, prod or qa. While this value is optional we highly recommend setting it.db_cluster. Enter a name to identify this Memcached cluster. This cluster name will be shown in the Sumo Logic dashboards.db_cluster_address. Enter the cluster hostname or IP address that is used by the application to connect to the database. It could also be the load balancer or proxy endpoint.db_cluster_port. Enter the database port. If not provided, a default port will be used.
notedb_cluster_addressanddb_cluster_portshould reflect the exact configuration of DB client configuration in your application, especially if you instrument it with OT tracing. The values of these fields should match exactly the connection string used by the database client (reported as values for net.peer.name and net.peer.port metadata fields).For example, if your application uses
“memcached-prod.sumologic.com:3306”as the connection string, the field values should be set as follows:db_cluster_address=memcached-prod.sumologic.com db_cluster_port=3306If your application connects directly to a given memcached node, rather than the whole cluster, use the application connection string to override the value of the “host” field in the Telegraf configuration:
host=memcached-prod.sumologic.comPivoting to Tracing data from Entity Inspector is possible only for “Memcached address” Entities.
-
- In the output plugins section (
[[outputs.sumologic]]):url. This is the HTTP source URL created in step 3. Please see this doc for more information on additional parameters for configuring the Sumo Logic Telegraf output plugin.
- Do not modify the following values set by this Telegraf configuration as it will cause the Sumo Logic app to not function correctly.
data_format - “prometheus”in the output plugins section. Metrics are sent in the Prometheus format to Sumo Logiccomponent: “database”in the input plugins section. This value is used by Sumo Logic apps to identify application components.
- For all other parameters, see this doc for more parameters that can be configured in the Telegraf agent globally.
- Once you have finalized your
telegraf.conffile, you can start or reload the Telegraf service using instructions from the doc.
At this point, Memcached metrics should start flowing into Sumo Logic.
Configure Logs Collection
This section provides instructions for configuring log collection for Memcached running on a non-Kubernetes environment for the Sumo Logic app for Memcached.
By default, Memcached logs are stored in a log file. Local log files can be collected via Installed collectors. An Installed collector will require you to allow outbound traffic to Sumo Logic endpoints for collection to work. For detailed requirements for Installed collectors, see this page.
- Configure logging in Memcached. By default, the installation of Memcached will not write any request logs to disk. To add a log file for Memcached, you can use the following syntax:
memcached -d -m 3072 -l localhost -p 11211 -u nobody -v 2>>/var/log/memcached/memcached.log
Or, if you’re on RHEL/CentOS, you can edit the file /etc/sysconfig/memcached like so:
PORT="11211"
USER="memcached"
MAXCONN="3048"
CACHESIZE="256"
OPTIONS="-vv >> /var/log/memcached/memcached.log 2>&1"
Save the file and restart Memcached. 2. Configuring a Collector To collect logs directly from the Memcached machine, configure an Installed Collector. 3. Configuring a Source To collect logs directly from your Memcached machine, use an Installed Collector and a Local File Source.
- Add a Local File Source.
- Configure the Local File Source fields as follows:
-
Name. (Required)
-
Description. (Optional)
-
File Path (Required). Enter the path to your error.log or access.log. The files are typically located in
/var/log/memcached/memcached.log. If you're using a customized path, check theMemcached.conffile for this information. -
Source Host. Sumo Logic uses the hostname assigned by the OS unless you enter a different hostname
-
Source Category. Enter any string to tag the output collected from this Source, such as Memcached/Logs. (The Source Category metadata field is a fundamental building block to organize and label Sources. For details, see Best Practices.
-
Fields. Set the following fields:
component = databasedb_system = memcacheddb_cluster = <Your_Memcached_Cluster_Name>environment = <Environment_Name>, such as Dev, QA or Prod.db_cluster_address. Enter the cluster hostname or ip address that is used by the application to connect to the database. It could also be the load balancer or proxy endpoint.db_cluster_port. Enter the database port. If not provided, a default port will be used.
notedb_cluster_addressanddb_cluster_portshould reflect the exact configuration of DB client configuration in your application, especially if you instrument it with OT tracing. The values of these fields should match exactly the connection string used by the database client (reported as values fornet.peer.nameandnet.peer.portmetadata fields).For example, if your application uses
“memcached-prod.sumologic.com:3306”as the connection string, the field values should be set as follows:db_cluster_address=memcached-prod.sumologic.com db_cluster_port=3306.If your application connects directly to a given Memcached node, rather than the whole cluster, use the application connection string to override the value of the “host” field in the Telegraf configuration:
host=memcached-prod.sumologic.comPivoting to Tracing data from Entity Inspector is possible only for “Memcached address” Entities.
-
- Configure the Advanced section:
- Enable Timestamp Parsing. Select Extract timestamp information from log file entries.
- Time Zone. Choose the option, Ignore time zone from log file and instead use, and then select your Memcached Server’s time zone.
- Timestamp Format. The timestamp format is automatically detected.
- Encoding. Select UTF-8 (Default).
- Enable Multiline Processing. Detect messages spanning multiple lines
- Infer Boundaries - Detect message boundaries automatically
- Click Save.
At this point, Memcached logs should start flowing into Sumo Logic.
Installing the Memcached app
This section demonstrates how to install the Memcached app.
To install the app, do the following:
Next-Gen App: To install or update the app, you must be an account administrator or a user with Manage Apps, Manage Monitors, Manage Fields, Manage Metric Rules, and Manage Collectors capabilities depending upon the different content types part of the app.
- Select App Catalog.
- In the 🔎 Search Apps field, run a search for your desired app, then select it.
- Click Install App.
note
Sometimes this button says Add Integration.
- Click Next in the Setup Data section.
- In the Configure section of your respective app, complete the following fields.
- Is K8S deployment involved. Specify if resources being monitored are partially or fully deployed on Kubernetes (K8s)
- Click Next. You will be redirected to the Preview & Done section.
Post-installation
Once your app is installed, it will appear in your Installed Apps folder, and dashboard panels will start to fill automatically.
Each panel slowly fills with data matching the time range query received since the panel was created. Results will not immediately be available but will be updated with full graphs and charts over time.
As part of the app installation process, the following fields will be created by default:
componentenvironmentdb_systemdb_clusterpoddb_cluster_addressdb_cluster_port
Additionally, if you're using Memcached in the Kubernetes environment, the following additional fields will be created by default during the app installation process:
pod_labels_componentpod_labels_environmentpod_labels_db_systempod_labels_db_clusterpod_labels_db_cluster_addresspod_labels_db_cluster_port
For information on setting up fields, see Fields.
Viewing Memcached Dashboards
All dashboards have a set of filters that you can apply to the entire dashboard. Use these filters to drill down and examine the data to a granular level.
- You can change the time range for a dashboard or panel by selecting a predefined interval from a drop-down list, choosing a recently used time range, or specifying custom dates and times. Learn more.
- You can use template variables to drill down and examine the data on a granular level. For more information, see Filtering Dashboards with Template Variables.
- Most Next-Gen apps allow you to provide the scope at the installation time and are comprised of a key (
_sourceCategoryby default) and a default value for this key. Based on your input, the app dashboards will be parameterized with a dashboard variable, allowing you to change the dataset queried by all panels. This eliminates the need to create multiple copies of the same dashboard with different queries.
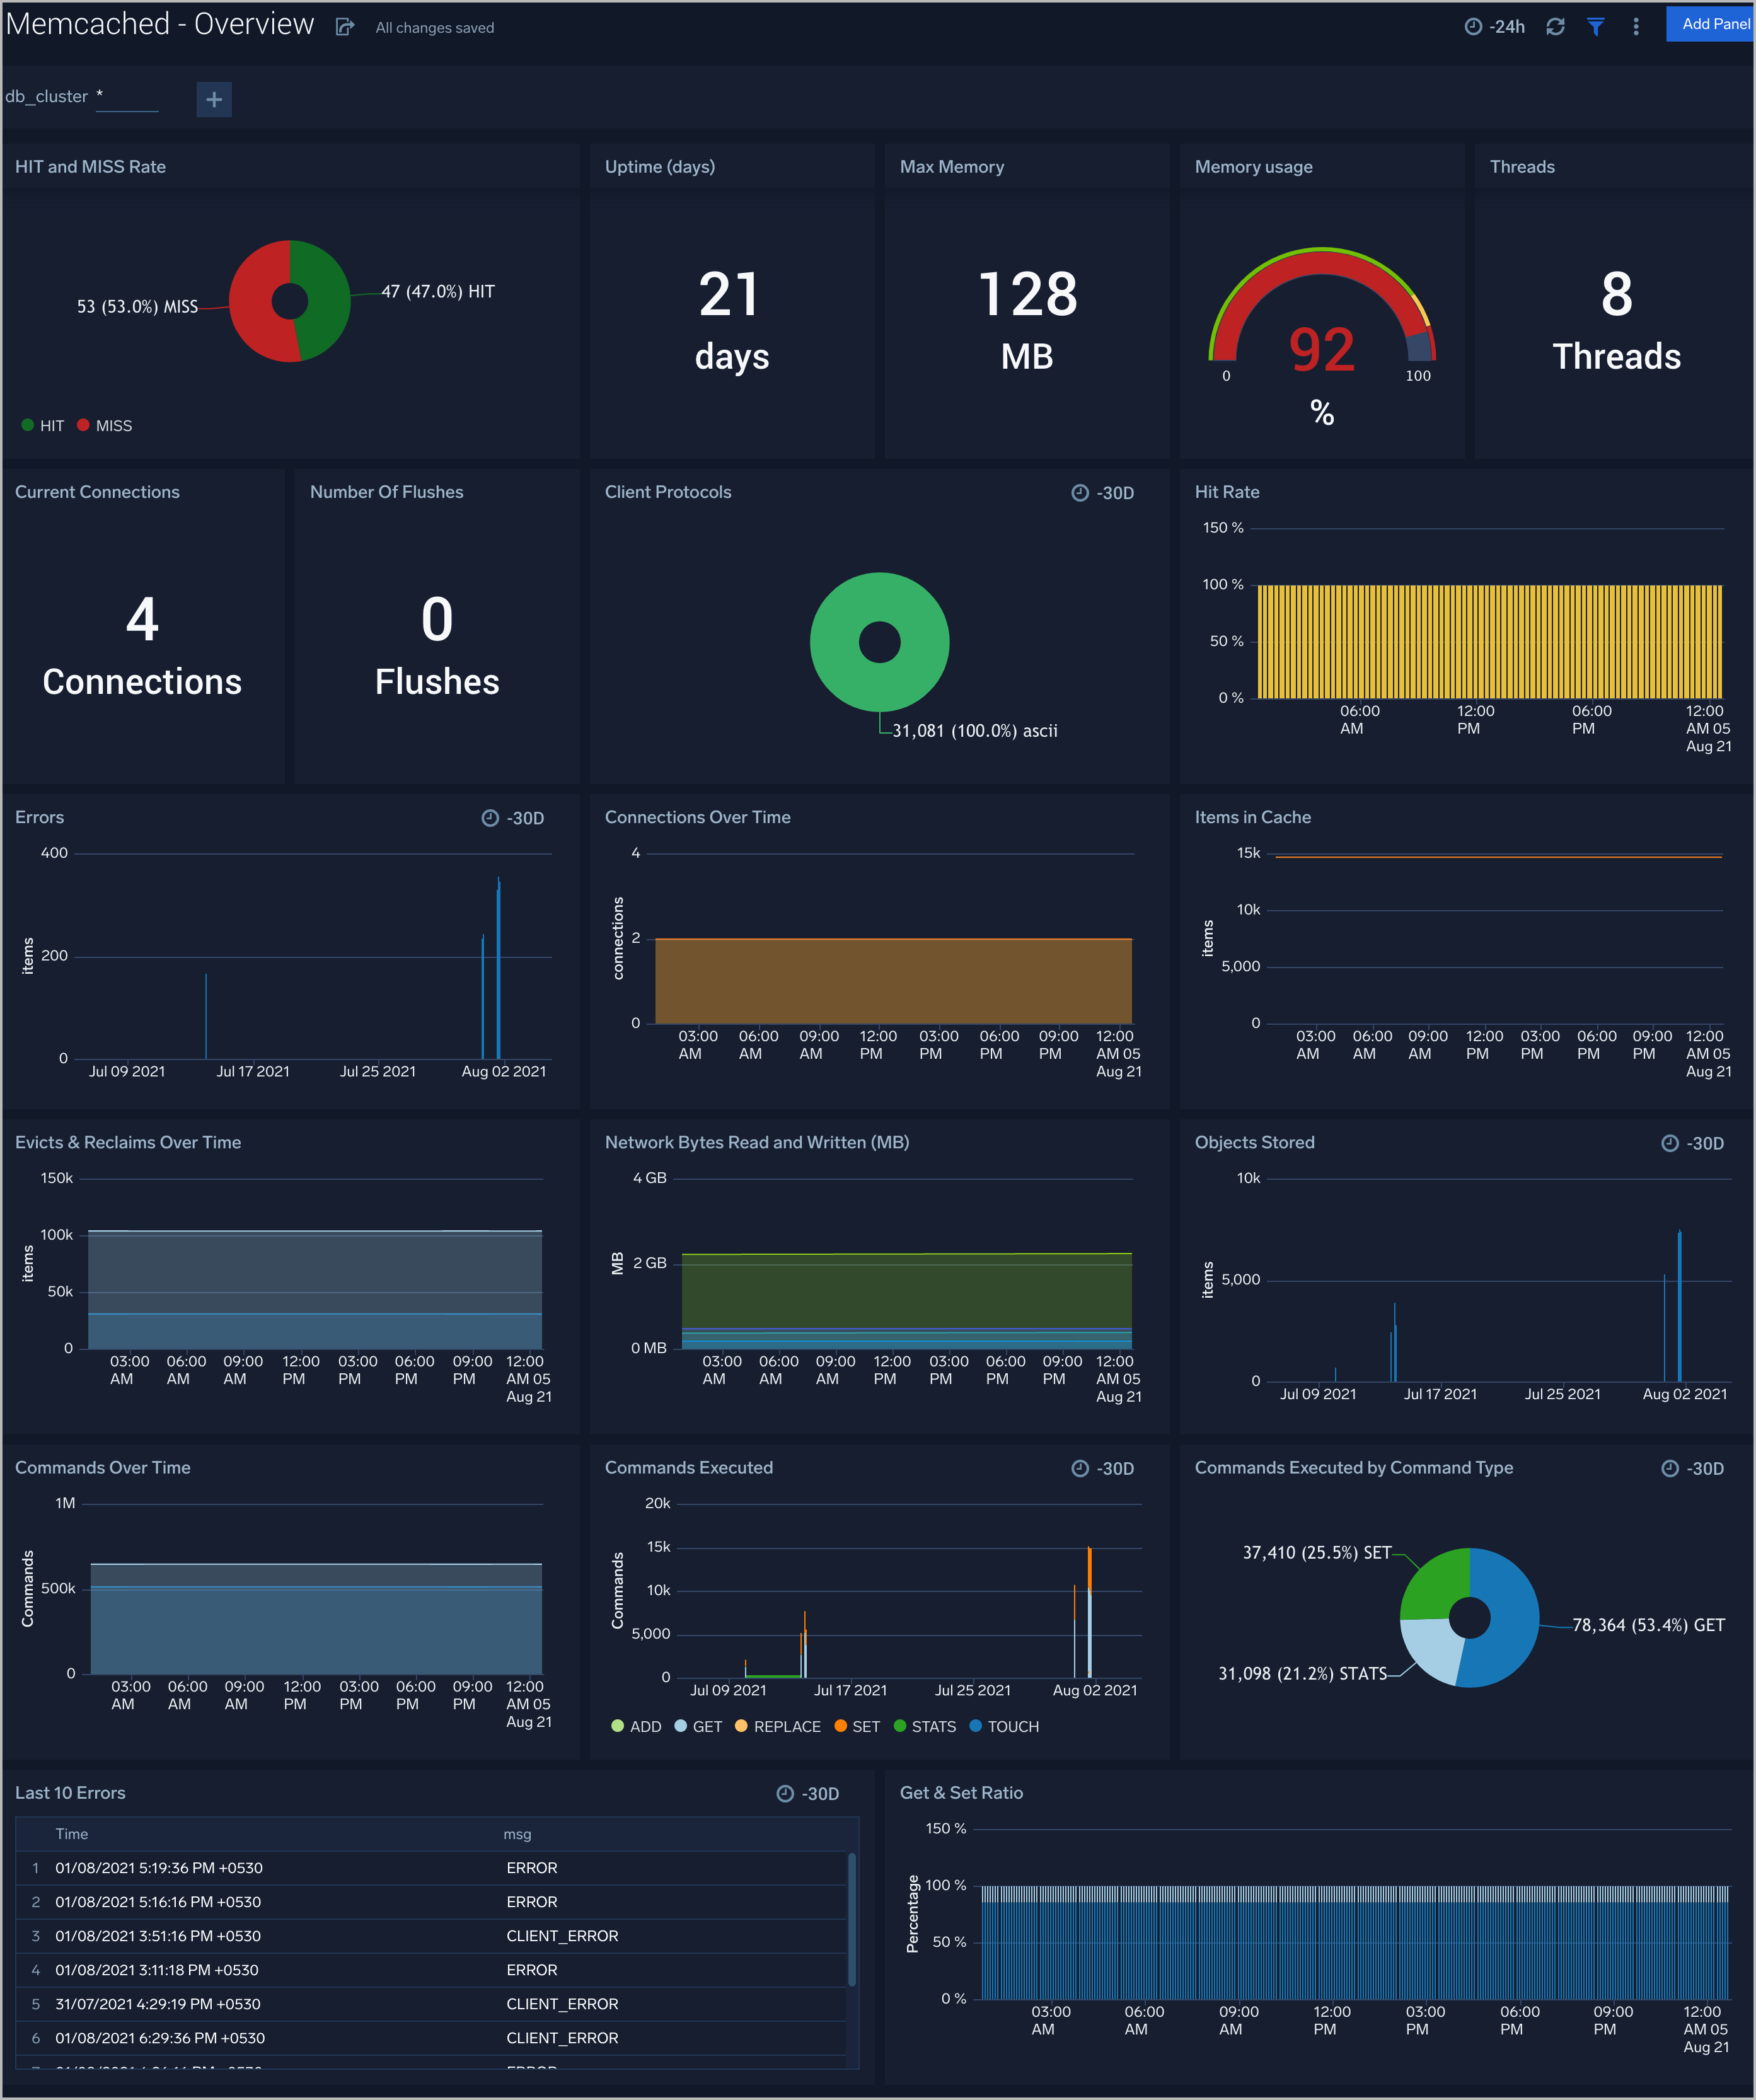
Overview
The Memcached - Overview dashboard provides an at-a-glance view of the Memcached server status, error logs, and database metrics.
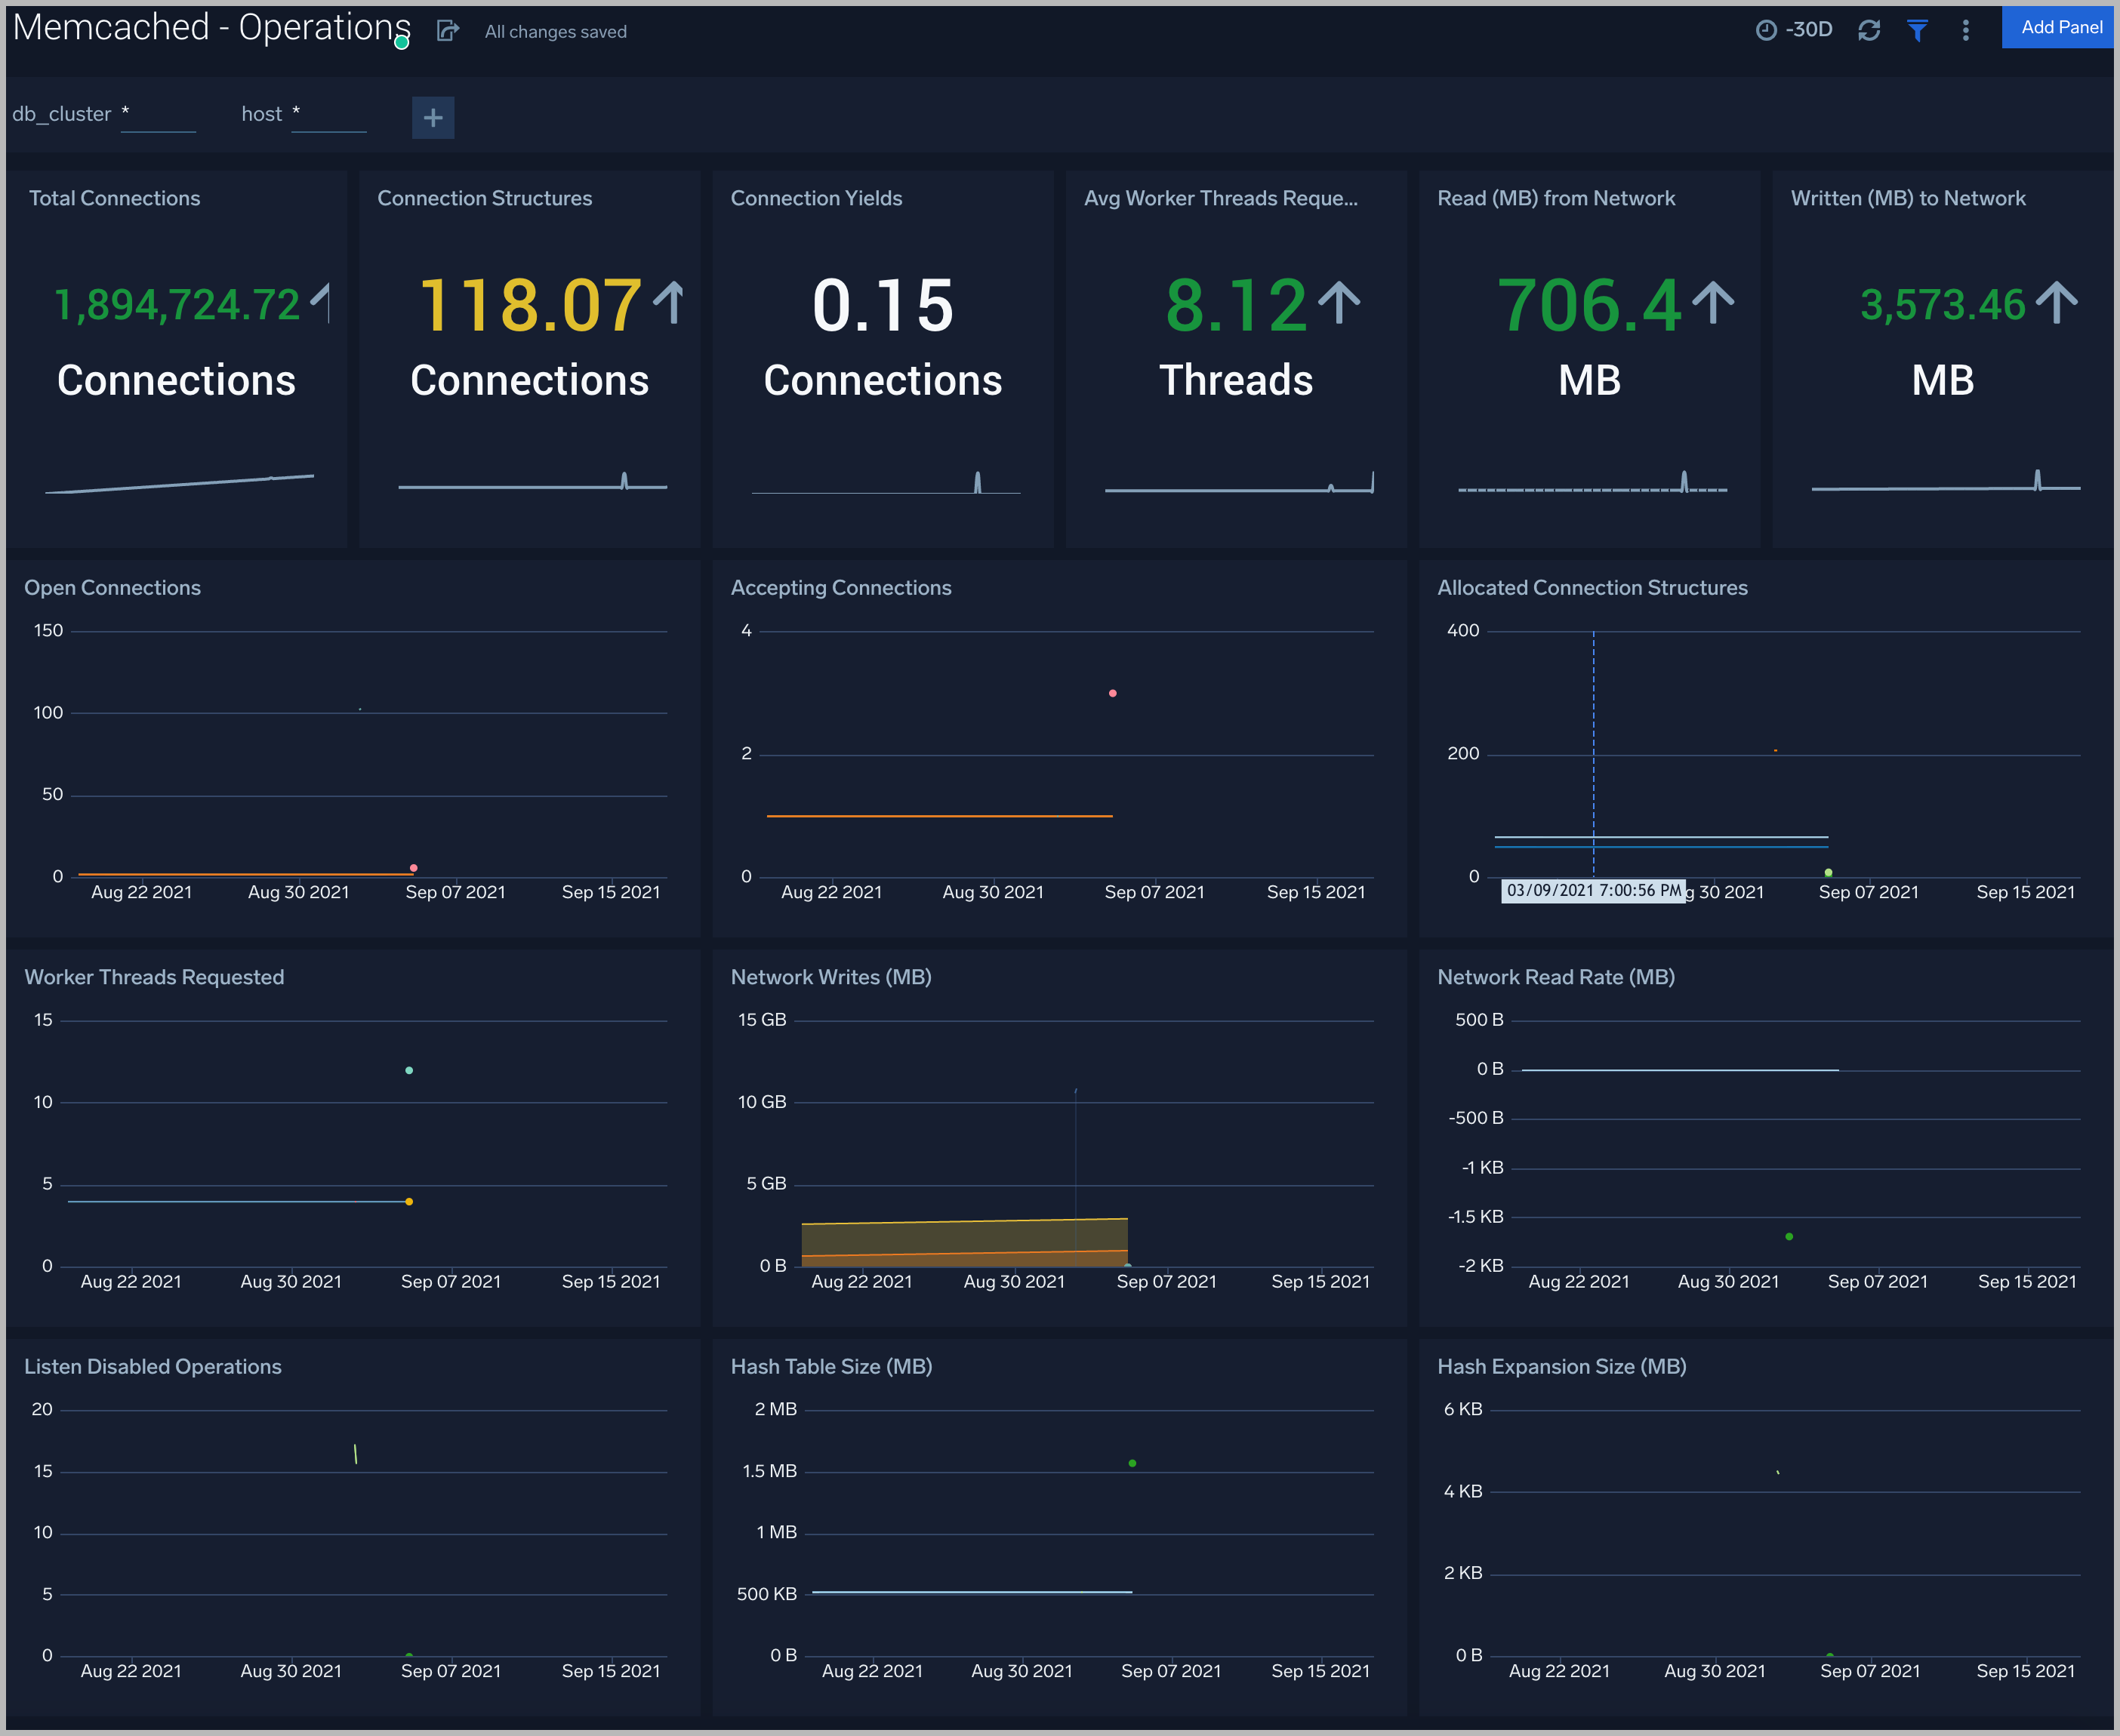
Operations
The Memcached - Operations Dashboard provides detailed analysis on connections, thread requested, network bytes, hash expansion size, table size.
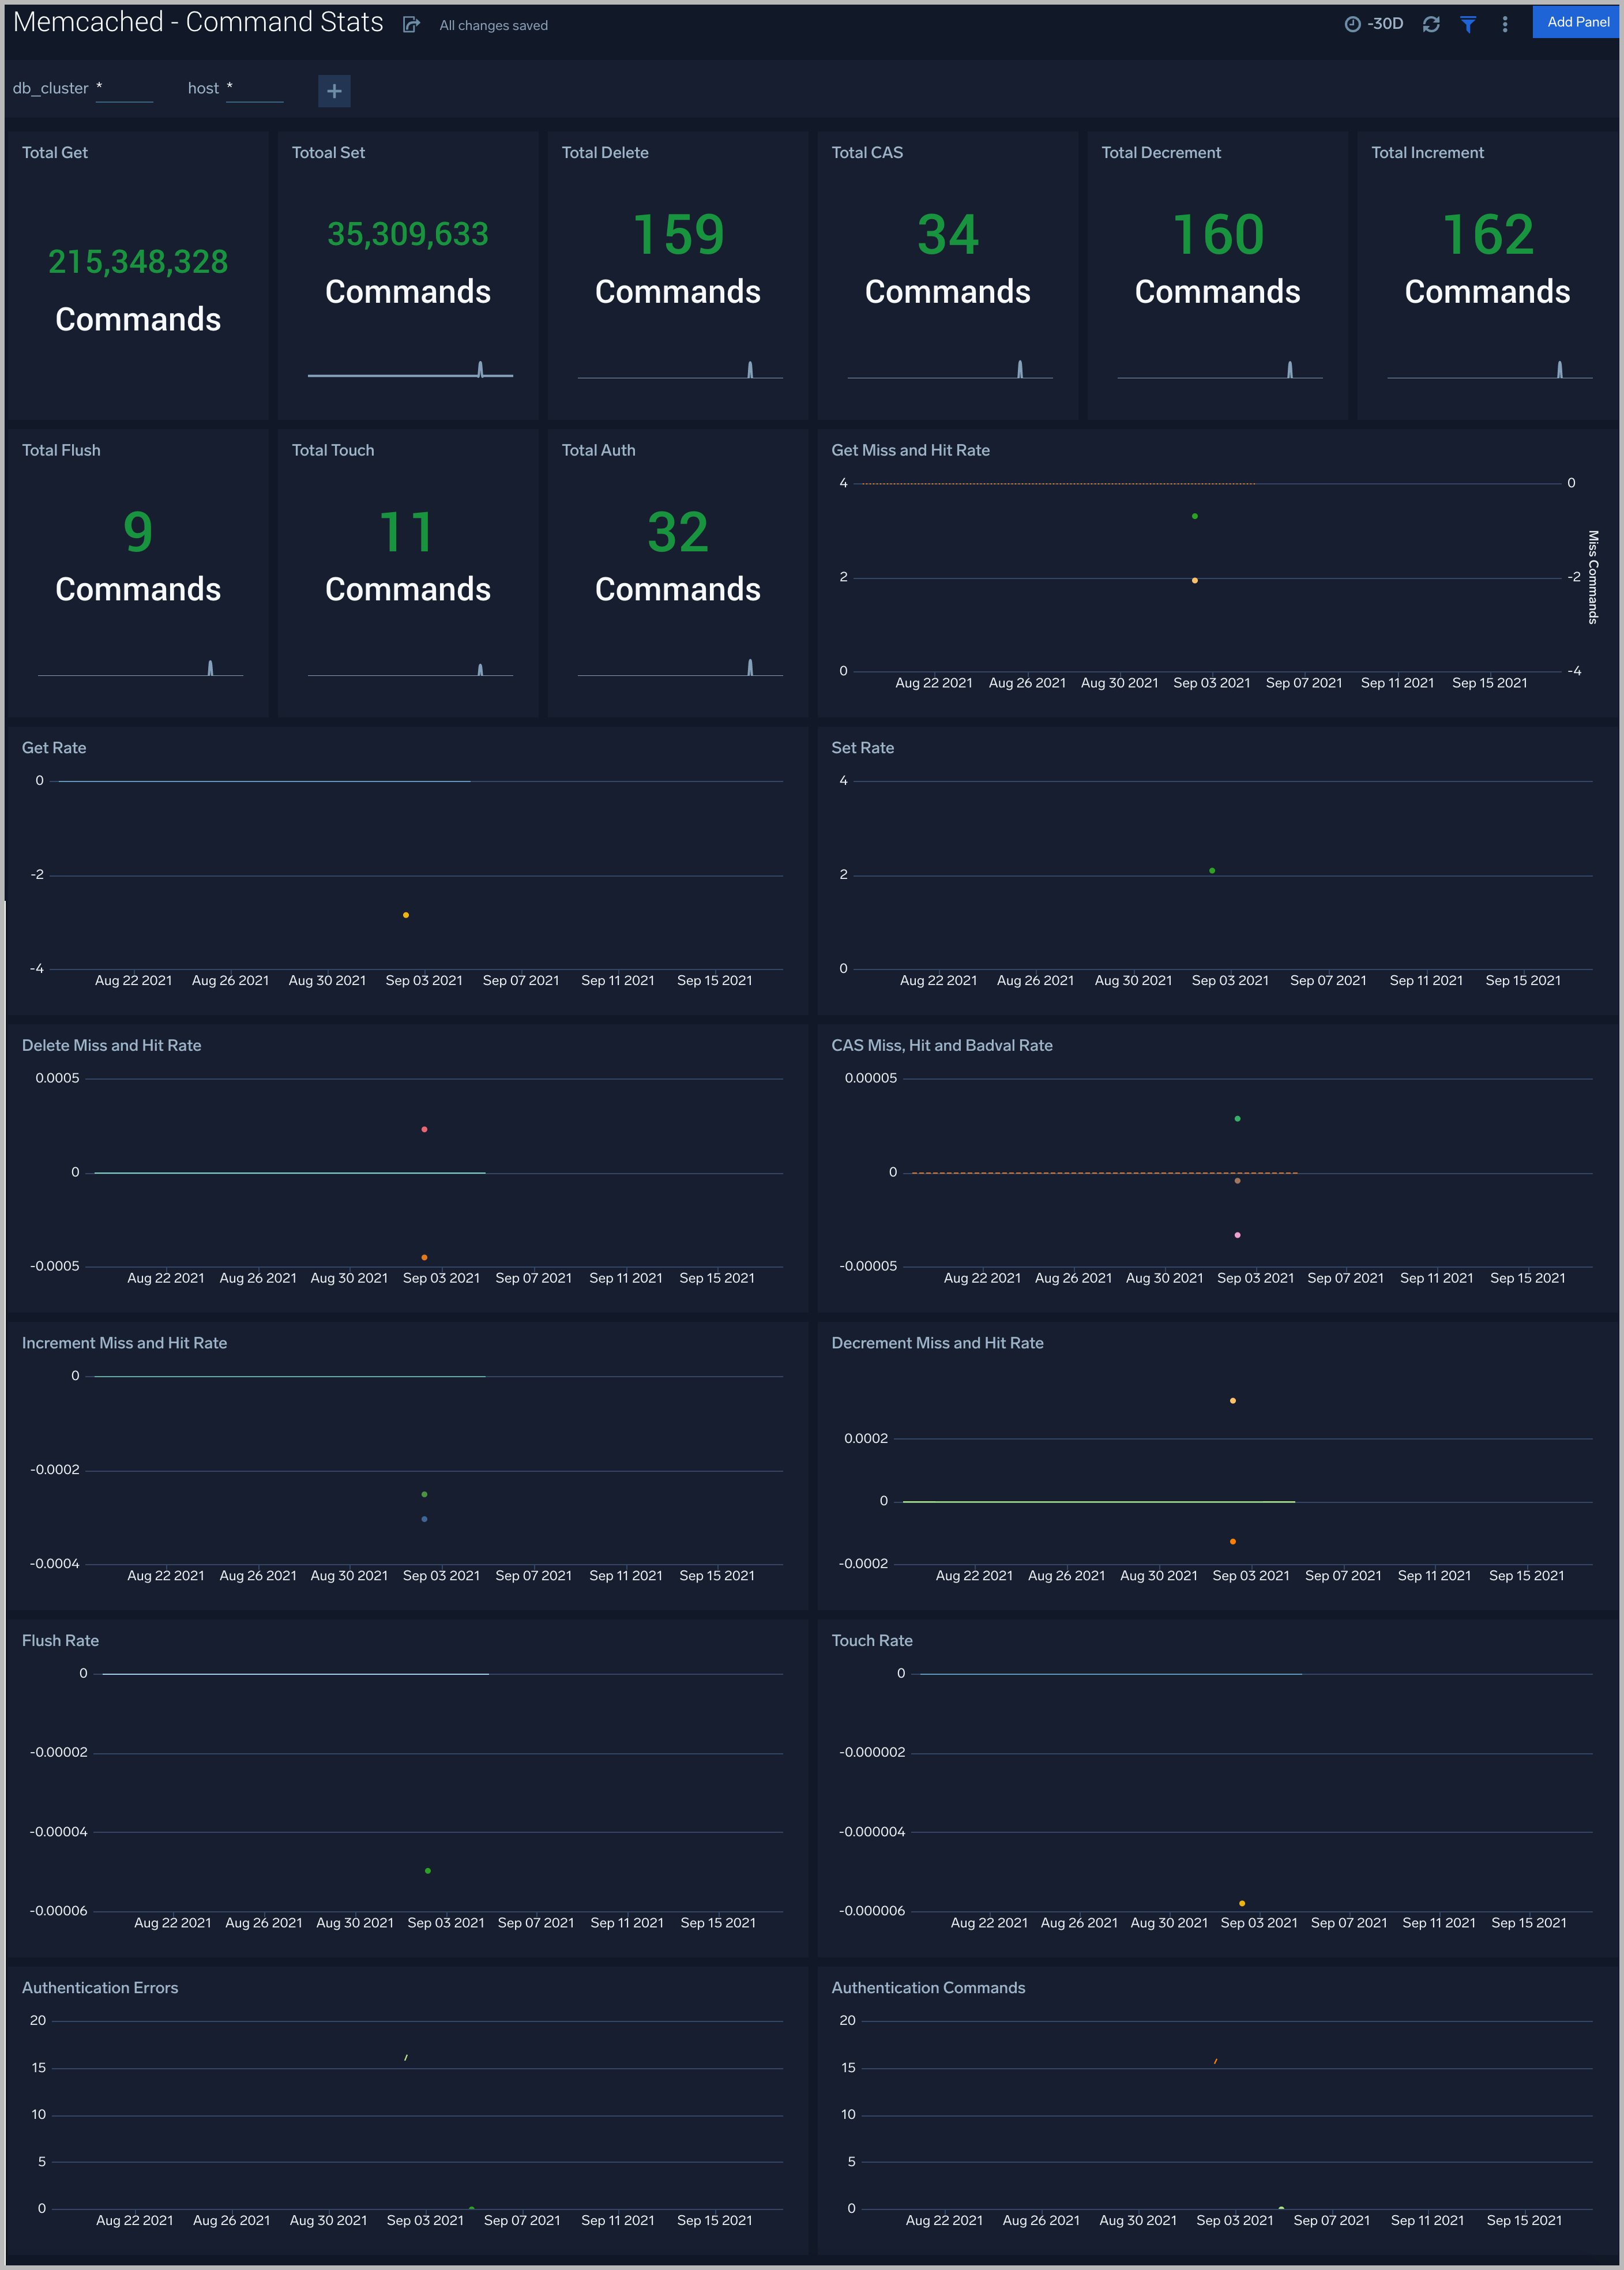
Command Stats
The Memcached - Command Stats dashboard provides detailed insights into the number of commands being performed.
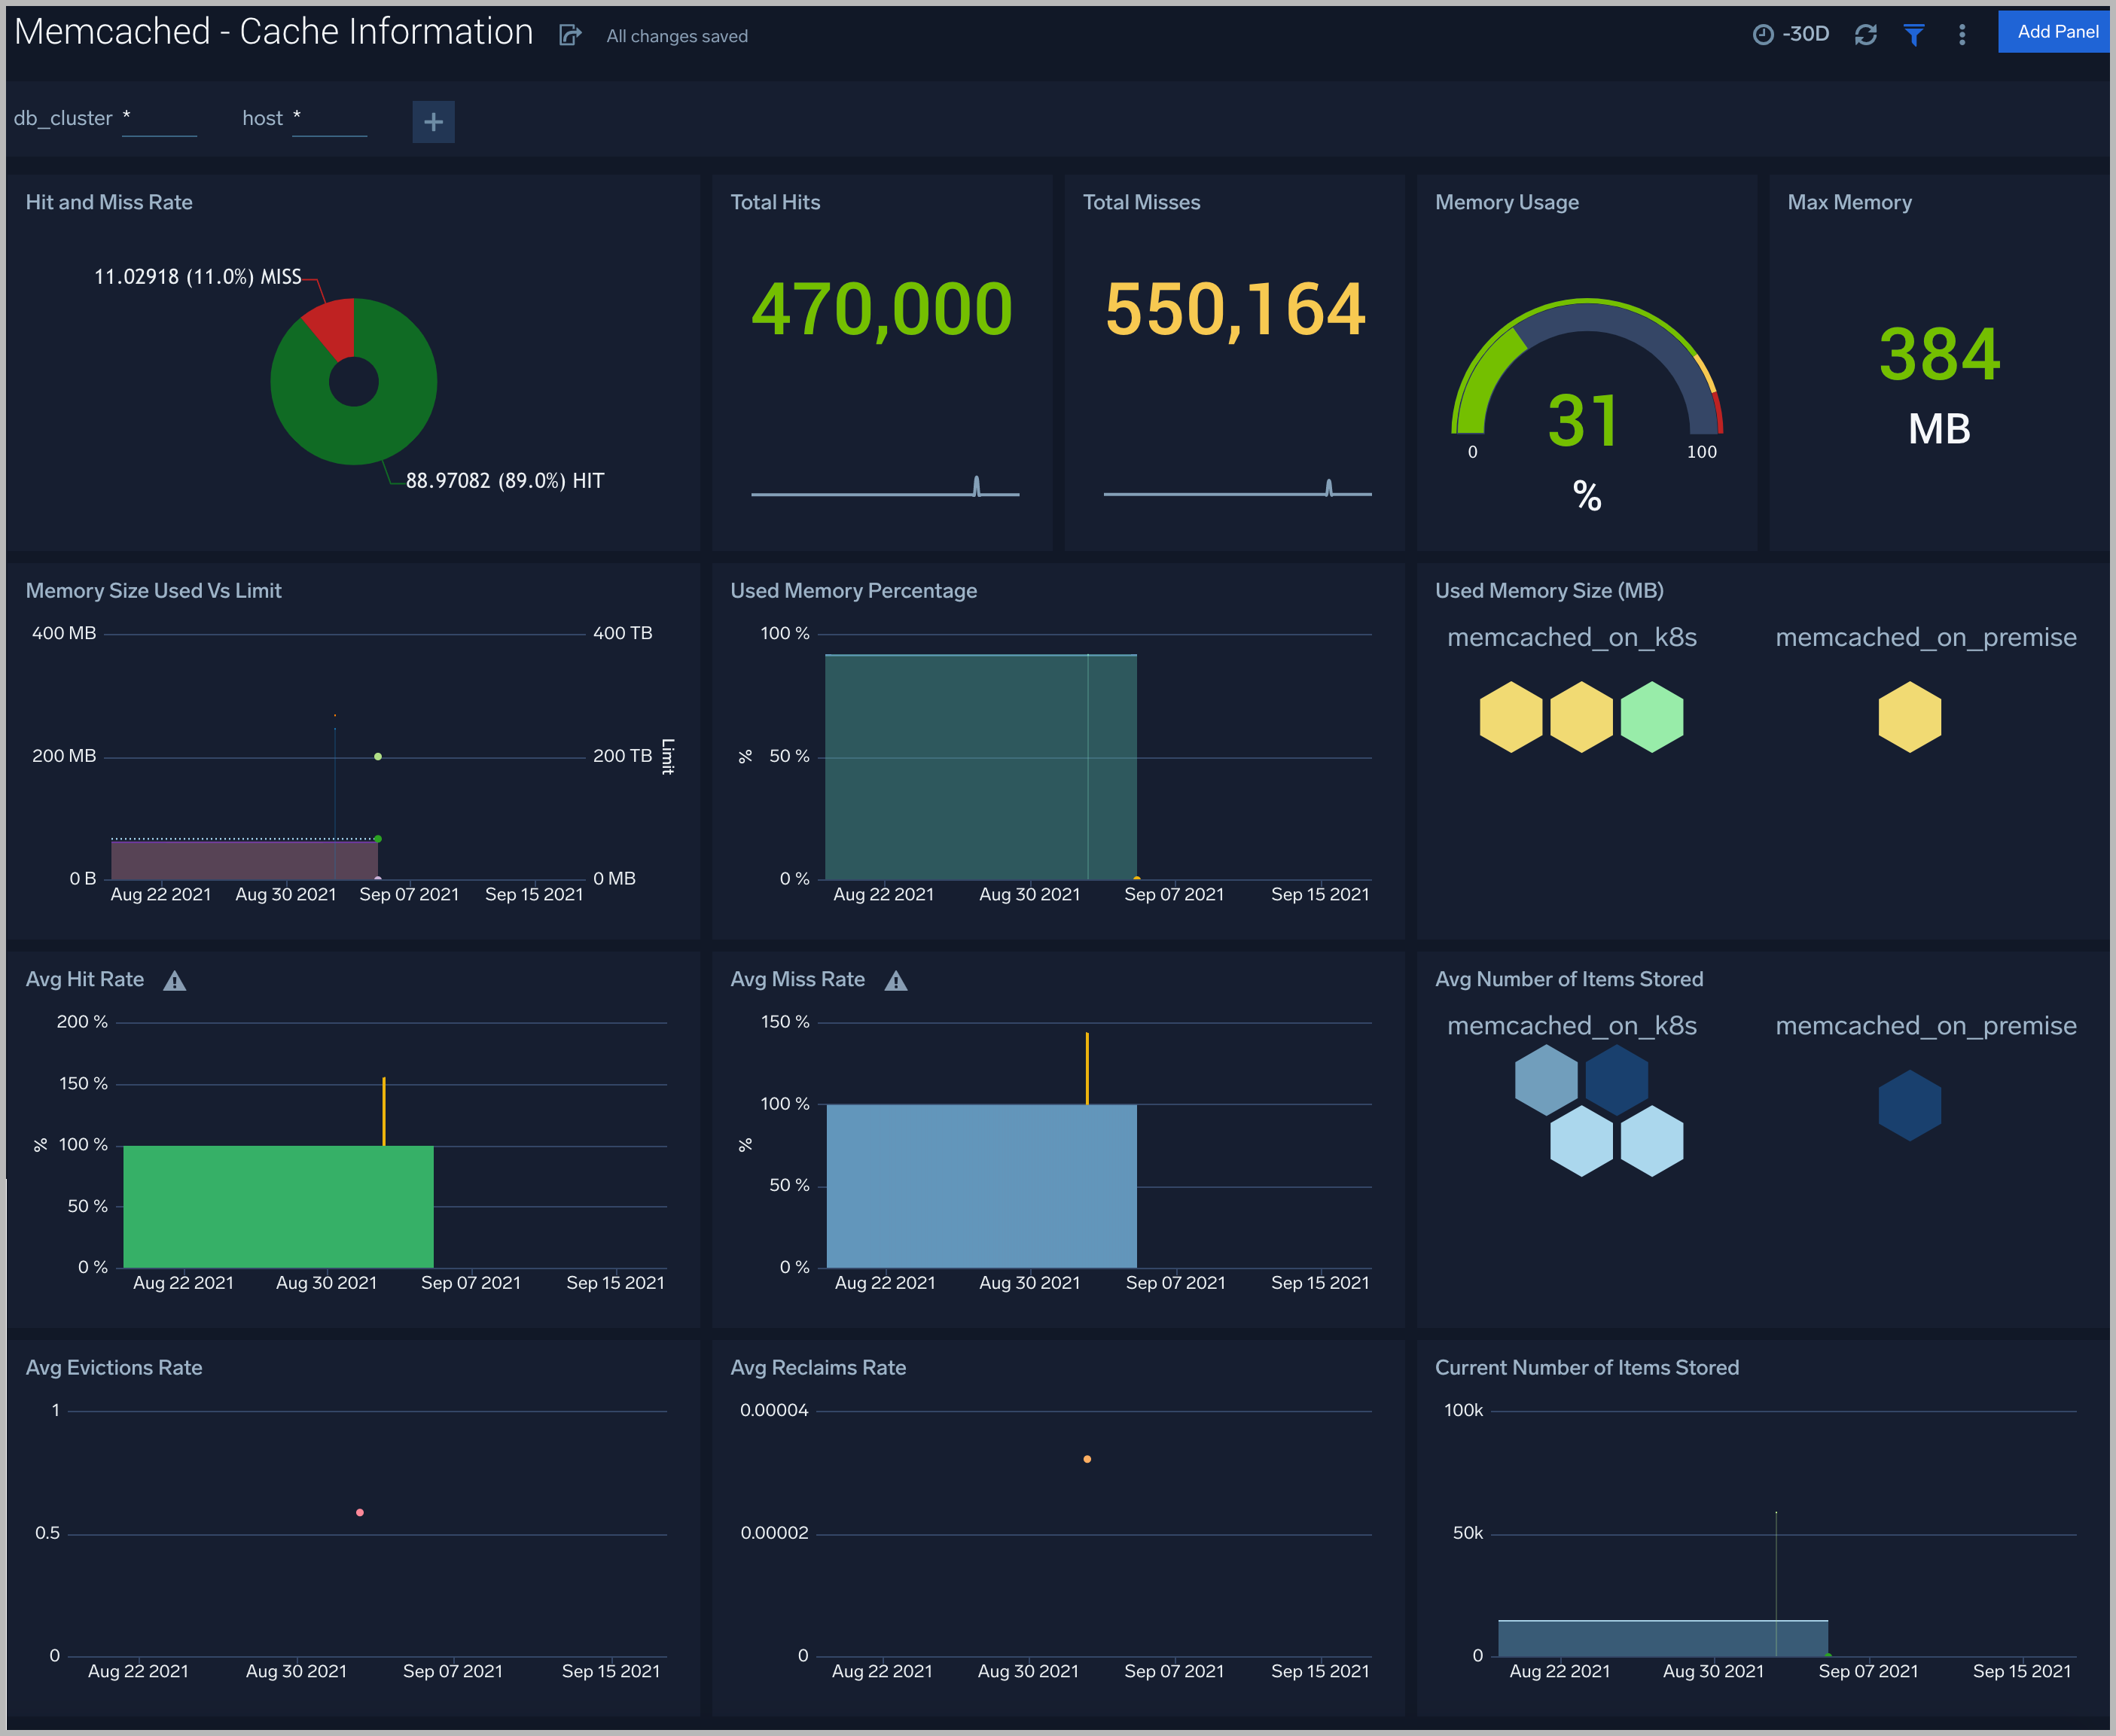
Cache Information
The Memcached - Cache Information dashboard provides insight into cache states, cache hit, and miss rate over time.
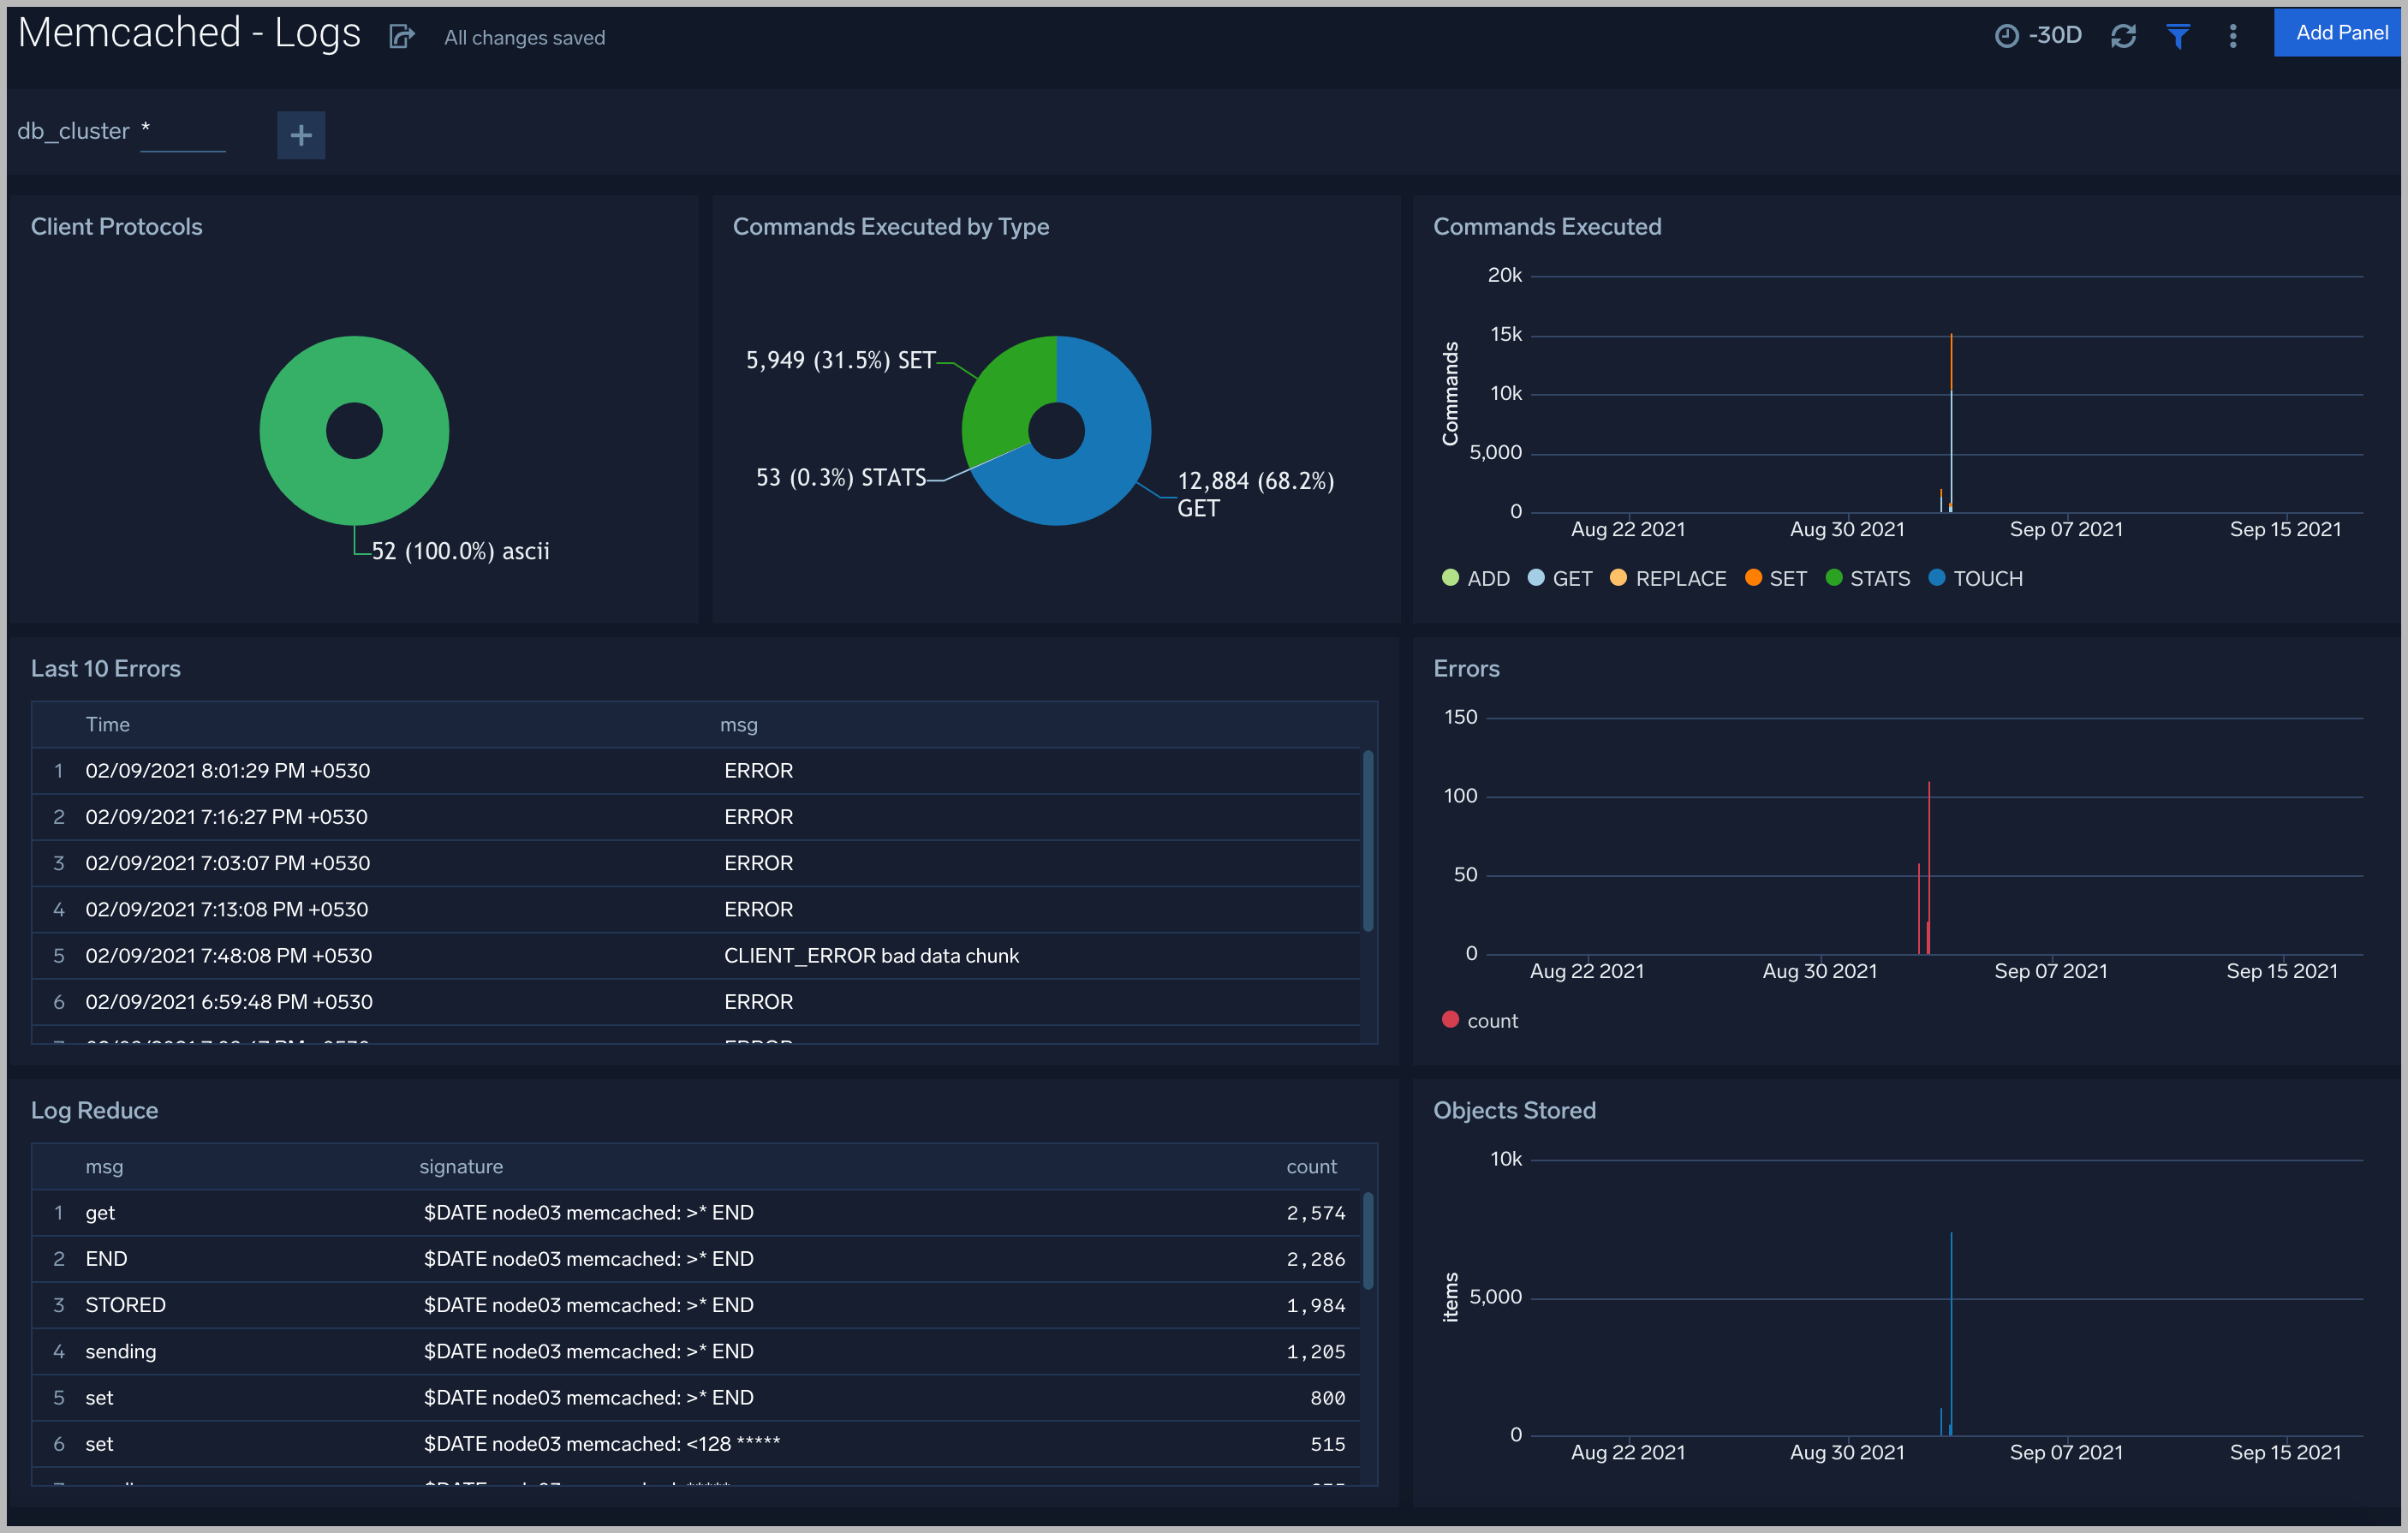
Logs
The Memcached - Logs dashboard helps you quickly analyze your Memcached error logs, commands executed, and objects stored.
Create monitors for Memcached app
From your App Catalog:
- From the Sumo Logic navigation, select App Catalog.
- In the Search Apps field, search for and then select your app.
- Make sure the app is installed.
- Navigate to What's Included tab and scroll down to the Monitors section.
- Click Create next to the pre-configured monitors. In the create monitors window, adjust the trigger conditions and notifications settings based on your requirements.
- Scroll down to Monitor Details.
- Under Location click on New Folder.
note
By default, monitor will be saved in the root folder. So to make the maintenance easier, create a new folder in the location of your choice.
- Enter Folder Name. Folder Description is optional.
tip
Using app version in the folder name will be helpful to determine the versioning for future updates.
- Click Create. Once the folder is created, click on Save.
Memcached alerts
| Alert Name | Alert Description | Trigger Type (Critical / Warning) | Alert Condition | Recover Condition |
| Memcached - Commands Error | This alert fires when we detect command errors. | Critical | > 0 | <= 0 |
| Memcached - Authentication Error | This alert fires when we detect authentication errors continuously for 5 mins | Warning | >0 | <= 0 |
| Memcached - Connection Yields | This alert fires when we detect yielded connections continuously for 5 mins | Warning | >5 | <= 5 |
| Memcached - High Memory Usage | This alert fires when the memory usage is more than 80%. | Warning | >80 | <= 80 |
| Memcached - Listen Disabled | This alert fires when new queued connections per minute > 5 | Warning | >5 | <=5 |
| Memcached - Cache Hit Ratio | The hit rate is one of the most important indicators of Memcached performance. A high hit rate means faster responses to your users. If the hit rate is falling, you need quick visibility into why. This alert gets fired low cache hit ratio is less than 50% | Critical | <=0.5 | >0.5 |
| Memcached - Current Connections | This alert gets fired when number of connected clients are 0. If current connections are none then something is wrong. | Critical | <=0 | >0 |
| Memcached - Uptime | This alert gets fires when uptime is < 180. You can use this to detect respawns. | Critical | <=180 | >180 |