Cassandra - OpenTelemetry Collector

The Cassandra app is a log and metrics-based app that helps you monitor the availability, performance, health, and resource utilization of your Cassandra clusters. The pre-configured dashboards provide insight into resource utilization, cache/Gossip/Memtable statistics, error and warnings, request served and latency, storage, and compaction.
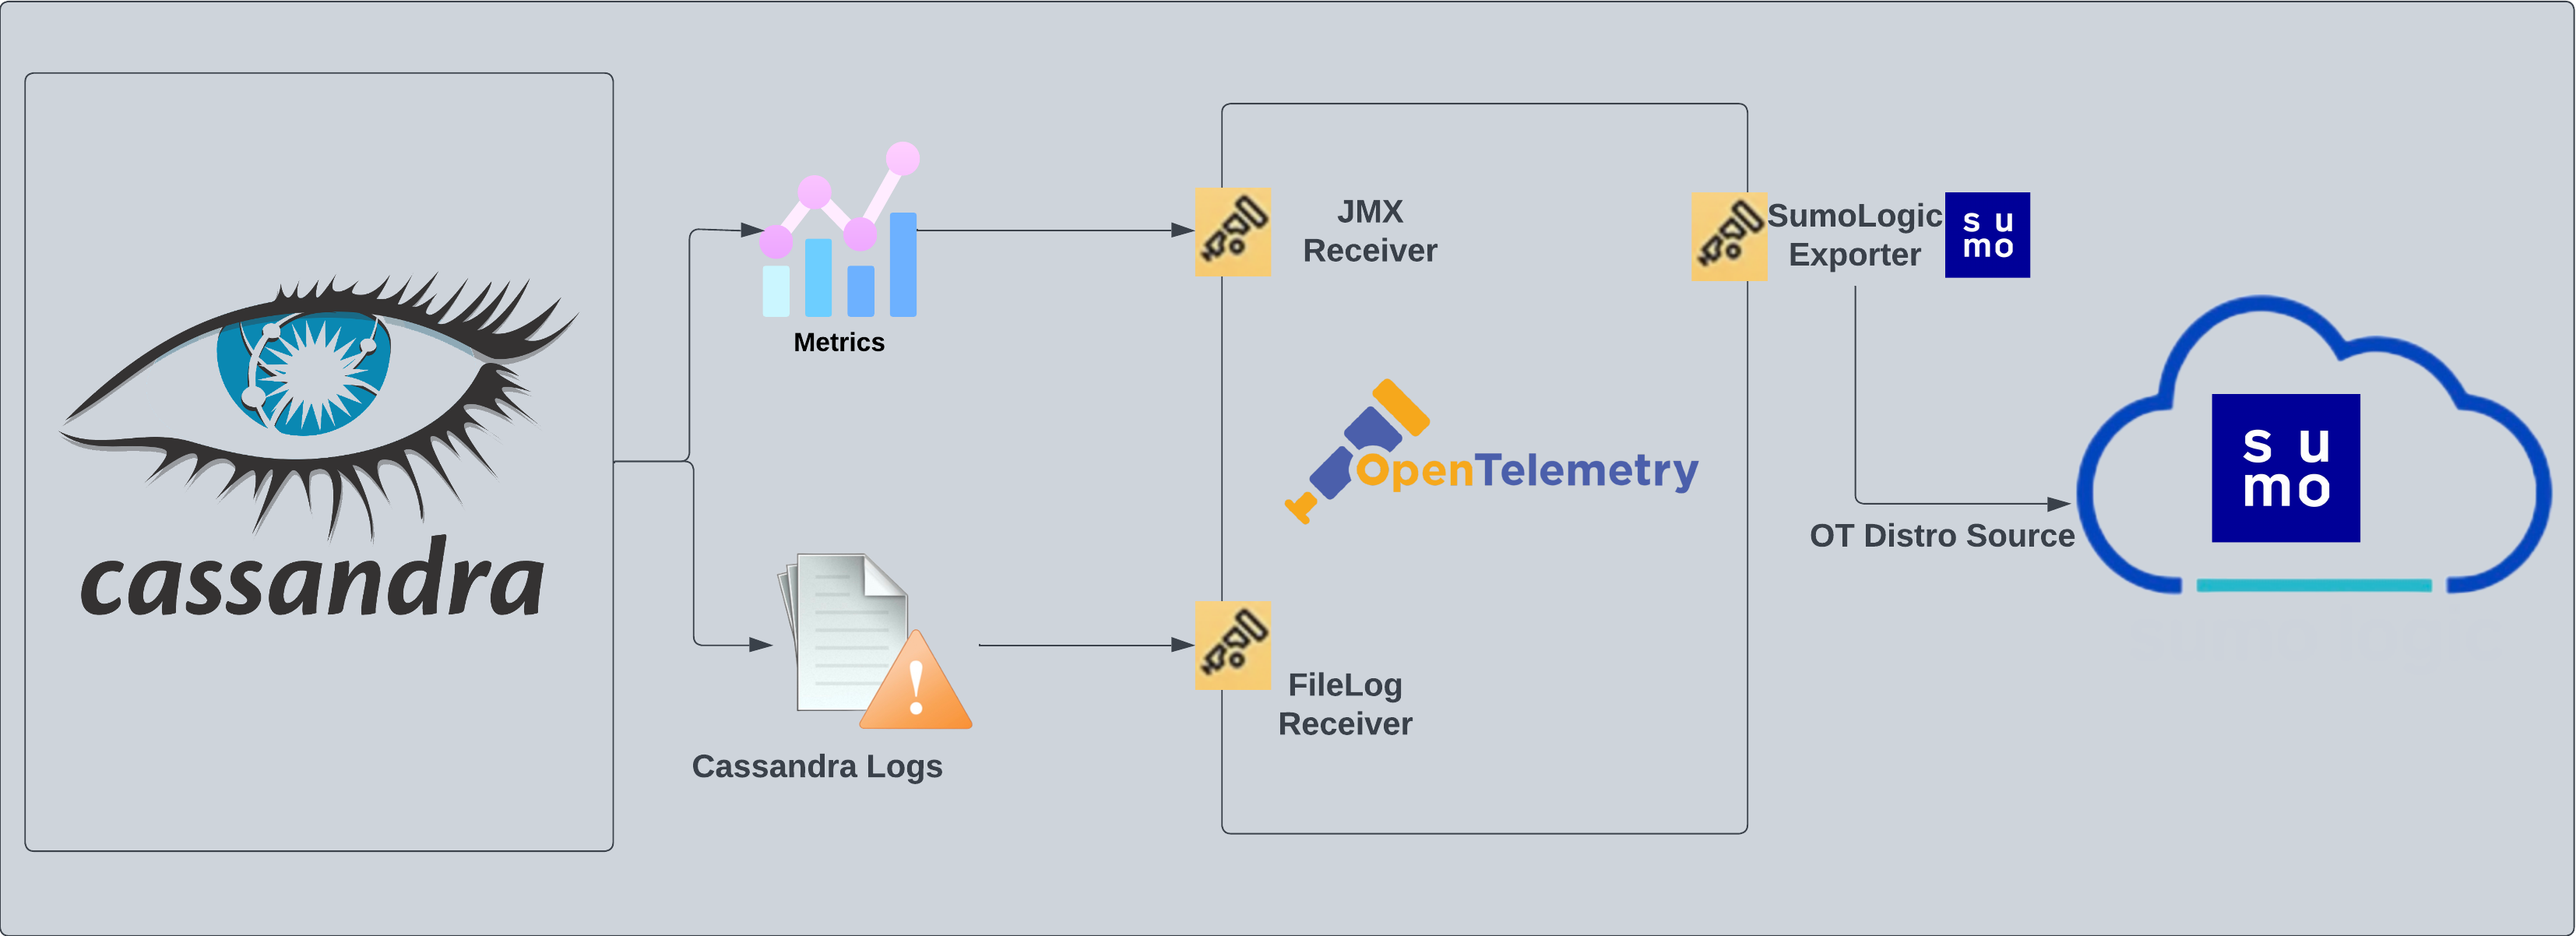
Cassandra logs are sent to Sumo Logic through OpenTelemetry filelog receiver and cassandra metrics are sent to Sumo Logic using JMX opentelemetry receiver with the target_system set as cassandra.
The app supports logs from the open-source version of Cassandra. The app is tested on the 4.0.0 version of Cassandra.
This app includes built-in monitors. For details on creating custom monitors, refer to the Create monitors for Cassandra app.
Fields creation in Sumo Logic for Cassandra
Following are the Fields which will be created as part of Cassandra App install if not already present:
deployment.environment. User configured. Through this Cassandra cluster is identified by the environment where it resides. For example: dev, prod, or qa.db.cluster.name. User configured. Enter a name to identify this Cassandra cluster. This cluster name will be shown in the Sumo Logic dashboards.db.system. Has fixed value of cassandra.db.node.name. Holds the value of the Fully Qualified Domain Name (FQDN) of the machine from which the OpenTelemetry collector is collecting logs and metrics.sumo.datasource. Has fixed value of cassandra.
Prerequisites
For metric collection
JMX receiver collects Cassandra metrics from Cassandra server as part of the OpenTelemetry Collector (OTC).
-
Follow the instructions in JMX - OpenTelemetry's prerequisites section to download the JMX Metric Gatherer. This gatherer is used by the JMX Receiver.
-
Set the JMX port as part of
JAVA_OPTSfor Tomcat startup. Usually, it is set in the/etc/systemd/system/cassandra.serviceorC:\Program Files\apache-tomcat\bin\tomcat.batfile.JAVA_OPTS="$JAVA_OPTS -Dcom.sun.management.jmxremote -Dcom.sun.management.jmxremote.port=11099 -Dcom.sun.management.jmxremote.authenticate=true -Dcom.sun.management.jmxremote.ssl=false -Dcom.sun.management.jmxremote.password.file=${CASSANDRA_CONF_DIR}/jmx.password -Dcom.sun.management.jmxremote.access.file=${CASSANDRA_CONF_DIR}/jmx.access"
For log collection
Cassandra has three main logs: system.log, debug.log, and gc.log, which hold general logging messages, debugging logging messages, and java garbage collection logs respectively.
These logs by default live in ${CASSANDRA_HOME}/logs, but most Linux distributions relocate logs to /var/log/cassandra. Operators can tune this location as well as what levels are logged using the provided logback.xml file. For more details on Cassandra logs, see this.
For Linux systems with ACL Support, the otelcol install process should have created the ACL grants necessary for the otelcol system user to access default log locations. You can verify the active ACL grants using the getfacl command. Install the ACL in your Linux environment, if not installed.
The required ACL may not be supported for some rare cases, for example, Linux OS Distro, which is officially not supported by Sumo Logic. In this case, you can run the following command to explicitly grant the permissions.
sudo setfacl -R -m d:u:otelcol-sumo:r-x,d:g:otelcol-sumo:r-x,u:otelcol-sumo:r-x,g:otelcol-sumo:r-x <PATH_TO_LOG_FILE>
Run the above command for all the log files in the directory that need to be ingested, which are not residing in the default location.
If Linux ACL Support is not available, traditional Unix-styled user and group permission must be modified. It should be sufficient to add the otelcol system user to the specific group that has access to the log files.
Collection configuration and app installation
As part of data collection setup and app installation, you can select the App from App Catalog and click on Install App. Follow the steps below.
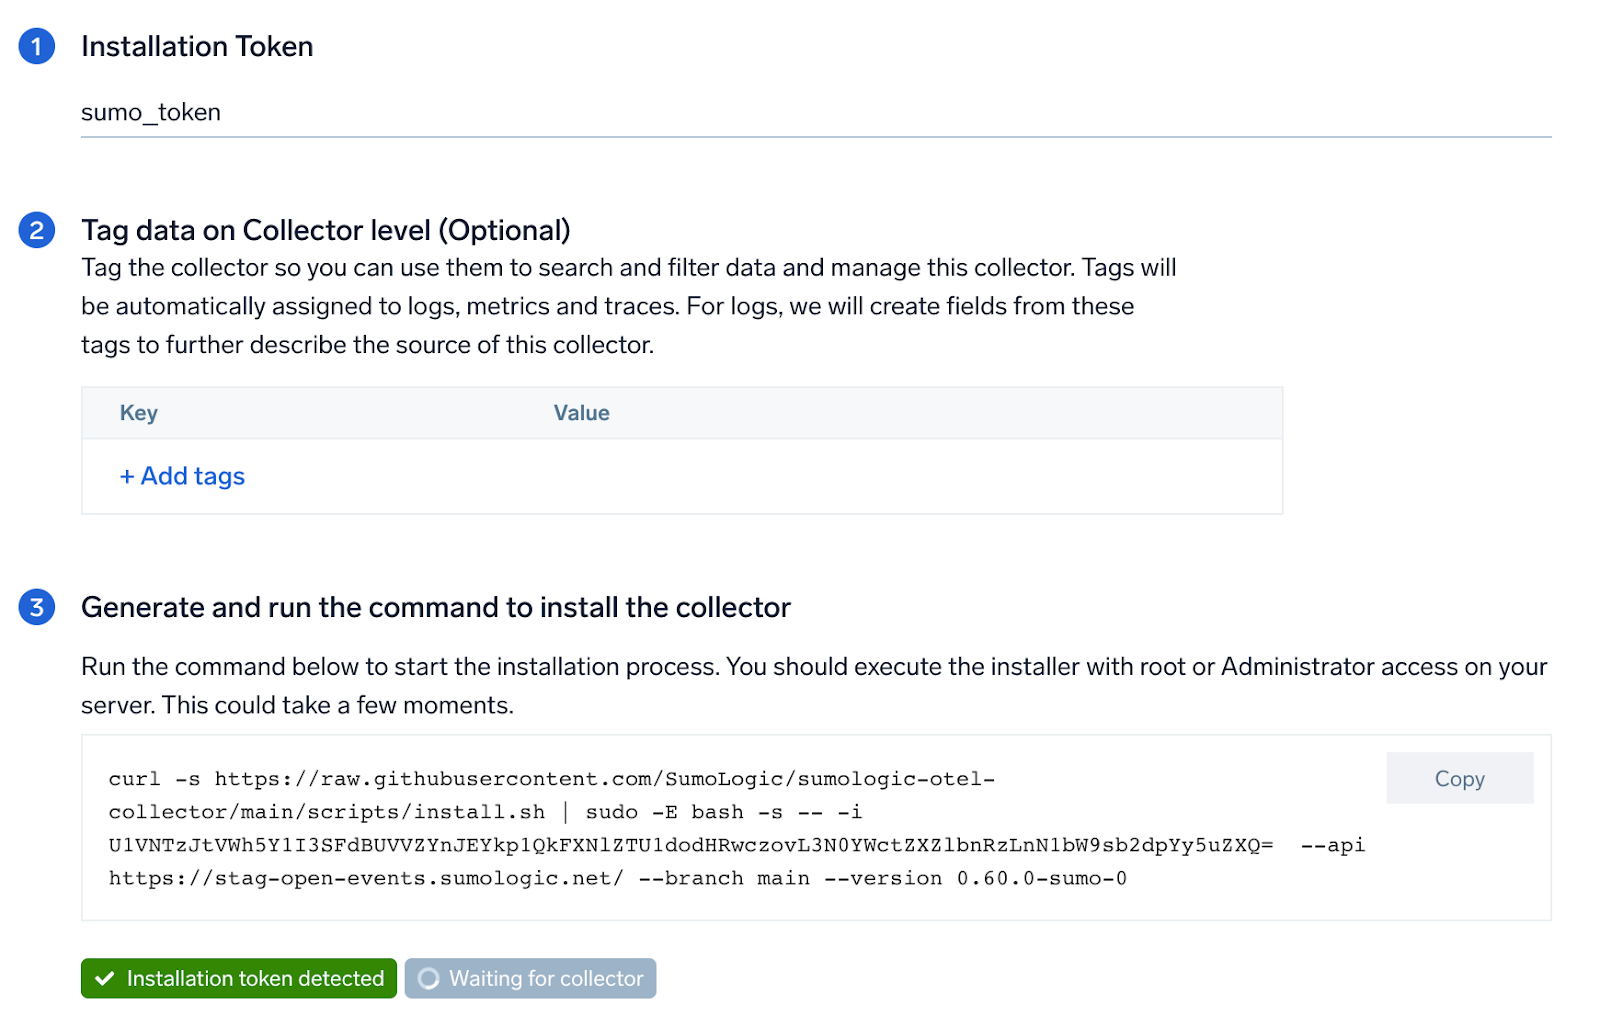
Step 1: Set up Collector
If you want to use an existing OpenTelemetry Collector, you can skip this step by selecting the Use an existing Collector option.
To create a new Collector:
- Select the Add a new Collector option.
- Select the platform where you want to install the Sumo Logic OpenTelemetry Collector.
This will generate a command that you can execute in the machine environment you need to monitor. Once executed, it will install the Sumo Logic OpenTelemetry Collector.
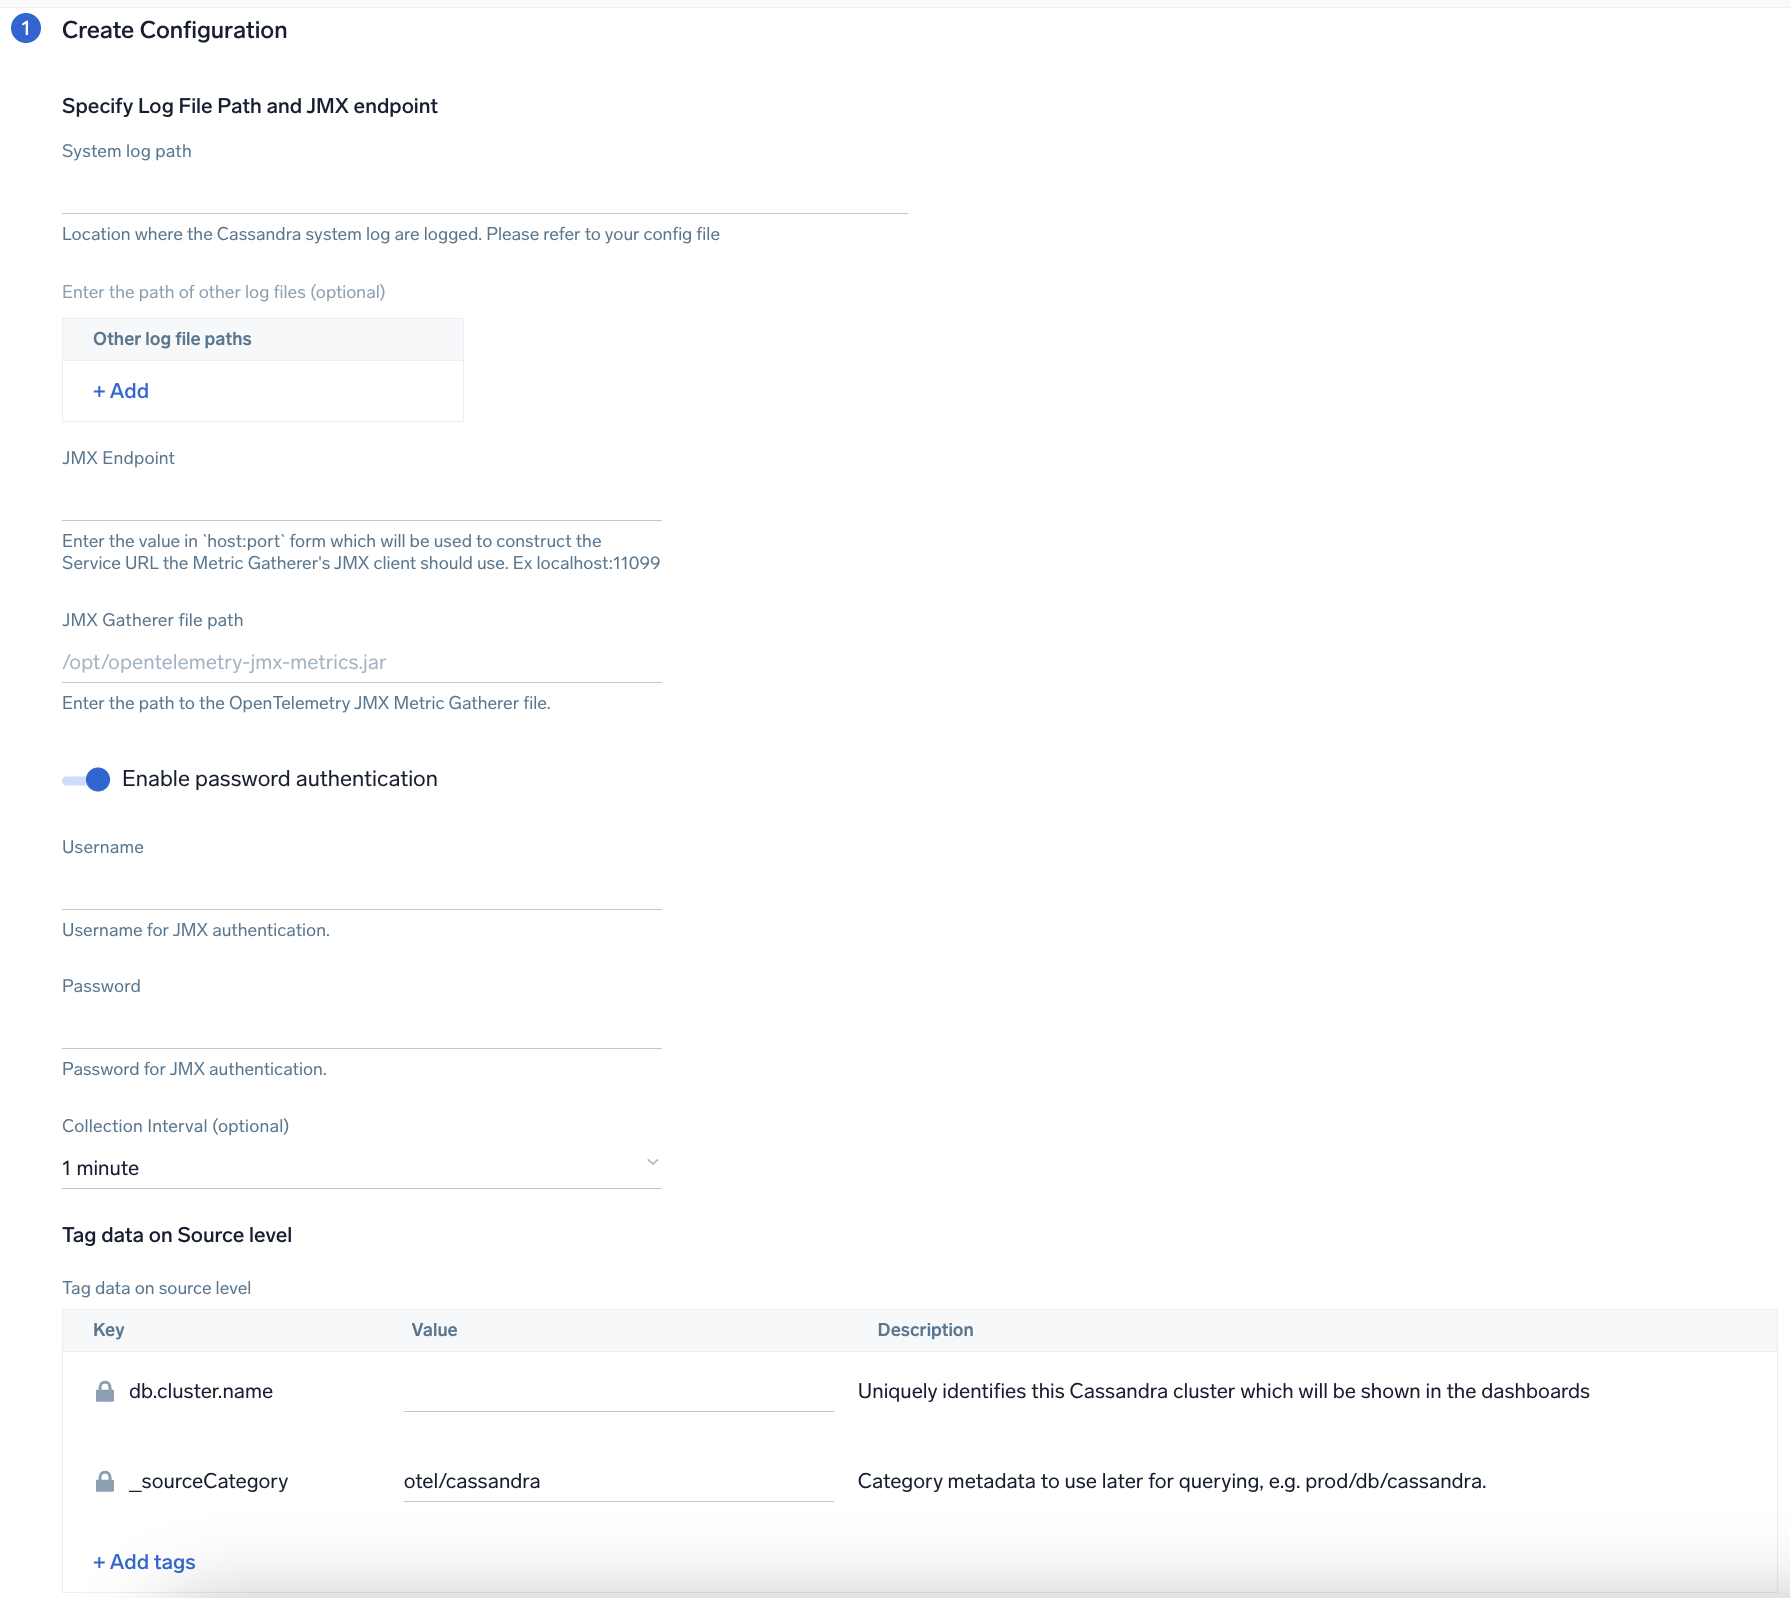
Step 2: Configure integration
In this step, you will configure the yaml required for Cassandra Collection. Path of the log file configured to capture Cassandra logs needs to be given here.
Below are the inputs required:
- The path to system.log is required here. This file is typically located in
/var/log/cassandra. If you're using a customized path, check the respective conf file for this information. - For metrics, you're required to provide the JMX endpoint (default is
localhost:7199) along with thecollection_interval(default is 1 minute).
You can add any custom fields which you want to be tagged with the data ingested in Sumo. Click on the Download YAML File button to get the yaml file.
For OpenTelemetry Collector version ≥ 0.104, we recommend using the downloaded config with an environment variable, for example: ${environment_variable}.
On Linux, click Download Environment Variables File to get a file that includes the password, which should be set as an environment variable (if you're using one).
Step 3: Send logs to Sumo Logic
Once you have downloaded the YAML file as described in the previous step, follow the below steps based on your platform.
- Linux
- Chef
- Ansible
- Puppet
- Copy the yaml to
/etc/otelcol-sumo/conf.d/folder for the Cassandra instance which needs to be monitored. - Restart the collector using:
sudo systemctl restart otelcol-sumo
- Copy the yaml file into your Chef cookbook files directory
files/<downloaded_yaml_file>. - Use a Chef file resource in a recipe to manage it.
cookbook_file '/etc/otelcol-sumo/conf.d/<downloaded_yaml_file>' do mode 0644 notifies :restart, 'service[otelcol-sumo]', :delayed end - Add the recipe to your collector setup to start collecting the data. Every team typically has their established way of applying the Chef recipe. The resulting Chef recipe should look something like:
cookbook_file '/etc/otelcol-sumo/conf.d/<downloaded_yaml_file>' do
mode 0644
notifies :restart, 'service[otelcol-sumo]', :delayed
end
- Place the file into your Ansible playbook files directory.
- Run the Ansible playbook.
ansible-playbook -i inventory install_sumologic_otel_collector.yaml
-e '{"installation_token": "<YOUR_TOKEN>", "collector_tags": {<YOUR_TAGS>}, "src_config_path": "files/conf.d"}'
- Place the file into your Puppet module files directory
modules/install_otel_collector/files/<downloaded_yaml>. - Use a Puppet file resource to manage it.
file { '/etc/otelcol-sumo/conf.d/<downloaded_yaml_file>':
    ensure => present,
    source => 'puppet:///modules/install_otel_collector/<downloaded_yaml_file>',
    mode => '0644',
    notify => Service[otelcol-sumo],
} - Apply the Puppet manifest. Every team typically has their established way of applying the Puppet manifest. The resulting Puppet manifest should look something like:
node 'default' {
    class { 'install_otel_collector'
      installation_token => '<YOUR_TOKEN>',
      collector_tags => { <YOUR_TAGS> },
    }

    service { 'otelcol-sumo':
      provider => 'systemd',
      ensure => running,
      enable => true,
      require => Class['install_otel_collector'],
    }

    file { '/etc/otelcol-sumo/conf.d/<downloaded_yaml_file>':
      ensure => present,
      source => 'puppet:///modules/install_otel_collector/<downloaded_yaml_file>',
      mode => '0644',
      notify => Service[otelcol-sumo],
    }
  }
After successfully executing the above command, Sumo Logic will start receiving data from your host machine.
Click Next. This will install the app (dashboards and monitors) to your Sumo Logic Org.
Dashboard panels will start to fill automatically. It's important to note that each panel fills with data matching the time range query and received since the panel was created. Results won't immediately be available, but within 20 minutes, you'll see full graphs and maps.
Sample log message
INFO [ScheduledTasks:1] 2023-01-08 09:18:47,347 StatusLogger.java:101 - system.schema_aggregates
Sample metrics message
{
    "queryId": "A",
    "_source": "cassandra-otel",
    "_metricId": "dasIFS6RvCVxEcsljWGpnQ",
    "_sourceName": "Http Input",
    "host.id": "i-071ade75d03650657",
    "host.group": "cassandraHostGrp",
    "telemetry.sdk.version": "1.38.0",
    "os.type": "linux",
    "sumo.datasource": "cassandra",
    "db.system": "cassandra",
    "db.node.name": "ip-54-163-607-30.ec2.internal",
    "_sourceCategory": "Labs/cassandra-otel",
    "deployment.environment": "dev",
    "_contentType": "Carbon2",
    "host.name": "ip-54-163-607-30.ec2.internal",
    "metric": "cassandra.client.request.write.latency.50p",
    "_collectorId": "000000000FB3B451",
    "_sourceId": "000000005A60F624",
    "unit": "us",
    "db.cluster.name": "cassandra_cluster",
    "telemetry.sdk.language": "java",
    "telemetry.sdk.name": "opentelemetry",
    "service.name": "unknown_service:java",
    "_collector": "Labs - cassandra-otel",
    "max": 229,
    "min": 0,
    "avg": 131.25,
    "sum": 525,
    "latest": 67,
    "count": 4
}
Sample log query
Following is a query from the Cassandra app's Cassandra - Overview dashboard Nodes Up panel:
%"sumo.datasource"=cassandra %"deployment.environment"=* %"db.cluster.name"=*   "INFO" | json "log" as _rawlog nodrop
| if (isEmpty(_rawlog), _raw, _rawlog) as _raw
| parse regex field=_raw "(?<level>[A-Z]*) *\[(?<thread_name>[^\]]*?)[:_-]?(?<thread_id>[0-9]*)\] (?<Date>.{10} .{12}) *(?<source_file>[^:]*):(?<source_line>[0-9]*) - (?<message>.*)"
| if (message matches "InetAddress * is now UP",1,0) as UP
| timeslice 1d
| sum(UP) as UP by _timeslice
| sort by _timeslice asc
Sample metrics query
Following is the query from Cassandra App's overview Dashboard's Number of Requests Panel:
sumo.datasource=cassandra deployment.environment=* db.cluster.name=* db.node.name=* metric=cassandra.client.request.count | sum
Viewing Cassandra dashboards
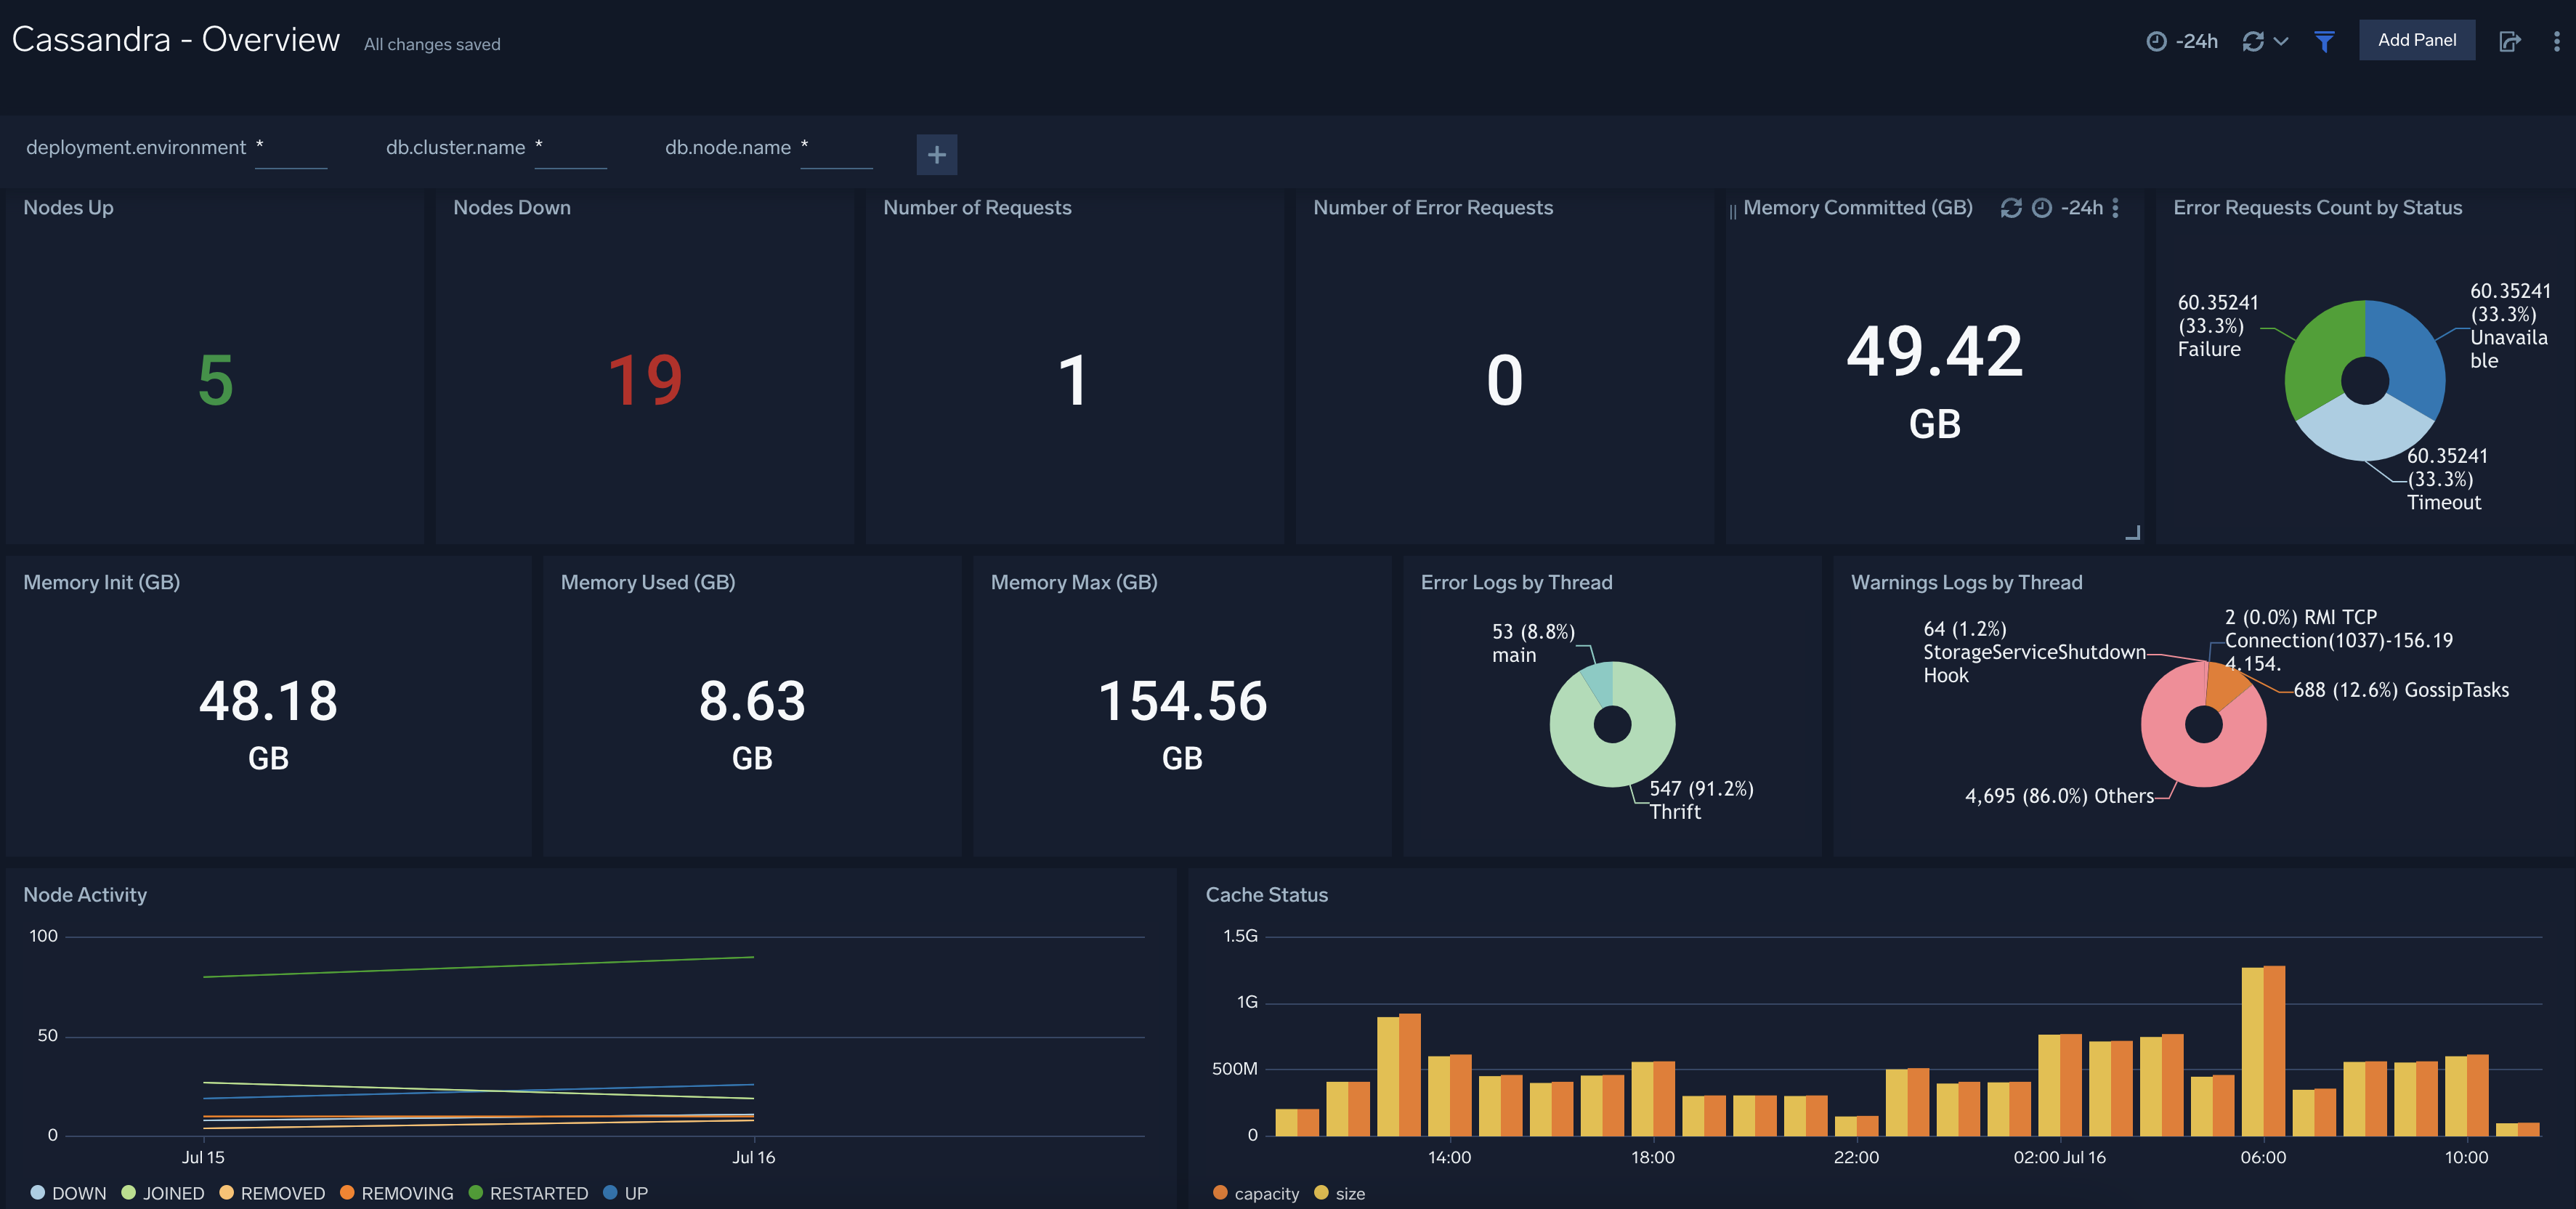
Overview
The Cassandra - Overview dashboard provides an at-a-glance view of Cassandra backend and frontend HTTP error codes percentage, visitor location, URLs, and clients causing errors.
Use this dashboard to:
- Identify number of nodes which are up and down.
- Gain insights into Memory - Init, used, Max, and committed.
- Gain insights into the error and warning logs by thread and Node activity.
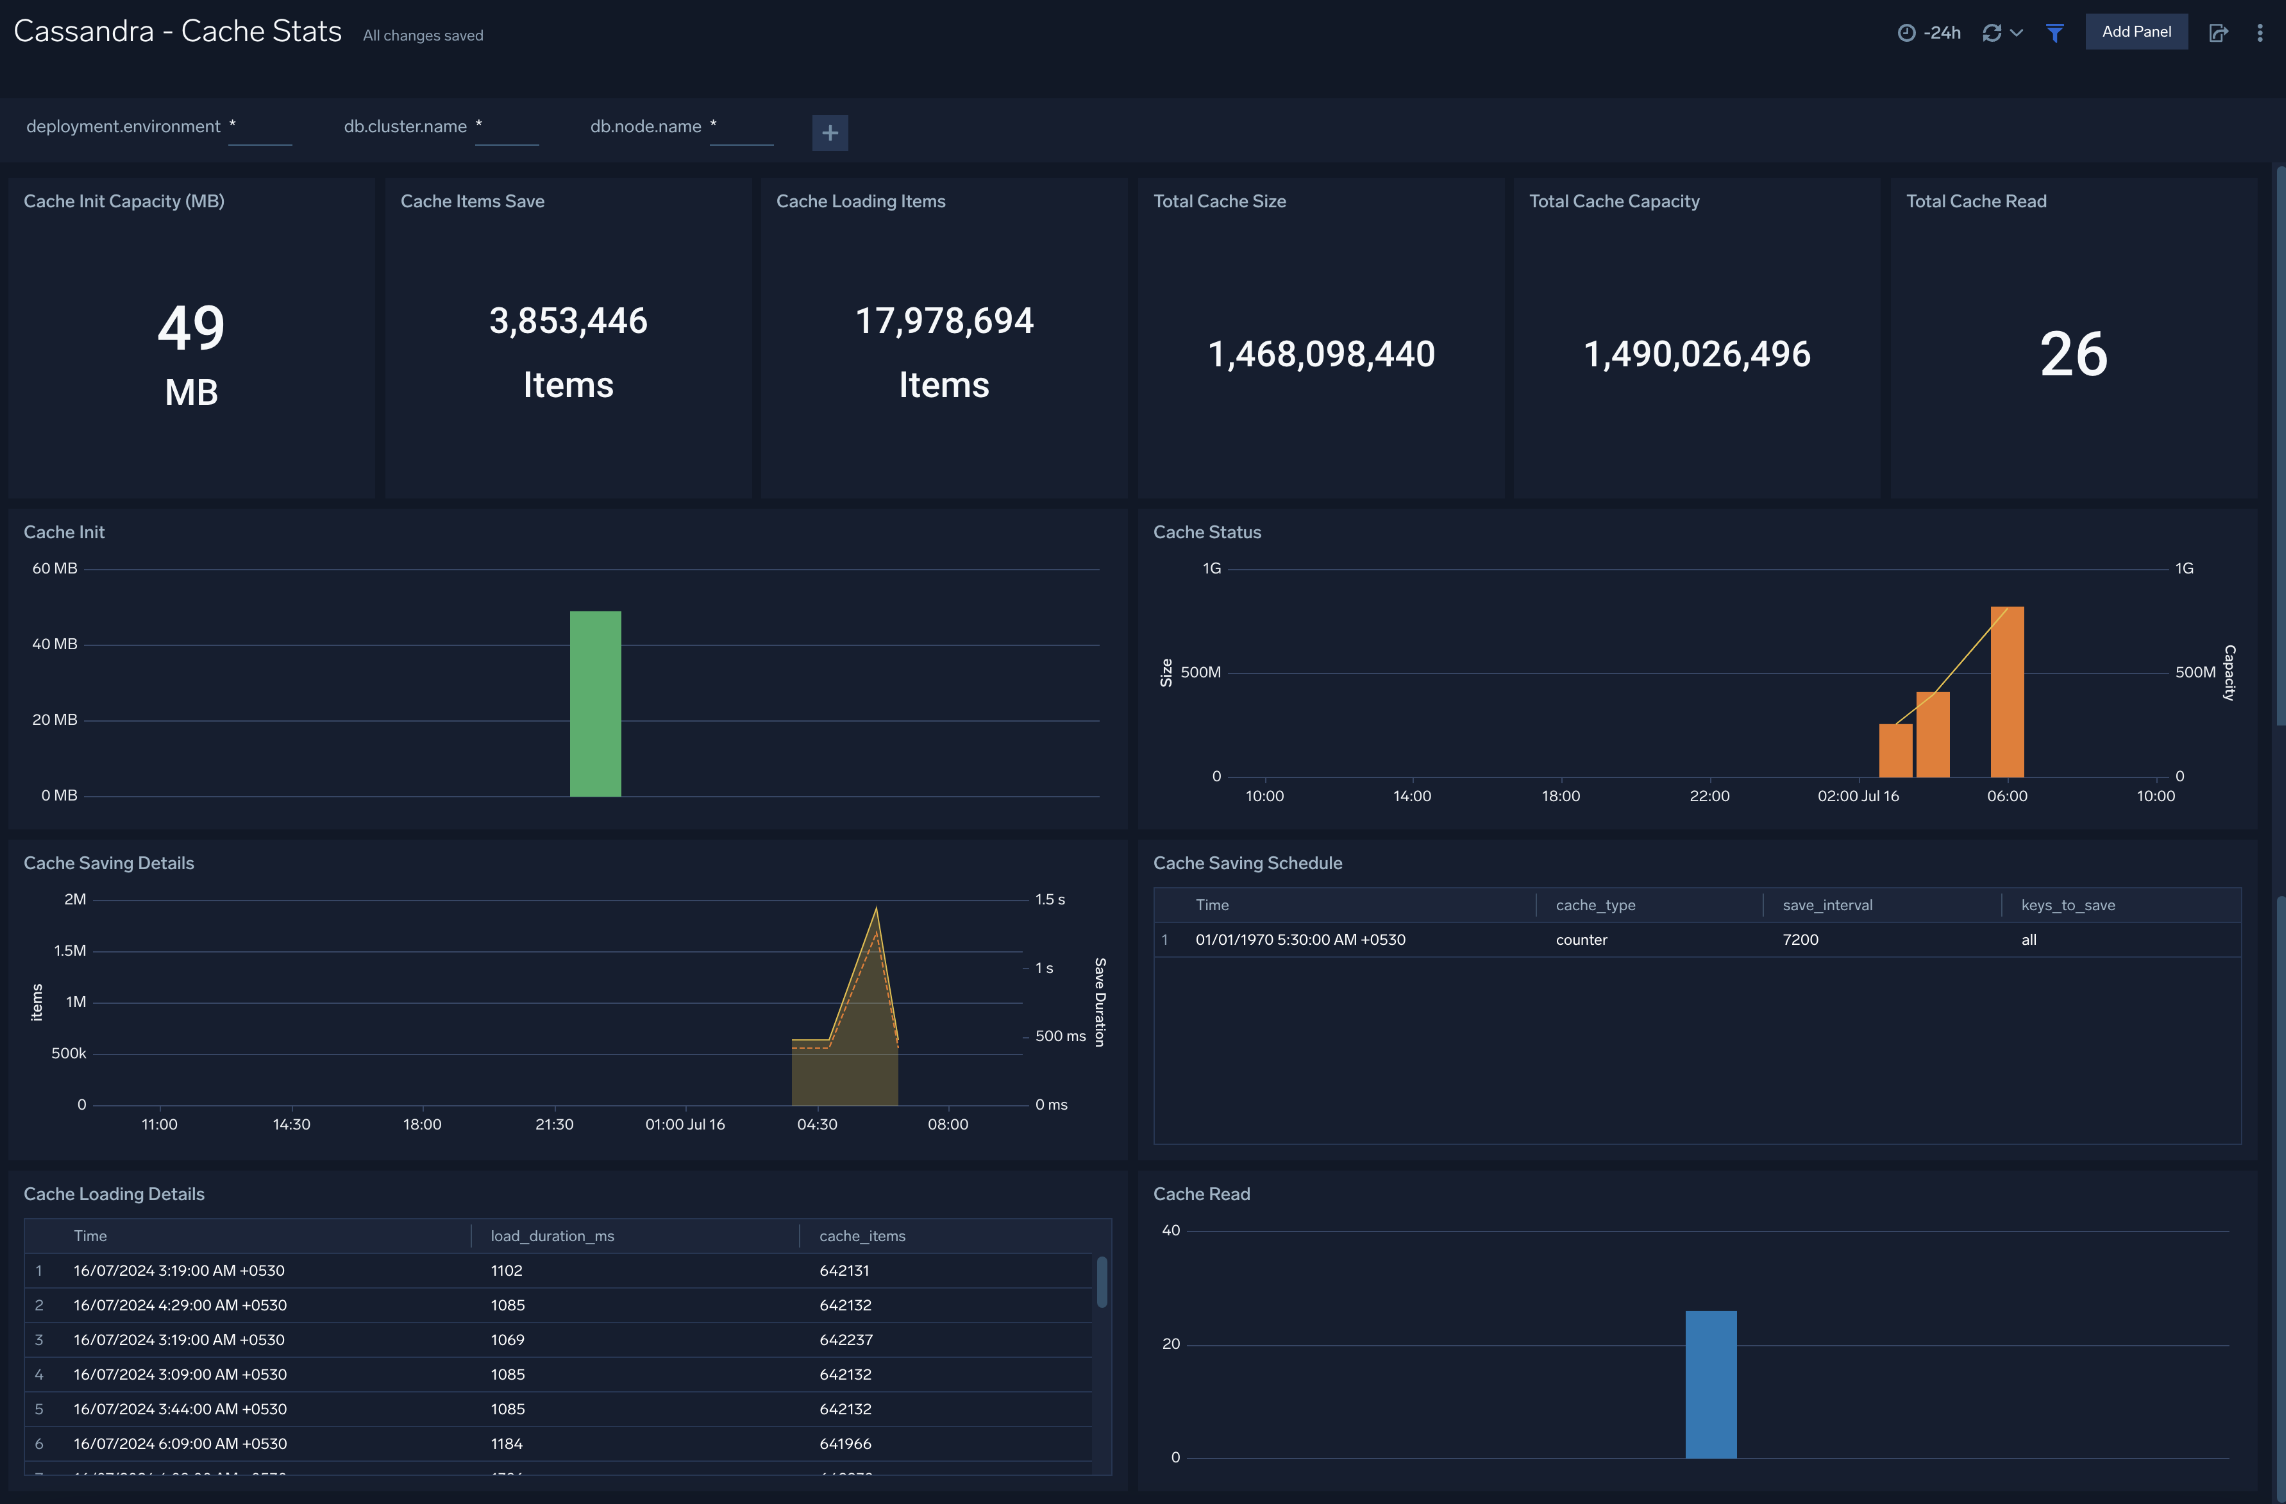
Cache Stats
The Cassandra - Cache Stats dashboard provides insight into the database cache status, schedule, and items. Use this dashboard to monitor cache performance and identify cache usage statistics.
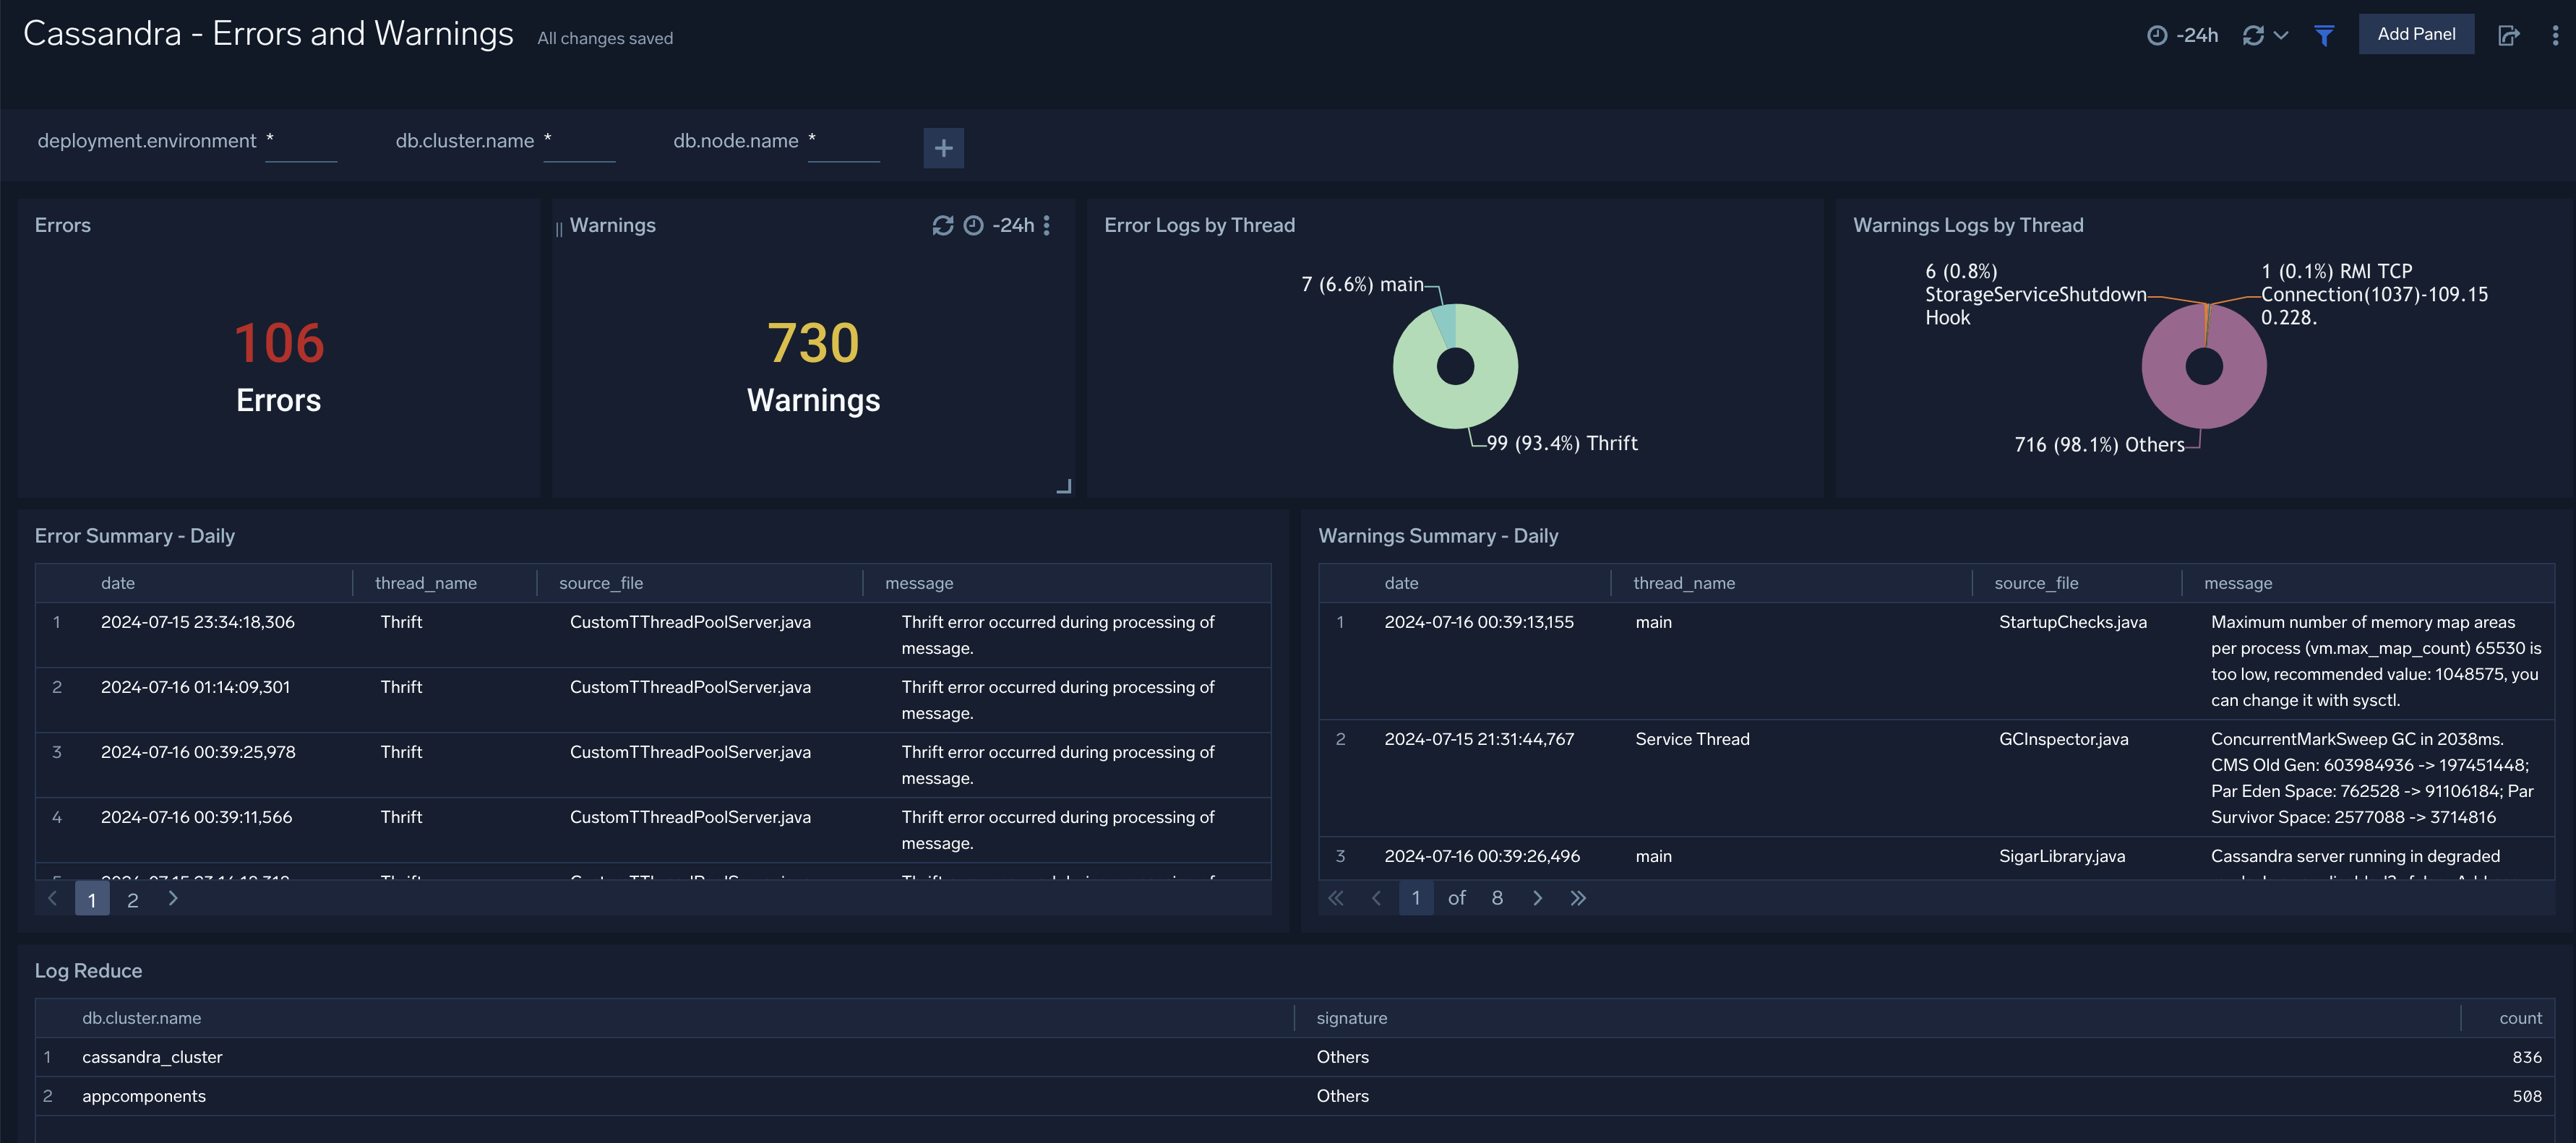
Errors and Warnings
The Cassandra - Errors and Warnings dashboard provides details of the database errors and warnings.
Use this dashboard to:
- Review errors and warnings generated by the server.
- Review the Threads errors and warning events.
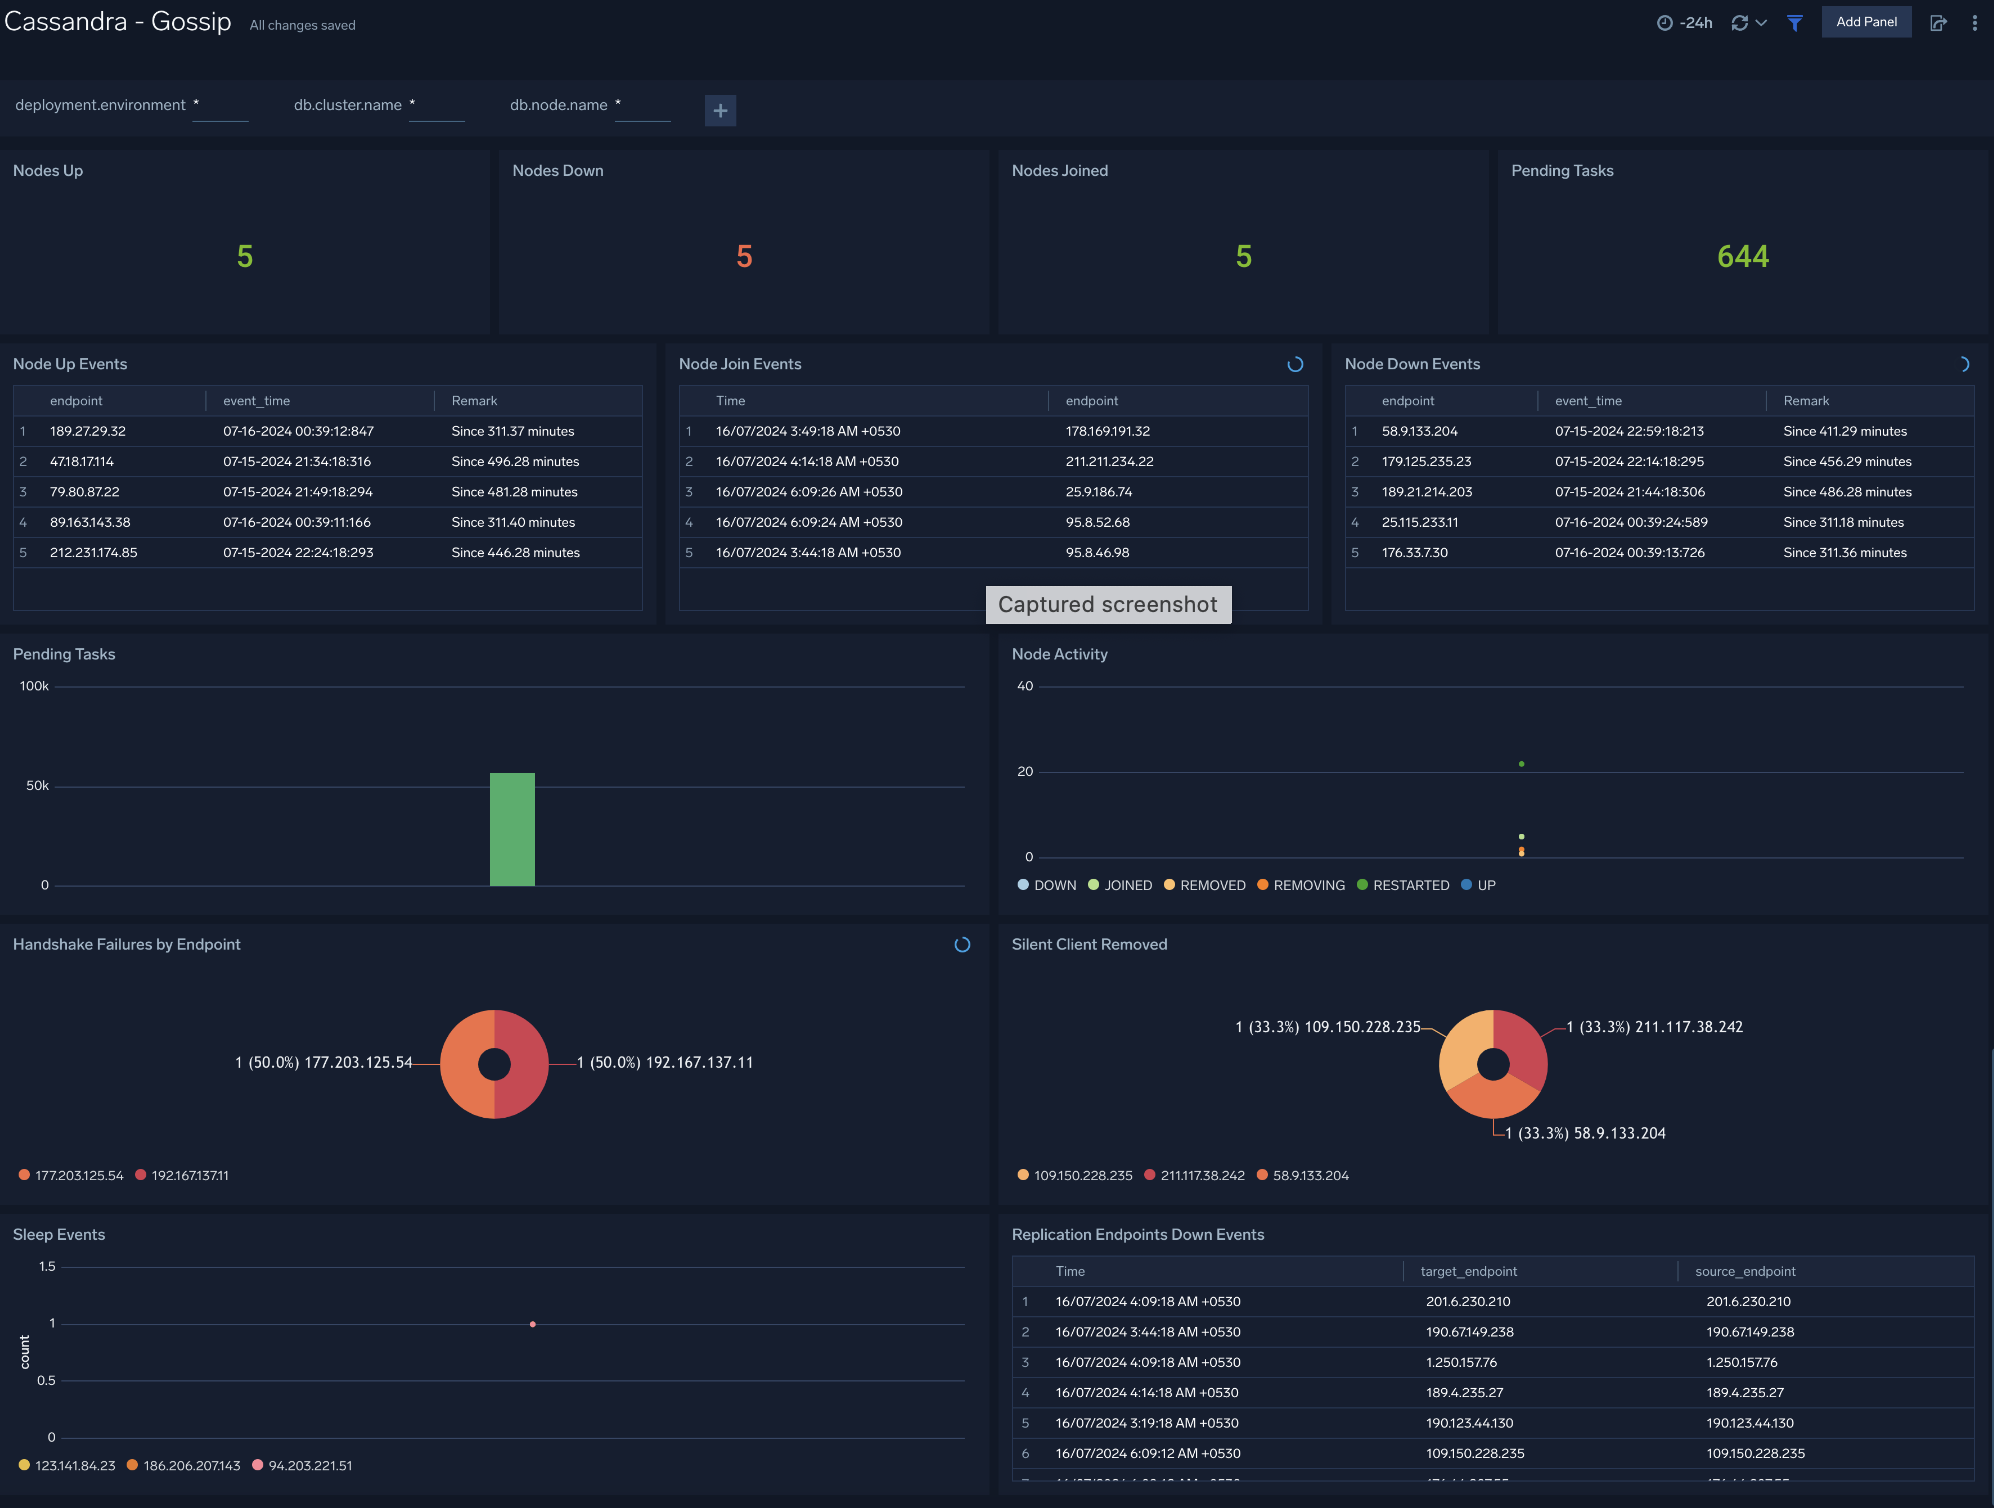
Gossip
The Cassandra - Gossip dashboard provides details about communication between various cassandra nodes.
Use this dashboard to:
- Determine nodes with errors resulting in failures.
- Review the node activity and pending tasks.
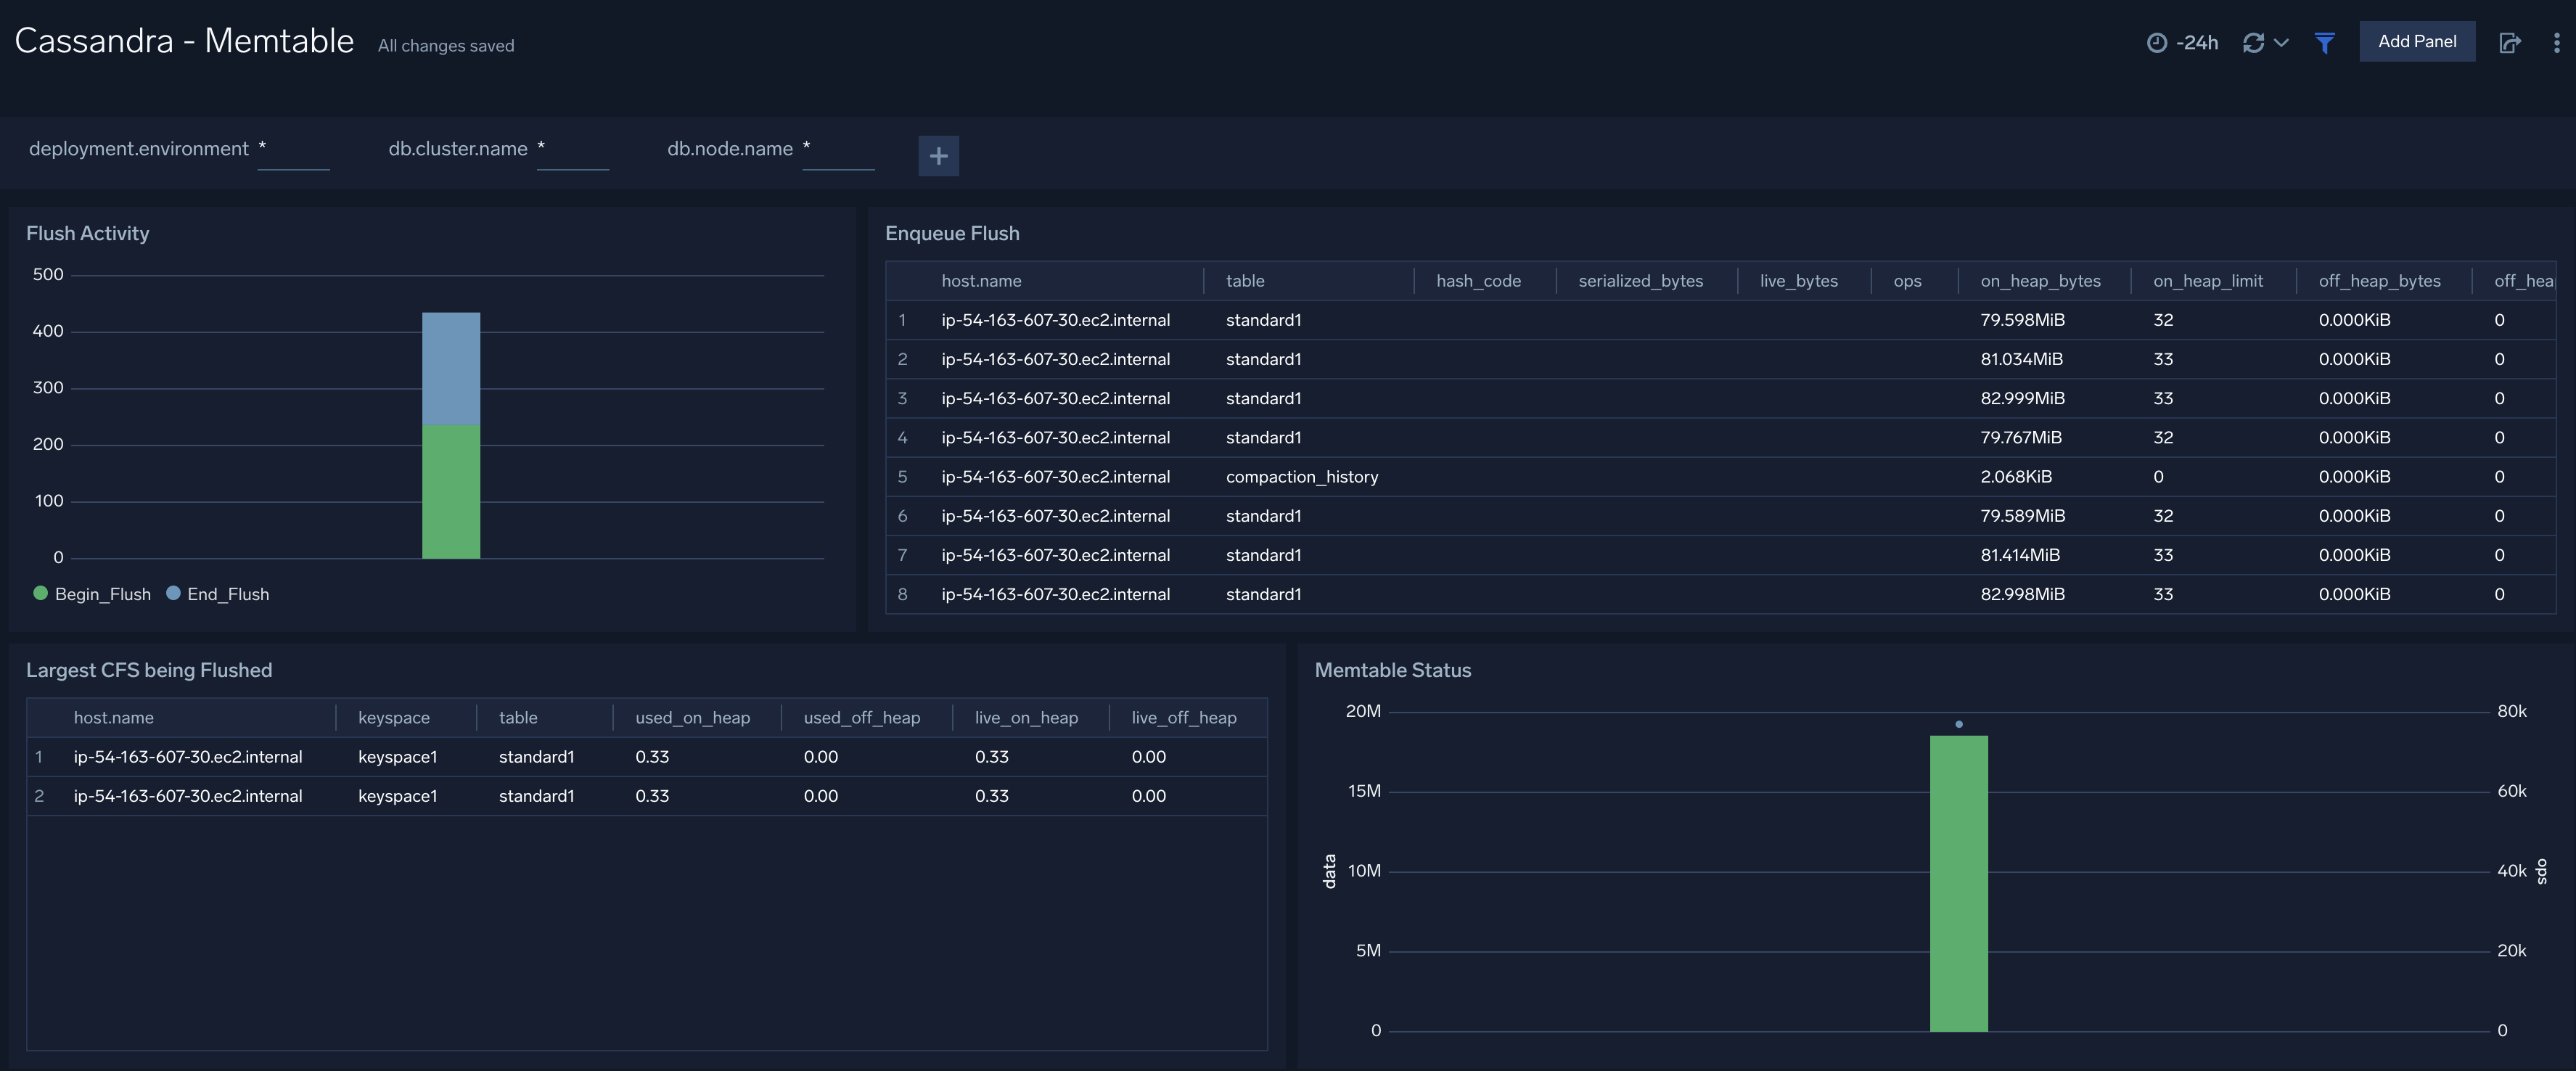
Memtable
The Cassandra - Memtable dashboard provides insights into memtable statistics. Use this dashboard to review flush activity and memtable status.
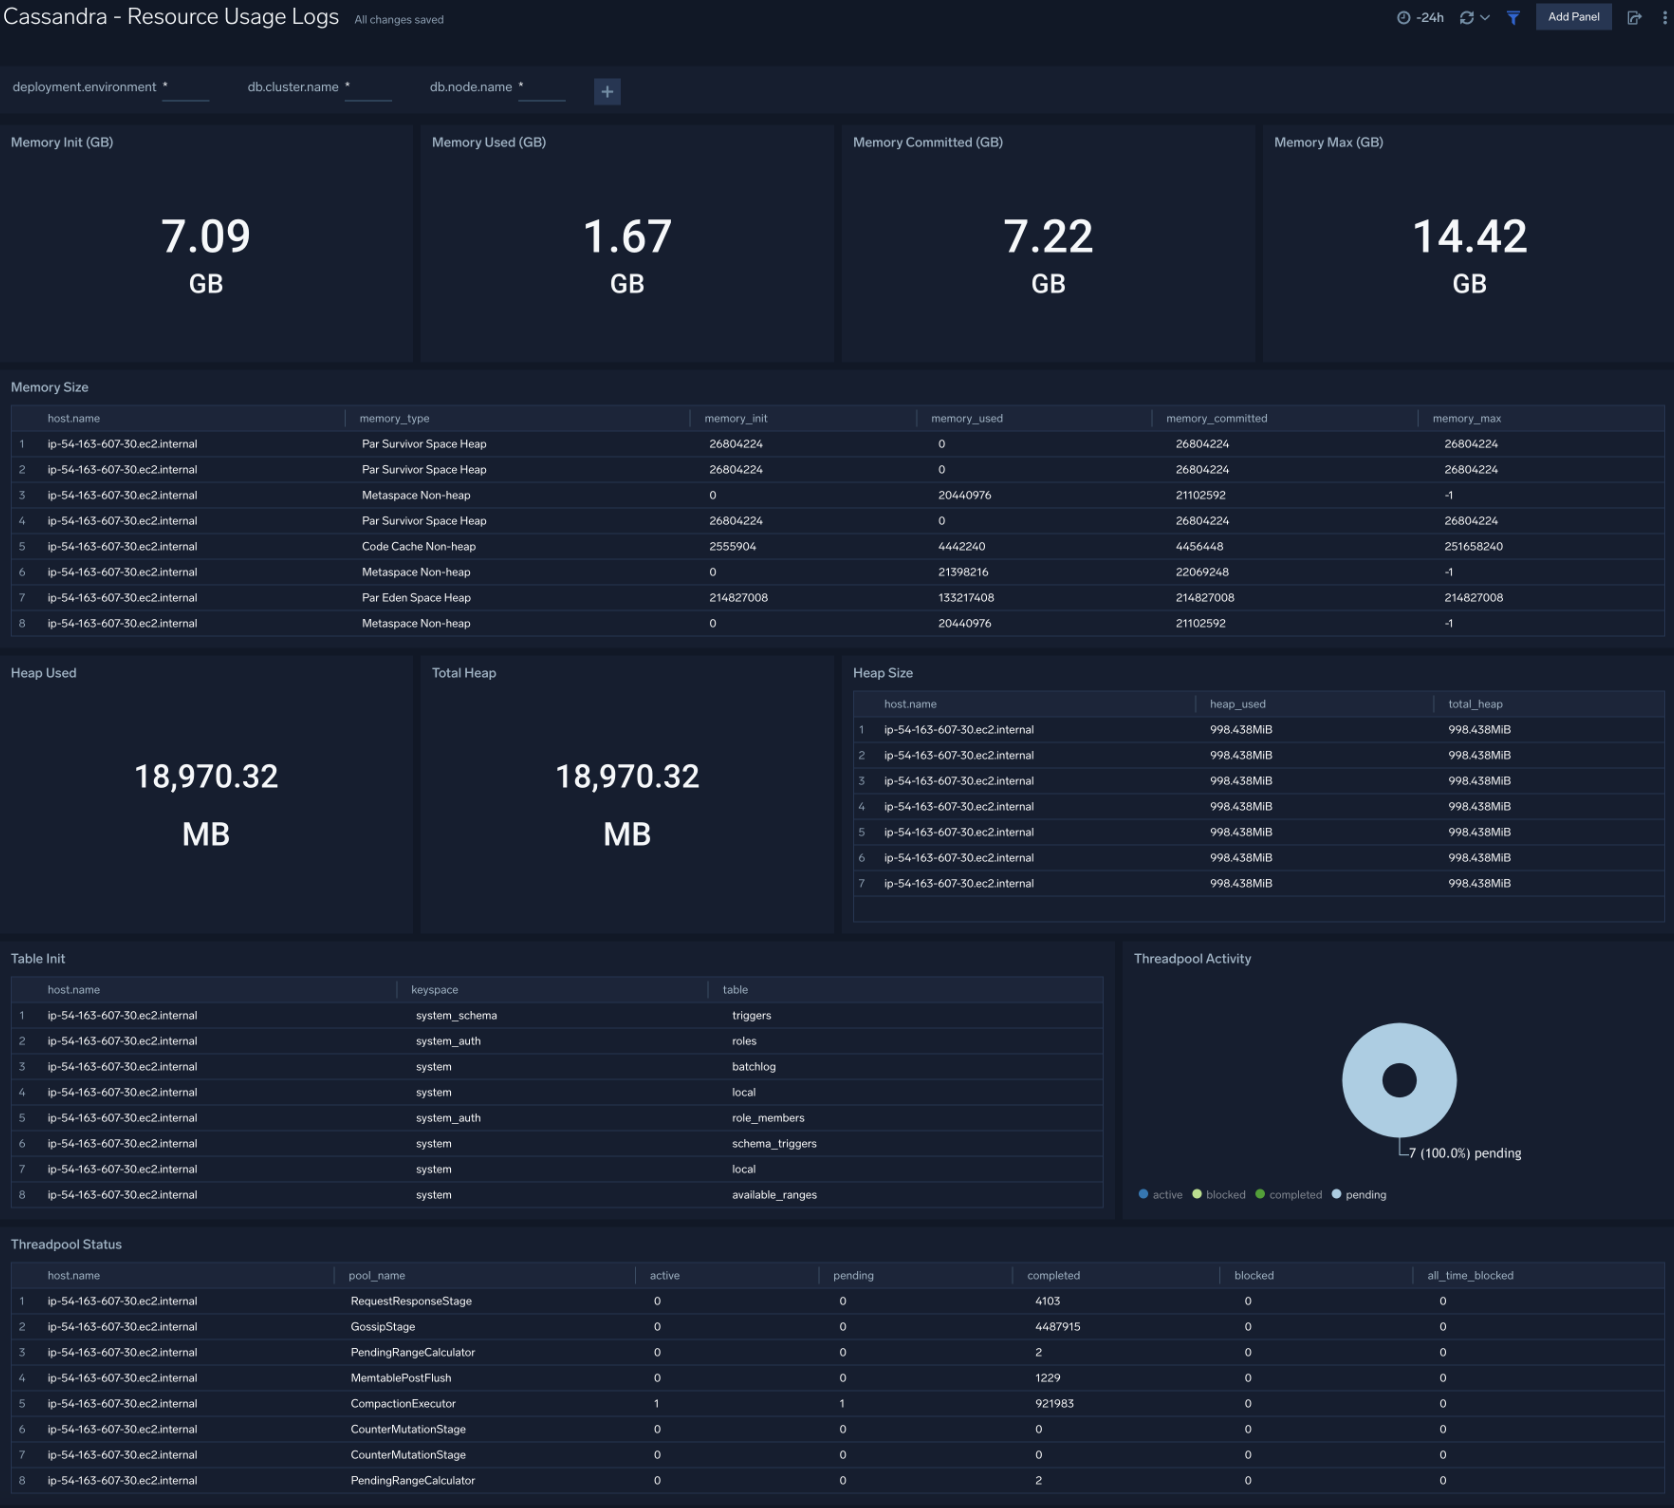
Resource Usage
The Cassandra - Resource Usage dashboard provides details of resource utilization across Cassandra clusters. Use this dashboard to identify resource utilization. This can help you to determine whether resources are over-allocated or under-allocated.
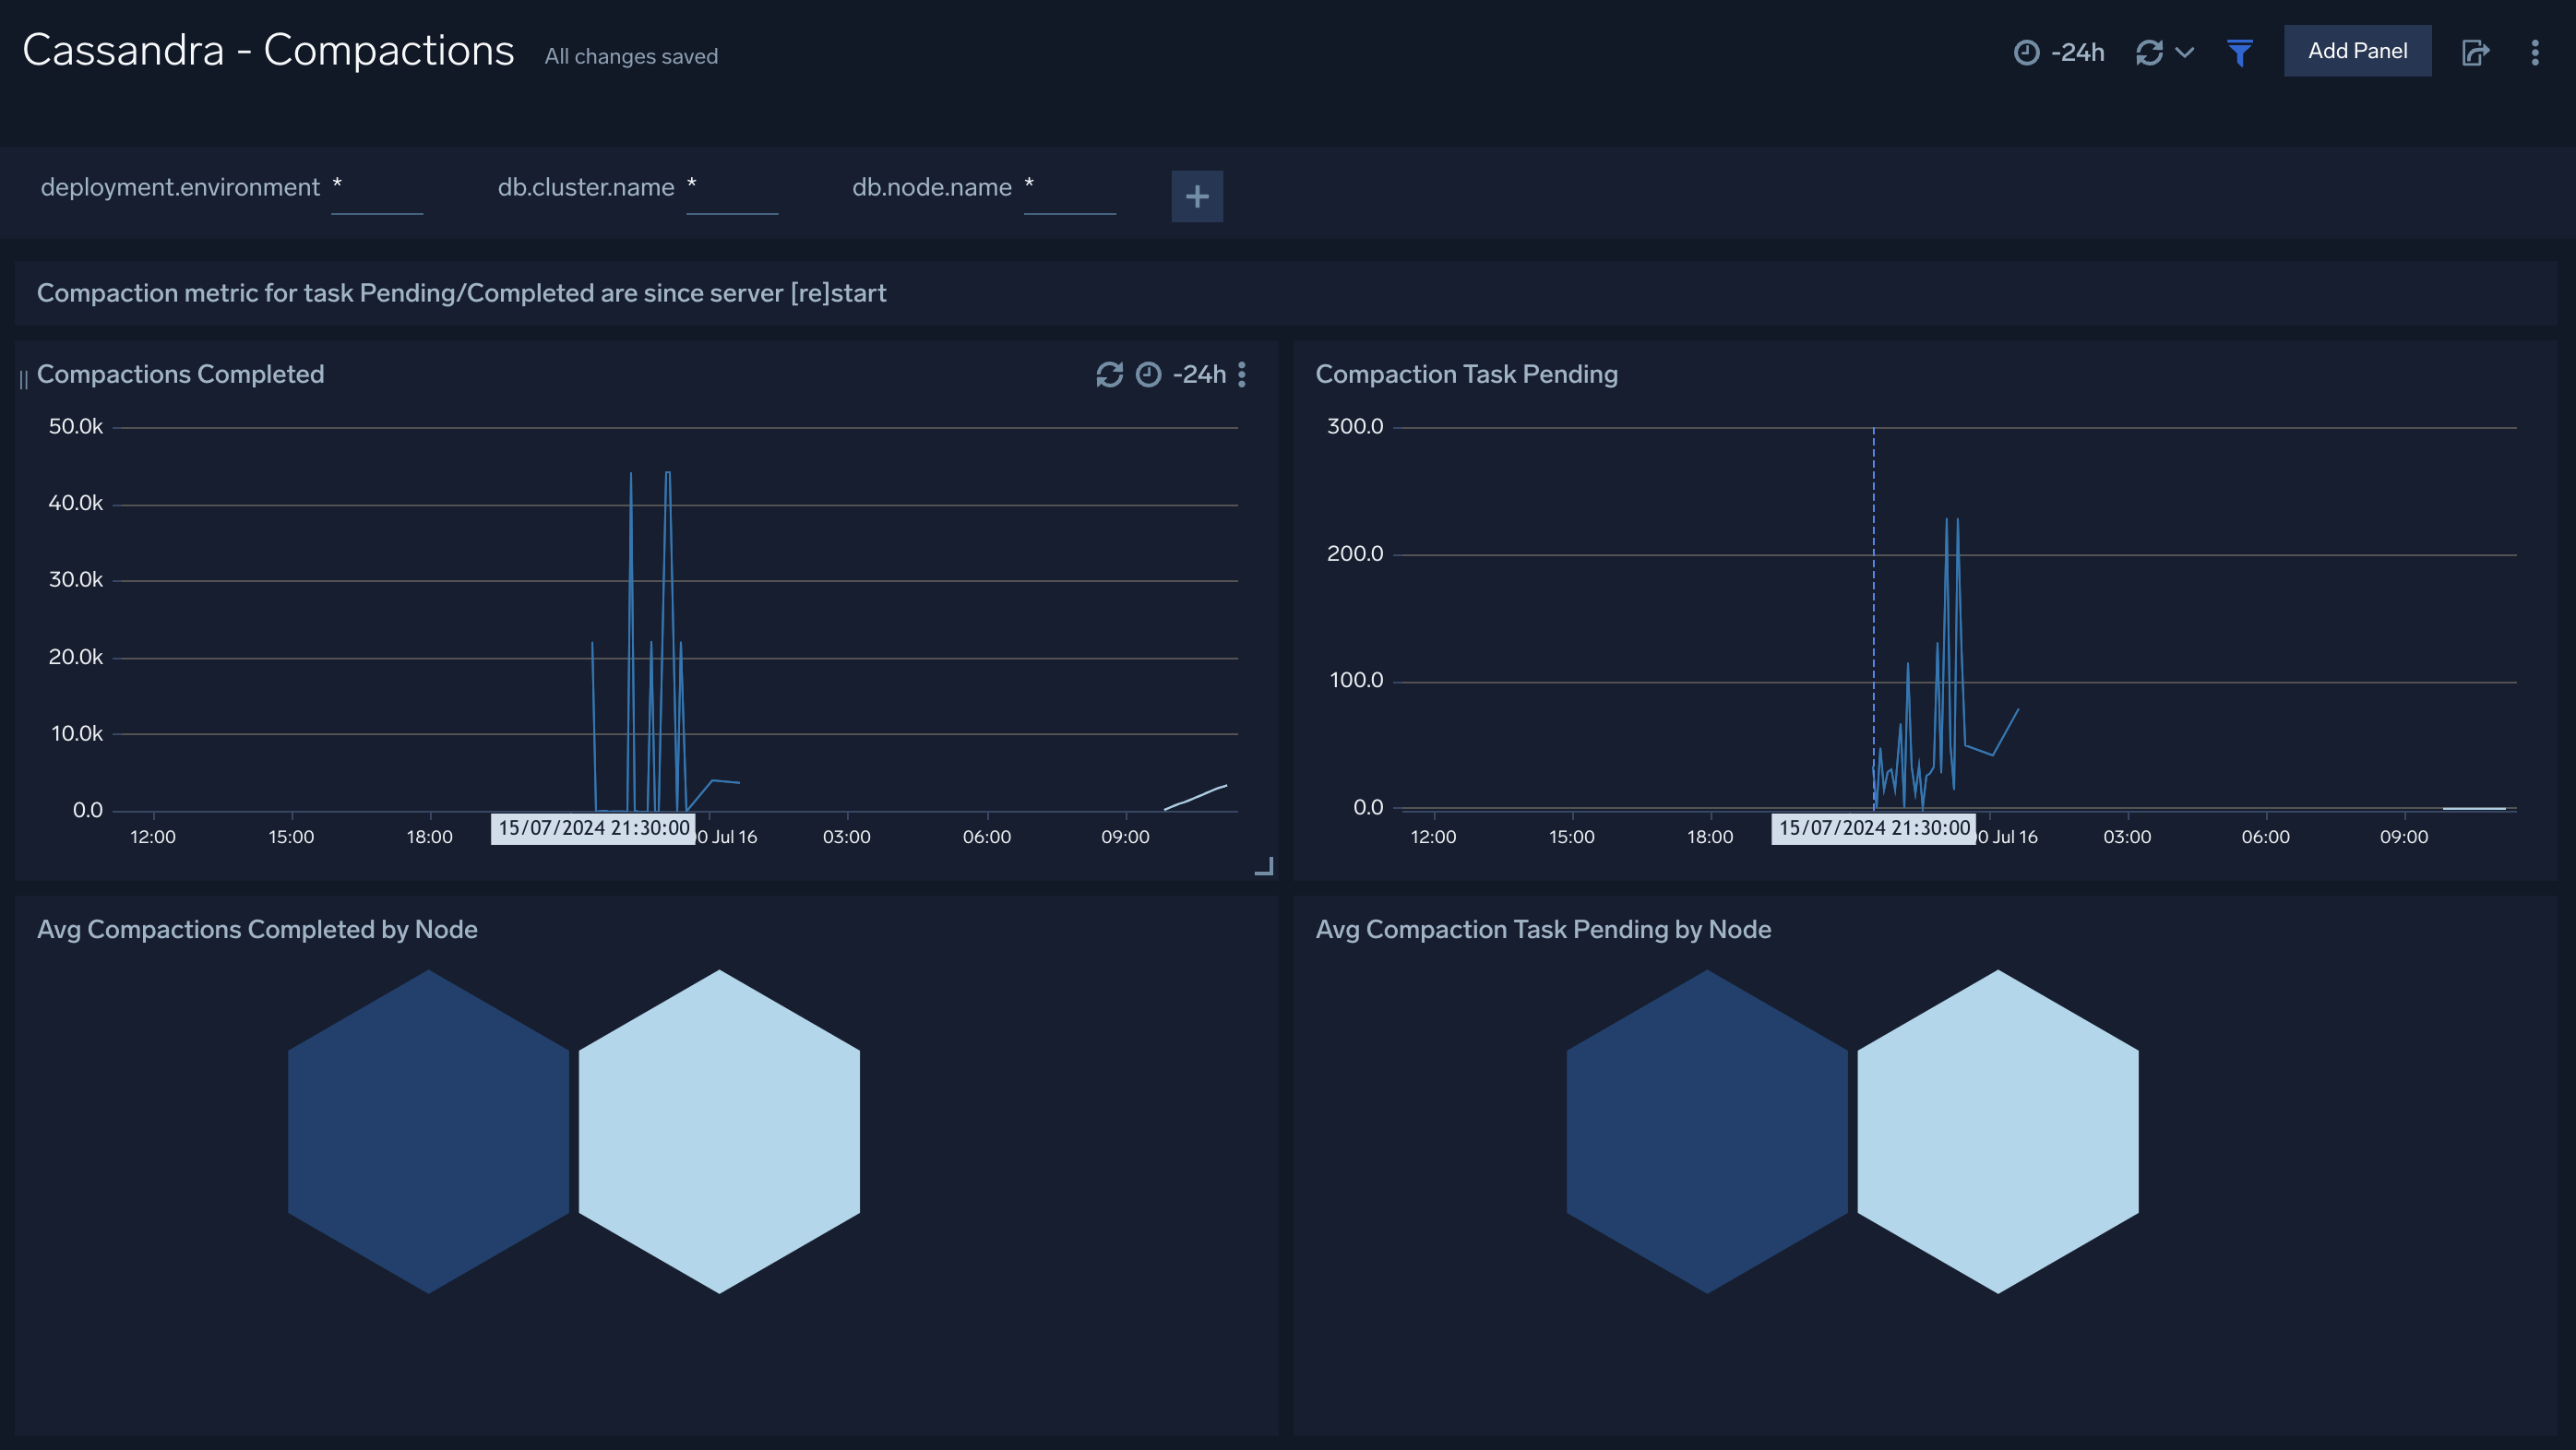
Compaction
The Cassandra - Compactions dashboard provides insight into the completed and pending compaction tasks.
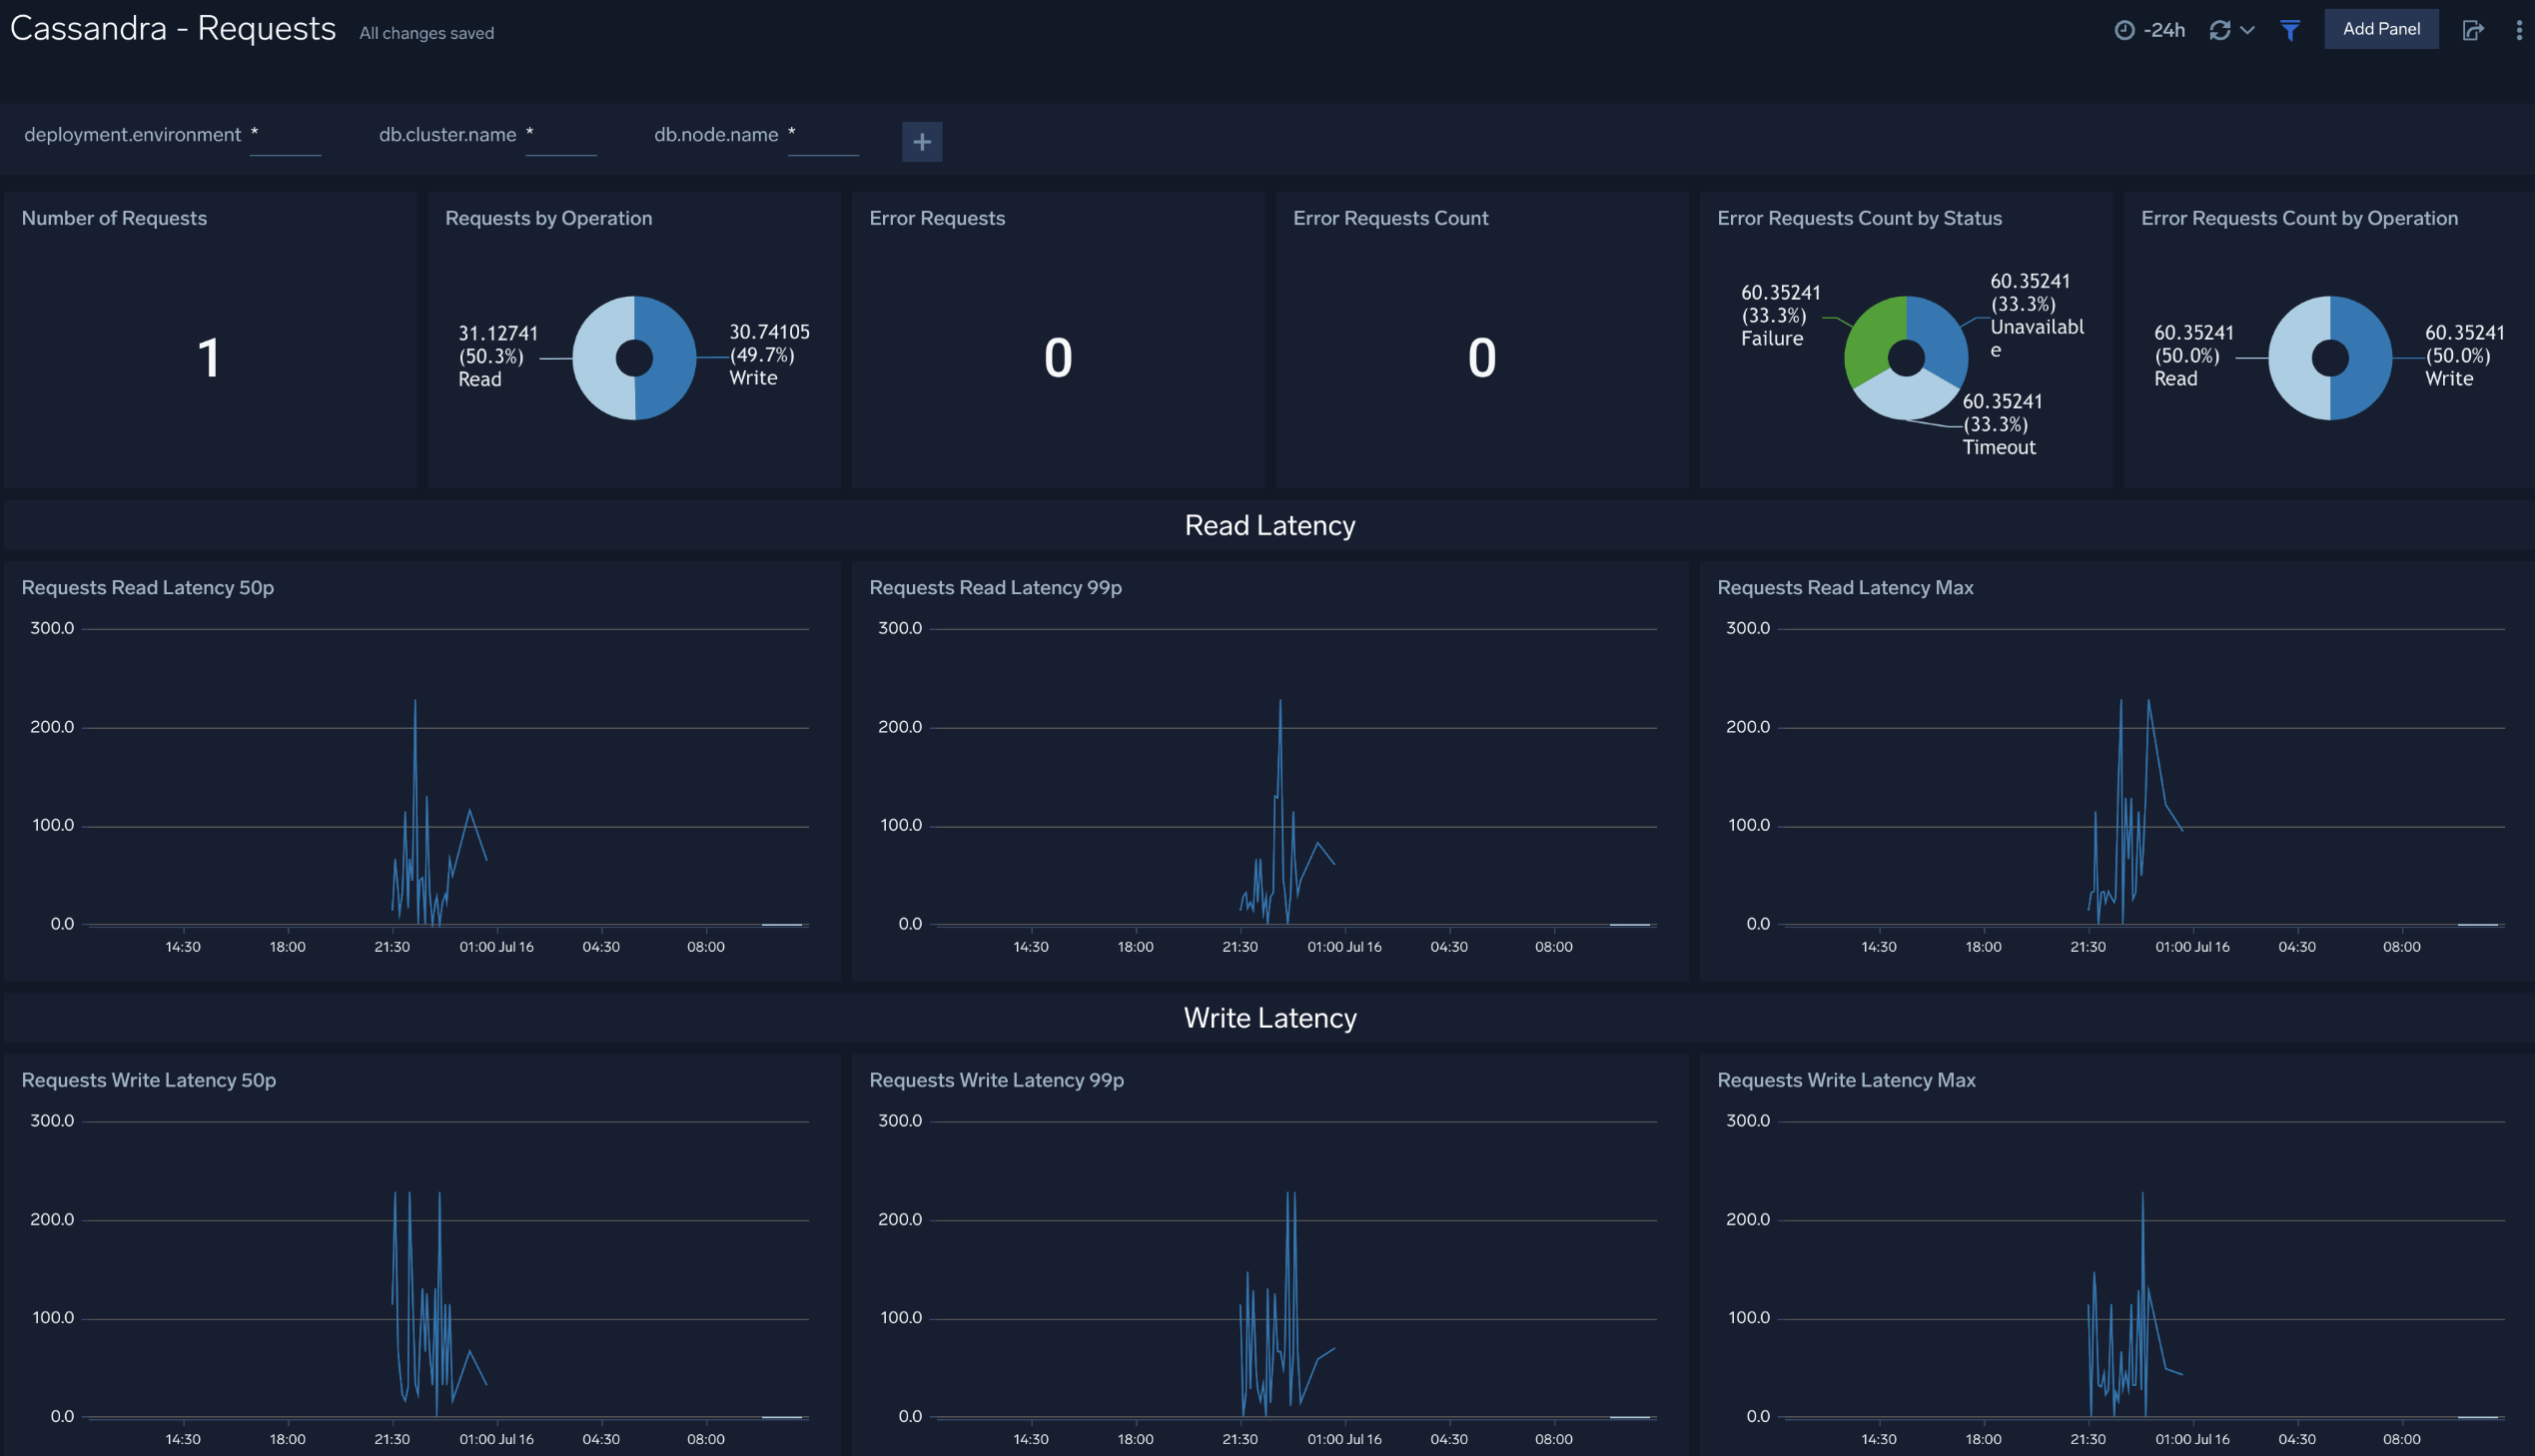
Requests
The Cassandra - Requests dashboard provides insight into the number of request served, number of error request, and their distribution by status and operation. Also you can monitor the read and write latency of the cluster instance using this dashboard.
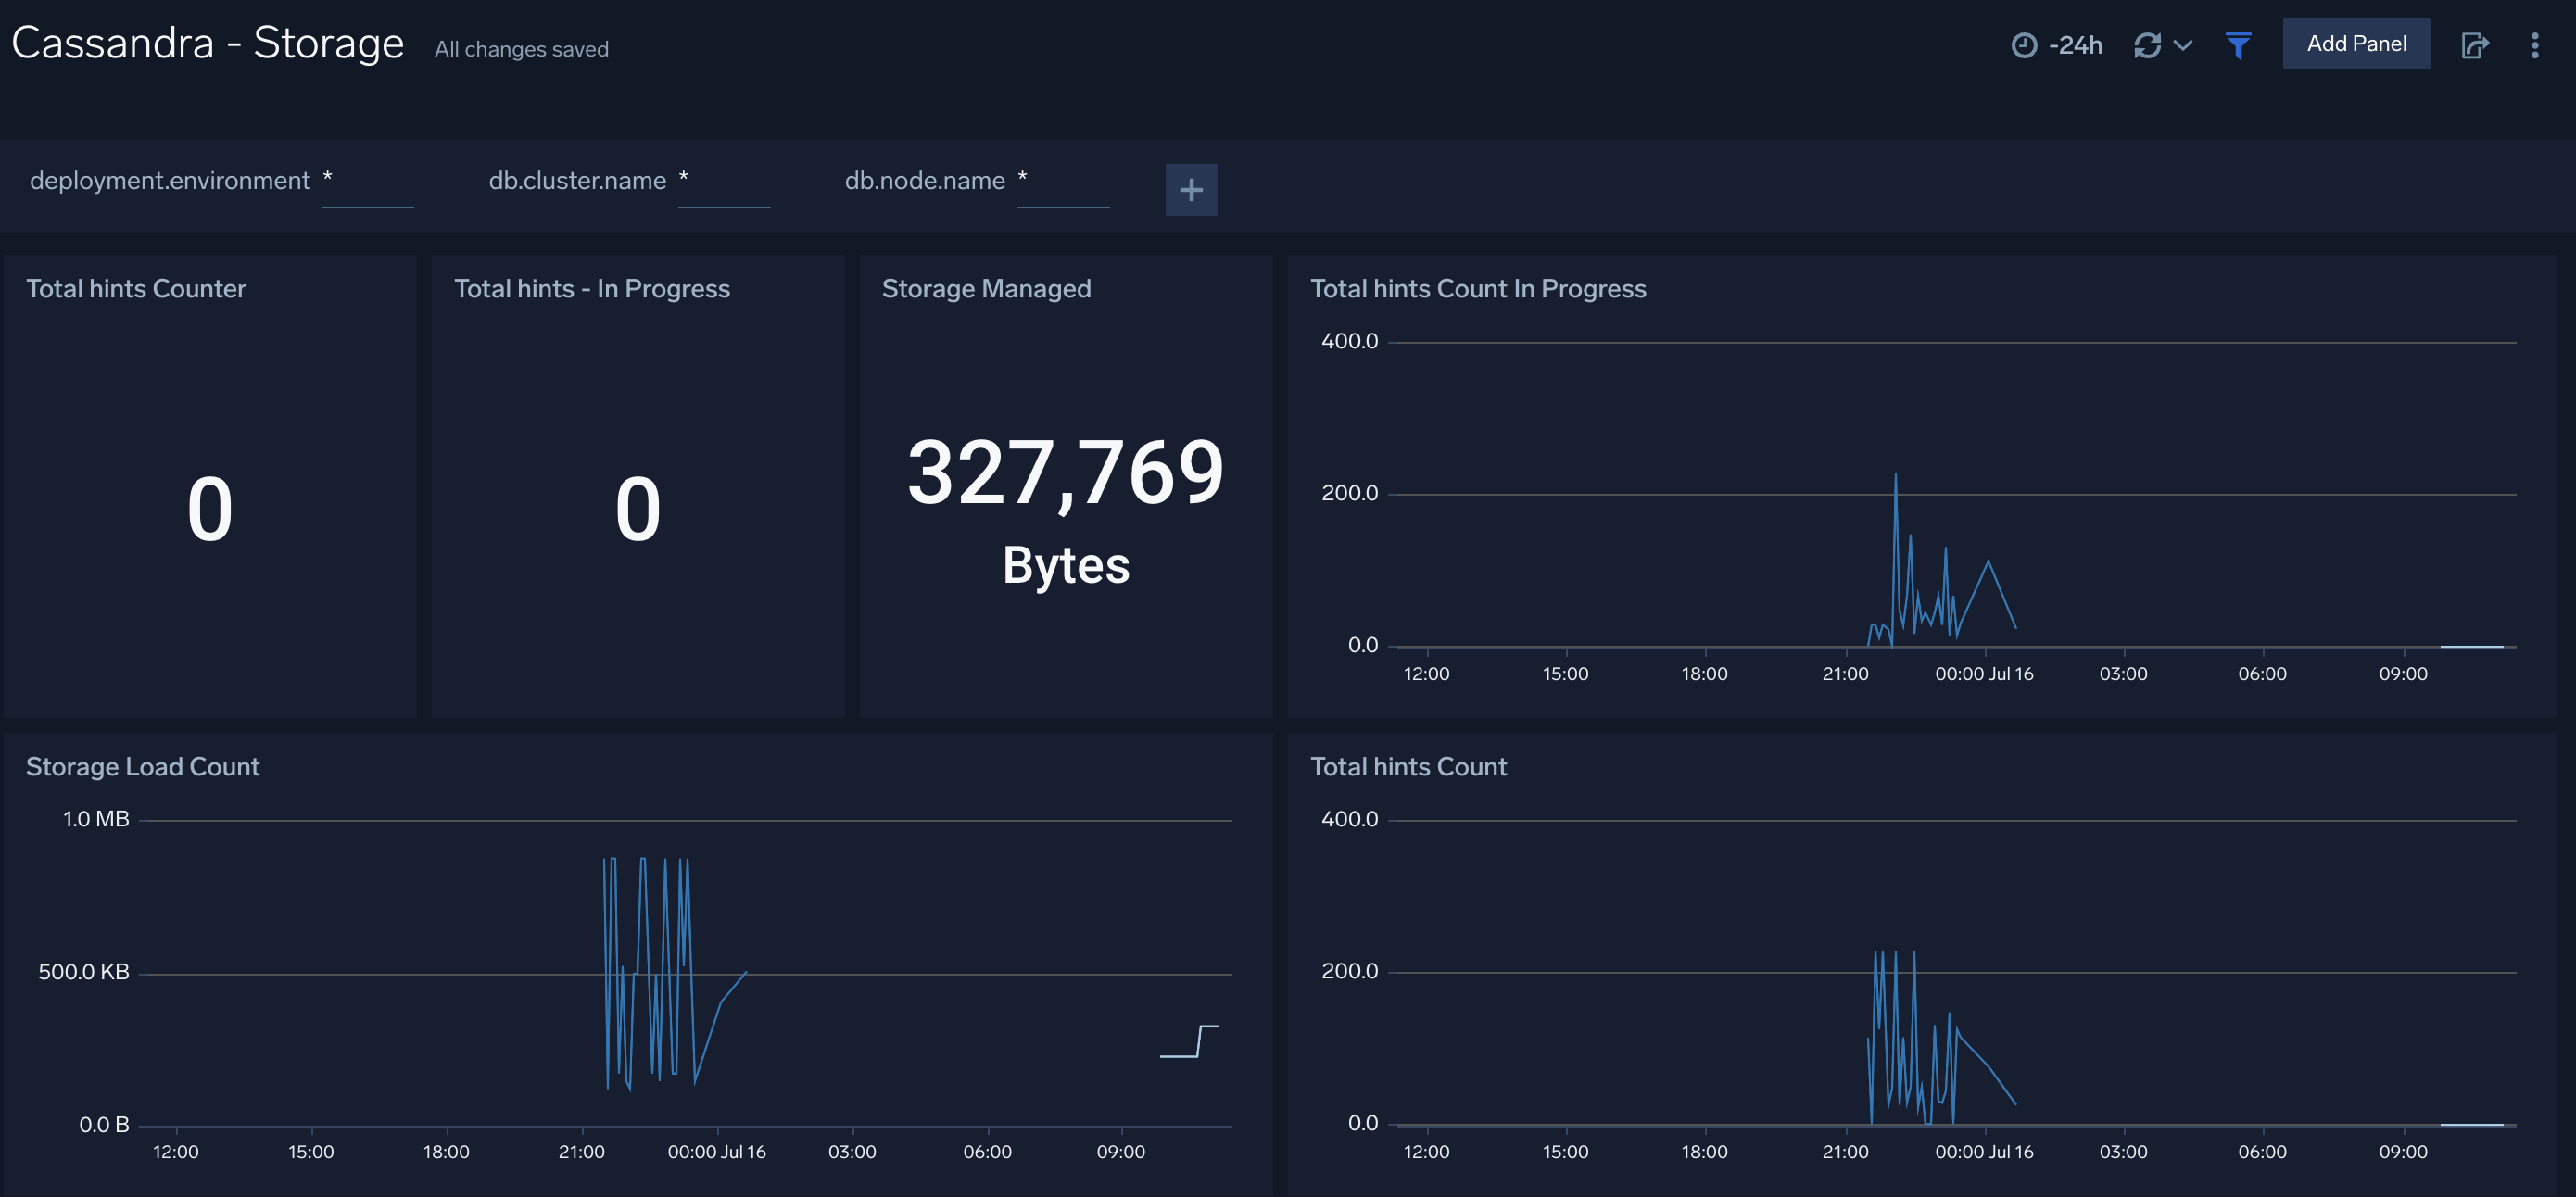
Storage
The Cassandra - Storage dashboard provides insight into the current value of total hints of your Cassandra cluster along with storage managed by the cluster.
Create monitors for Cassandra app
From your App Catalog:
- From the Sumo Logic navigation, select App Catalog.
- In the Search Apps field, search for and then select your app.
- Make sure the app is installed.
- Navigate to What's Included tab and scroll down to the Monitors section.
- Click Create next to the pre-configured monitors. In the create monitors window, adjust the trigger conditions and notifications settings based on your requirements.
- Scroll down to Monitor Details.
- Under Location click on New Folder.
note
By default, monitor will be saved in the root folder. So to make the maintenance easier, create a new folder in the location of your choice.
- Enter Folder Name. Folder Description is optional.
tip
Using app version in the folder name will be helpful to determine the versioning for future updates.
- Click Create. Once the folder is created, click on Save.
Cassandra alerts
| Name | Description | Alert Condition | Recover Condition |
|---|---|---|---|
Cassandra - Compaction Task Pending | This alert is triggered when there are more than 15 pending Compaction tasks. | Count > = 15 | Count < 15 |
Cassandra - High Hints Backlog | This alert is triggered when the number of in-progress hints exceeds the given value for 5 minutes. | Count > = 5000 | Count < 5000 |
Cassandra - High Memory Usage | This alert is triggered when memory used exceeds 85% of committed memory for more than 10 minutes. | Count > = 1 | Count < 1 |
Cassandra - Node Down Alert | This alert is triggered when a Cassandra node status changes to DOWN for more than 5 minutes. | Count > = 1 | Count < 1 |
Cassandra - Operation Error Rate High | This alert is triggered when the error rate of operations exceeds given value (Default 5%) for 5 minutes. | Count > 5 | Count < = 5 |
Cassandra - Range Query Latency High (99th Percentile) | This alert is triggered when the 99th percentile of range query latency exceeds the given value (Default 2 seconds) for 5 minutes. | Count > = 2000000 | Count < 2000000 |
Cassandra - Read Latency High (99th Percentile) | This alert is triggered when the 99th percentile of read latency exceeds given value (Default 500ms) for 5 minutes. | Count > = 500000 | Count < 500000 |
Cassandra - Storage Growth Rate Abnormal | This alert is triggered when the storage growth rate exceeds given value (Default 25MB/minute) for 5 minutes. | Count > = 26214400 | Count < 26214400 |
Cassandra - Write Latency High (99th Percentile) | This alert is triggered when the 99th percentile of write latency exceeds given value (Default 200ms) for 5 minutes. | Count > = 200000 | Count < 200000 |