Oracle - OpenTelemetry Collector

The Oracle app is a logs and metrics based app. Preconfigured dashboards and searches provide insight into the listeners, audit logs (traditional - sys/xml and unified), performance, and security. It also gives insight around count of rollback, commits, transaction, process, session, hard parse, and DML locks.
This app is tested with the following Oracle versions:
- Non-Kubernetes: Oracle Database 23 Release 23.4.0.24.05.
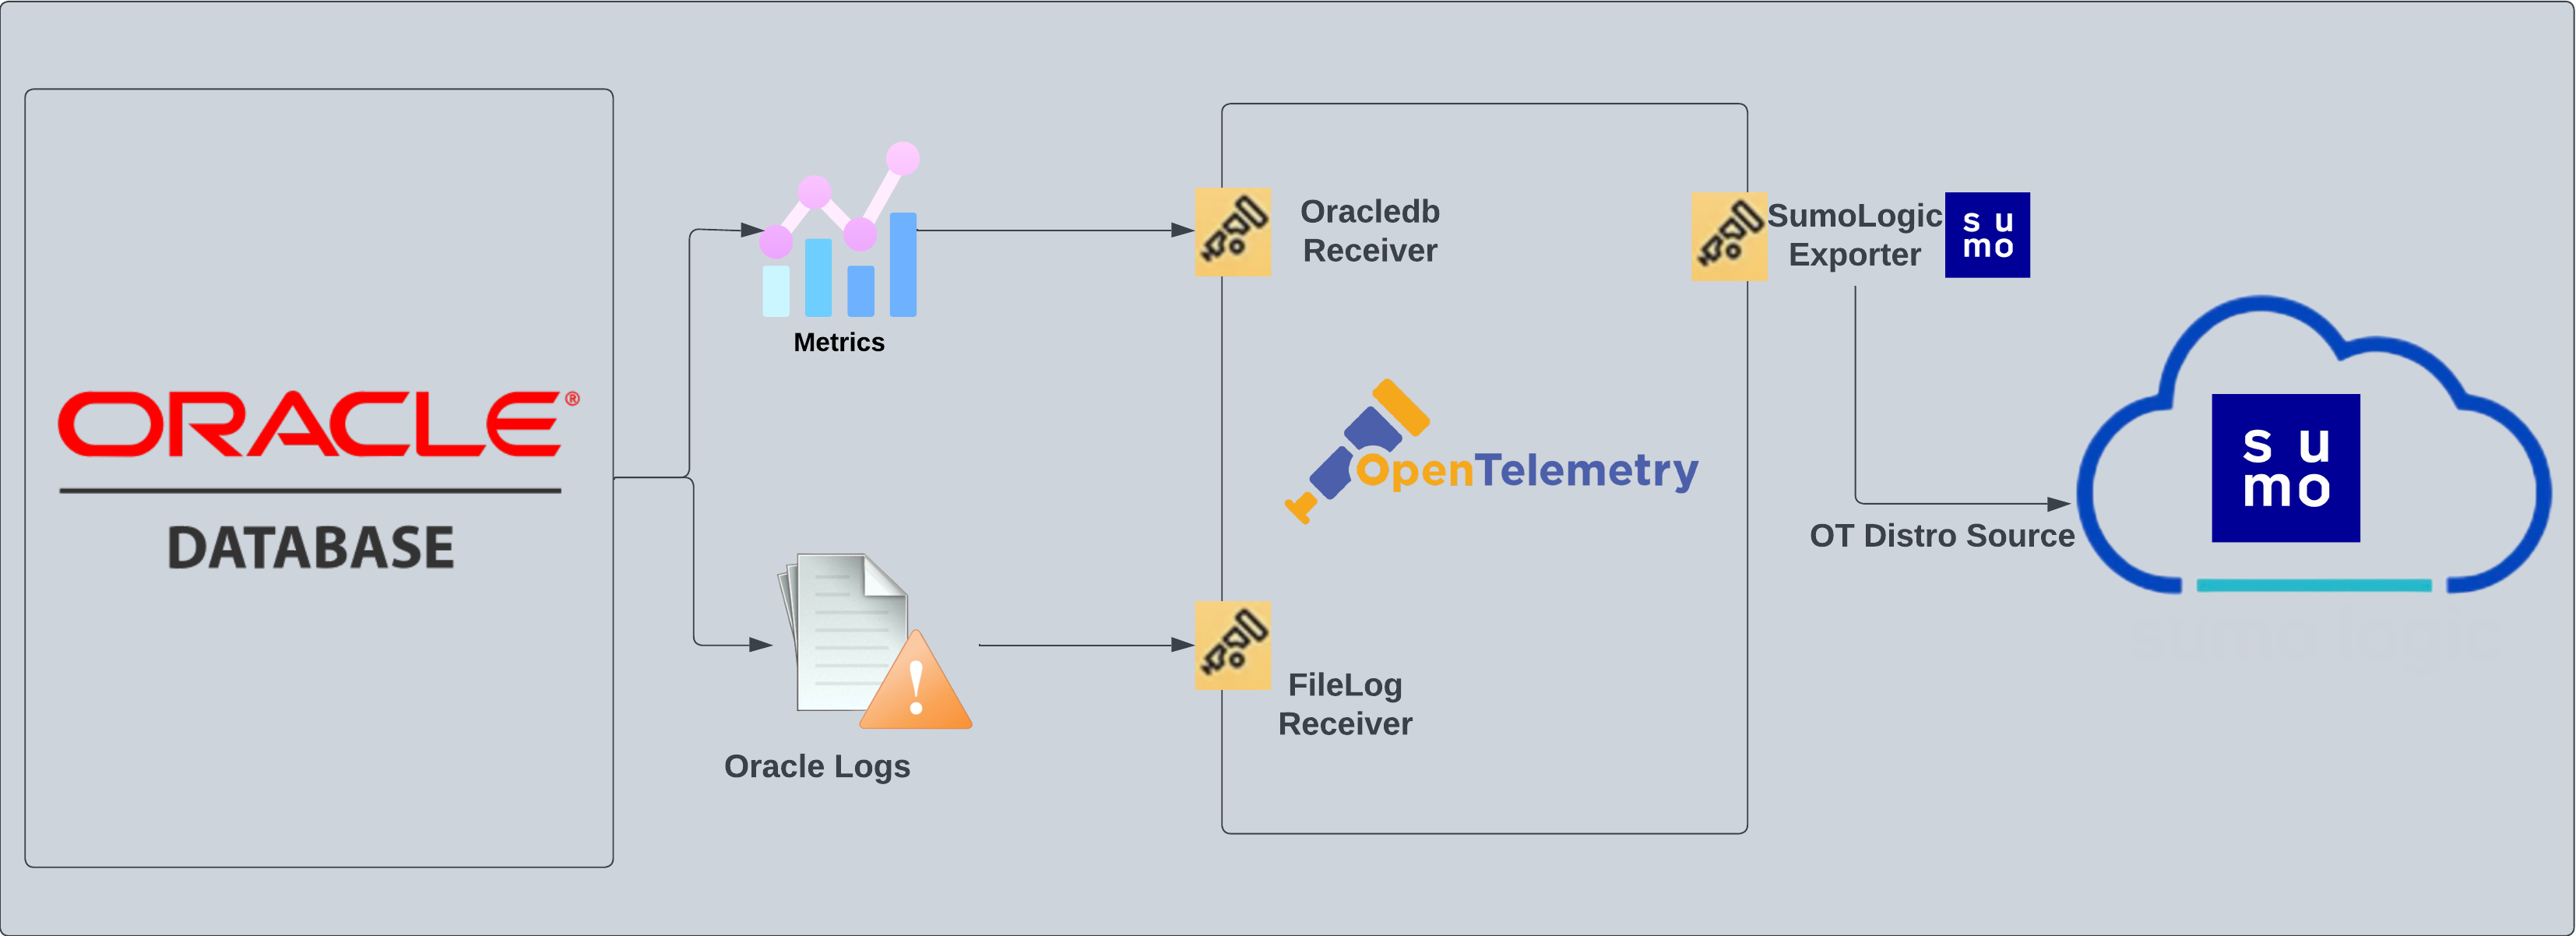
Oracle logs, such as listener, alert, and traditional audit logs (Oracle version 19c and below) are sent to Sumo Logic through OpenTelemetry filelog receiver whereas, unified audit logs (Oracle version 21c and above) are collected through syslog for the Linux environment and windowseventlog receiver for windows environment.
Metrics are collected through Oracledb receiver.
Fields creation in Sumo Logic for Oracle
Following are the tags which that be created as part of Oracle App install if not already present.
sumo.datasource. Has a fixed value of oracle.db.system. Has a fixed value of oracle.db.cluster.name. User configured. Enter a name to identify this Oracle cluster. This cluster name will be shown in the Sumo Logic dashboards.db.node.name. Has the value of host name of the machine which is being monitored.
Prerequisites
For metrics collection
You will need to assign these permissions to the database user used to fetch metrics:
GRANT SELECT ON V_$SESSION TO <username>;
GRANT SELECT ON V_$SYSSTAT TO <username>;
GRANT SELECT ON V_$RESOURCE_LIMIT TO <username>;
GRANT SELECT ON DBA_TABLESPACES TO <username>;
GRANT SELECT ON DBA_DATA_FILES TO <username>;
GRANT SELECT ON DBA_TABLESPACE_USAGE_METRICS TO <username>;
For logs collection
Here are the steps required to configure log collection for Oracle running on a non-Kubernetes environment.
- Enable Oracle logging
- Verify log files path
- Set up Oracle performance metrics script
- Configure three local log file Sources
Enable Oracle logging
If logging is not enabled, you can configure it by following the steps below.
- Alert log. Alert logs contain important information about error messages and exceptions that occur during database operations.
- Listener log. To enable listener log, run the following commands from
ORACLE_HOME/bin:lsnrctl command [listener_name]
lsnrctl set log_status on - Audit Log. Traditional auditing is deprecated in Oracle Database 21c. If you are using version 19c or below follow this guide to enable Audit Logs. For version 21c and above, follow this to enable exporting for unified audit logs through syslog for Oracle on Linux and windows event logs for Oracle on Windows.
Verify local logs file directories and path
- Oracle Alert Logs. For 11g and later releases (12c, 18c, 19c, 21c, 23c). By default, Oracle logs are stored in
$ORACLE_BASE/diag/rdbms/$DB_UNIQUE_NAME/$ORACLE_SID/trace/. The default directory for log files is stored inBACKGROUND_DUMP_DESTparameter. You can query the value ofBACKGROUND_DUMP_DEST, an initialization parameter, where you can find Oracle alert log by executing the command below:SQL > show parameter background_dump_dest; - Oracle Listener Logs. You can check listener log file with the following command:
[oracle@sumolab alert]$ lsnrctl status - Oracle Audit Logs.
-
For Oracle version 19c and below. By default, Oracle logs are stored in
$ORACLE_BASE/app/oracle/admin/orcl/adumpThe default directory for log files is stored as the value of
audit_file_dest. In order to display it, run the following command:SQL> show parameter audit.Audit Logs should be in either
XML,EXTENDED, or{{OS }}format for the app to work.The location of these logs will be required when you set up the app through the app catalog.
-
For Oracle version 21c and above. Based on the Unified audit policy configured, audit logs exported will be directly ingested to Sumo Logic using syslog or windows event log. For the Linux environment, instead of redirecting audit logs to a file, we need to redirect them to the local port. In the next step, the OTel collector can be configured to listen to this port and then send the log to Sumo Logic. This can be done using the below configuration in the
rsyslog.conf:local7.info @@127.0.0.1:10514This will redirect all the unified audit logs to localhost port 10514.
-
Performance metrics script setup
To set up the performance metrics script on Linux and Windows for the Oracle app:
- Follow these instructions for your operating system. You do not need to configure the Sumo Logic Script Source at this time.
- As per the above instructions, once the python script is available locally, you need to trigger this script periodically by copying the cronJob.py file. This will generate an output log file, path for which needs to be given at the time of app installation. Based on your platform please follow the steps below:
- Linux
- Windows
Configure a cron job to trigger the python script using crontab. Frequency of this job can be set following the instructions from here.
-
To find the python3 path, you can run:
which python3 -
Here is the command which needs to be configured as part of cron to trigger the script:
<frequency_expression> <output_of_which_python3> <path_to_cronJob.py> <path_to_oracle-perf-monitor.py> <timeout_in_seconds> <output_location_of_file>
- Find the location of python.exe by running:
where python3 - Create a
.batfile with the following arguments:@ECHO OFF
<output_of_where_python3> <path_to_cronJob.py> <path_to_oracle-perf-monitor.py> <timeout_in_seconds> <output_location_of_file>
The .bat file created above can then be triggered periodically using windows Task Scheduler following an example here.
For Linux systems with ACL Support, the otelcol install process should have created the ACL grants necessary for the otelcol system user to access default log locations. You can verify the active ACL grants using the getfacl command. Install the ACL in your Linux environment, if not installed.
The required ACL may not be supported for some rare cases, for example, Linux OS Distro, which is officially not supported by Sumo Logic. In this case, you can run the following command to explicitly grant the permissions.
sudo setfacl -R -m d:u:otelcol-sumo:r-x,d:g:otelcol-sumo:r-x,u:otelcol-sumo:r-x,g:otelcol-sumo:r-x <PATH_TO_LOG_FILE>
Run the above command for all the log files in the directory that need to be ingested, which are not residing in the default location.
If Linux ACL Support is not available, traditional Unix-styled user and group permission must be modified. It should be sufficient to add the otelcol system user to the specific group that has access to the log files.
For Windows systems, log files which are collected should be accessible by the SYSTEM group. Use the following set of PowerShell commands if the SYSTEM group does not have access.
$NewAcl = Get-Acl -Path "<PATH_TO_LOG_FILE>"
# Set properties
$identity = "NT AUTHORITY\SYSTEM"
$fileSystemRights = "ReadAndExecute"
$type = "Allow"
# Create new rule
$fileSystemAccessRuleArgumentList = $identity, $fileSystemRights, $type
$fileSystemAccessRule = New-Object -TypeName System.Security.AccessControl.FileSystemAccessRule -ArgumentList $fileSystemAccessRuleArgumentList
# Apply new rule
$NewAcl.SetAccessRule($fileSystemAccessRule)
Set-Acl -Path "<PATH_TO_LOG_FILE>" -AclObject $NewAcl
Collection configuration and app installation
As part of data collection setup and app installation, you can select the App from App Catalog and click on Install App. Follow the steps below.
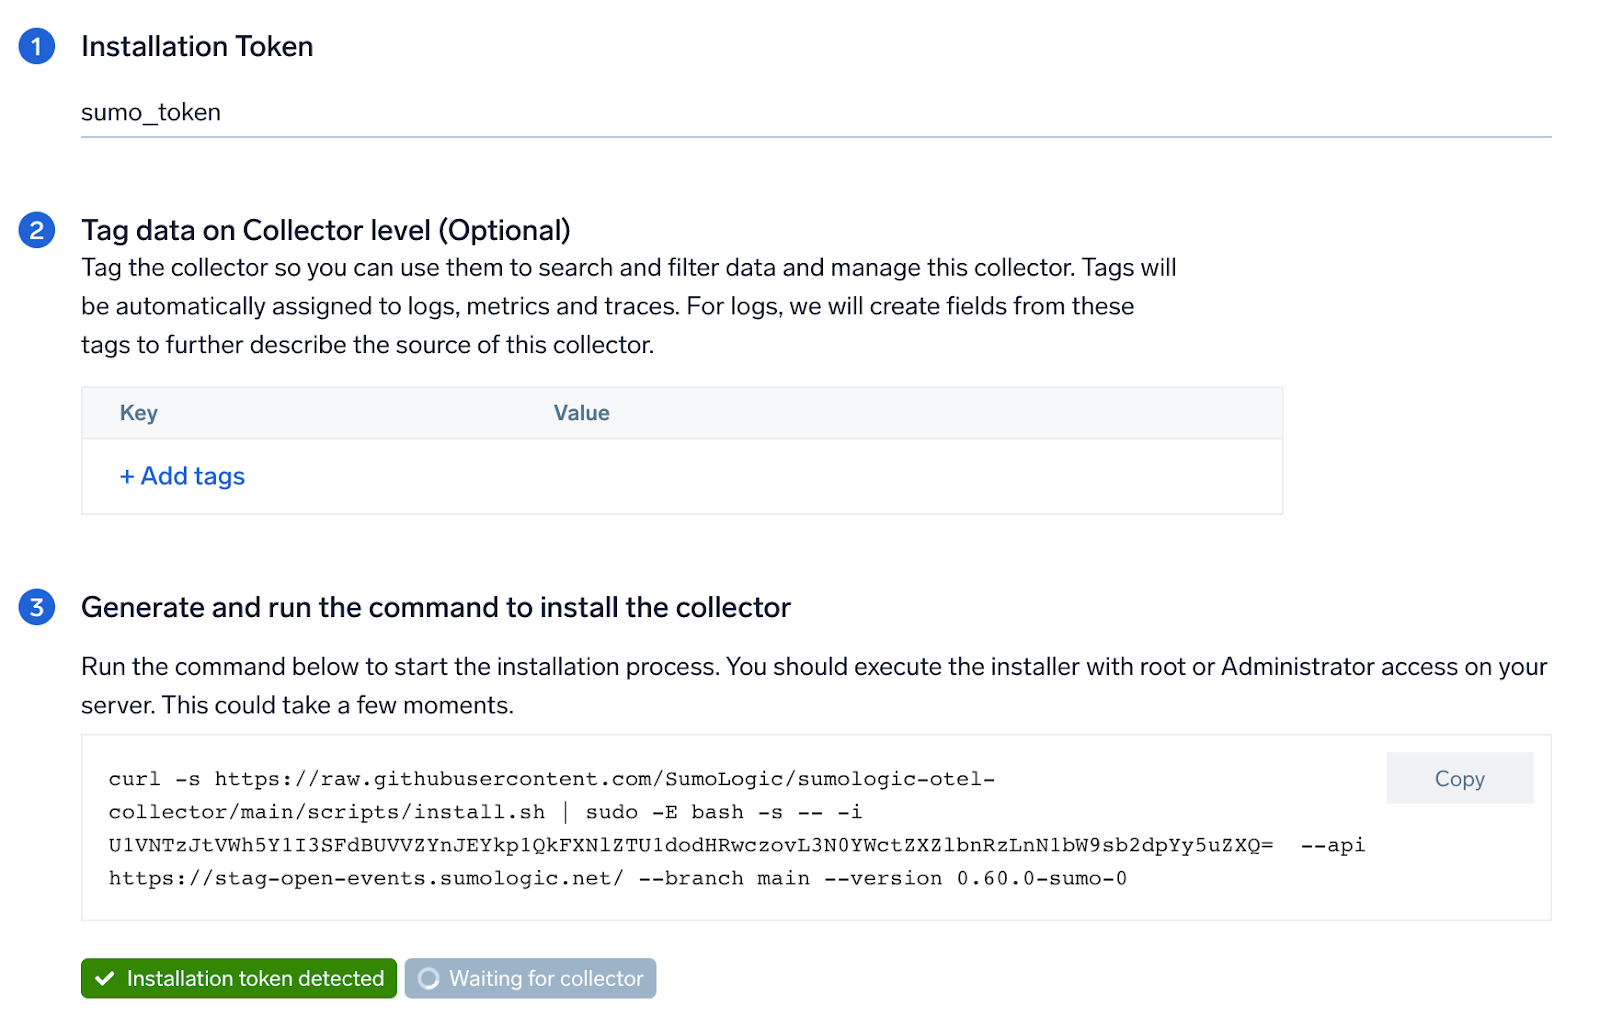
Step 1: Set up the Collector
If you want to use an existing OpenTelemetry Collector, you can skip this step by selecting the Use an existing Collector option.
To create a new Collector:
- Select the Add a new Collector option.
- Select the platform where you want to install the Sumo Logic OpenTelemetry Collector.
This will generate a command that you can execute in the machine environment you need to monitor. Once executed, it will install the Sumo Logic OpenTelemetry Collector.
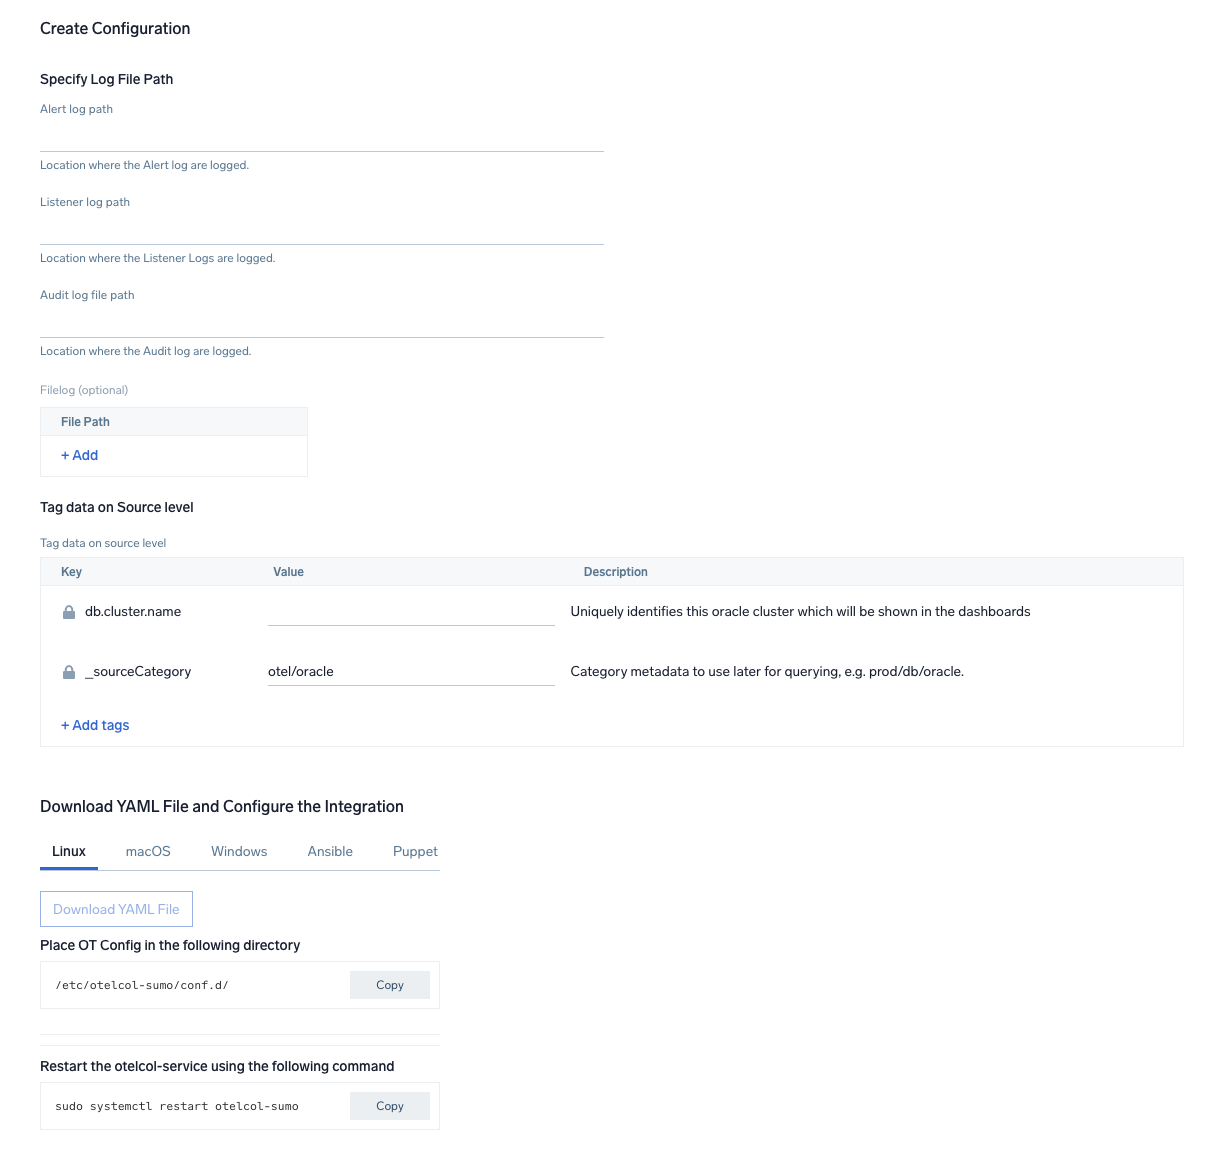
Step 2: Configure integration
In this step, you will configure the yaml required for Oracle Collection. Below are the inputs required:
Alert Logs. Path of the log file configured to capture oracle alert logs.Listener Logs. Path of the log file configured to capture oracle listener logs .Audit Logs.- For Traditional Audit Logs, path of the log file is configured to capture oracle audit logs.
- For Unified Audit Logs, you need to select the OS where the Oracle is setup - Windows or Linux. For Oracle on Windows machine, no parameter is required. Only respective event IDs will be ingested. For the Linux environment, you need to provide the port (configured in pre-requisite steps for the Linux environment) which the syslog receiver should listen to for sending the logs to Sumo Logic.
Performance metric script-based logs. Path of the log file configured to capture log generated through script can be configured in other logs.Endpoint (no default). Endpoint used to connect to the OracleDB server. Must be in the format ofhost:port.username. Username for the OracleDB connection.password. Password for the OracleDB connection. Special characters are allowed.service. OracleDB Service that the receiver should connect to.Collection Interval. You can specify at what interval should the metrics be collected.
You can add any custom fields which you want to tag along with the data ingested in Sumo Logic.
Once the details are filled, click on the Download YAML File button to get the yaml file.
If you're using a username and password with OpenTelemetry Collector version ≥ 0.104, we recommend using the downloaded config with an environment variable, for example: ${environment_variable}.
On Linux, click Download Environment Variables File to get a file that includes the password, which should be set as an environment variable.
Step 3: Send logs and metrics to Sumo Logic
Once you have downloaded the YAML file as described in the previous step, follow the below steps based on your platform.
- Linux
- Windows
- macOS
- Chef
- Ansible
- Puppet
- Copy the yaml file to
/etc/otelcol-sumo/conf.d/folder in the Oracle instance which needs to be monitored. - Place Env file in the following directory:
/etc/otelcol-sumo/env/
- Restart the collector using:
sudo systemctl restart otelcol-sumo
- Copy the yaml file to
C:\ProgramData\Sumo Logic\OpenTelemetry Collector\config\conf.dfolder in the machine which needs to be monitored. - Restart the collector using:
Restart-Service -Name OtelcolSumo
- Copy the yaml file to
/etc/otelcol-sumo/conf.d/folder in the Oracle instance which needs to be monitored. - Restart the otelcol-sumo process using:
otelcol-sumo --config /etc/otelcol-sumo/sumologic.yaml --config "glob:/etc/otelcol-sumo/conf.d/*.yaml"
- Copy the yaml file into your Chef cookbook files directory
files/<downloaded_yaml_file>. - Use a Chef file resource in a recipe to manage it.
cookbook_file '/etc/otelcol-sumo/conf.d/<downloaded_yaml_file>' do mode 0644 notifies :restart, 'service[otelcol-sumo]', :delayed end - Add the recipe to your collector setup to start collecting the data. Every team typically has their established way of applying the Chef recipe. The resulting Chef recipe should look something like:
cookbook_file '/etc/otelcol-sumo/conf.d/<downloaded_yaml_file>' do
mode 0644
notifies :restart, 'service[otelcol-sumo]', :delayed
end
- Place the file into your Ansible playbook files directory.
- Run the Ansible playbook.
ansible-playbook -i inventory install_sumologic_otel_collector.yaml
-e '{"installation_token": "<YOUR_TOKEN>", "collector_tags": {<YOUR_TAGS>}, "src_config_path": "files/conf.d"}'
- Place the file into your Puppet module files directory
modules/install_otel_collector/files/<downloaded_yaml>. - Use a Puppet file resource to manage it.
file { '/etc/otelcol-sumo/conf.d/<downloaded_yaml_file>':
    ensure => present,
    source => 'puppet:///modules/install_otel_collector/<downloaded_yaml_file>',
    mode => '0644',
    notify => Service[otelcol-sumo],
} - Apply the Puppet manifest. Every team typically has their established way of applying the Puppet manifest. The resulting Puppet manifest should look something like:
node 'default' {
    class { 'install_otel_collector'
      installation_token => '<YOUR_TOKEN>',
      collector_tags => { <YOUR_TAGS> },
    }

    service { 'otelcol-sumo':
      provider => 'systemd',
      ensure => running,
      enable => true,
      require => Class['install_otel_collector'],
    }

    file { '/etc/otelcol-sumo/conf.d/<downloaded_yaml_file>':
      ensure => present,
      source => 'puppet:///modules/install_otel_collector/<downloaded_yaml_file>',
      mode => '0644',
      notify => Service[otelcol-sumo],
    }
  }
After successfully executing the above command, Sumo Logic will start receiving data from your host machine.
Click Next. This will install the app (dashboards and monitors) to your Sumo Logic Org.
Dashboard panels will start to fill automatically. It's important to note that each panel fills with data matching the time range query and received since the panel was created. Results won't immediately be available, but within 20 minutes, you'll see full graphs and maps.
Sample log message
Sample log message in Non-Kubernetes environment:
20-Jan-2023 11:02:56 * (CONNECT_DATA=(CID=(PROGRAM=null)(HOST=__jdbc__)(USER=null))(SERVICE_NAME=sumo.cmdb01.com)) * (ADDRESS=(PROTOCOL=TCP)(HOST=124.243.25.82)(PORT=56486)) * establish * sumo.cmdb01.com * 12514

TNS-12514: TNS:listener does not currently know of service requested in connect descriptor
Sample log query
This sample query is from the Oracle - Overview dashboard > DB Connection panel.
 %"db.cluster.name"=* %"deployment.environment"=* %"sumo.datasource"=oracle establish ("SID=" or "SERVICE_NAME=")  | json "log" as _rawlog nodrop
| if (isEmpty(_rawlog), _raw, _rawlog) as oracle_log_message
| parse regex field=oracle_log_message "CONNECT_DATA[\s\S]+?SERVICE_NAME=(?<serviceName>[^)]*)\)[\s\S]+establish" nodrop
| parse regex field=oracle_log_message "CONNECT_DATA[\s\S]+?service_name=(?<serviceName>[^)]*)\)[\s\S]+establish" nodrop
| parse regex field=oracle_log_message "CONNECT_DATA[\s\S]+?SID=(?<SID>[^)]*)\)[\s\S]+establish" nodrop
| parse regex field=oracle_log_message "CONNECT_DATA[\s\S]+?sid=(?<SID>[^)]*)\)[\s\S]+establish" nodrop
| count as %"ConnectionCount"
Sample metrics
{"queryId":"A","oracledb.instance.name":"localhost:1521/FREE","_source":"oracle/oracledb","cloud.platform":"aws_ec2","_metricId":"lZCclGCpxjgi0_E4r4v5ww","host.image.id":"ami-000314be38df8042e","_sourceName":"oracle","cloud.availability_zone":"us-east-1b","host.id":"i-05ce9f3824aa73d10","host.group":"anemaoracle","os.type":"linux","sumo.datasource":"oracle","db.system":"oracle","db.node.name":"ip-10-0-29-37","cloud.account.id":"956882708938","_sourceCategory":"OTC Metric Input","deployment.environment":"anemaoracle","_contentType":"OpenTelemetry","tablespace_name":"SYSTEM","host.type":"m5.large","host.name":"ip-10-0-29-37","metric":"oracledb.tablespace_size.usage","_collectorId":"00005AF310D08C7C","_sourceId":"0000000000000000","unit":"By","db.cluster.name":"test","cloud.region":"us-east-1","cloud.provider":"aws","_sourceHost":"ip-10-0-29-37","_collector":"ip-10-0-29-37","max":1104150528,"min":1104150528,"avg":1104150528,"sum":3312451584,"latest":1104150528,"count":3}
Sample metrics query
This sample query is from the Oracle - Overview dashboard > Session Count panel.
sumo.datasource=oracle metric=oracledb.sessions.usage deployment.environment=* db.cluster.name=* db.node.name=* | sum
Viewing Oracle dashboards
- Oracle - Sys Audit Log, Oracle - Sys Audit Log - Logon Analysis, Oracle - XML Audit Log - Logon Analysis, and Oracle - XML Audit Log - SQL Statement Analysis dashboards will be populated only when collecting logs for Oracle database version 19c and below.
- Oracle - Unified Audit Syslogs dashboard will populate for unified audit log collected for Oracle database version 21c and above.
Overview
See the overview of Oracle listener process activity, including successful DB connections, TNS error information, SID and Service Name usage, and top usage, in terms of ports, database users, user hosts, client hosts, and user programs as derived from the Oracle Listener log.
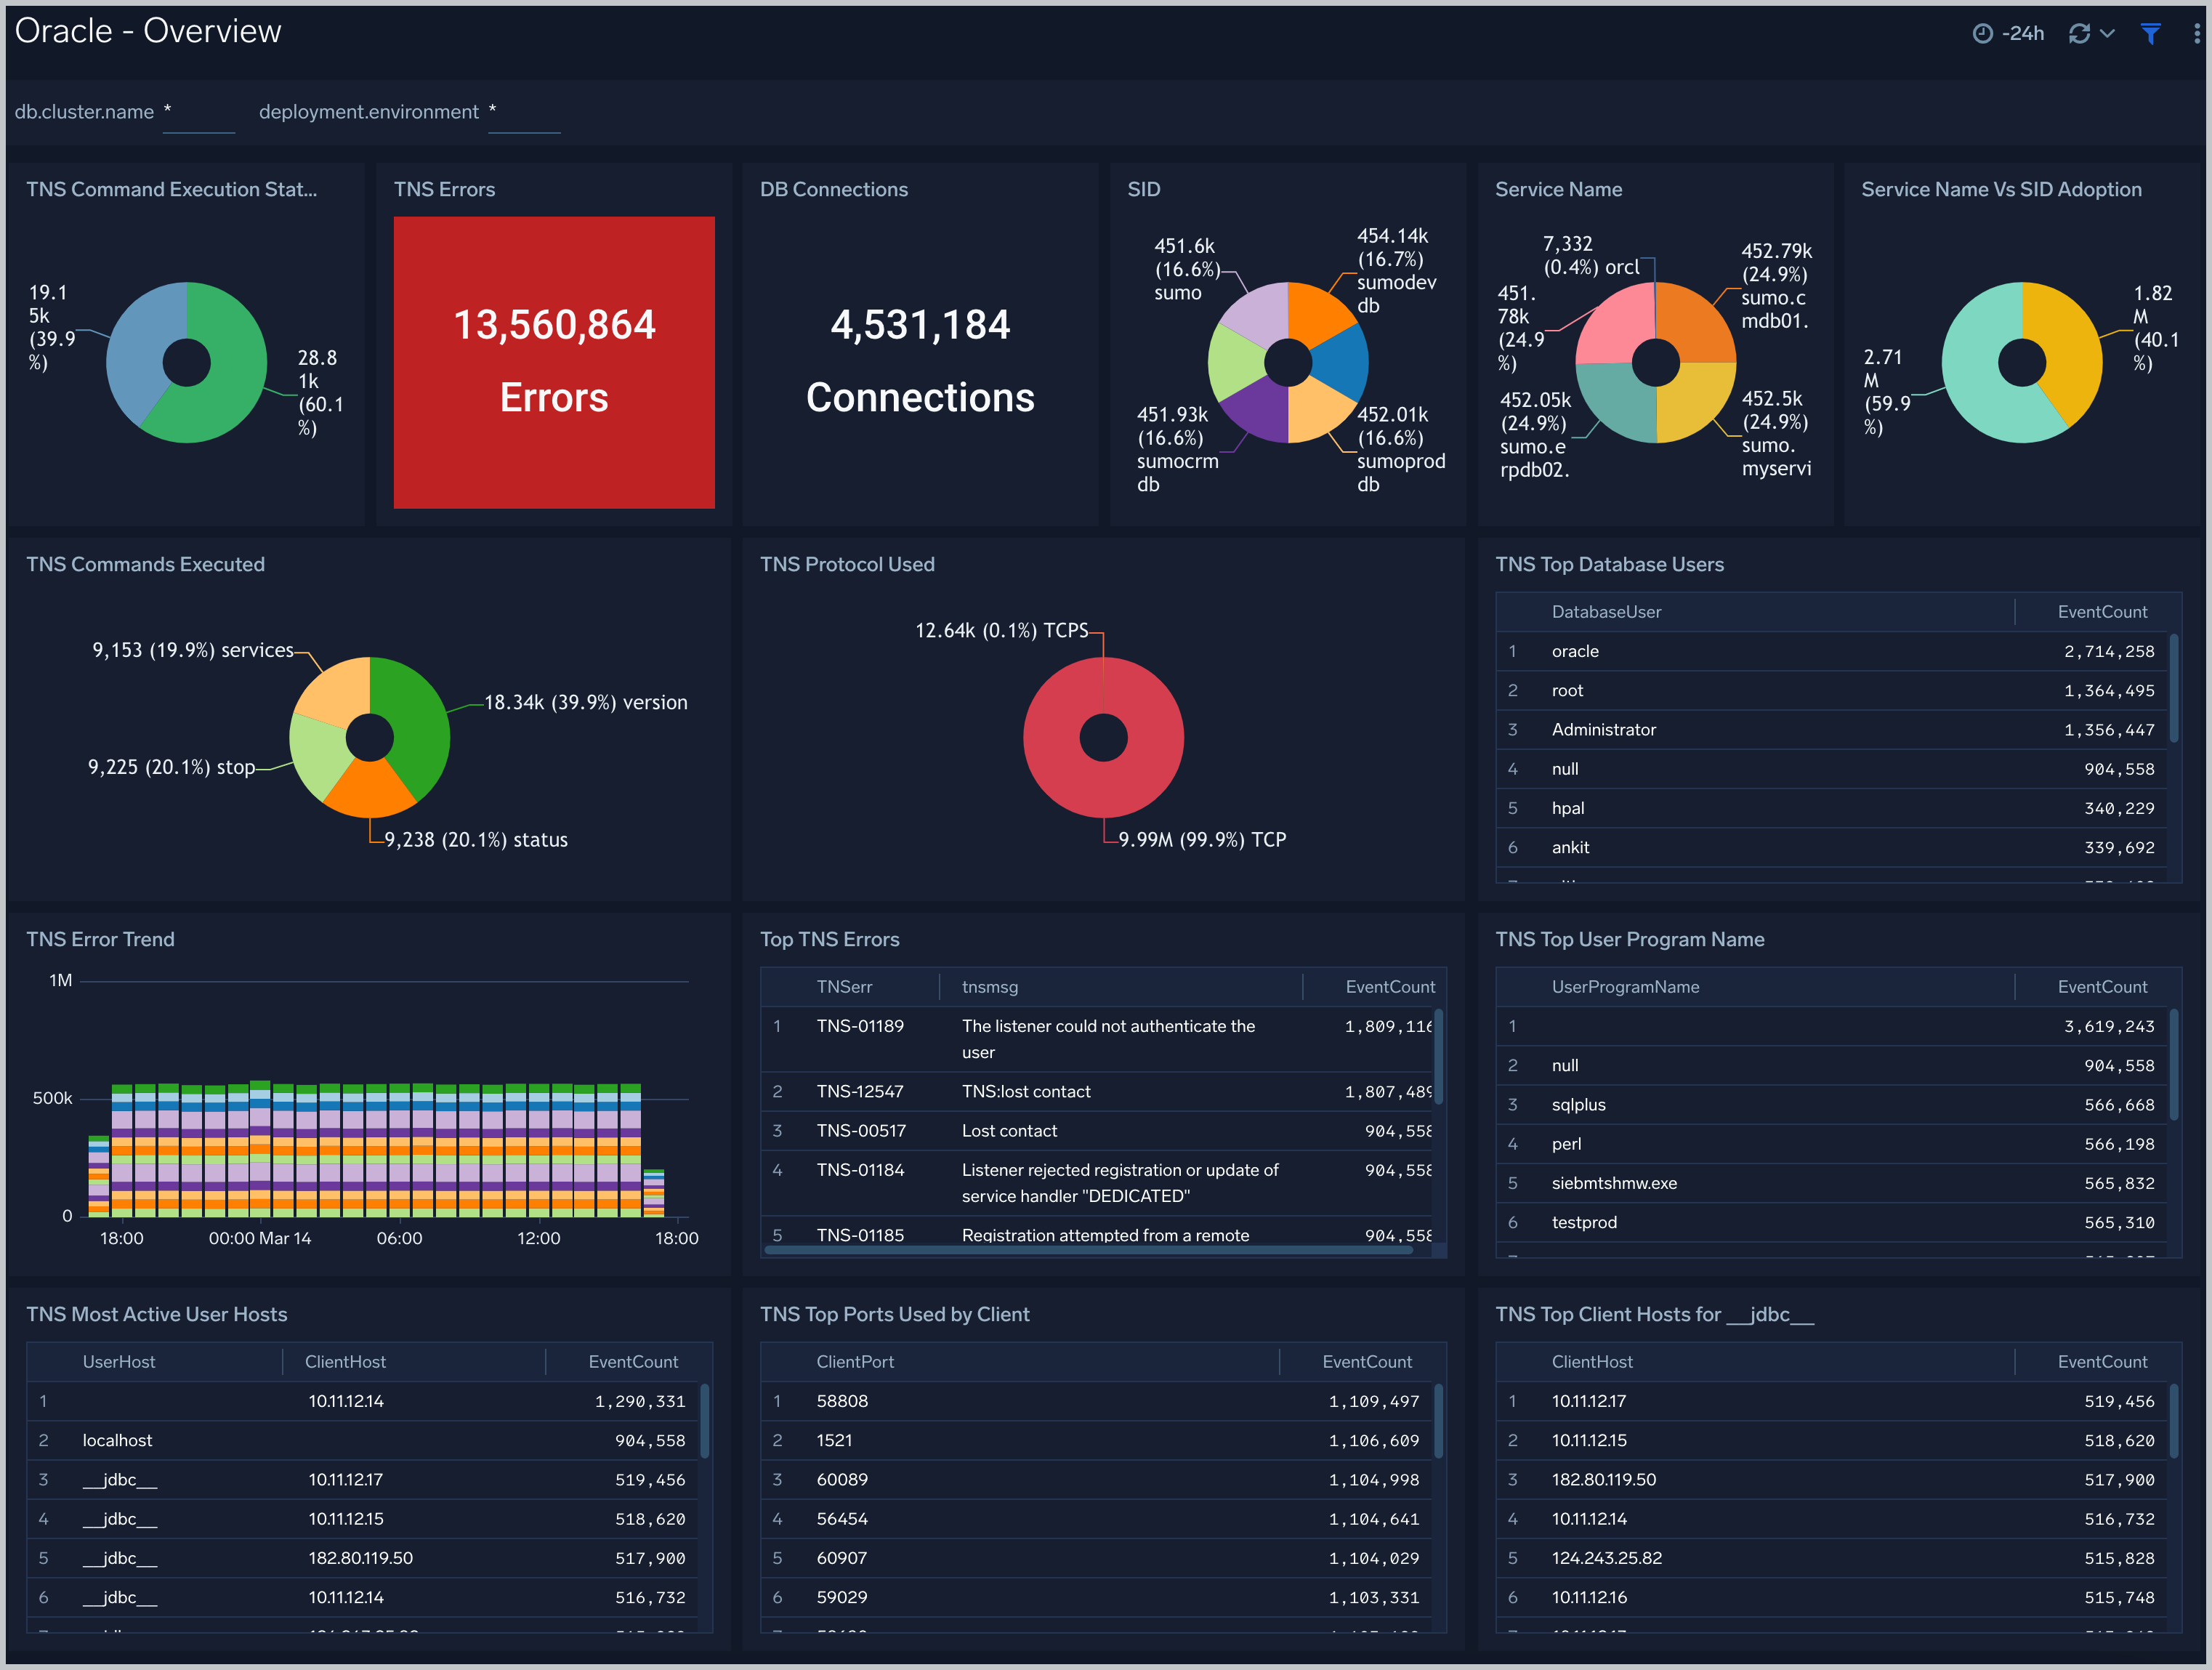
DB Connections. The count of database connections established during the previous 24 hours.
TNS Errors. The count of TNS errors during the previous 24 hours.
Top TNS Errors. A table that shows the top 10 TNS errors and the count of each in the previous 24 hours.
TNS Error Trend. A stacked column chart that shows the count of each TNS error per one hour timeslice, over the previous 24 hours.
SID. A donut chart that shows the breakdown of connections by SID over the previous 24 hours.
Service Name. A donut chart that shows the breakdown of connections by service name over the previous 24 hours.
Service Name Vs SID Adoption A donut chart that shows the breakdown of connections by SID versus by Service Name over the previous 24 hours.
TNS Protocol Used. A donut chart that shows the breakdown of connection requests by protocol over the previous 24 hours.
Command Execution Status. A donut chart that shows the breakdown of successful and failed Listener commands over the previous 24 hours.
Commands Executed. A donut chart that shows the breakdown of specific lsnrctl commands over the previous 24 hours.
Top Ports Used by Client. A table that shows the top 20 client ports that initiated connections, and connection count for each over the previous 24 hours.
Top Database Users. A table that shows the top 20 database users for which the client initiated connections, and connection count for each over the previous 24 hours.
Most Active User Hosts. A table that shows the top 20 user hosts that initiated connections, and connection count for each over the previous 24 hours.
Top User Program Name. A table that shows the top 20 programs that initiated connections over the previous 24 hours.
Alert Analysis
See information about Oracle errors, including counts of various error types, ORA messages, oracle instance state, and other data derived from the Oracle Alert log.
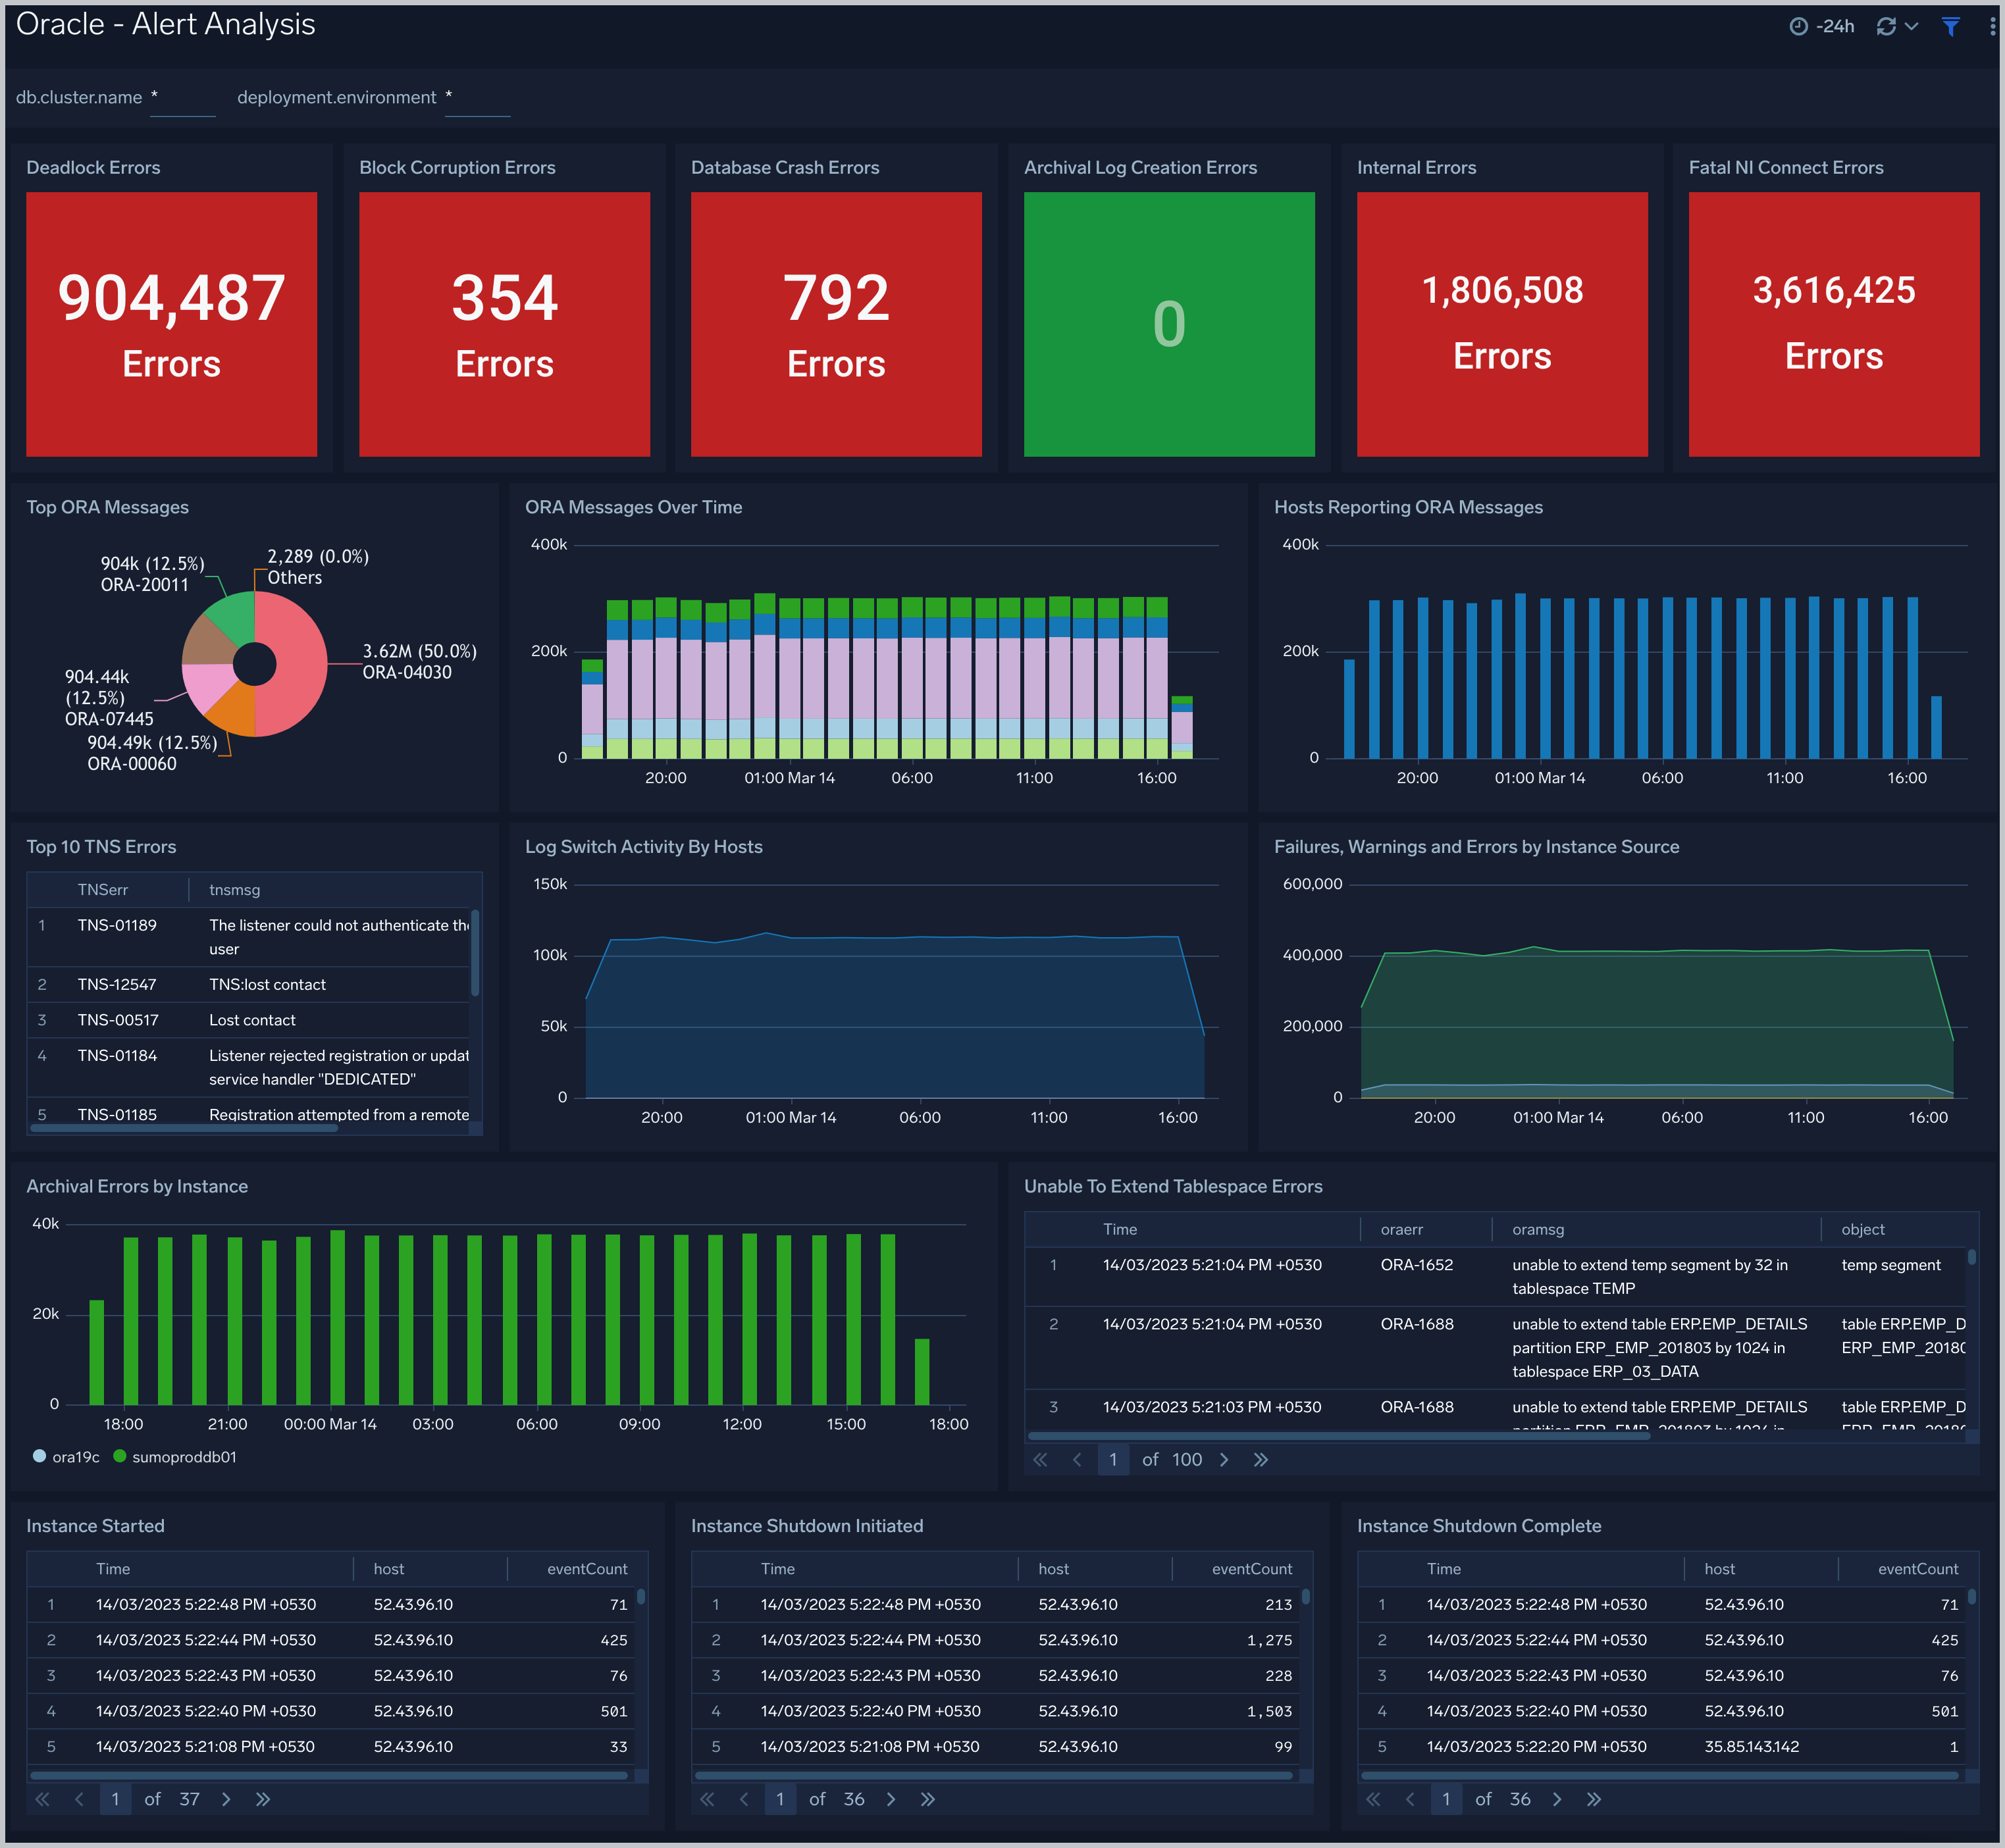
Deadlock Errors. Count of ORA-00060 messages over the previous 24 hours.
Database Crash Errors. Count of database crash errors (ORA-00603, ORA-00449, ORA-00471, or ORA-01092) over the previous 24 hours.
Archival Log Creation Errors. Count of ORA-00270 messages over the previous 24 hours.
Internal Errors. Count of internal errors (ORA-00600 or ORA-07445) over the previous 24 hours.
Fatal NI Connect Errors. Count fatal NI connect errors over the previous 24 hours.
Top ORA Messages A donut chart that shows the breakdown of ORA messages by message type over the previous 24 hours.
ORA Messages Over Time. A stacked column chart that shows the count of ORA messages of each message type per one hour timeslice over the previous 24 hours.
Hosts Reporting ORA Messages. A stacked column chart that shows the count of ORA messages of all types by host per one hour timeslice over the previous 24 hours.
Top TNS Errors. A table that shows the count of Transparent Network Substrate (TNS) errors of each type over the previous 24 hours.
Log Switch Activity By Hosts. An area chart that shows the count of log switch events per one hour timeslice by host. (A log switch is the point at which the database stops writing to one redo log file and begins writing to another.)
Failures, Warnings and Errors by Instance Source. An area chart that shows the count of messages from the Oracle Alert log that match patterns like: fail*, warn*, or error*.
Archival Errors by Instance. A stacked column chart that shows the count of messages from the Oracle Alert log that contain the string "Archival Error" by per one hour timeslice by database instance over the previous 24 hours.
Unable to Extend Tablespace Errors. A table that lists errors related to a failure to extend a tablespace, that occurred during the previous 24 hours.
Instance Started. A table that lists when database instances were started during the previous three days.
Instance Shutdown Initiated. A table that lists when shutdowns of database instances were initiated during the previous three days.
Instance Shutdown Complete. A table that lists when shutdowns of database instances were initiated during the previous three days.
Listener Troubleshooting
See details of Oracle listener process activity, including database connections by host and application, connection failures, command execution status and trends, and other data derived from the Oracle Listener log.
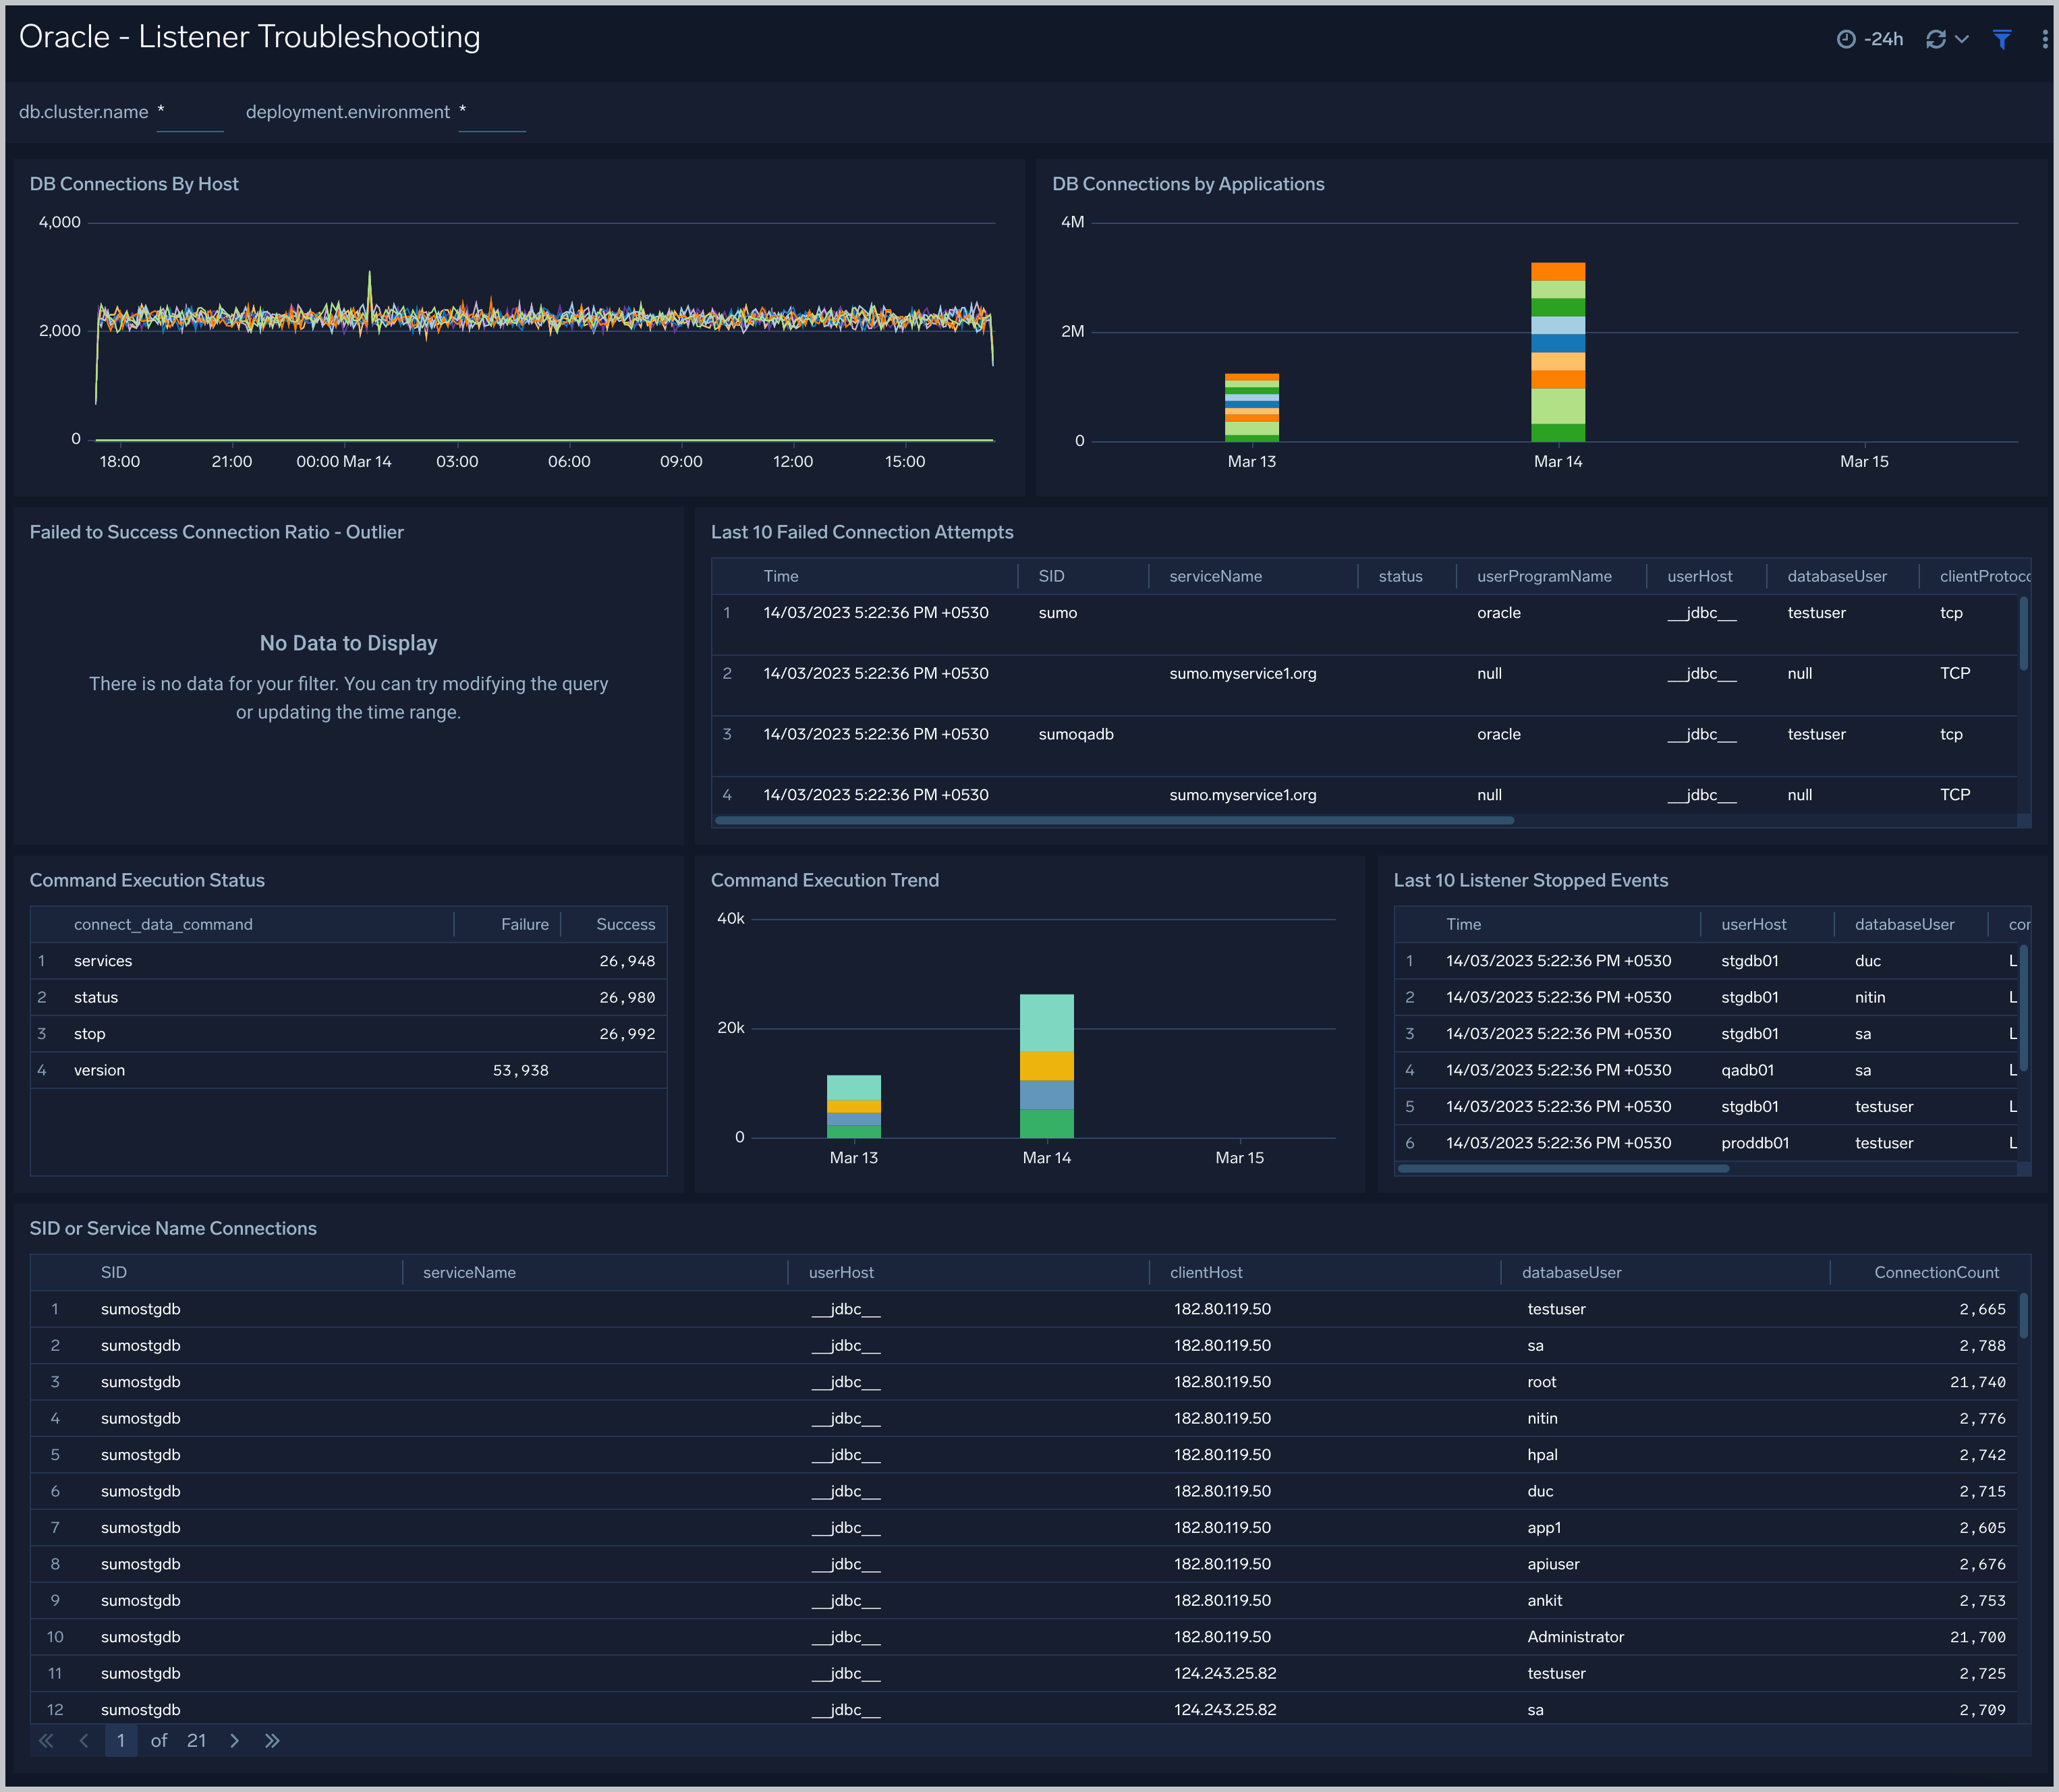
DB Connections By Host. An area chart that shows the count of database connections by host, per 5 minute timeslice, over the previous 24 hours.
DB Connections By Applications. A stacked column chart that shows the count of database connection by initiating program, per one day timeslice, over the previous 7 days.
Failed to Success Connection Ratio - Outlier. A visualization that shows when the ratio of failed to successful connections was statistically significant (more than three standard deviations higher than the running average), over the previous 30 days.
Failed Connection Attempts. A table that lists failed database connection attempts over the previous three days.
Command Execution Status. A table that lists the count of specific lsnrctl commands that were issued in the previous seven days, and the count of failures and successes for each.
Command Execution Trend. A stacked column chart that shows the count of specific lsnrctl commands that were issued in the previous seven days per one day timeslice.
Listener Stopped Events. A table that lists listener stop events during the previous 7 days.
SID or Service Name Detailed Breakup. A table that shows the count of connections performed with sid or service name, by userhost, clienthost, and databaseuser.
Security Monitoring
See information about database connections established by privileged users, connection attempts from public IP addresses, attempts to execute unauthorized commands, and events that are associated with potentially inappropriate activities as derived from Oracle Listener and Alert Logs.
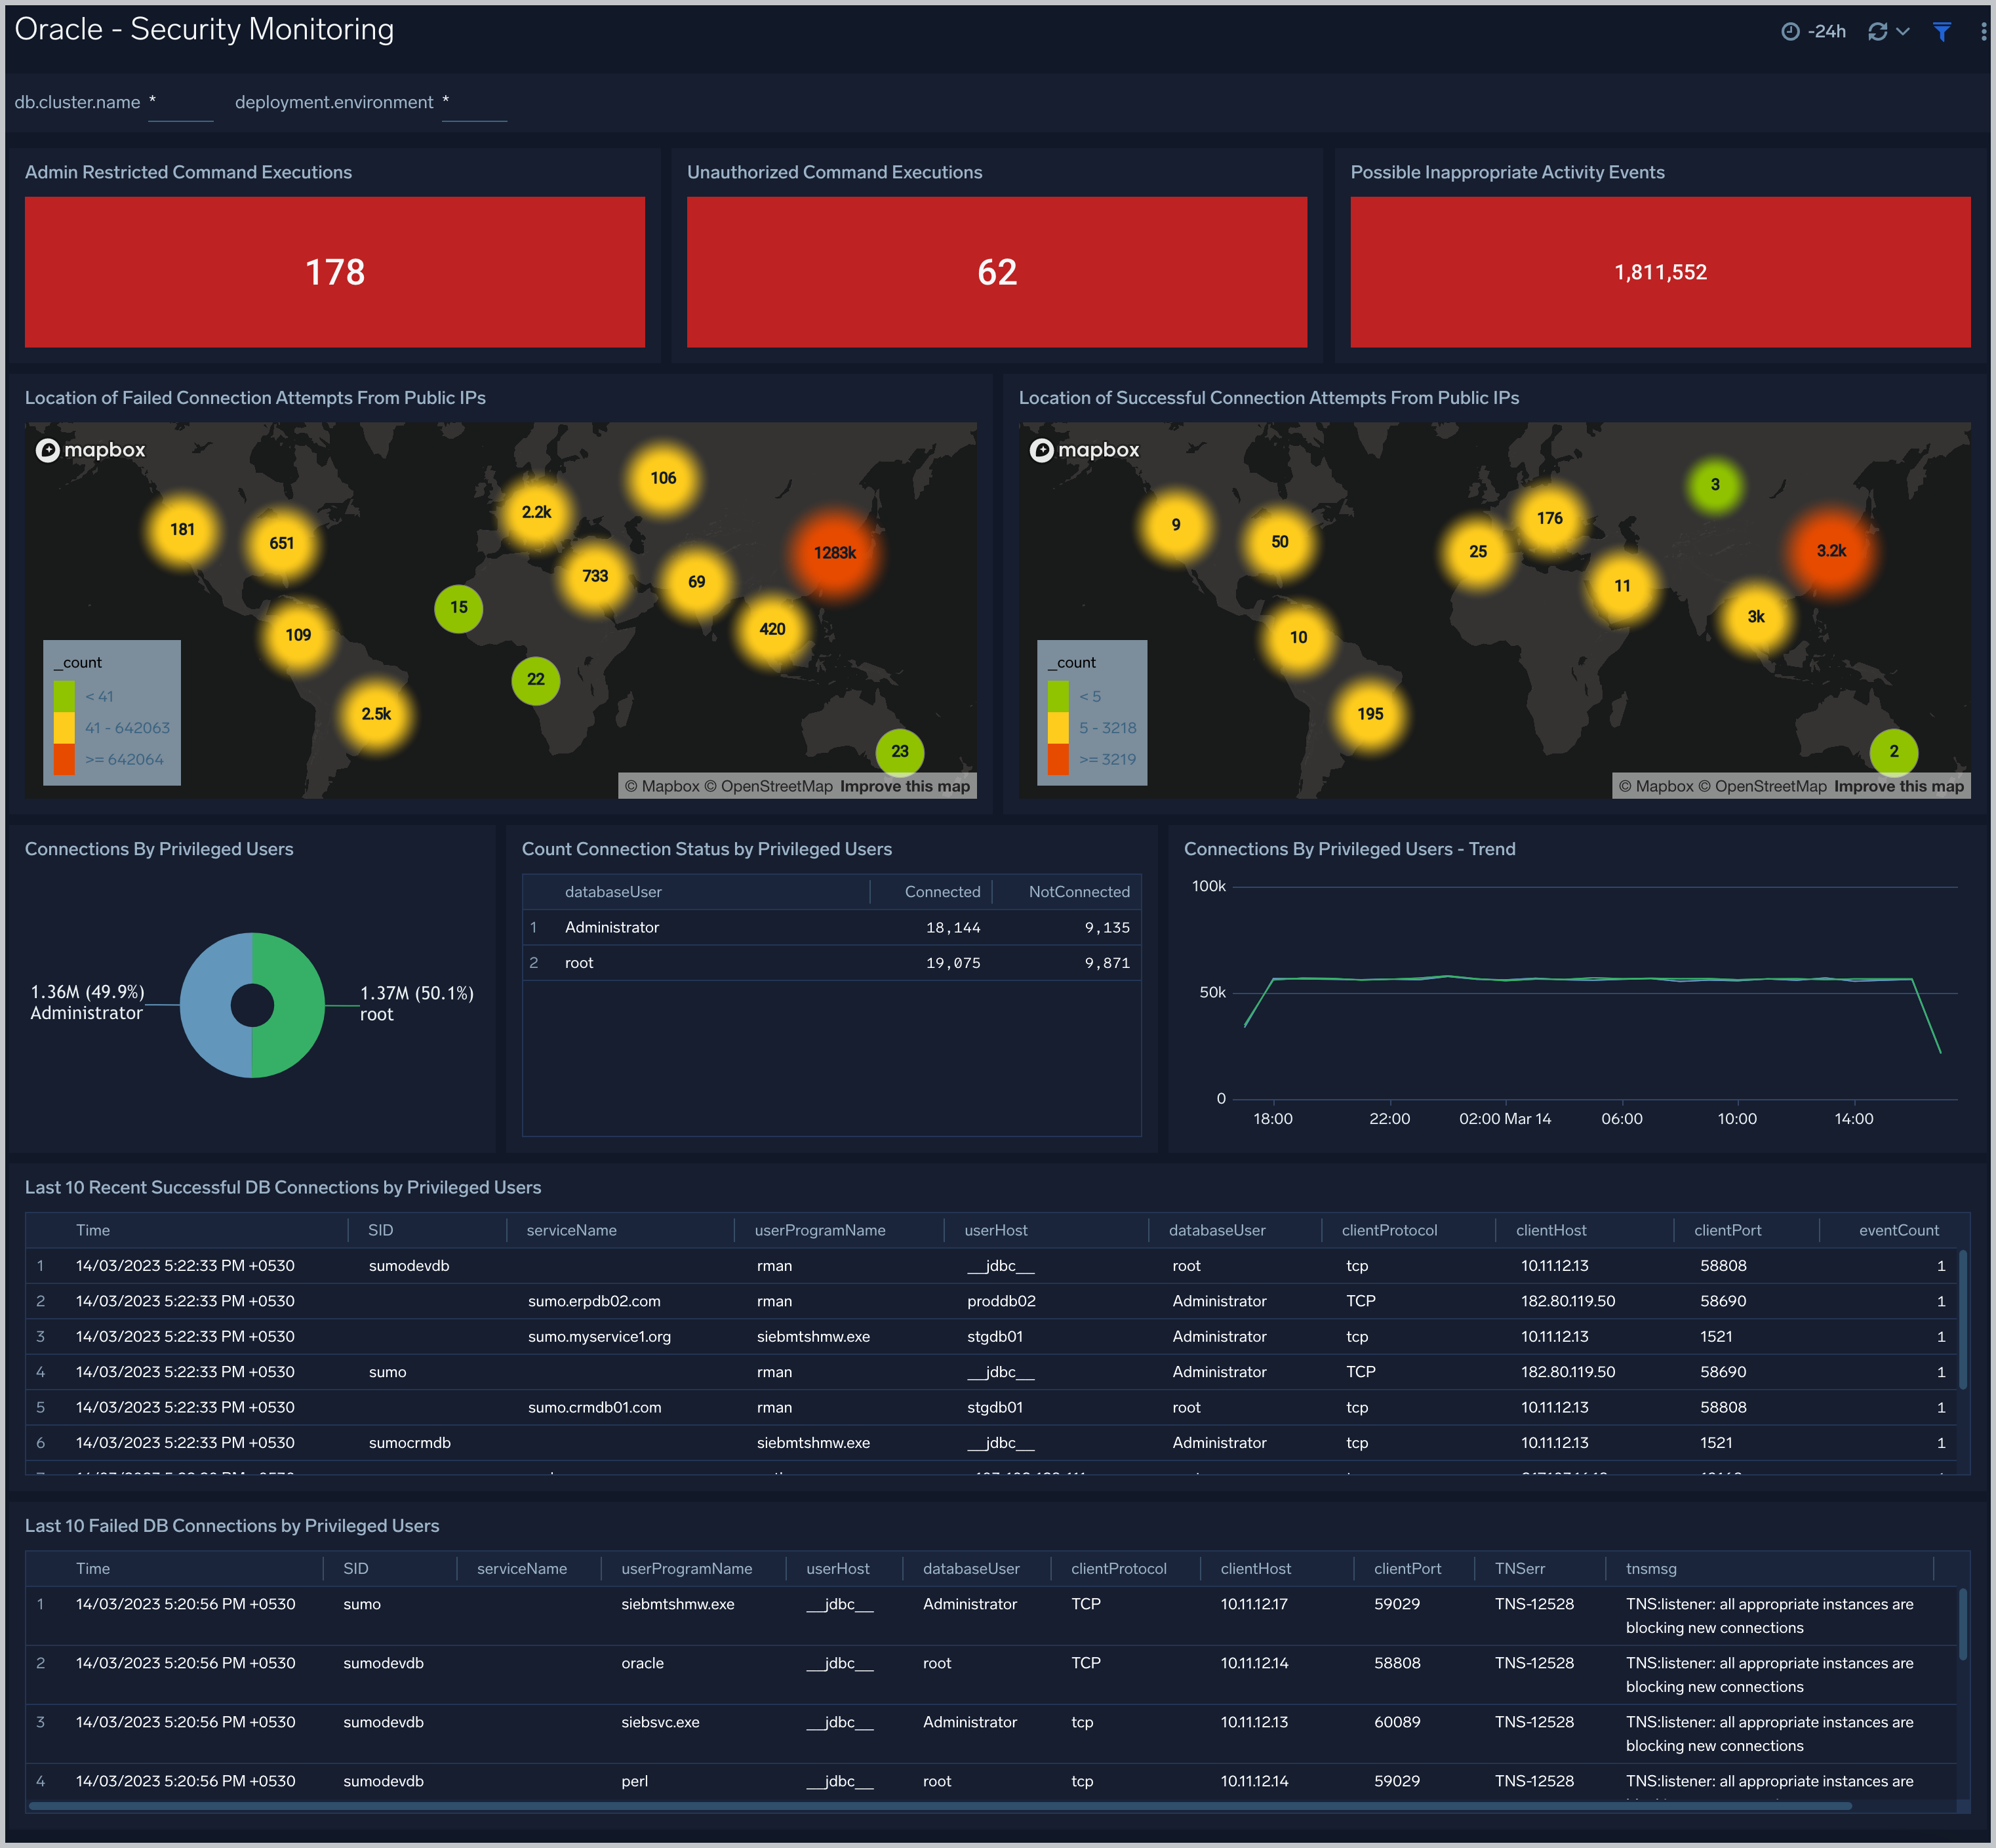
Admin Restricted Command Execution. The count of database commands that resulted in TNS-12508 errors over the previous 24 hours.
Unauthorized Command Execution. The count of database commands that resulted in TNS-01190 errors over the previous 24 hours.
Possible Inappropriate Activity. The count of lsnrctl commands the resulted in errors of the following types over the previous 24 hours: TNS-01169, TNS-01189, TNS-01190, "TNS-12508", ORA-12525, ORA-28040, or ORA-12170.
Connections By Privileged Users. A donut chart that shows the breakdown of connections from privileged user accounts, such as root and administrator, over the previous 24 hours.
Connection Status by Privileged Users. A table that shows the count of successful and unsuccessful connections from privileged user accounts, such as root and administrator, over the previous 24 hours.
Connections By Privileged Users - Trend. A line chart that shows the count of connections from privileged user accounts, such as root and administrator, per one hour timeslice over over the previous 24 hours.
Recent Successful DB Connections by Privileged Users. A table that shows the count of successful connections from privileged user accounts, such as root and administrator, per one minute timeslice, over the previous 24 hours.
Failed Connection Attempt From PublicIP Location. A map chart that shows the count and location of failed connection attempts from geographical locations over the previous 24 hours.
Successful Connection Attempt From PublicIP Location. A map chart that shows the count and location of successful connection attempts from geographical locations over the previous 24 hours.
Failed DB Connections by Privileged Users. A table that provides information about failed database connections from privileged user accounts, such as root and administrator, over the previous 24 hours.
Sys Audit Log
See information derived from the syslog audit trail, including successful and failed activities, and top usage by client, database user, and privileges used.
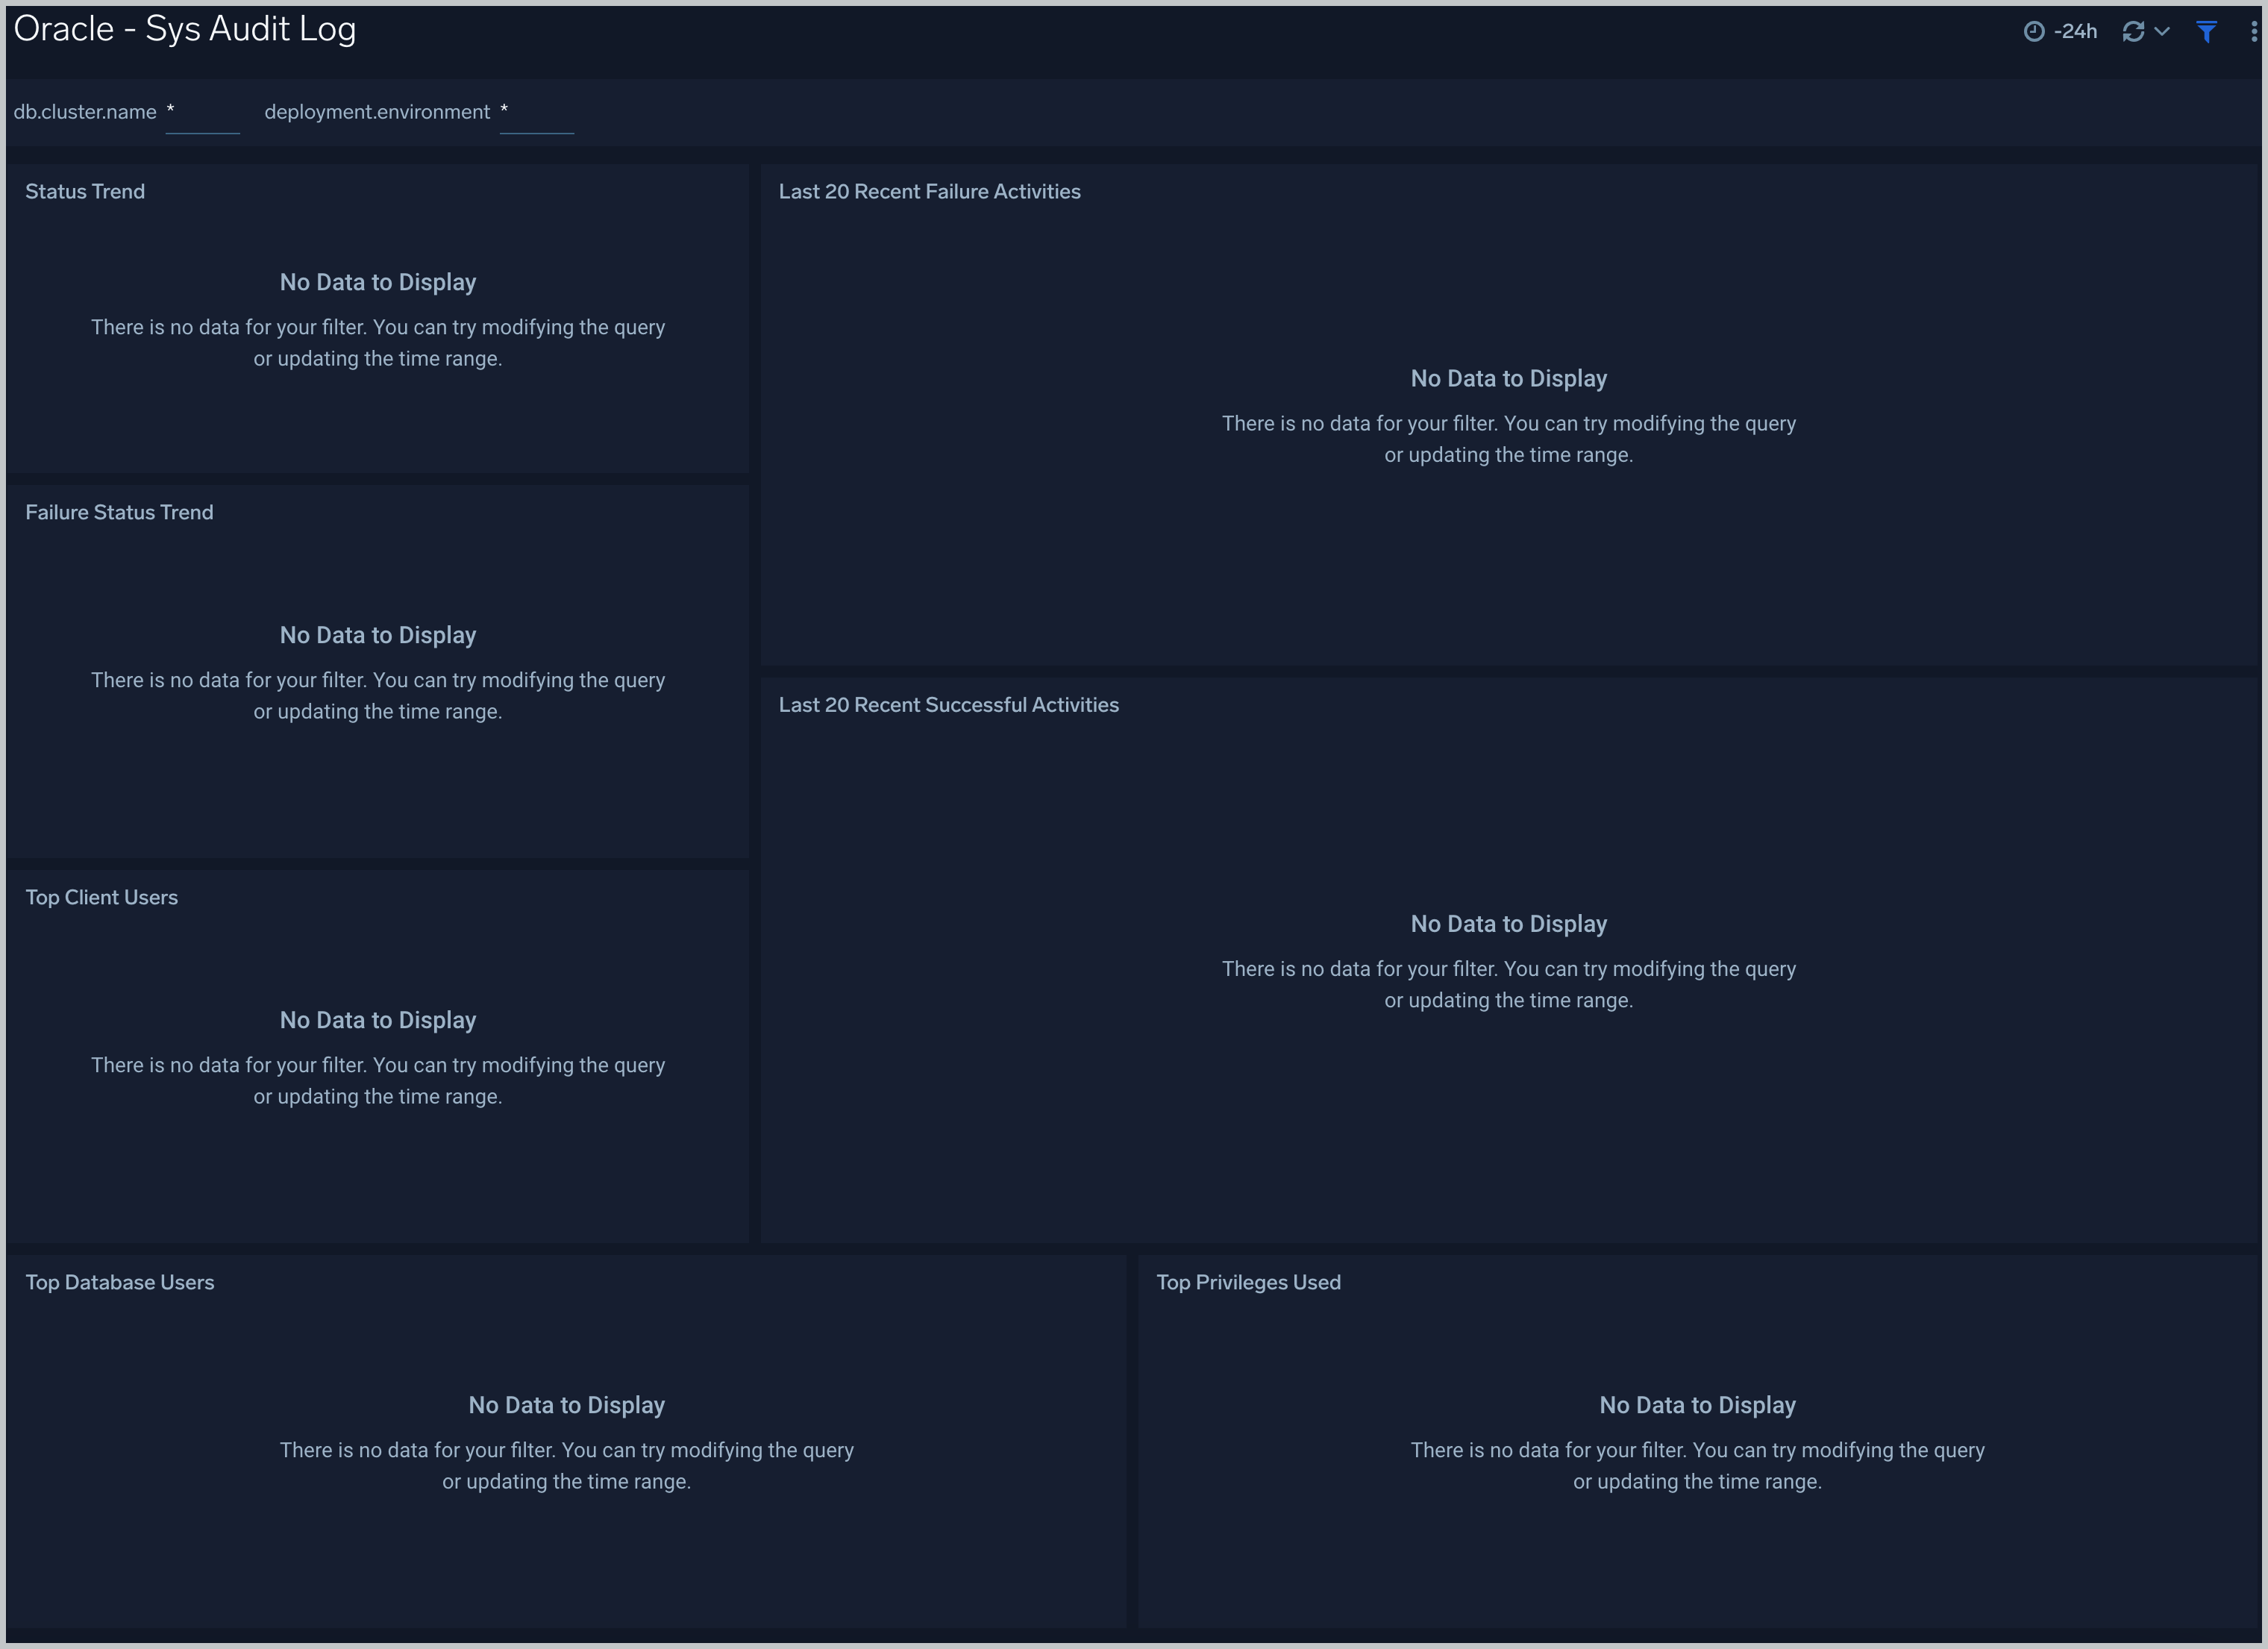
Status Trend. A stacked column chart that shows the count of successful and unsuccessful database actions over the previous 24 hours.
Failure Status Trend. A stacked column chart that shows the count of unsuccessful database actions by failure status code over the previous 24 hours.
Recent Failure Activities. A table that lists unsuccessful database actions over the previous 60 minutes.
Top Client Users. A table that shows the top 10 client users over the previous 24 hours, and a count of the events associated with each.
Top Database Users. A table that shows the top 10 database users over the previous 24 hours, and a count of the events associated with each.
Top Privileges Used. A table that shows the top 10 database privileges used over the previous 24 hours, and a count of the events associated with each.
Recent Successful Activities. A table that lists information about successful database actions over the previous 60 minutes.
Sys Audit Log - Logon Analysis
See logon activity information derived from the syslog audit trail, including successful and failed logons, logon status trends, multiple database user logons and client user logons from the same UserHost, and multiple UserHost logons with the same database user.
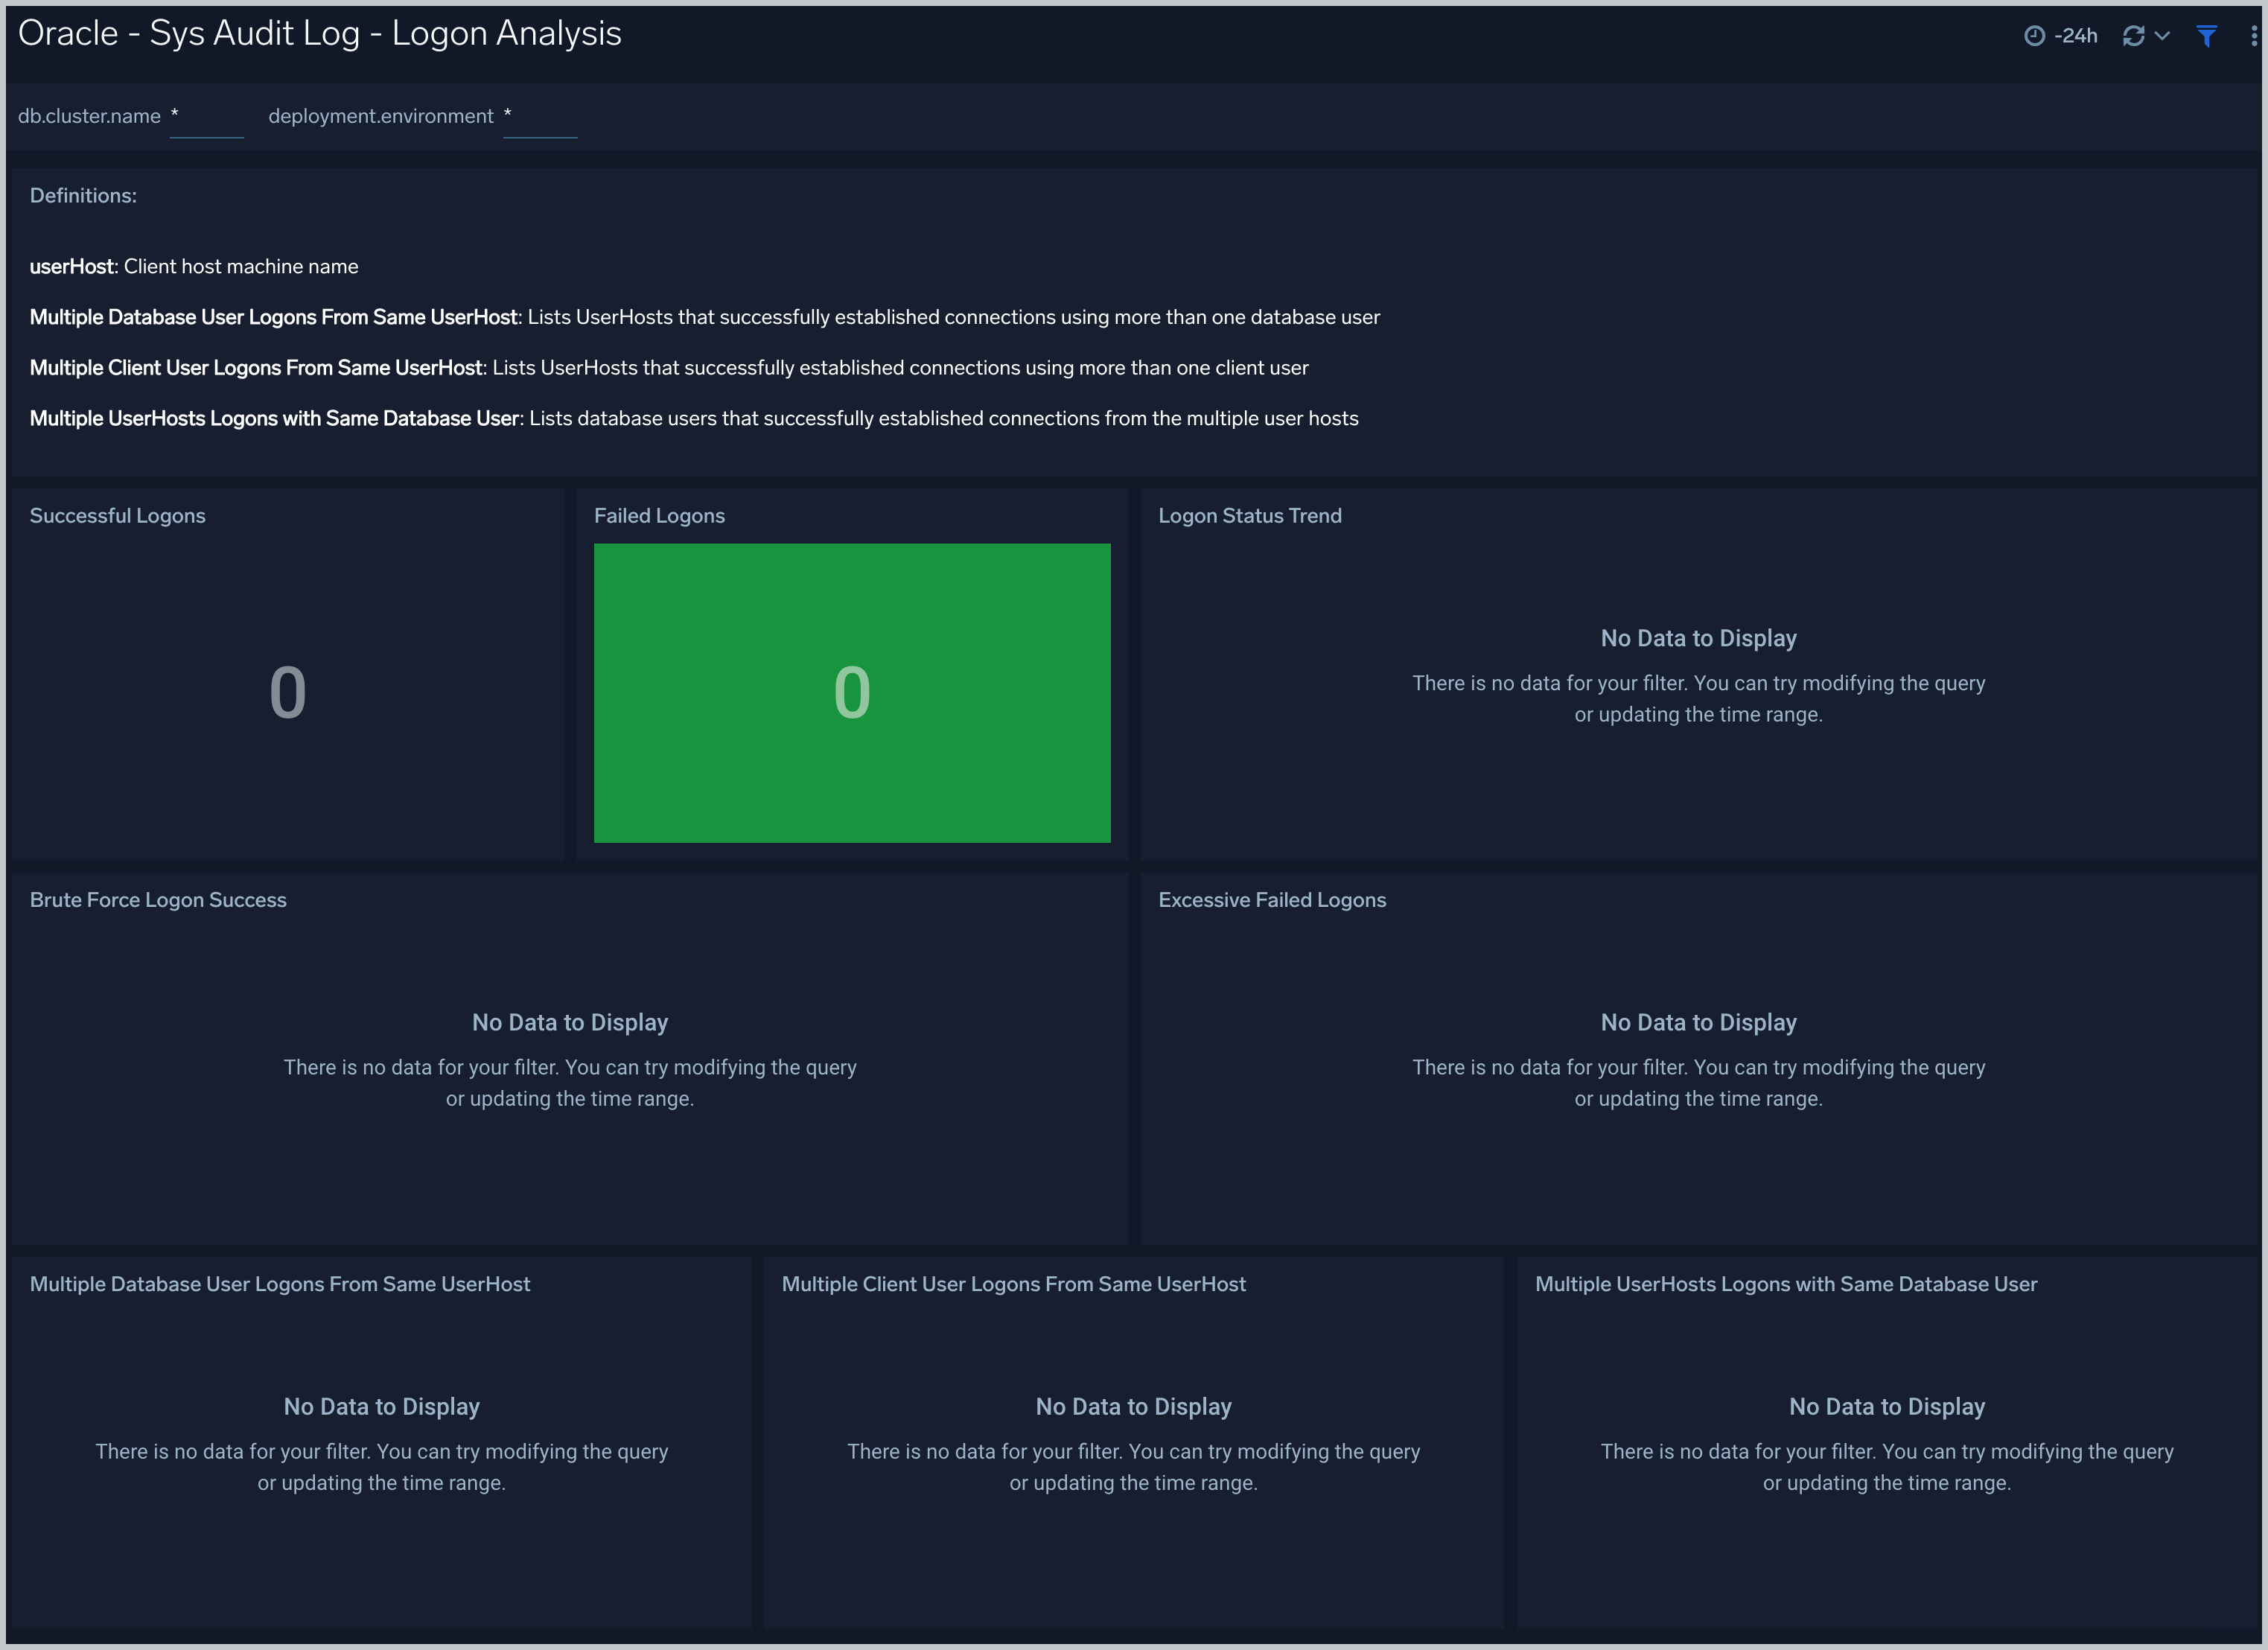
Successful Logons. Count of successful logins in the previous 24 hours.
Failed Logons. Count of failed logins in the previous 24 hours.
Successful Logoffs. Count of successful logoffs in the previous 24 hours.
Logon Activities Trend. Stacked column chart that shows the count of logons and logoffs per one hour timeslice over the previous 24 hours.
Brute Force Login Success. Table that lists information about brute force login attempts that succeeded during the previous three days.
Excessive Failed Logons. A table that lists information about incidents where there were more than five failed logons within 5 minutes during last three days.
Multiple Database User Logons From Same UserHost. A table that lists UserHosts that successfully established connections using more than one database user over the previous 24 hours.
Multiple Client User Logons From Same UserHost. A table that lists UserHosts that successfully established connections using more than one client user over the previous 24 hours.
Multiple UserHosts Logons with Same Database User. A table that lists database users that successfully established connections from the multiple user hosts over the previous 24 hours.
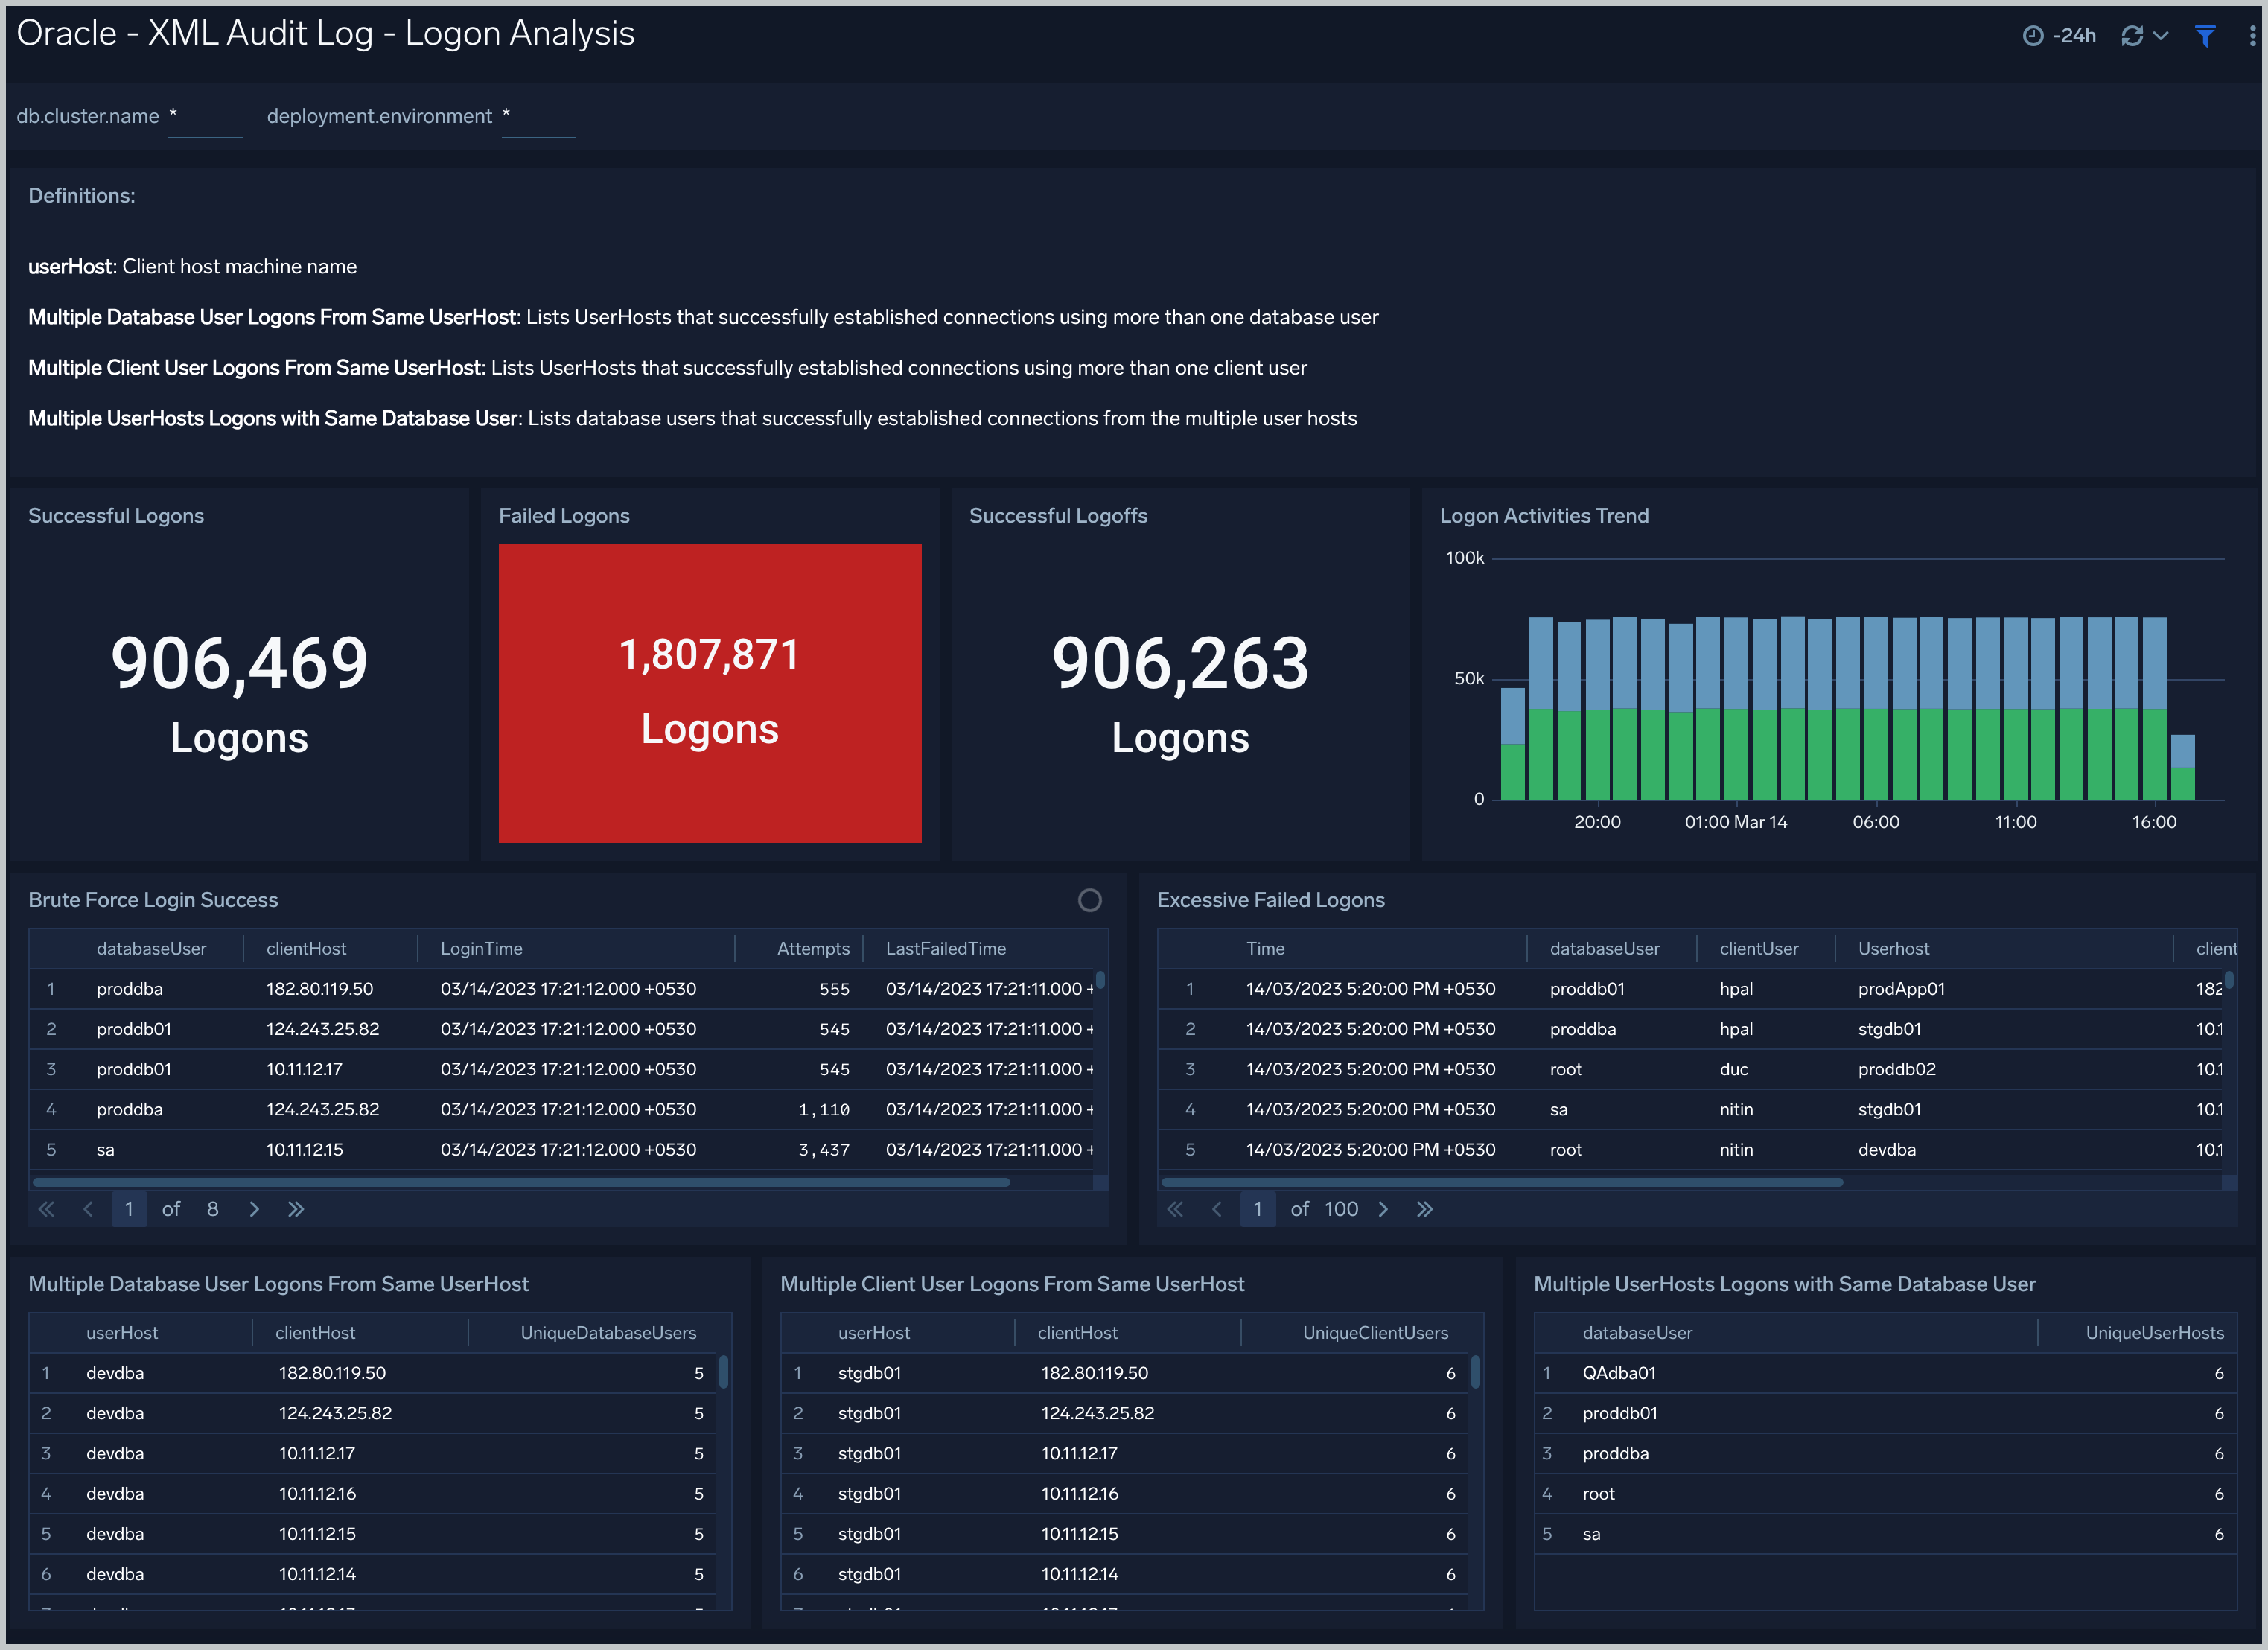
XML Audit Log - Logon Analysis
See logon activity information derived from the XML audit trail, including successful and failed logons, logon status trends, multiple database user logons and client user logons from the same UserHost, and multiple UserHost logons with the same database user.
XML Audit Log - SQL Statement Analysis
See information derived from the XML audit trail about user management, role management, Data Definition Language (DDL), Data Manipulation Language (DML), and Transaction Control Language (TCL) activity.
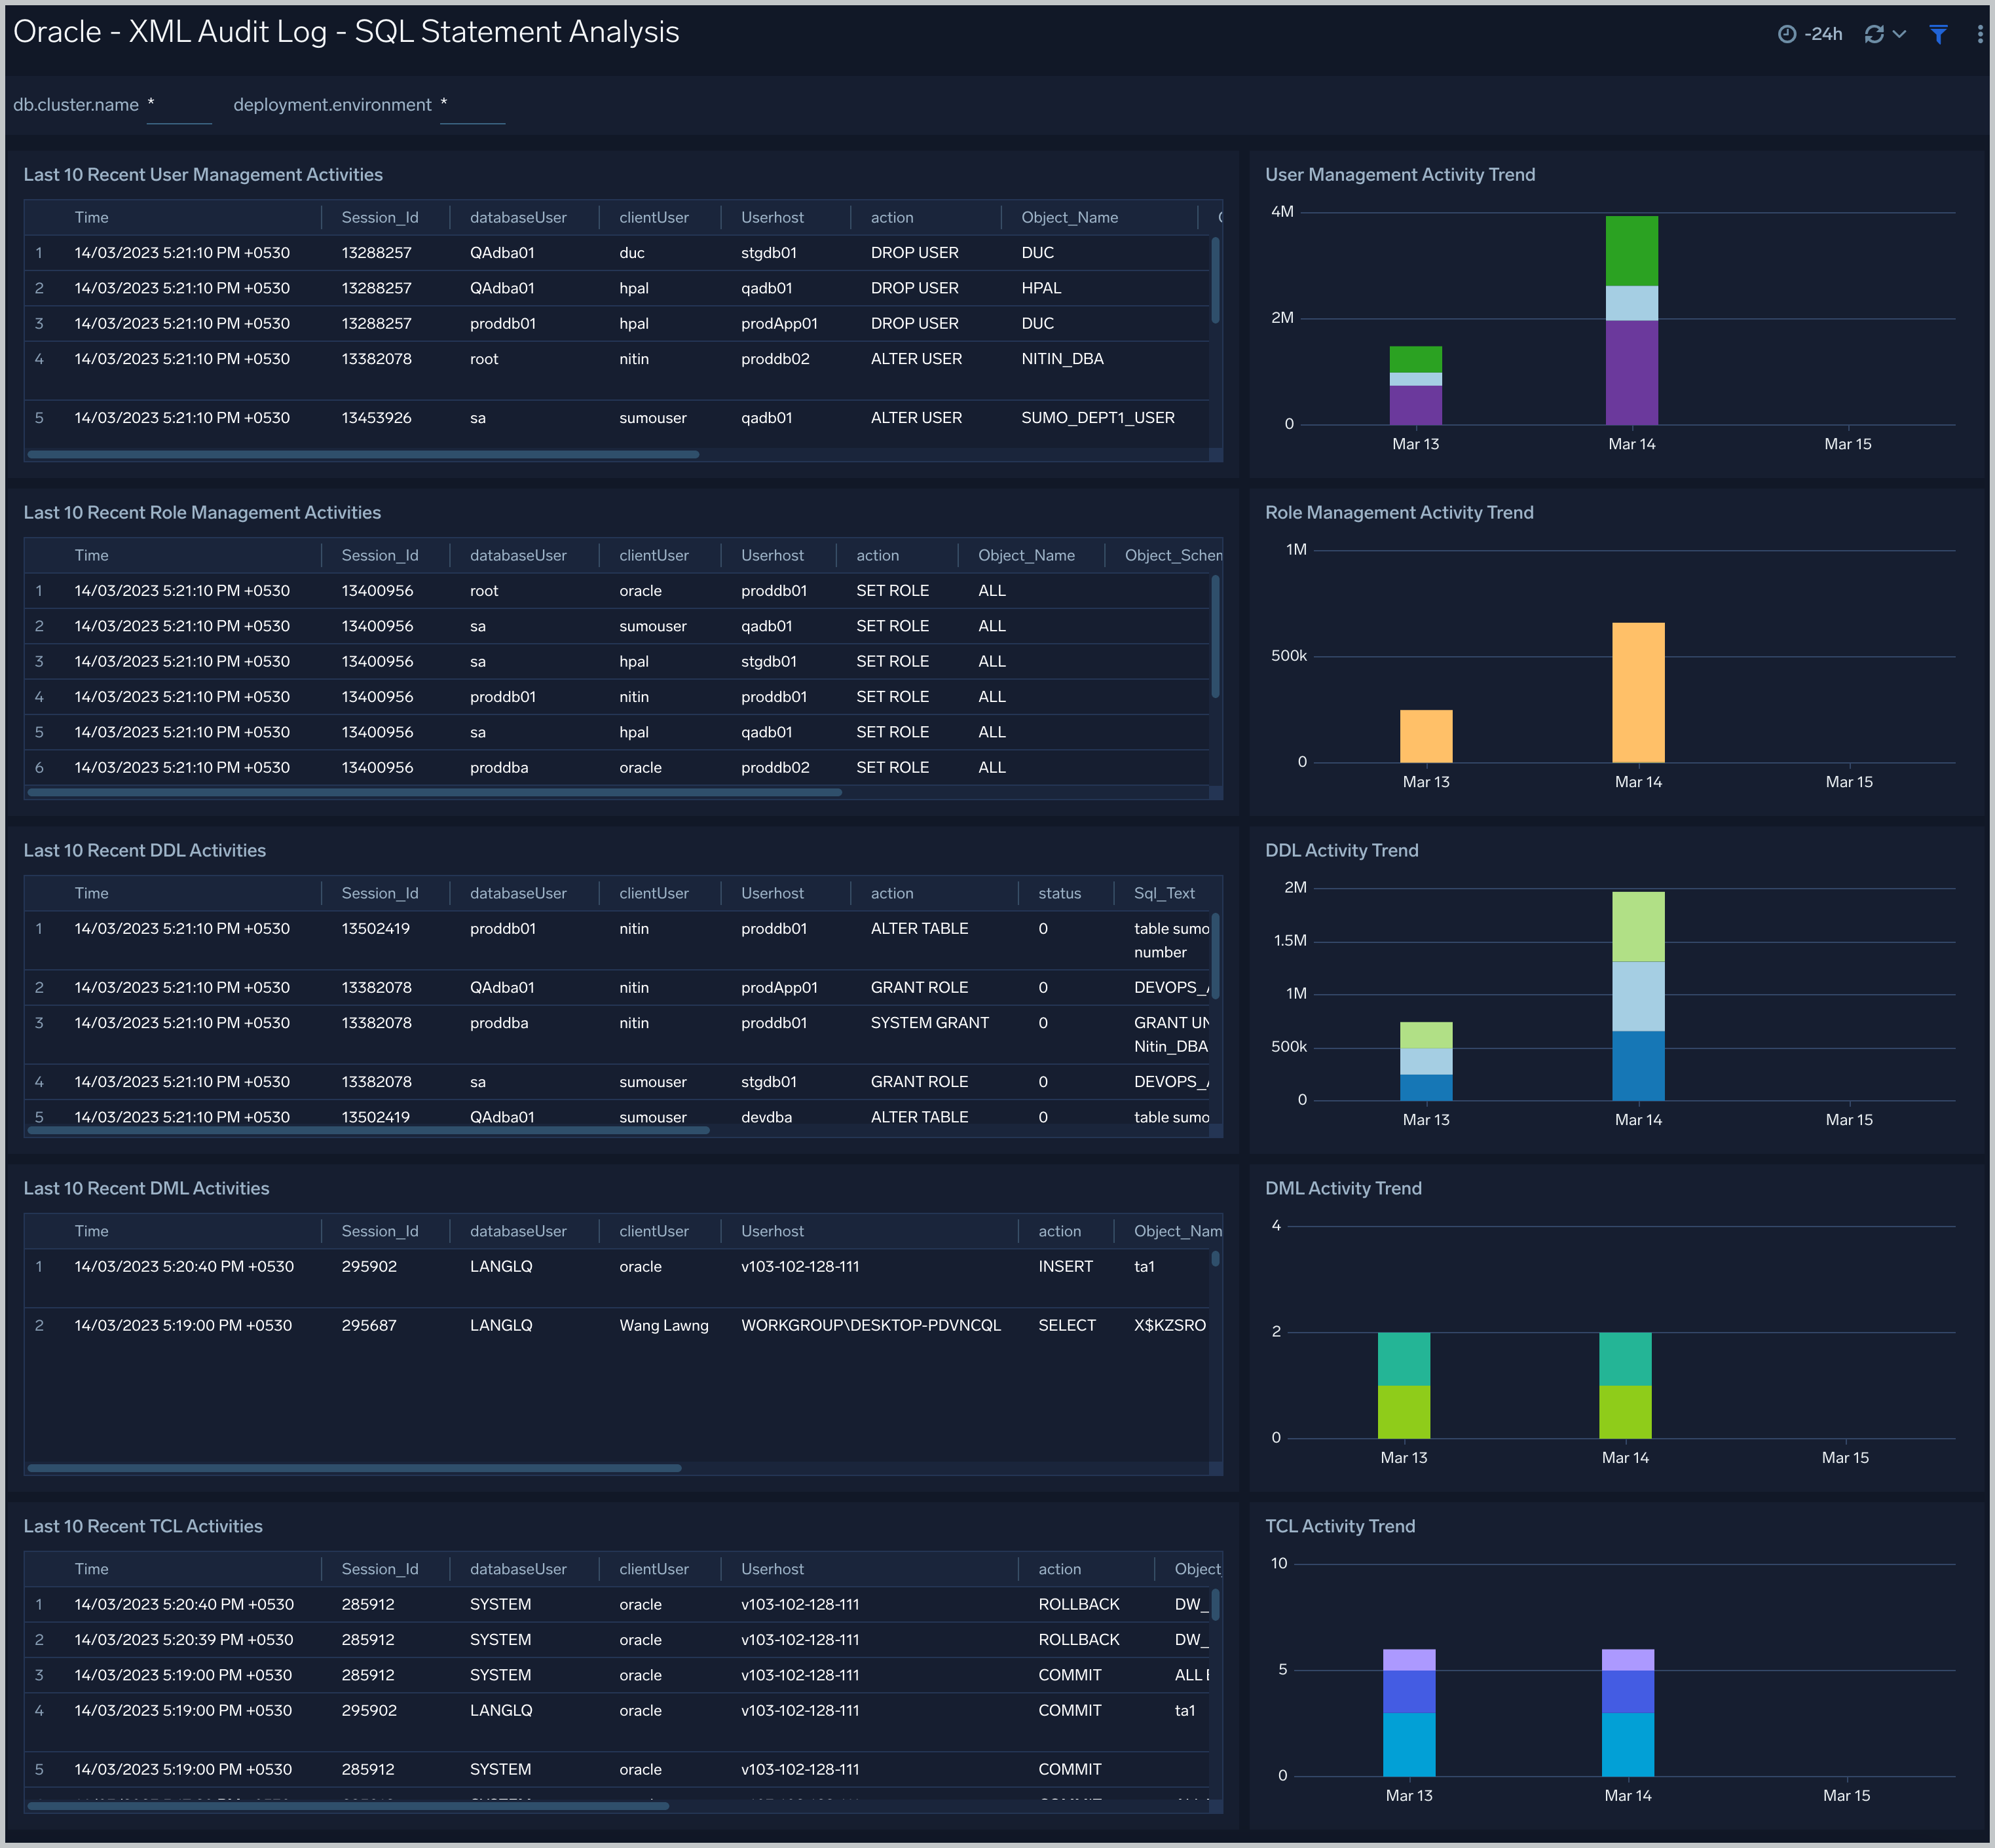
Recent User Management Activities. A table that lists information about user management activities in the previous 24 hours.
User Management Activity Trend. A stacked column chart that shows the count of user management actions by action type per one hour timeslice over the last 7 days.
Recent Role Management Activities. A table that lists information about role management activities in the previous 24 hours.
Role Management Activity Trend. A stacked column chart that shows the count of role management actions by action type per one hour timeslice over the last 7 days.
Recent DDL Activities. A table that lists information about Data Definition Language (DDL) activities in the previous 24 hours.
DDL Activity Trend. A stacked column chart that shows the count of DDL actions by action type per one hour timeslice over the last 7 days.
Recent DML Activities. A table that lists information about Data Manipulation Language (DML) activities in the previous 24 hours.
DML Activity Trend. DDL Activity Trend. A stacked column chart that shows the count of DML actions by action type per one hour timeslice over the last 7 days.
Recent TCL Activities. A table that lists information Transaction Control Language (TCL) activities in the previous 24 hours.
TCL Activity Trend. A stacked column chart that shows the count of DML actions by action type per one hour timeslice over the last 7 days.
Monitor Performance by DB Script
See database usage information obtained by the Oracle script source, including tablespace and datafile utilization; recent active connections; wait times; and recent jobs.
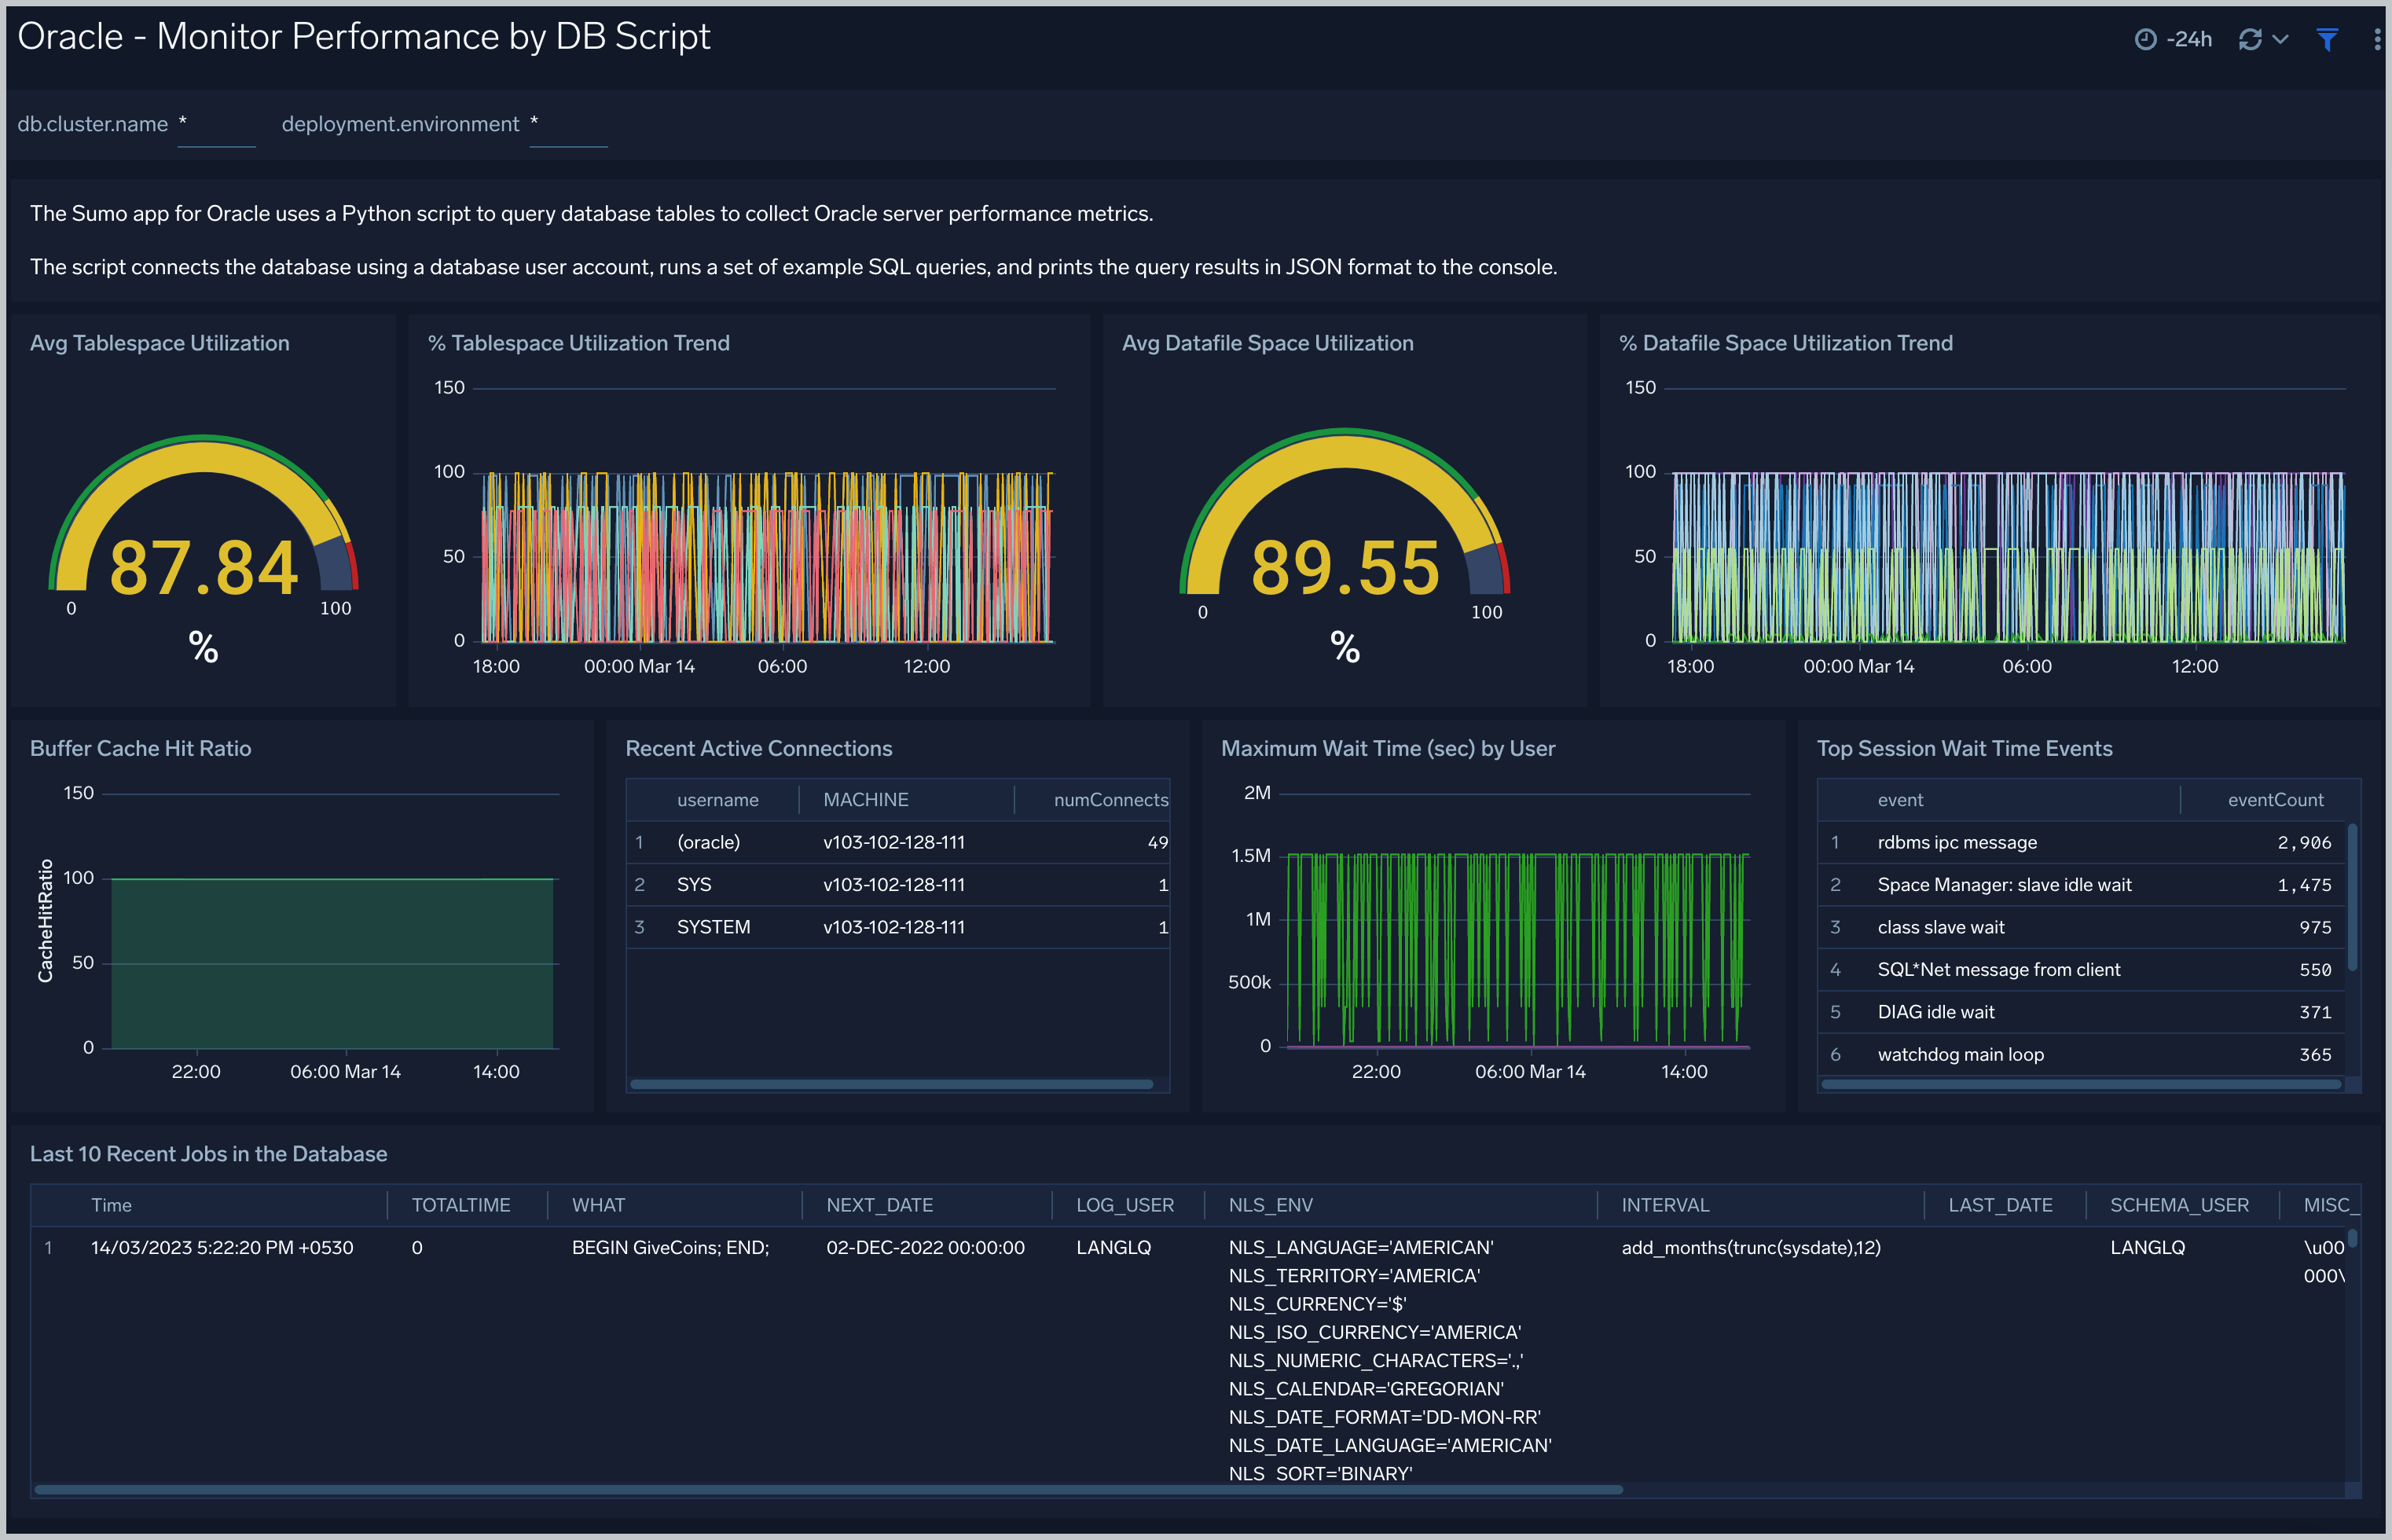
TableSpace Utilization. A table that shows, for each tablespace, the percentage of tablespace used for each 5 minute timeslice over the last 60 minutes.
TableSpace Utilization Trend. A line chart that shows, for each tablespace, the percentage of tablespace used over the last 24 hours.
Datafile Space Utilization. A table that shows, for each database file (.dbf), the percentage of allocated file space used for each 5 minute timeslice over the last 60 minutes.
Datafile Space Utilization Trend. A line chart that shows, for each database file (.dbf), the percentage of allocated file space used over the last 24 hours.
Buffer Cache Hit Ratio. An area chart that shows the buffer cache hit ratio for each 5 minute timeslice over the last 60 minutes.
Recent Active Connections. A table of information about recent active connections, including the user, machine, and number of connections.
Maximum Wait Time (sec) by User. A line chart that shows, for each user, the session wait times for each 5 minute timeslice over the last 60 minutes.
Top Session Wait Time Events. A table that shows the top 10 event types associated with session waits, and the count of each event type.
Recent Jobs in the database. A table of information about recent database jobs, including when each job ran, low long it ran, and when it will next run.
Unified Audit Syslog
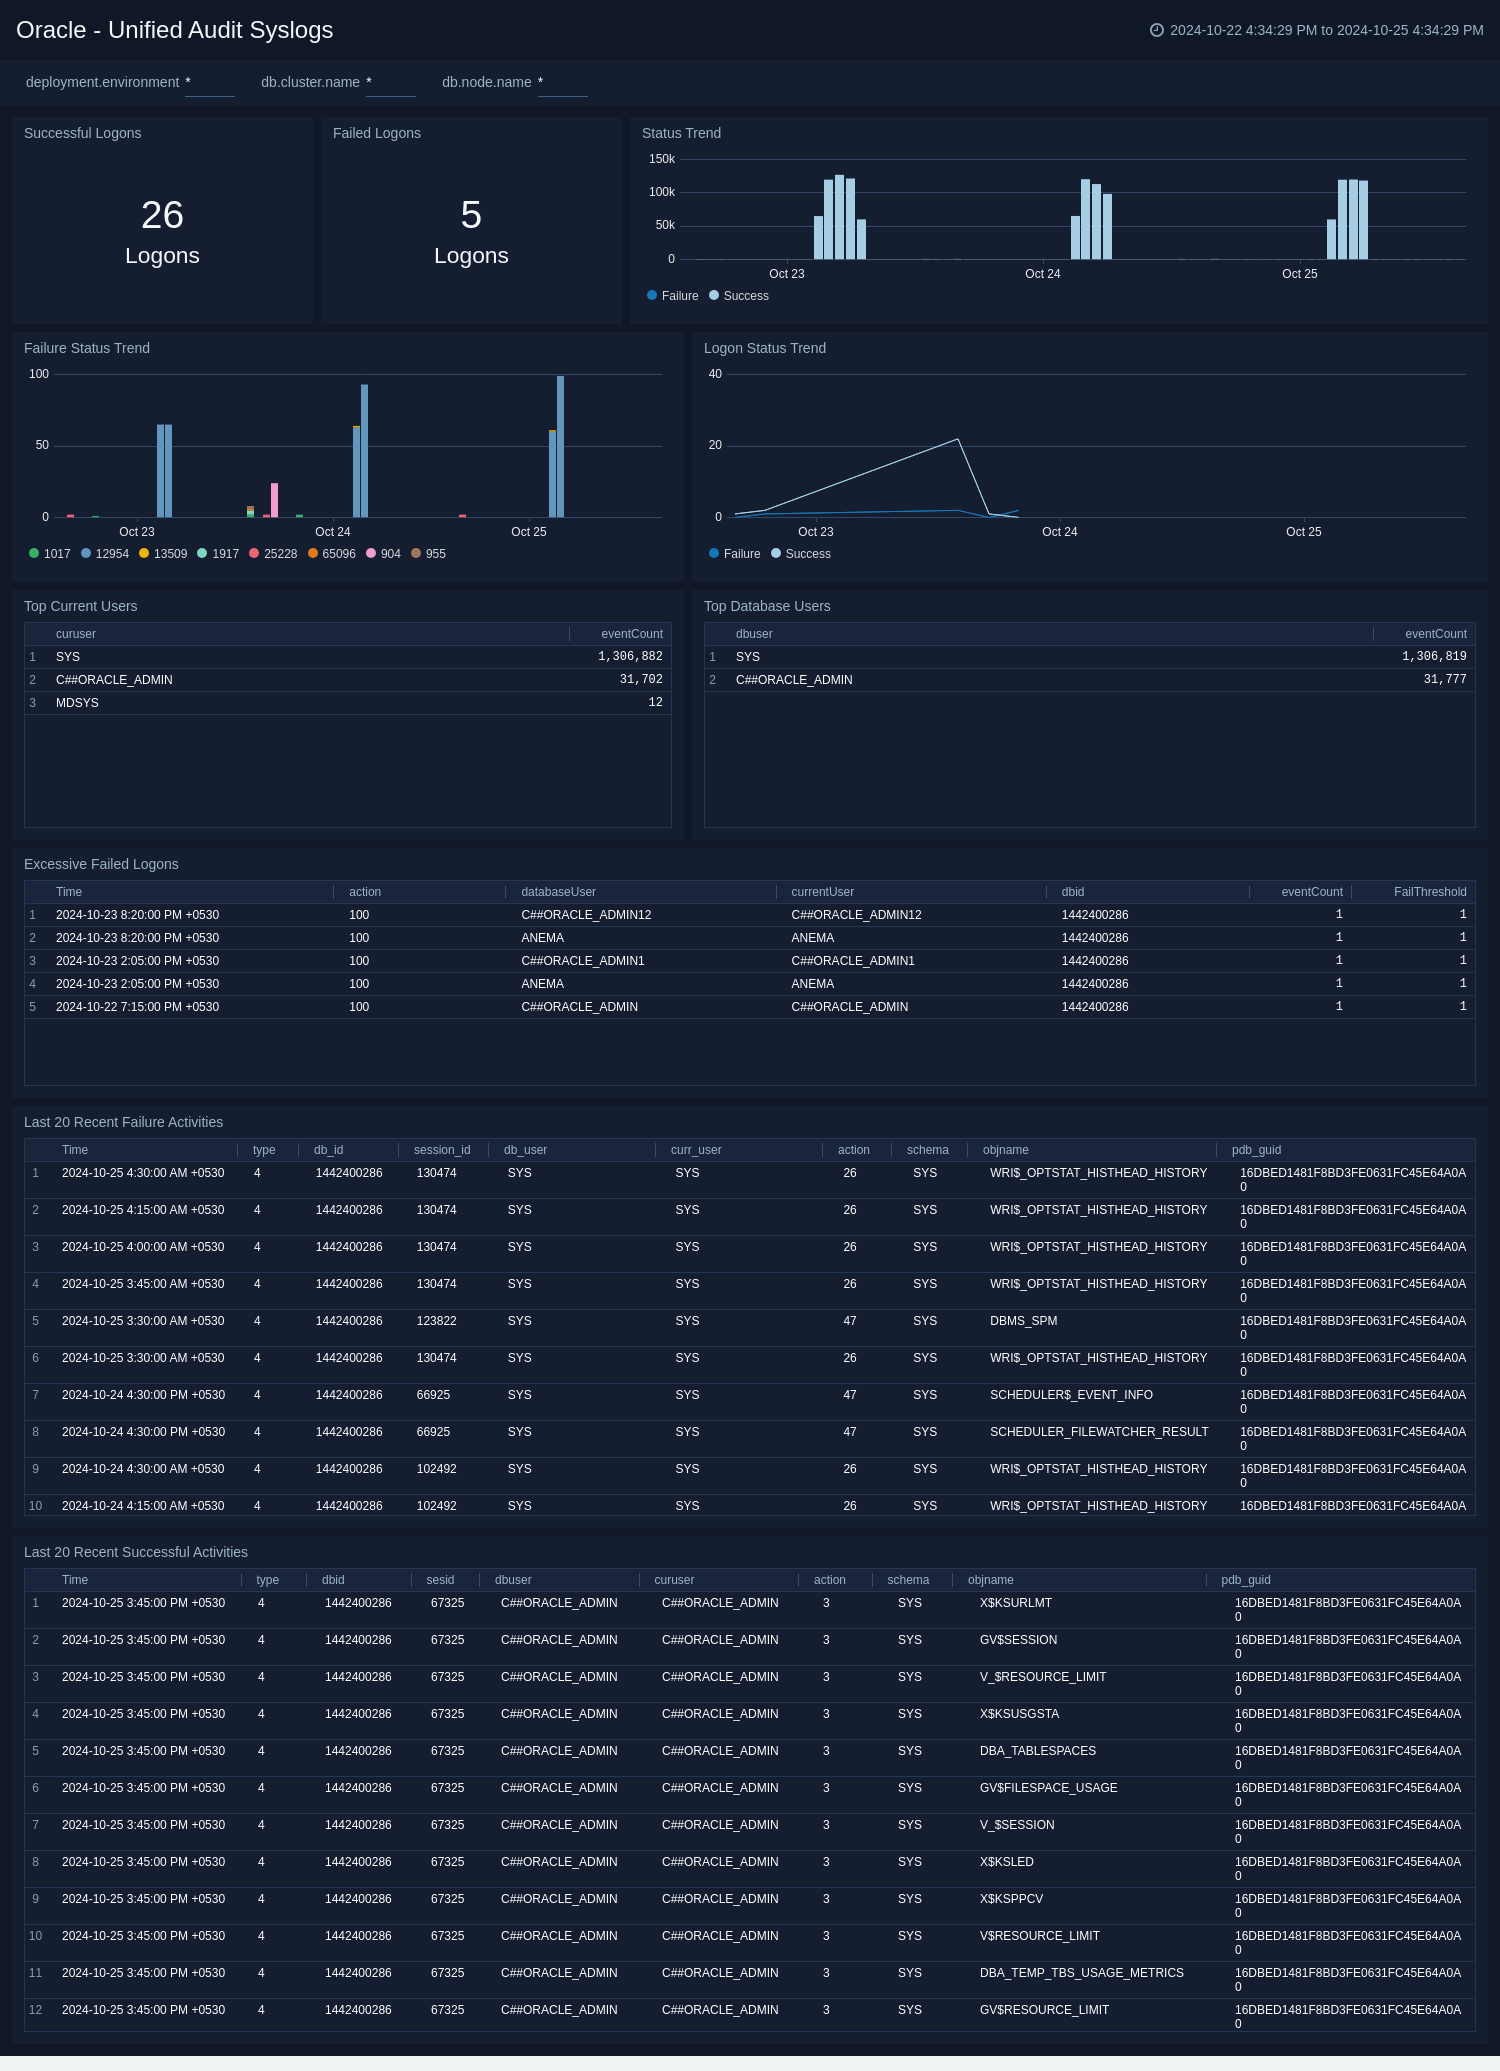
See information derived from the syslog audit trail, including successful and failed activities, successful and failed logon attempts. Additionally, this dashboard also provides insight around logon status trend, top current, and database users. This dashboard work with unified audit logs exported from both Windows and Linux environment.
Performance Details
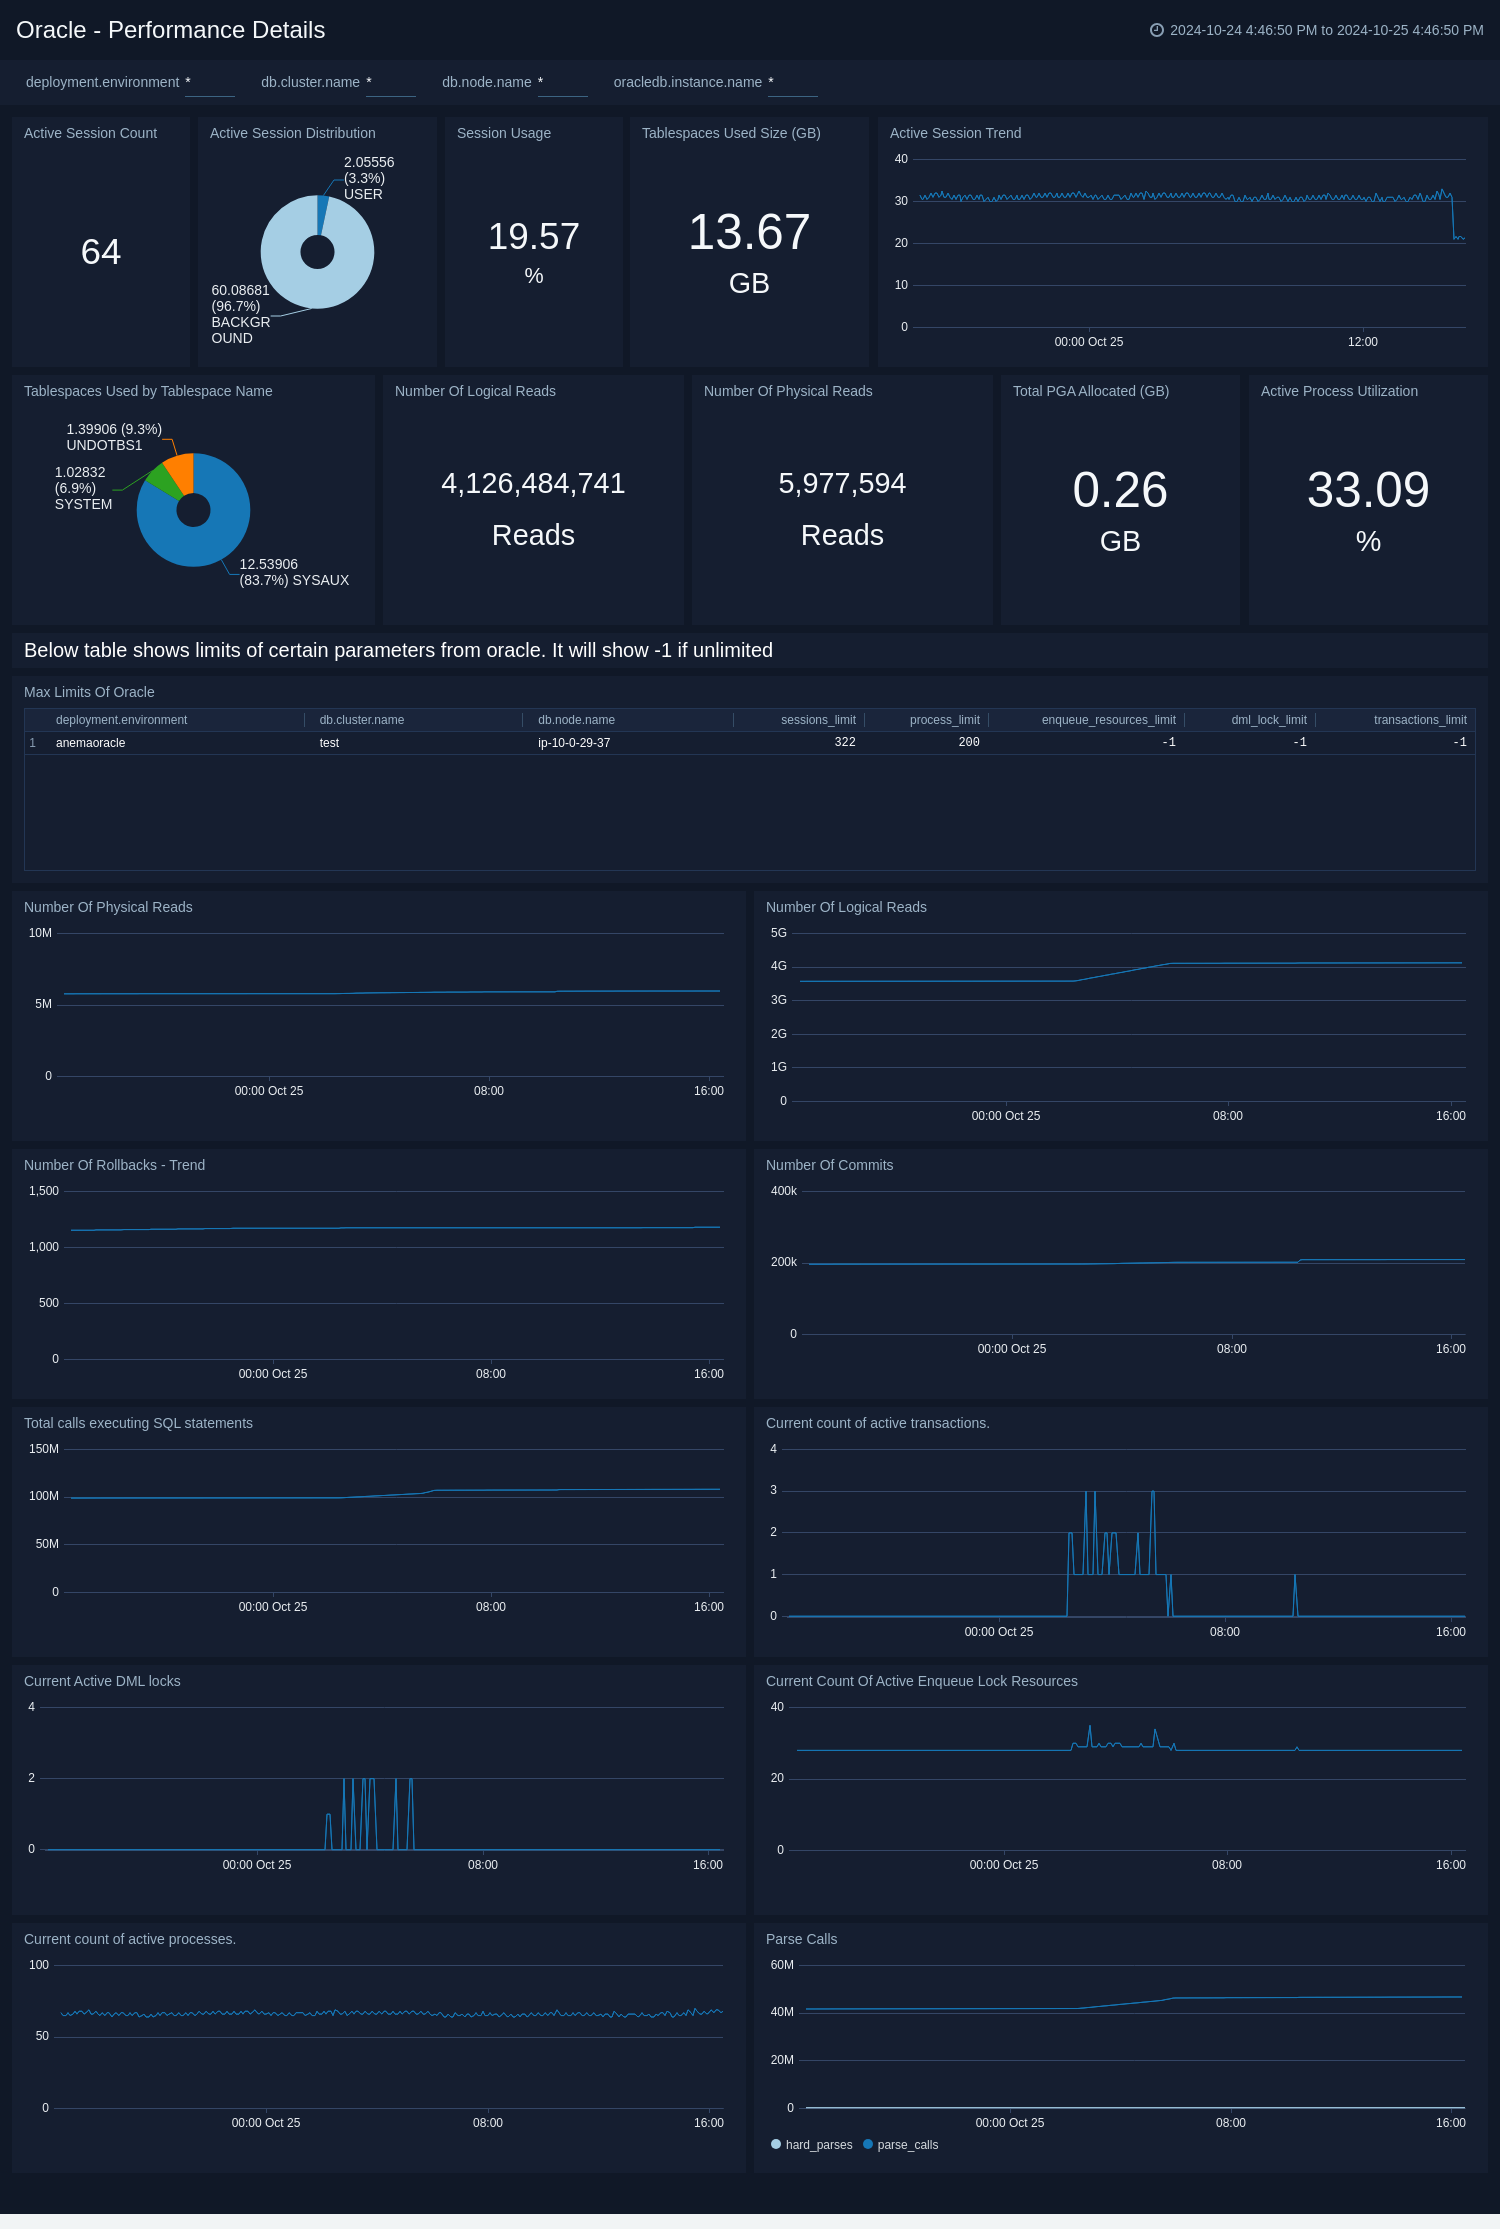
The Oracle - Performance Details dashboard gives insight about - count of rollback, commits, transaction, process, session. In addition to this, it helps monitoring physical and logical reads, PGA allocated. This dashboard is based on the metrics collected by Oracle DB opentelemetry receiver.
Create monitors for Oracle app
From your App Catalog:
- From the Sumo Logic navigation, select App Catalog.
- In the Search Apps field, search for and then select your app.
- Make sure the app is installed.
- Navigate to What's Included tab and scroll down to the Monitors section.
- Click Create next to the pre-configured monitors. In the create monitors window, adjust the trigger conditions and notifications settings based on your requirements.
- Scroll down to Monitor Details.
- Under Location click on New Folder.
note
By default, monitor will be saved in the root folder. So to make the maintenance easier, create a new folder in the location of your choice.
- Enter Folder Name. Folder Description is optional.
tip
Using app version in the folder name will be helpful to determine the versioning for future updates.
- Click Create. Once the folder is created, click on Save.
Oracle alerts
| Name | Description | Alert Condition | Recover Condition |
|---|---|---|---|
Oracle - Admin Restricted Command Execution | This alert is triggered when the Listener cannot resolve a command. | Count > 0 | Count <= 0 |
Oracle - Archival Log Creation | This alert is triggered when an archive log creation error occurs. | Count > 0 | Count <= 0 |
Oracle - Block Corruption | This alert is triggered when corrupt data blocks are detected. | Count > 0 | Count <= 0 |
Oracle - Database Crash | This alert is triggered when the database crashes. | Count > 0 | Count <= 0 |
Oracle - Deadlock | This alert is triggered when deadlocks are detected. | Count > 5 | Count <= 5 |
Oracle - Fatal NI Connect Error | This alert is triggered when a "Fatal NI connect error" is detected. | Count > 0 | Count <= 0 |
Oracle - Internal Errors | This alert is triggered when internal errors are detected. | Count > 0 | Count <= 0 |
Oracle - Login Fail | This alert is triggered when a user login failure is detected. | Count > 0 | Count <= 0 |
Oracle - Possible Inappropriate Activity | This alert is triggered when possible inappropriate activity is detected. | Count > 0 | Count <= 0 |
Oracle - TNS Error | This alert is triggered when TNS operation errors are detected. | Count > 0 | Count <= 0 |
Oracle - Unable To Extend Tablespace | This alert is triggered when tablespace extension failures are detected. | Count > 0 | Count <= 0 |
Oracle - Unauthorized Command Execution | This alert is triggered when a user is not authorized to execute a requested listener command in an Oracle instance. | Count > 0 | Count <= 0 |