PostgreSQL - Classic Collector

The Sumo Logic app for PostgreSQL is a unified logs and metrics app for monitoring your PostgreSQL database. The app provides operational insights into the PostgreSQL database—installed on your local hardware—for real time analysis.
The Sumo Logic app for PostgreSQL includes predefined searches and dashboards that allow you to monitor logs and metrics for the database. The logs enable you to monitor database activity, user activity, incoming connections, query execution time, and errors. The metrics allow you to monitor database resource utilization and throughput performance.
This guide provides an overview of the Sumo app for PostgreSQL features and Dashboards, as well as instructions for collecting logs and metrics from PostgreSQL and installing the app.
PostgreSQL is an open source object-relational database that extends the robustness SQL language to safely store and scale extensive data workloads.
Sample log messages
{
  "timestamp":1615988485842,
  "log":"2021-04-01 08:30:20.002 UTC [11916] postgres@postgres LOG: connection authorized: user=postgres database=postgres ",
  "stream":"stdout",
  "time":"2021-03-17T13:41:19.103646109Z"
}
2021-04-01 08:30:20.002 UTC [11916] postgres@postgres LOG: connection authorized: user=postgres database=postgres
Sample queries
This sample query is from the Fatal Errors panel of the PostgreSQL - Overview dashboard.
_sourceCategory=/PostgreSQL/*  db_system=postgresql db_cluster={{db_cluster}}
| json auto maxdepth 1 nodrop
| if (isEmpty(log), _raw, log) as _raw
| parse "* * * [*] *@* *:  *" as date,time,time_zone,thread_id,user,db,severity,msg
| where severity IN ("ERROR", "FATAL")
| count by date, time, severity, db, user, msg
Collecting logs and metrics from PostgreSQL
This section provides instructions for configuring log and metric collection for the Sumo Logic app for PostgreSQL. This app works for PostgreSQL database clusters running on PostgreSQL versions 11.x or 12.x.
Step 1: Configure Access
On your PostgreSQL database cluster, create a user that has access to following tables:
pg_stat_databasepg_stat_bgwriterpg_stat_replicationpg_databasepg_lockspg_stat_user_tablespg_stat_user_indexespg_statio_user_indexespg_statio_user_tablespg_class
Step 2: Configure PostgreSQL Logs and Metrics Collection
Sumo Logic supports collection of logs and metrics data from PostgreSQL in both Kubernetes and non-Kubernetes environments. Click on the appropriate tab below based on the environment where your PostgreSQL clusters are hosted.
- Kubernetes environments
- Non-Kubernetes environments
In Kubernetes environments, we use the Telegraf Operator, which is packaged with our Kubernetes collection. You can learn more about it here. The diagram below illustrates how data is collected from PostgreSQL in Kubernetes environments. In the architecture shown below, there are four services that make up the metric collection pipeline: Telegraf, Telegraf Operator, Prometheus, and Sumo Logic Distribution for OpenTelemetry Collector.
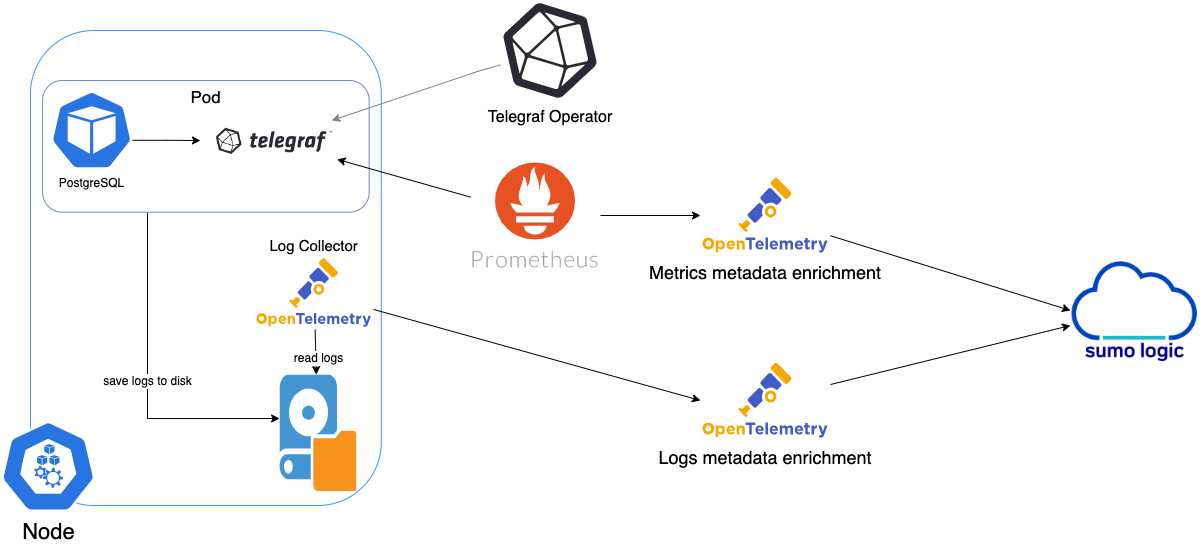
The first service in the metrics pipeline is Telegraf. Telegraf collects metrics from PostgreSQL. Note that we’re running Telegraf in each pod we want to collect metrics from as a sidecar deployment: i.e. Telegraf runs in the same pod as the containers it monitors. Telegraf uses the PostgreSQL Extensible input plugin to obtain metrics, (For simplicity, the diagram doesn’t show the input plugins). The injection of the Telegraf sidecar container is done by the Telegraf Operator. Prometheus pulls metrics from Telegraf and sends them to Sumo Logic Distribution for OpenTelemetry Collector which enriches metadata and sends metrics to Sumo Logic.
In the logs pipeline, Sumo Logic Distribution for OpenTelemetry Collector collects logs written to standard out and forwards them to another instance of Sumo Logic Distribution for OpenTelemetry Collector, which enriches metadata and sends logs to Sumo Logic.
Please ensure that you are monitoring your Kubernetes clusters with the Telegraf operator - If you are not, then please follow these instructions to do so.
Configure Metrics Collection
Follow the steps below to collect metrics from a Kubernetes environment:
- On your PostgreSQL Pods, add the following annotations mentioned in this file.
- Enter in values for the following annotation parameters (marked with
CHANGE_ME) in the downloaded file:telegraf.influxdata.com/inputs. This contains the required configuration for the Telegraf Postgres Input plugin. As telegraf will be run as a sidecar the host should always be localhost.- In the input plugins section which is
[[inputs.postgresql_extensible]]address. Specify the db user, db name and password used for connecting to the database. Examplehost=localhost user=postgres dbname=postgres password=mypassword sslmode=disable
- In the tags section, which is
[inputs.postgresql_extensible.tags]environment. This is the deployment environment where the postgresql cluster resides. For example: dev, prod or qa. While this value is optional we highly recommend setting it.db_cluster. Enter a name to identify this PostgreSQL cluster. This cluster name will be shown in the Sumo Logic dashboards. For example:analytics-dbcluster,webapp-dbcluster.db_cluster_address. Enter the cluster hostname or ip address that is used by the application to connect to the database. It could also be the load balancer or proxy endpoint.db_cluster_port. Enter the database port. If not provided, a default port will be used
db_cluster_address and db_cluster_port should reflect the exact configuration of DB client configuration in your application, especially if you instrument it with OT tracing. The values of these fields should match exactly the connection string used by the database client (reported as values for net.peer.name and net.peer.port metadata fields).
For example, if your application uses “postgresql-prod.sumologic.com:3306” as the connection string, the field values should be set as follows: db_cluster_address=postgresql-prod.sumologic.com db_cluster_port=3306.
If your application connects directly to a given postgresql node, rather than the whole cluster, use the application connection string to override the value of the “host” field in the Telegraf configuration: host=postgresql-prod.sumologic.com
Pivoting to Tracing data from Entity Inspector is possible only for “PostgreSQL address” Entities.
- Do not modify the following values, as they will cause the Sumo Logic apps to not function correctly.
telegraf.influxdata.com/class: sumologic-prometheus. This instructs the Telegraf operator what output to use. This should not be changed.prometheus.io/scrape: "true". This ensures our Prometheus plugin will scrape the metrics.prometheus.io/port: "9273". This tells Prometheus what ports to scrape metrics from. This should not be changed.telegraf.influxdata.com/inputs- In the tags sections
[inputs.postgresql_extensible.tags] component= “database”. This value is used by Sumo Logic apps to identify application components.db_system= “postgresql”. This value identifies the database system.
- In the tags sections
- For more information on configuring the PostgreSQL input plugin for Telegraf, see this doc. For more information on all other Telegraf related global parameters, please see this doc.
- Once this has been done, the Sumo Logic Kubernetes collection will automatically start collecting metrics from the pods having the annotations defined in the previous step. Verify metrics are flowing into Sumo Logic by running the following metrics query.
component="database" and db_system="postgresql"
Collecting Metrics from Multiple Databases (Optional)
If you want to monitor multiple databases, copy and paste the text from this file, create another [[inputs.postgresql_extensible]] section, and add it in your annotations. This section contains only those queries which are meant to be run for each database. Click here for an example.
Configure Logs Collection
This section explains the steps to collect PostgreSQL logs from a Kubernetes environment.
-
Configuring logging parameters in postgresql.conf
- Edit the postgresql.conf configuration file present in your pod. Under the ERROR REPORTING AND LOGGING section of the file, use the following config parameters.
log_min_duration_statement = 250
log_connections = on
log_duration = on
log_hostname = on
log_timezone = 'UTC'
log_min_messages = 'WARNING'
log_line_prefix = '%m [%p] %q%u@%d '- For more information on the above parameters, see the PostgreSQL documentation.
- It’s recommended to save configurations in ConfigMap so that when pods are spawned/killed, the configuration is not lost. See these instructions on how to customize the config file in the bitnami helm chart.
-
Apply the following labels to your PostgreSQL pods:
environment: "<environmentname-CHANGEME>"
  --For example, prod, dev, qa
component: "database"
db_system: "postgresql"
db_cluster: "<clustername-CHANGEME>"
  --for example, analytics-dbcluster, webapp-dbcluster
- Enter in values for the following parameters (marked
CHANGEMEabove):environment. This is the deployment environment where the PostgreSQL cluster identified by the value ofserversresides. While this value is optional we highly recommend setting it.db_cluster. Enter a name to identify this PostgreSQL cluster. This cluster name will be shown in the Sumo Logic dashboards.db_cluster_address. Enter the cluster hostname or ip address that is used by the application to connect to the database. It could also be the load balancer or proxy endpoint.db_cluster_port. Enter the database port. If not provided, a default port will be used.
db_cluster_address and db_cluster_port should reflect exact configuration of DB client configuration in your application, especially if you instrument it with OT tracing. The values of these fields should match exactly the connection string used by the database client (reported as values for net.peer.name and net.peer.port metadata fields).
For example, if your application uses “postgresql-prod.sumologic.com:3306” as the connection string, the field values should be set as follows: db_cluster_address=postgresql-prod.sumologic.com db_cluster_port=3306
If your application connects directly to a given postgresql node, rather than the whole cluster, use the application connection string to override the value of the “host” field in the Telegraf configuration: host=postgresql-prod.sumologic.com.
Pivoting to Tracing data from Entity Inspector is possible only for “PostgreSQL address” Entities.
- Do not modify these values, as it will cause the Sumo Logic apps to not function correctly.
component: “database”. This value is used by Sumo Logic apps to identify application components.db_system: “postgresql”. This value identifies the database system.
- Collecting Logs written to Standard output (recommended). The Sumologic-Kubernetes-Collection will automatically capture the logs from stdout and will send the logs to Sumologic. For more information on deploying the Sumo Logic Kubernetes Collection, please see this page.
- Collect PostgreSQL logs written to log files (optional). If your PostgreSQL service is writing its logs to log files, you can use a sidecar to send log files to stdout. To do this:
- Determine the location of the PostgreSQL log file on Kubernetes.
- Install the Sumo Logic tailing sidecar operator.
- Add the following annotation in addition to the existing annotations.
Example:annotations:
tailing-sidecar:sidecarconfig;container_name:<mount_volume>:/<path_of_postgresql_log_file_name>annotations:
tailing-sidecar: sidecarconfig;data:/pg_data/postgresql.log- Make sure that the PostgreSQL pods are running and annotations and labels are applied. Verify by using the command:
kubectl describe pod <PostgreSQL_pod_name>- Sumo Logic Kubernetes collection will automatically start collecting logs from the pods having the annotations defined above.
Since pods are frequently killed and spawned it’s recommended to use operators like this postgresql operator so that when new pods are created the annotations and labels are automatically applied using the ConfigMap or CRD based configurations.
- Add an FER to normalize the fields in Kubernetes environments. This step is not needed if using application components solution terraform script. Labels created in Kubernetes environments automatically are prefixed with
pod_labels. To normalize these for our app to work, we need to create a Field Extraction Rule if not already created for Database Application Components. To do so:- New UI. In the main Sumo Logic menu select Data Management, and then under Logs select Field Extraction Rules. You can also click the Go To... menu at the top of the screen and select Field Extraction Rules.
Classic UI. In the main Sumo Logic menu, select Manage Data > Logs > Field Extraction Rules. - Click the + Add button on the top right of the table.
- The Add Field Extraction Rule form will appear:
- Enter the following options:
- Rule Name. Enter the name as App Component Observability - Database.
- Applied At. Choose Ingest Time
- Scope. Select Specific Data
- Scope: Enter the following keyword search expression:
pod_labels_environment=* pod_labels_component=database \
pod_labels_db_system=* pod_labels_db_cluster=*- Parse Expression. Enter the following parse expression:
| if (!isEmpty(pod_labels_environment), pod_labels_environment, "") as environment
| pod_labels_component as component
| pod_labels_db_system as db_system
| if (!isEmpty(pod_labels_db_cluster), pod_labels_db_cluster, null) as db_cluster - Click Save to create the rule.
- Verify logs are flowing into Sumo Logic by running the following logs query
component="database" and db_system="postgresql" - New UI. In the main Sumo Logic menu select Data Management, and then under Logs select Field Extraction Rules. You can also click the Go To... menu at the top of the screen and select Field Extraction Rules.
We use the Telegraf Operator for PostgreSQL metric collection and the Sumo Logic Installed Collector for collecting PostgreSQL logs. The diagram below illustrates the components of the PostgreSQL collection in a non-Kubernetes environment for each database server. Telegraf runs on the same system as PostgreSQL, and uses the PostgreSQL Extensible input plugin to obtain PostgreSQL metrics, and the Sumo Logic output plugin to send the metrics to Sumo Logic. PostgreSQL logs are sent to Sumo Logic Local File Source on Installed Collector.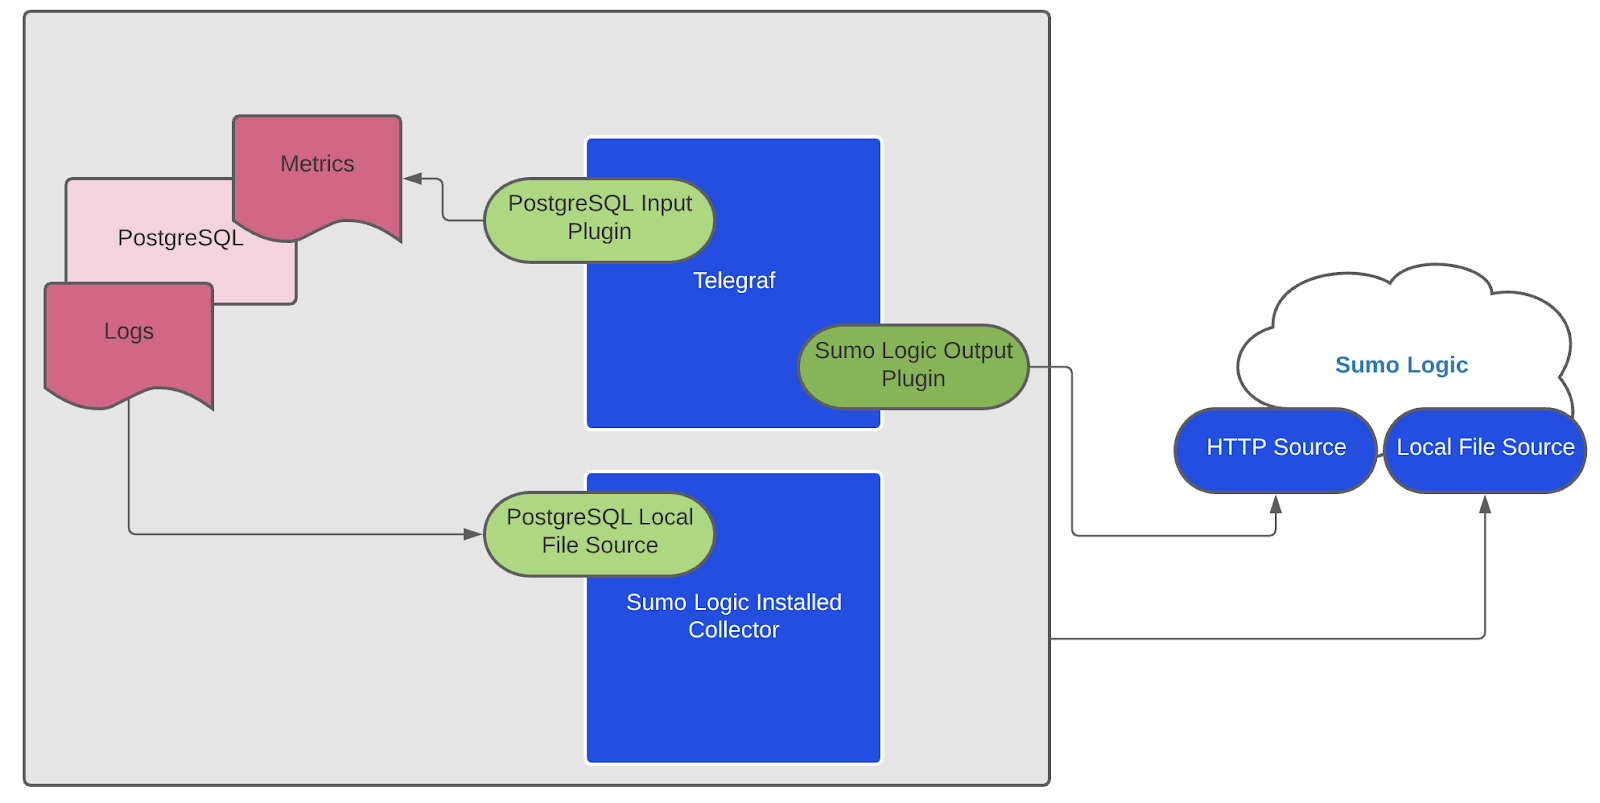
This section provides instructions for configuring metrics collection for the Sumo Logic app for PostgreSQL. Follow the below instructions to set up the metric collection for a given node in a PostgreSQL cluster.
Configure Metrics Collection
- Configure a Hosted Collector. To create a new Sumo Logic hosted collector, perform the steps in the Configure a Hosted Collector section of the Sumo Logic documentation.
- Configure a HTTP Logs and Metrics Source. Create a new HTTP Logs and Metrics Source in the hosted collector created above by following these instructions. . Make a note of the HTTP Source URL.
- Install Telegraf. Use the following steps to install Telegraf on each database server node
- Configure and start Telegraf. As part of collecting metrics data from Telegraf, we will use the Postgresql extensible input plugin to get data from Telegraf and the Sumo Logic output plugin to send data to Sumo Logic.
- Create or modify telegraf.conf in
/etc/telegraf/telegraf.d/and copy and paste the text from this file. - Enter values for the following parameters (marked with
CHANGE_ME) in the downloaded file.
- In the input plugins section,
[[inputs.postgresql_extensible]]:address. Specify the db user, db name, and password used for connecting to the database. This is the user you created for monitoring the PostgreSQL database in Step 1. For example:host=localhost dbname=postgres user=postgres password=mypassword sslmode=disable.- In the tags section,
[inputs.postgresql_extensible.tags]:environment. This is the deployment environment where the Postgresql cluster resides. For example dev, prod or qa. While this value is optional we highly recommend setting it.db_cluster. Enter a name to identify this PostgreSQL cluster. This cluster name will be shown in the Sumo Logic dashboards. For example: analytics-dbcluster, webapp-dbcluster.db_cluster_address. Enter the cluster hostname or ip address that is used by the application to connect to the database. It could also be the load balancer or proxy endpoint.db_cluster_port. Enter the database port. If not provided, a default port will be used.
- Create or modify telegraf.conf in
db_cluster_address and db_cluster_port should reflect the exact configuration of DB client configuration in your application, especially if you instrument it with OT tracing. The values of these fields should match exactly the connection string used by the database client (reported as values for net.peer.name and net.peer.port metadata fields).
For example, if your application uses “postgresql-prod.sumologic.com:3306” as the connection string, the field values should be set as follows: db_cluster_address=postgresql-prod.sumologic.com db_cluster_port=3306
If your application connects directly to a given PostgreSQL node, rather than the whole cluster, use the application connection string to override the value of the “host” field in the Telegraf configuration: host=postgresql-prod.sumologic.com
Pivoting to Tracing data from Entity Inspector is possible only for “PostgreSQL address” Entities.
- In the output plugins section,
[[outputs.sumologic]]:url. This is the HTTP source URL created in Step 2 (Configure a HTTP Logs and Metrics Source). Please see this doc for more information on additional parameters for configuring the Sumo Logic Telegraf output plugin.
- Do not modify these values, as they will cause the Sumo Logic apps to not function correctly.
data_format = “prometheus”In the output plugins section which is[[outputs.sumologic]]This indicates that metrics should be sent in the Prometheus format to Sumo Logiccomponent = “database”. In the input plugins section which is[[inputs.postgresql_extensible.tags]]. This value is used by Sumo Logic apps to identify application components.db_system = “postgresql”. In the input plugins sections which is[[inputs.postgresql_extensible.tags]]. This value identifies the database system.
- For other optional parameters like databases, max_lifetime please refer to this plugin documentation for configuring the postgresql_extensible input plugin for Telegraf. Here is an example sample_telegraf.conf file.
- See this doc for more parameters that can be configured in the Telegraf agent globally.
- Once you have finalized your telegraf.conf file, you can start or reload the telegraf service using instructions from the doc. At this point, PostgreSQL metrics should start flowing into Sumo Logic.
Collecting Metrics from Multiple databases (optional)
If you want to monitor multiple databases, copy and paste the text from this file and create another [[inputs.postgresql_extensible]] section. This section contains only those queries which are meant to be run for each database. Click here to see an example.
Configure Logs Collection
Perform the steps outlined below for each PostgreSQL database server.
-
Configure logging in PostgreSQL
- Locate your local PostgreSQL postgresql.conf configuration file in the database data_directory. For more information, see the PostgreSQL File Locations documentation. By default it’s located at
/var/lib/pgsql/<version>/data/postgresql.conf. You can runSHOW config_filecommand inside your server’s psql shell to get the location. After determining the location of conf file, modify the PostgreSQL postgresql.conf configuration file logging parameters - Connect to the database server (using SSH) in a terminal window.
- Open postgresql.conf configuration file.
- Under the ERROR REPORTING AND LOGGING section of the file, use following config parameters. For more information on the following parameters, click here.
log_destination = 'stderr'
logging_collector = on
log_filename = 'postgresql-%Y-%m-%d_%H%M%S.log'
log_truncate_on_rotation = off
log_rotation_age = 1d
log_min_duration_statement = 250
log_connections = on
log_duration = on
log_hostname = on
log_timezone = 'UTC'
log_min_messages = 'WARNING'
log_line_prefix = '%m [%p] %q%u@%d '- Save the postgresql.conf file and restart the postgresql server:
sudo service postgresql restart - Locate your local PostgreSQL postgresql.conf configuration file in the database data_directory. For more information, see the PostgreSQL File Locations documentation. By default it’s located at
-
Configure an Installed Collector. To add an Installed collector, perform the steps as defined on the page Configure an Installed Collector.
-
Configure a Local File Source. To add a Local File Source source for PostgreSQL do the following:
- Add a Local File Source in the installed collector configured in the previous step.
- Configure the Local File Source fields as follows:
- Name. (Required)
- Description. (Optional)
- File Path (Required). Enter the path to your log file.By default postgreSQL log files are located in
/var/lib/pgsql/<version>/data/log/*.log - Source Host. Sumo Logic uses the hostname assigned by the OS unless you enter a different hostname
- Source Category. Enter any string to tag the output collected from this Source, such as PostgreSQL/Logs. (The Source Category metadata field is a fundamental building block to organize and label Sources. For details, see Best Practices.)
- Fields. Set the following fields:
component= databasedb_system= postgresqldb_cluster=<Your_Postgresql_Cluster_Name>(for example, analytics-dbcluster, webapp-dbcluster)environment=<Environment_Name>(For example dev, prod or qa)db_cluster_address. Enter the cluster hostname or ip address that is used by the application to connect to the database. It could also be the load balancer or proxy endpoint.db_cluster_port. Enter the database port. If not provided, a default port will be used.
notedb_cluster_addressanddb_cluster_portshould reflect exact configuration of DB client configuration in your application, especially if you instrument it with OT tracing. The values of these fields should match exactly the connection string used by the database client (reported as values for net.peer.name and net.peer.port metadata fields).For example, if your application uses “postgresql-prod.sumologic.com:3306” as the connection string, the field values should be set as follows:
db_cluster_address=postgresql-prod.sumologic.com db_cluster_port=3306If your application connects directly to a given PostgreSQL node, rather than the whole cluster, use the application connection string to override the value of the “host” field in the Telegraf configuration:
host=postgresql-prod.sumologic.comPivoting to Tracing data from Entity Inspector is possible only for “PostgreSQL address” Entities.
- Ensure that the
db_clusterandenvironmentvalues are the same as they were configured for Telegraf in the Configure metrics collection. - Configure the Advanced section:
- Enable Timestamp Parsing. Select Extract timestamp information from log file entries.
- Time Zone. Use the timezone from log file option.
- Timestamp Format. The timestamp format is automatically detected.
- Encoding. Select UTF-8 (Default).
- Enable Multiline Processing. Detect messages spanning multiple lines
- Select Infer Boundaries - Detect message boundaries automatically
- Click Save.
Here’s the sample source.json
{
  "api.version":"v1",
  "source":{
    "name":"PostgreSQL_Logs_Source",
    "category":"/PostgreSQL/logs",
    "automaticDateParsing":true,
    "multilineProcessingEnabled":true,
    "useAutolineMatching":true,
    "forceTimeZone":false,
    "filters":[],
    "cutoffTimestamp":0,
    "encoding":"UTF-8",
    "fields":{
      "environment":"dev",
      "db_cluster":"analytics_cluster",
      "component":"database",
      "db_system":"postgresql"
    },
    "pathExpression":"/var/lib/pgsql/12/data/log/*.log",
    "blacklist":[],
    "sourceType":"LocalFile"
  }
}
At this point, PostgreSQL logs should start flowing into Sumo Logic.
Installing the PostgreSQL app
To install the app, do the following:
Next-Gen App: To install or update the app, you must be an account administrator or a user with Manage Apps, Manage Monitors, Manage Fields, Manage Metric Rules, and Manage Collectors capabilities depending upon the different content types part of the app.
- Select App Catalog.
- In the 🔎 Search Apps field, run a search for your desired app, then select it.
- Click Install App.
note
Sometimes this button says Add Integration.
- Click Next in the Setup Data section.
- In the Configure section of your respective app, complete the following fields.
- Is K8S deployment involved. Specify if resources being monitored are partially or fully deployed on Kubernetes (K8s)
- Click Next. You will be redirected to the Preview & Done section.
Post-installation
Once your app is installed, it will appear in your Installed Apps folder, and dashboard panels will start to fill automatically.
Each panel slowly fills with data matching the time range query received since the panel was created. Results will not immediately be available but will be updated with full graphs and charts over time.
As part of the app installation process, the following fields will be created by default:
componentenvironmentdb_systemdb_clusterpoddb_cluster_addressdb_cluster_port
Additionally, if you're using Cassandra in the Kubernetes environment, the following additional fields will be created by default during the app installation process:
pod_labels_componentpod_labels_environmentpod_labels_db_systempod_labels_db_clusterpod_labels_db_cluster_addresspod_labels_db_cluster_port
For information on setting up fields, see Fields.
Viewing PostgreSQL dashboards
All dashboards have a set of filters that you can apply to the entire dashboard. Use these filters to drill down and examine the data to a granular level.
- You can change the time range for a dashboard or panel by selecting a predefined interval from a drop-down list, choosing a recently used time range, or specifying custom dates and times. Learn more.
- You can use template variables to drill down and examine the data on a granular level. For more information, see Filtering Dashboards with Template Variables.
- Most Next-Gen apps allow you to provide the scope at the installation time and are comprised of a key (
_sourceCategoryby default) and a default value for this key. Based on your input, the app dashboards will be parameterized with a dashboard variable, allowing you to change the dataset queried by all panels. This eliminates the need to create multiple copies of the same dashboard with different queries.
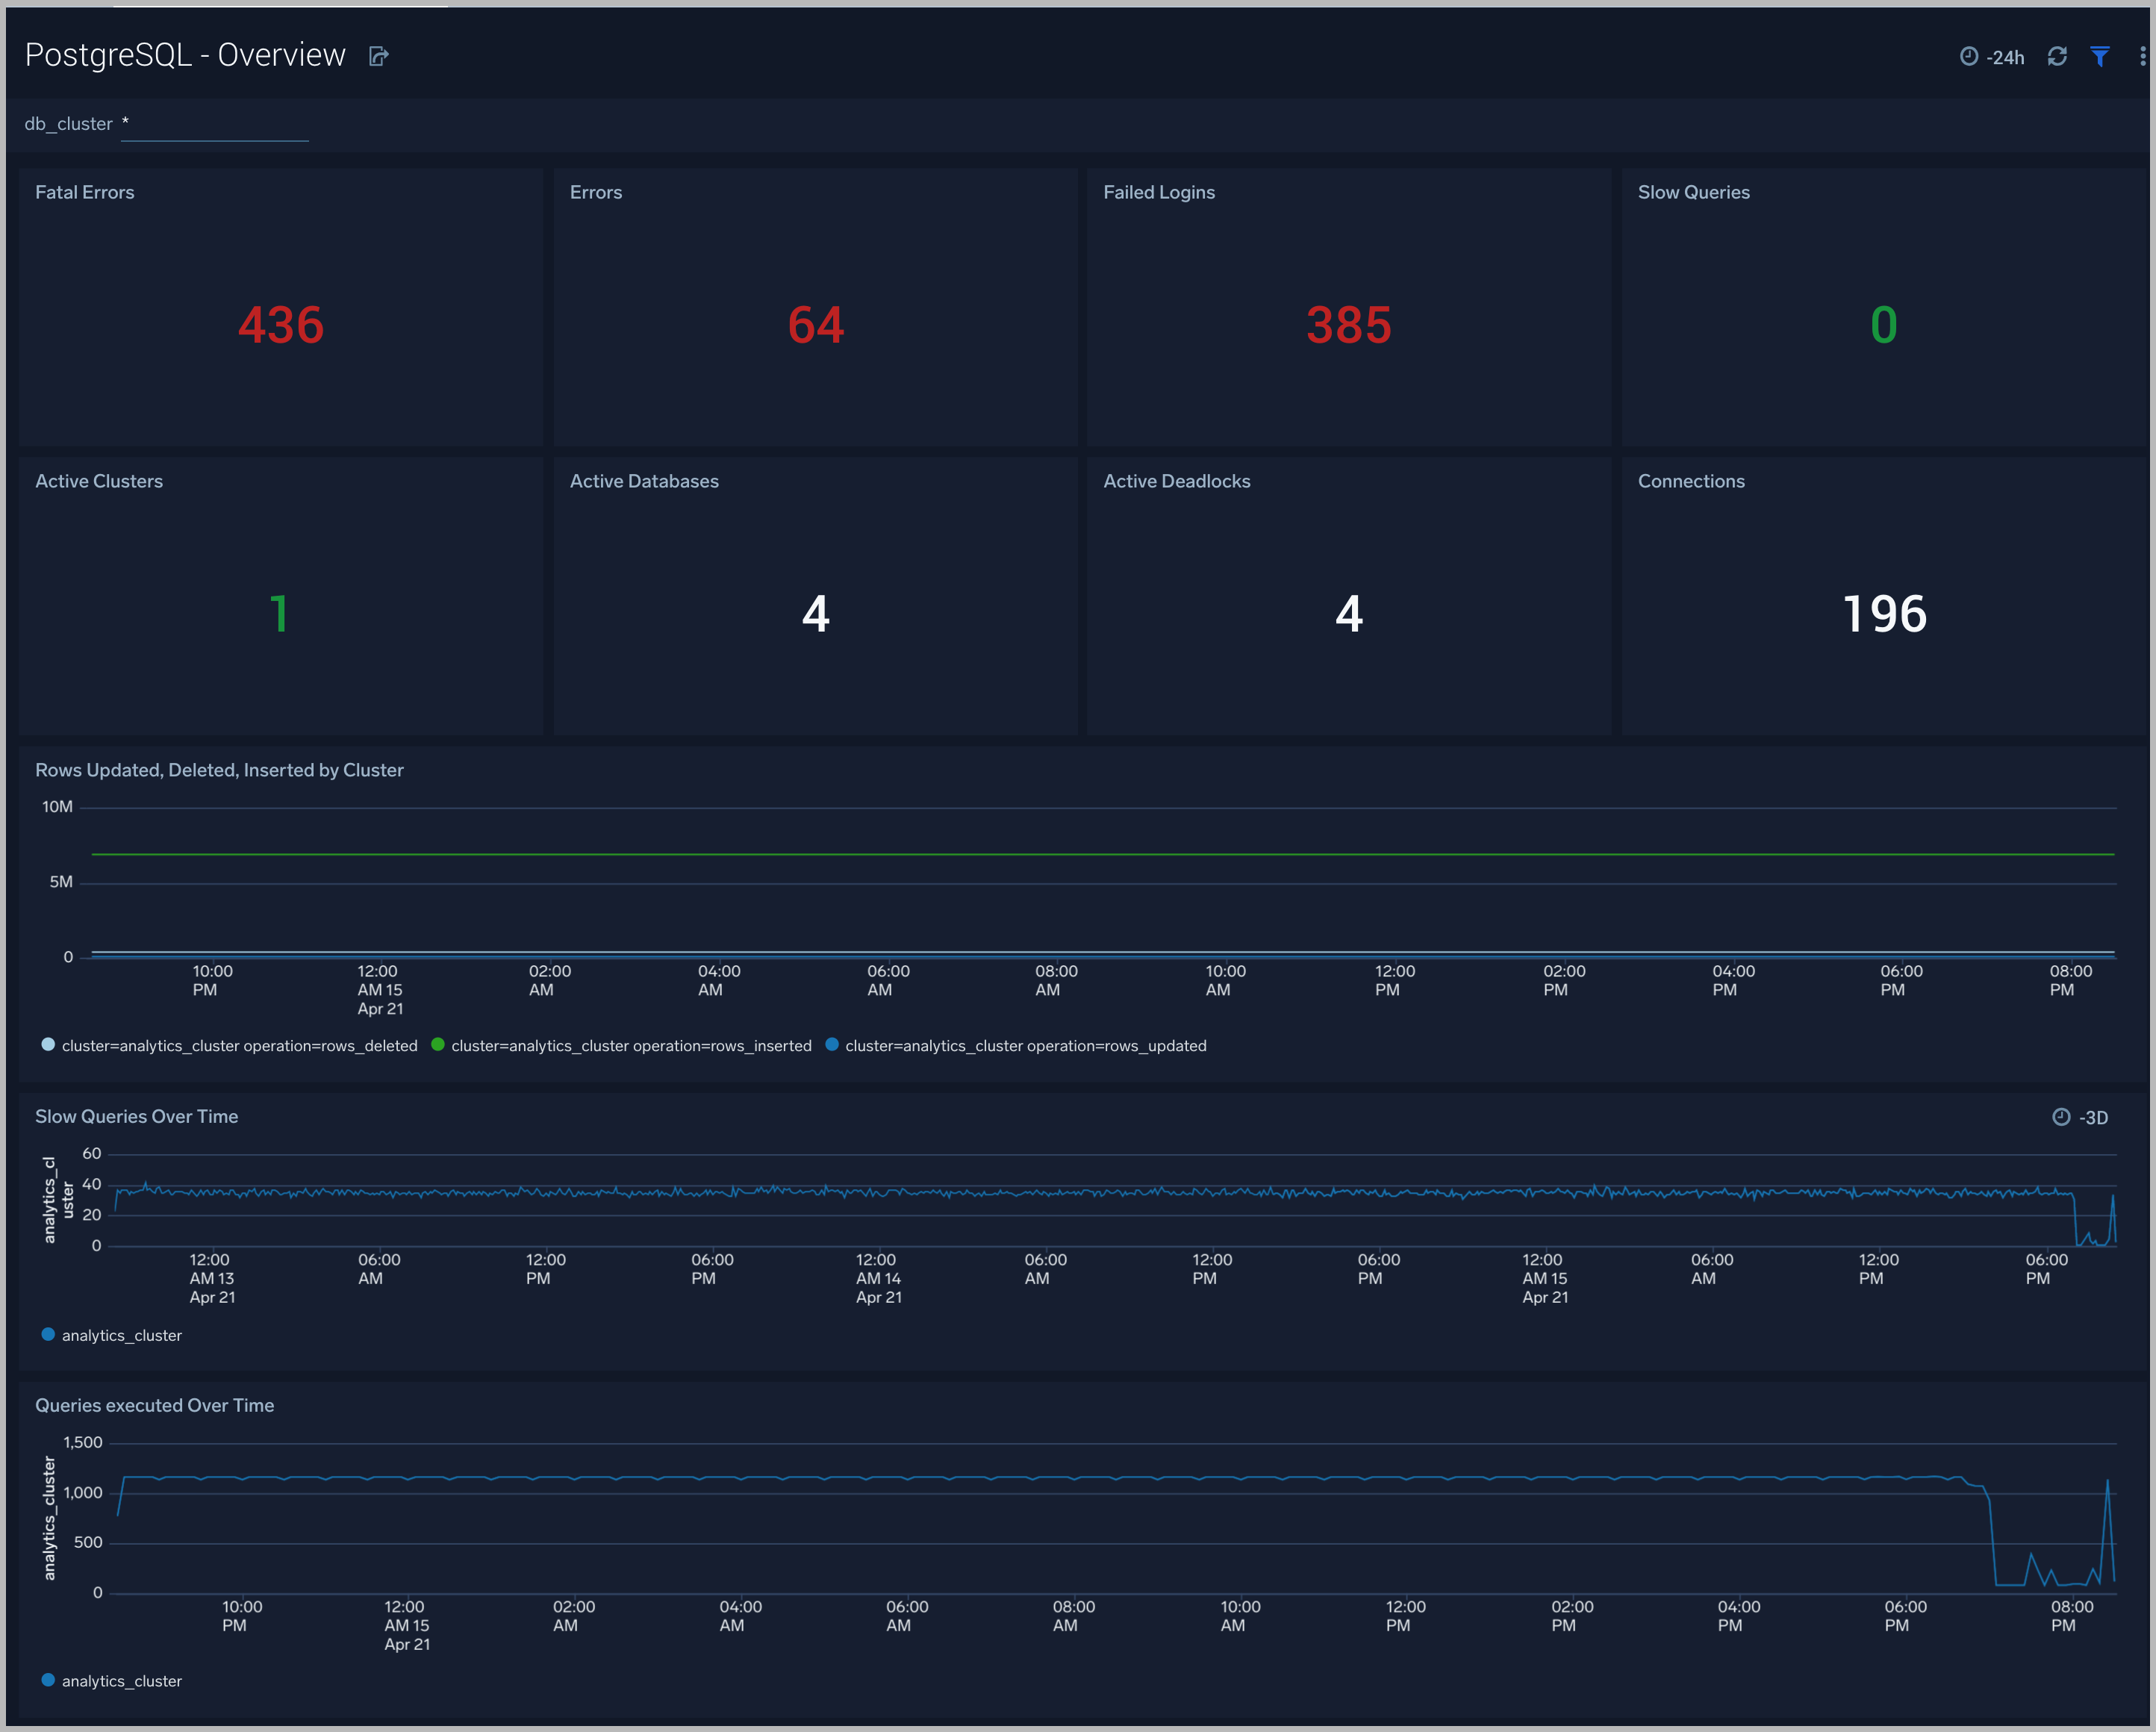
Overview
The PostgreSQL - Overview dashboard gives you an at-a-glance view of the state of your database clusters by monitoring errors, failed logins, slow queries and trends over time.
Use this dashboard to:
- Determine the number of active databases, clusters and deadlocks.
- Drill-down into database errors, failed logins and slow queries.
- Determine if your database or queries need to be tuned based on comparing the number slow queries.
- Monitor the number of insert, update, delete operations by cluster.
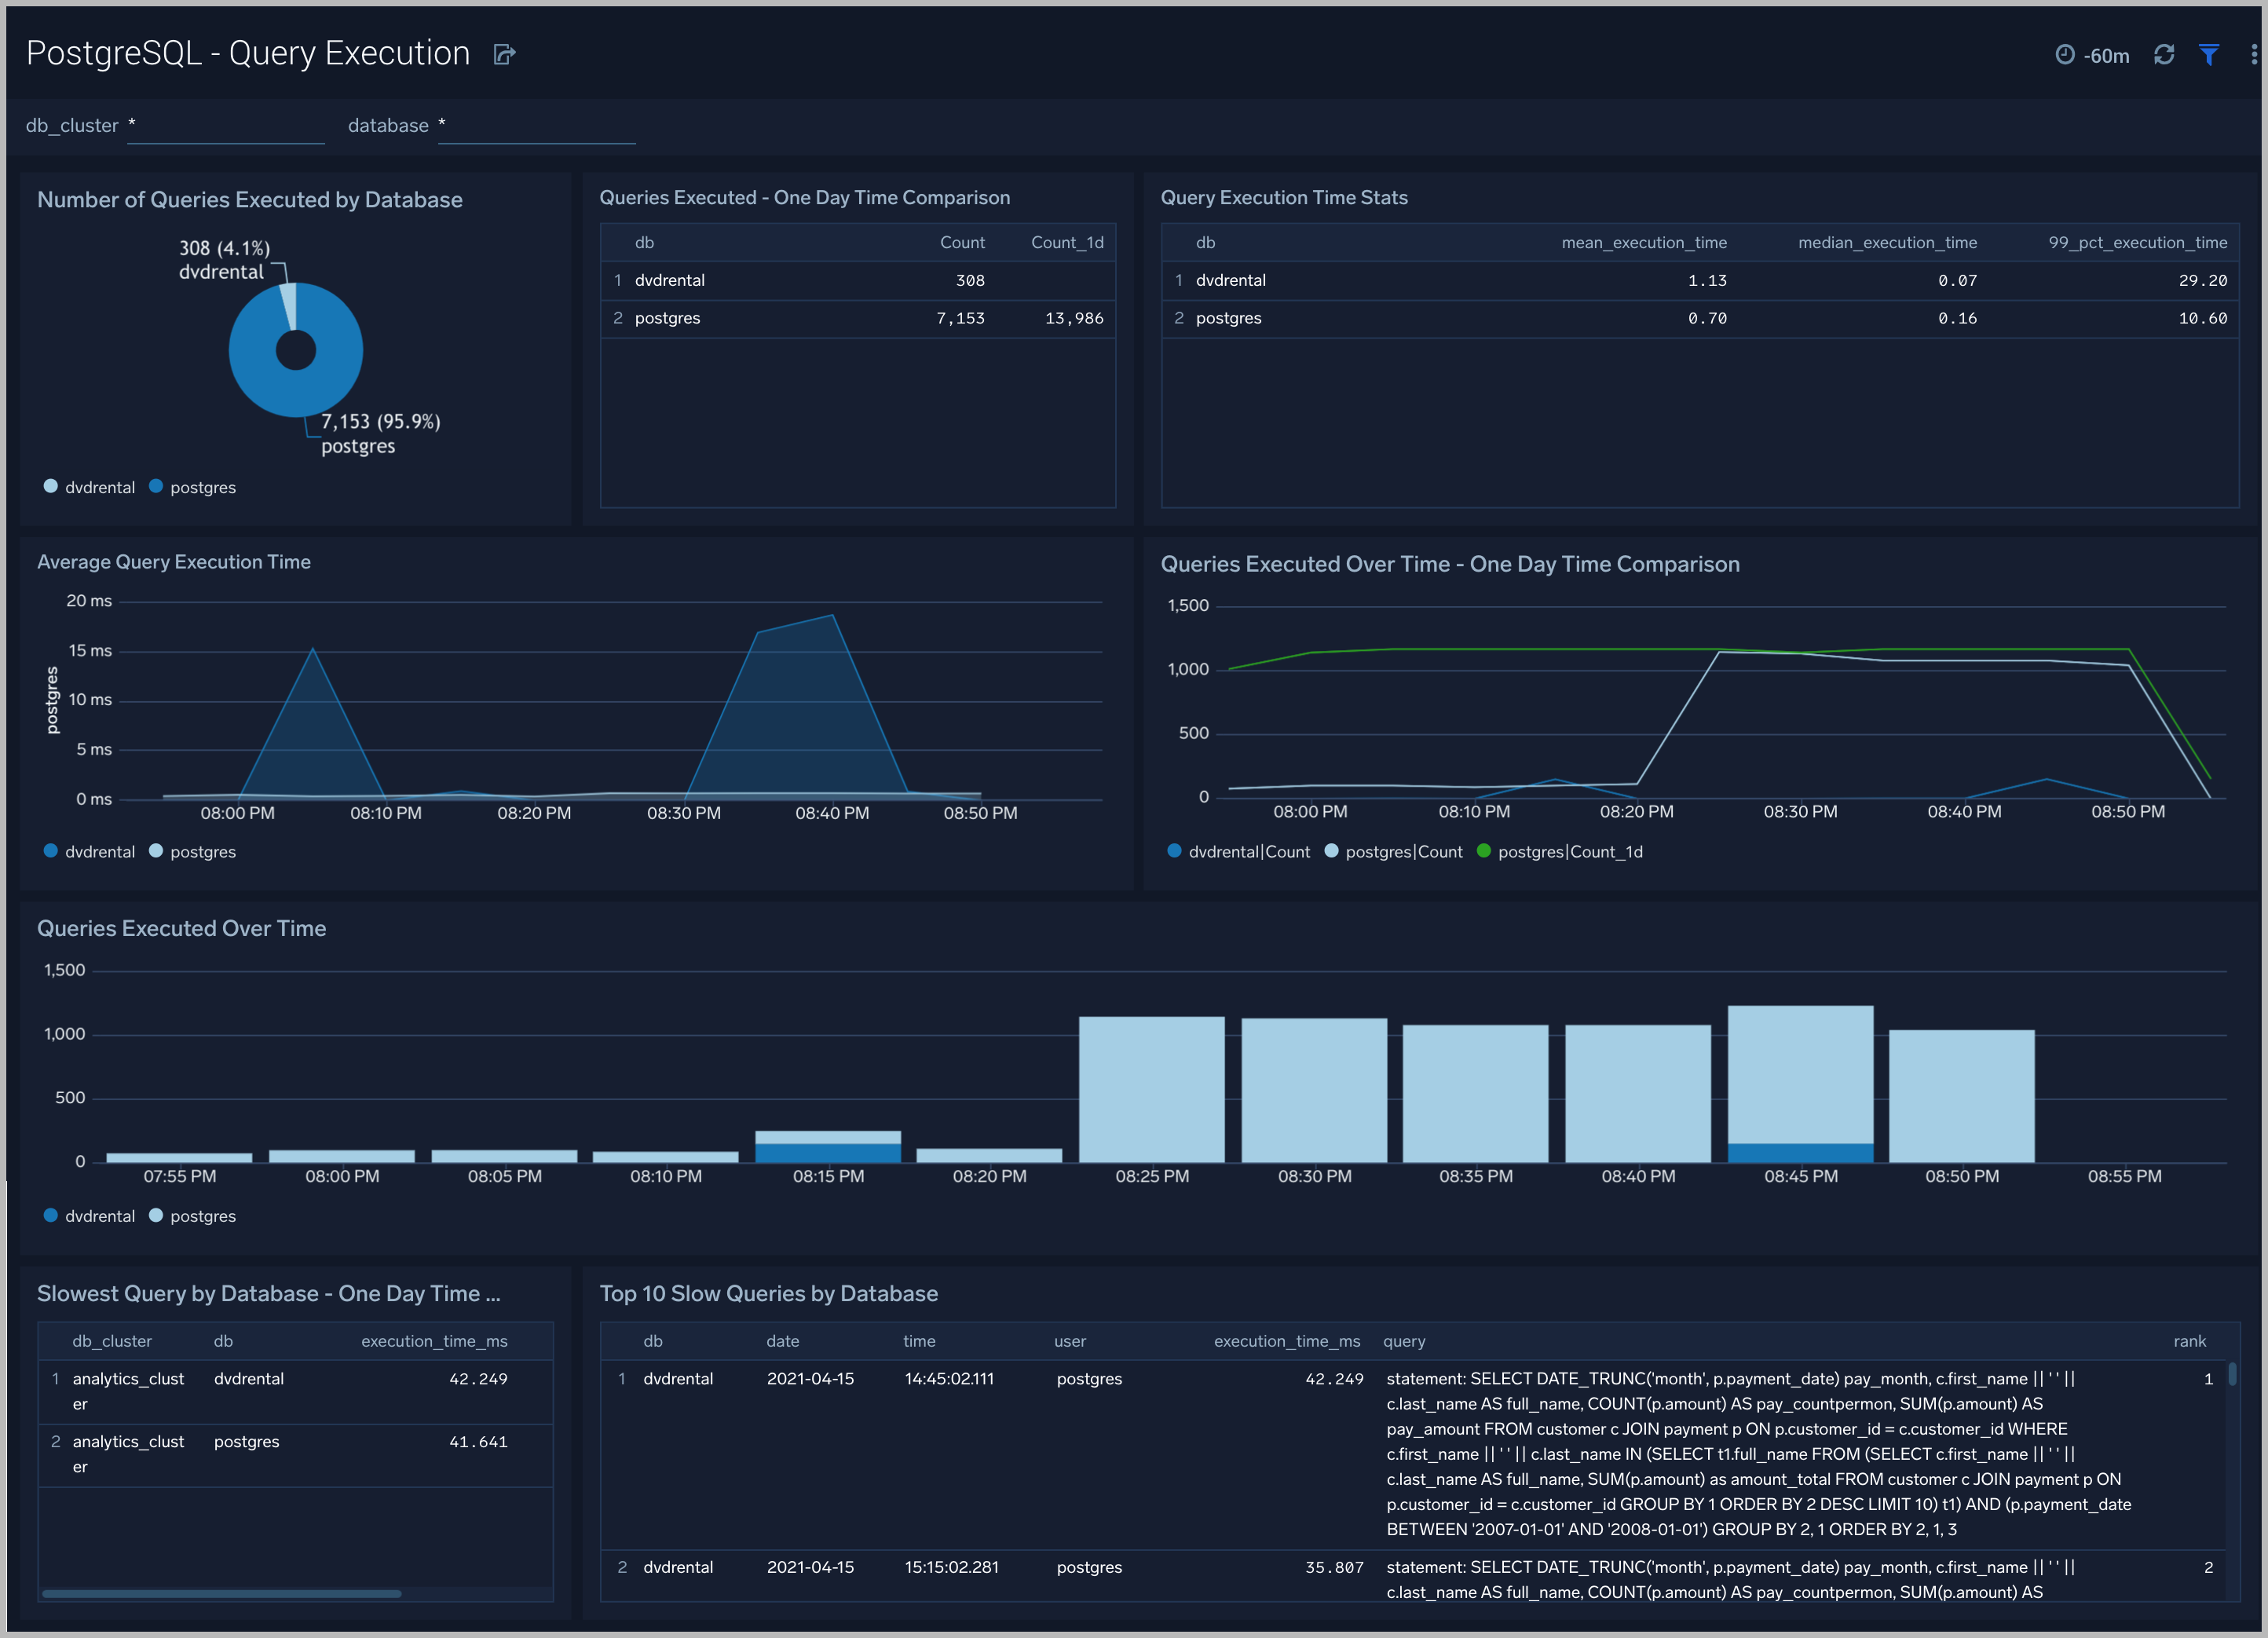
Query Execution
The PostgreSQL Query Execution dashboard gives you insights into the number and time taken to execute queries:
Use this dashboard to:
- Monitor query performance and identify slow queries.
- Examine query execution trends.
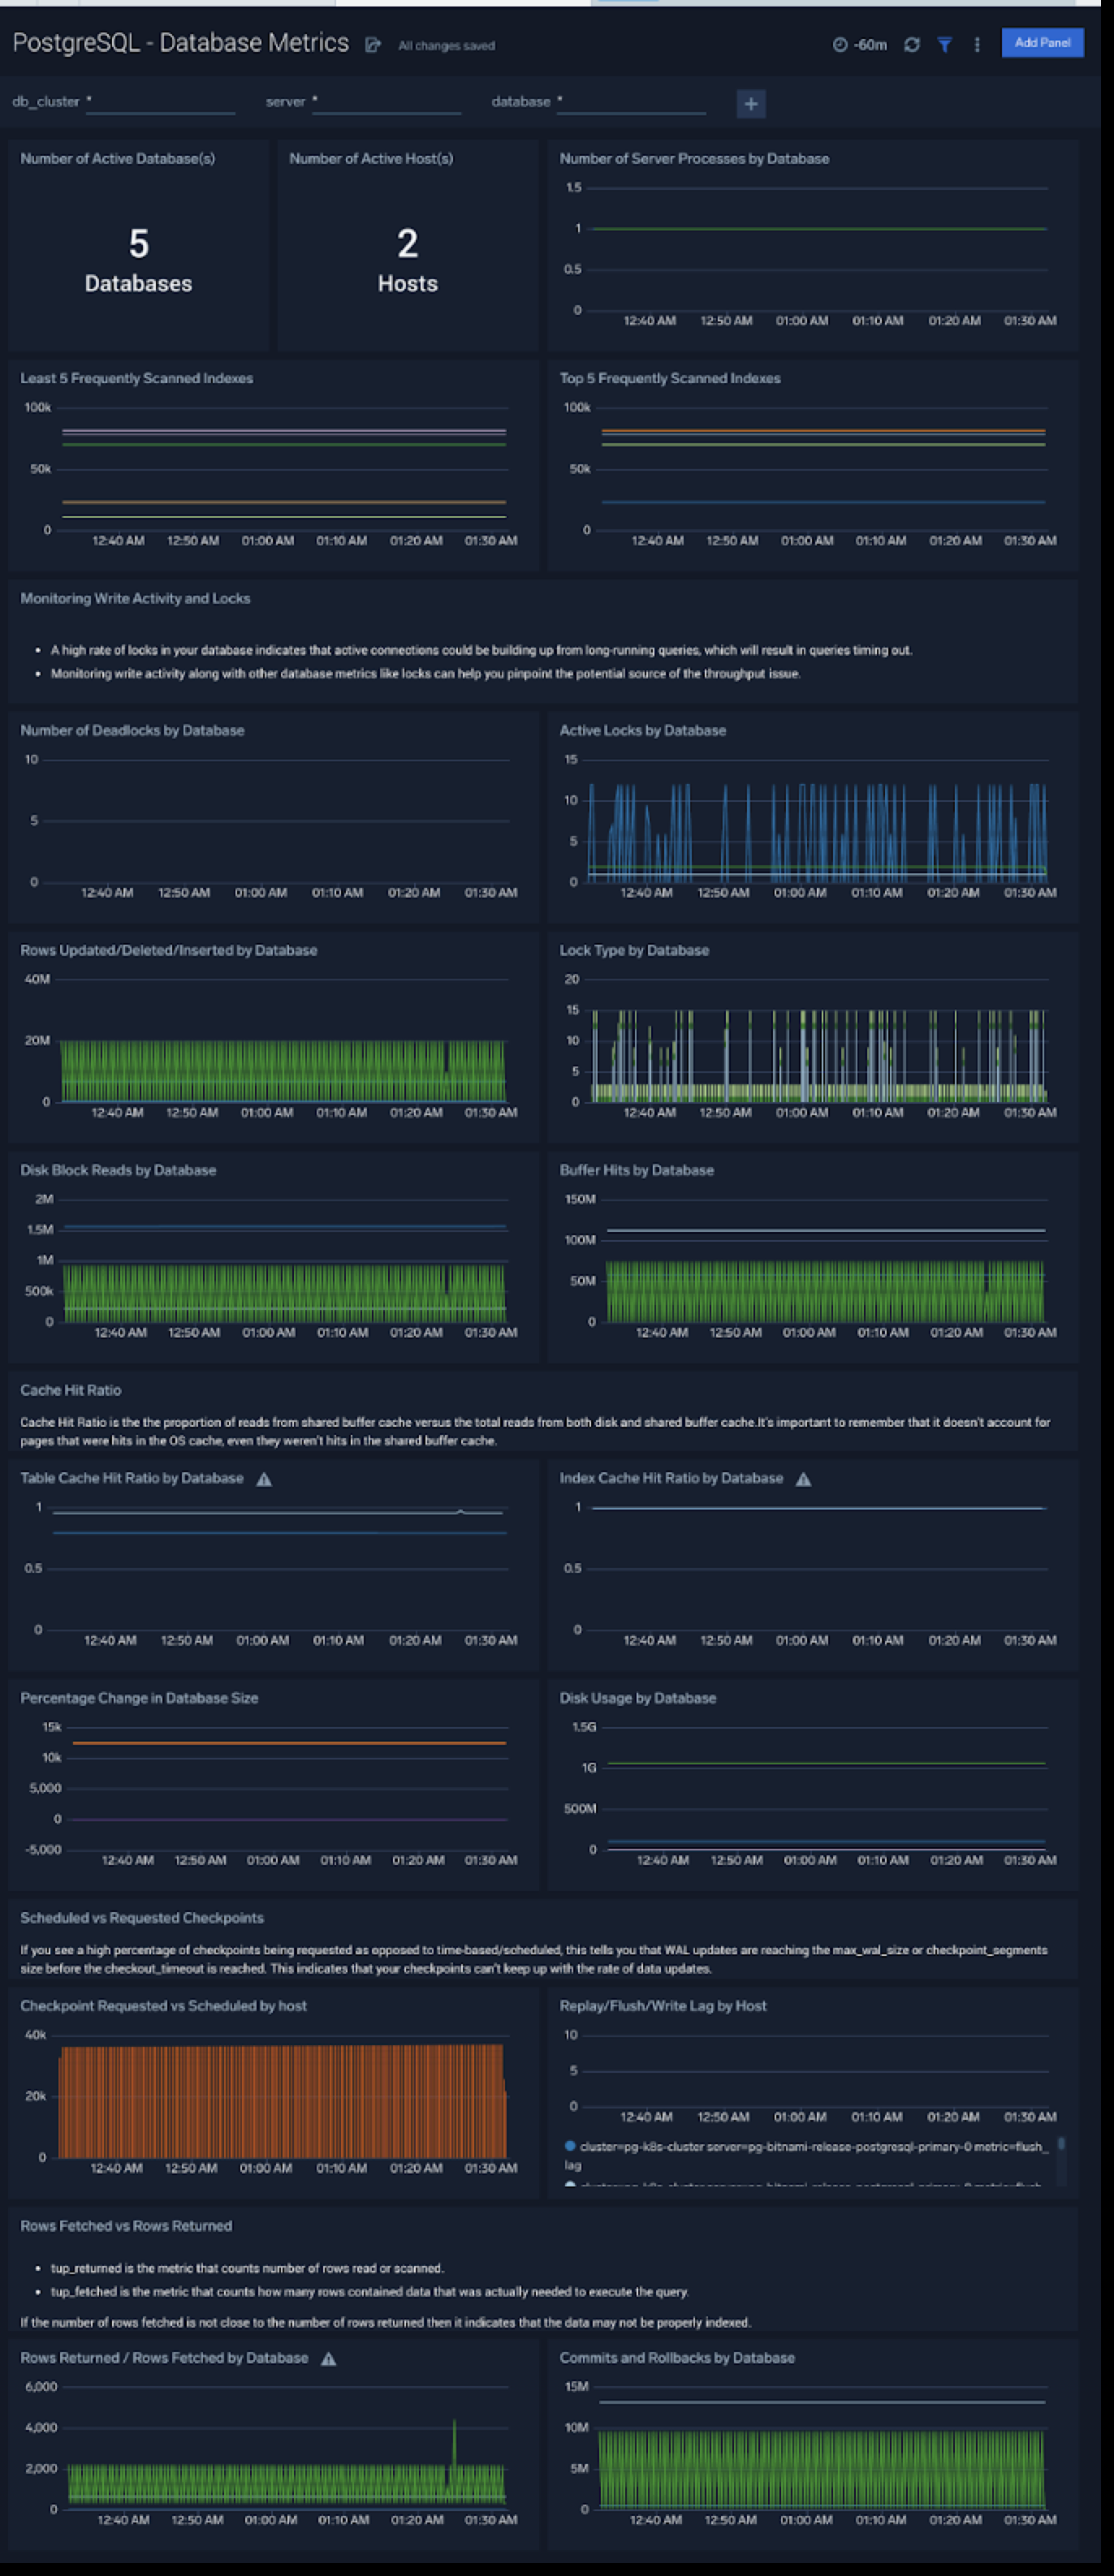
Database Metrics
The PostgreSQL - Database Metrics dashboard allows you to monitor the database performance, which includes disk usage, deadlocks, buffer hits, server processes, commits, rollbacks, and scans.
Use this dashboard to:
- Understand the behavior and performance of your database clusters.
- Monitor database size and disk usage.
- Identify top 5 and least 5 frequently scanned indexes.
Relation and Schema Metrics
The PostgreSQL - Relation and Schema Metrics dashboard allows you to view and analyze the metrics for monitoring the relations and schema in a cluster.
Use this dashboard to:
- Monitor PostgreSQL relation and schema metrics trends over time.
- Monitor sequential scans and index scans and determine if executed queries are accessing them.
- Monitor the size of tables, and query operations which will determine the performance of your queries.
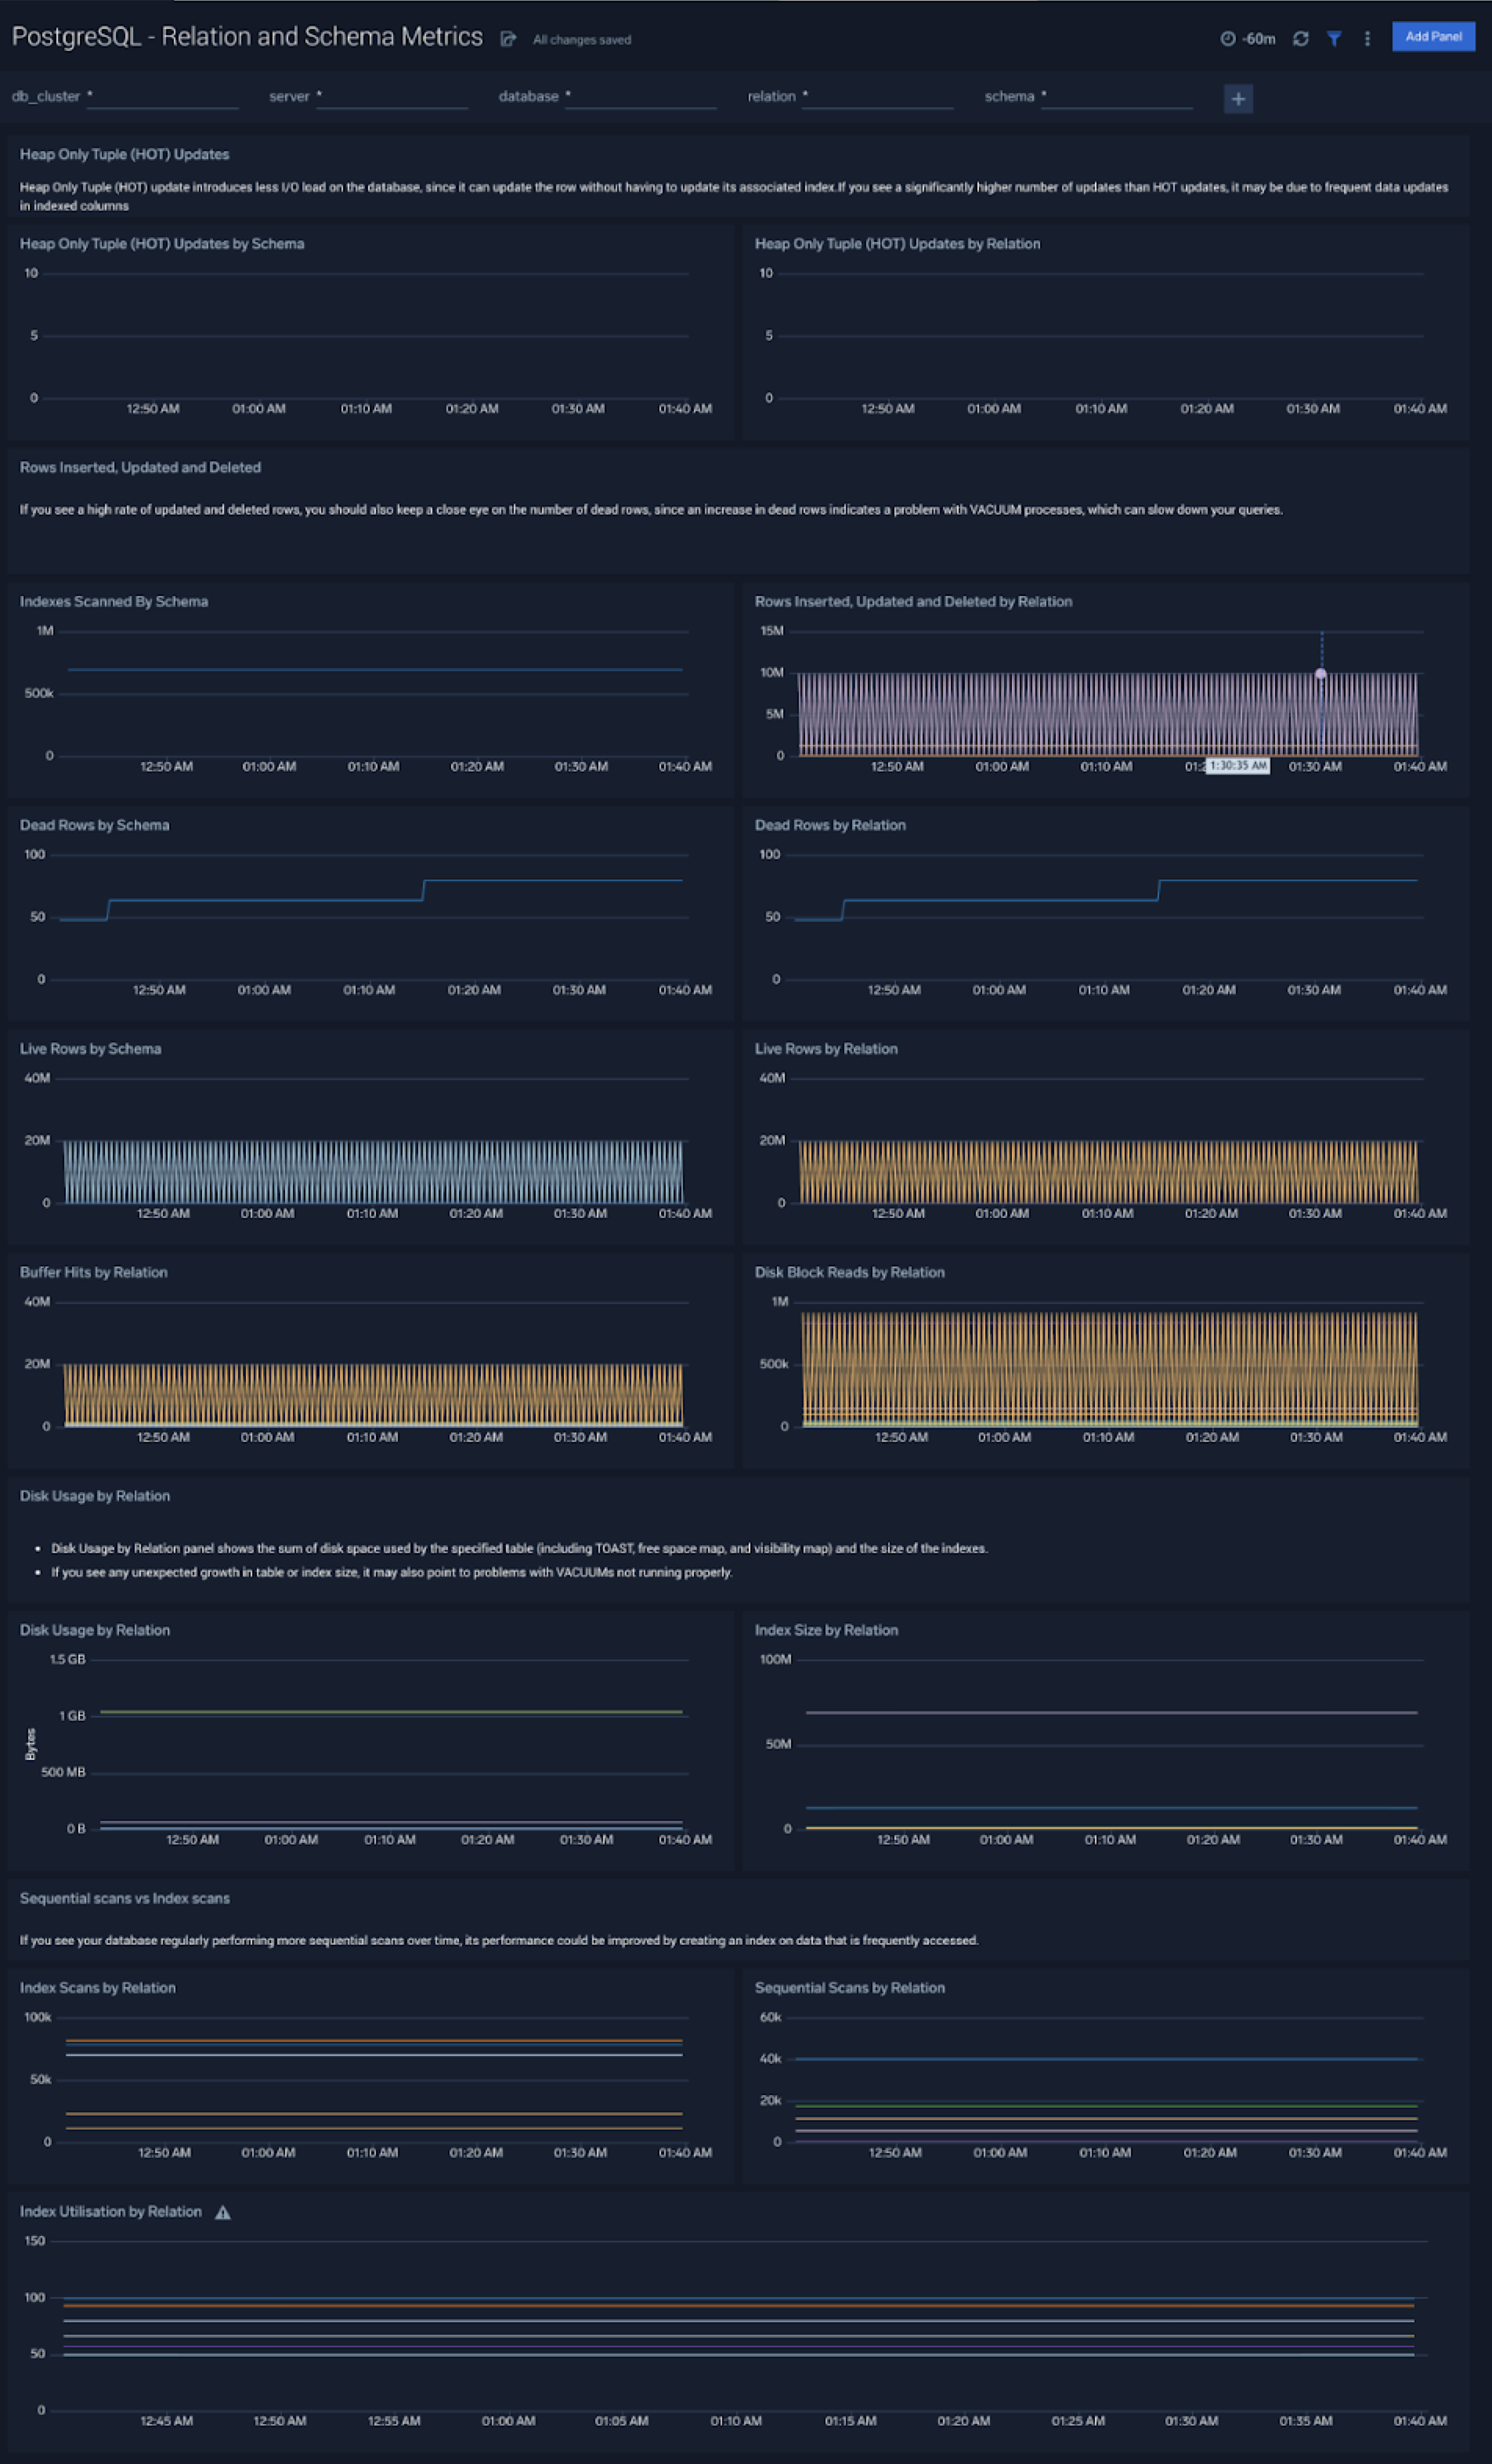
Query performance can degrade with growth in size of table, database and/or indexes. This means that you either need to scale up the database instance, partition your data, or redesign your indexes. Unusual growth in disk space can also mean there are problems with VACUUMs .
If your database regularly performs more sequential scans over time, you can improve its performance by creating an index on frequently accessed data.
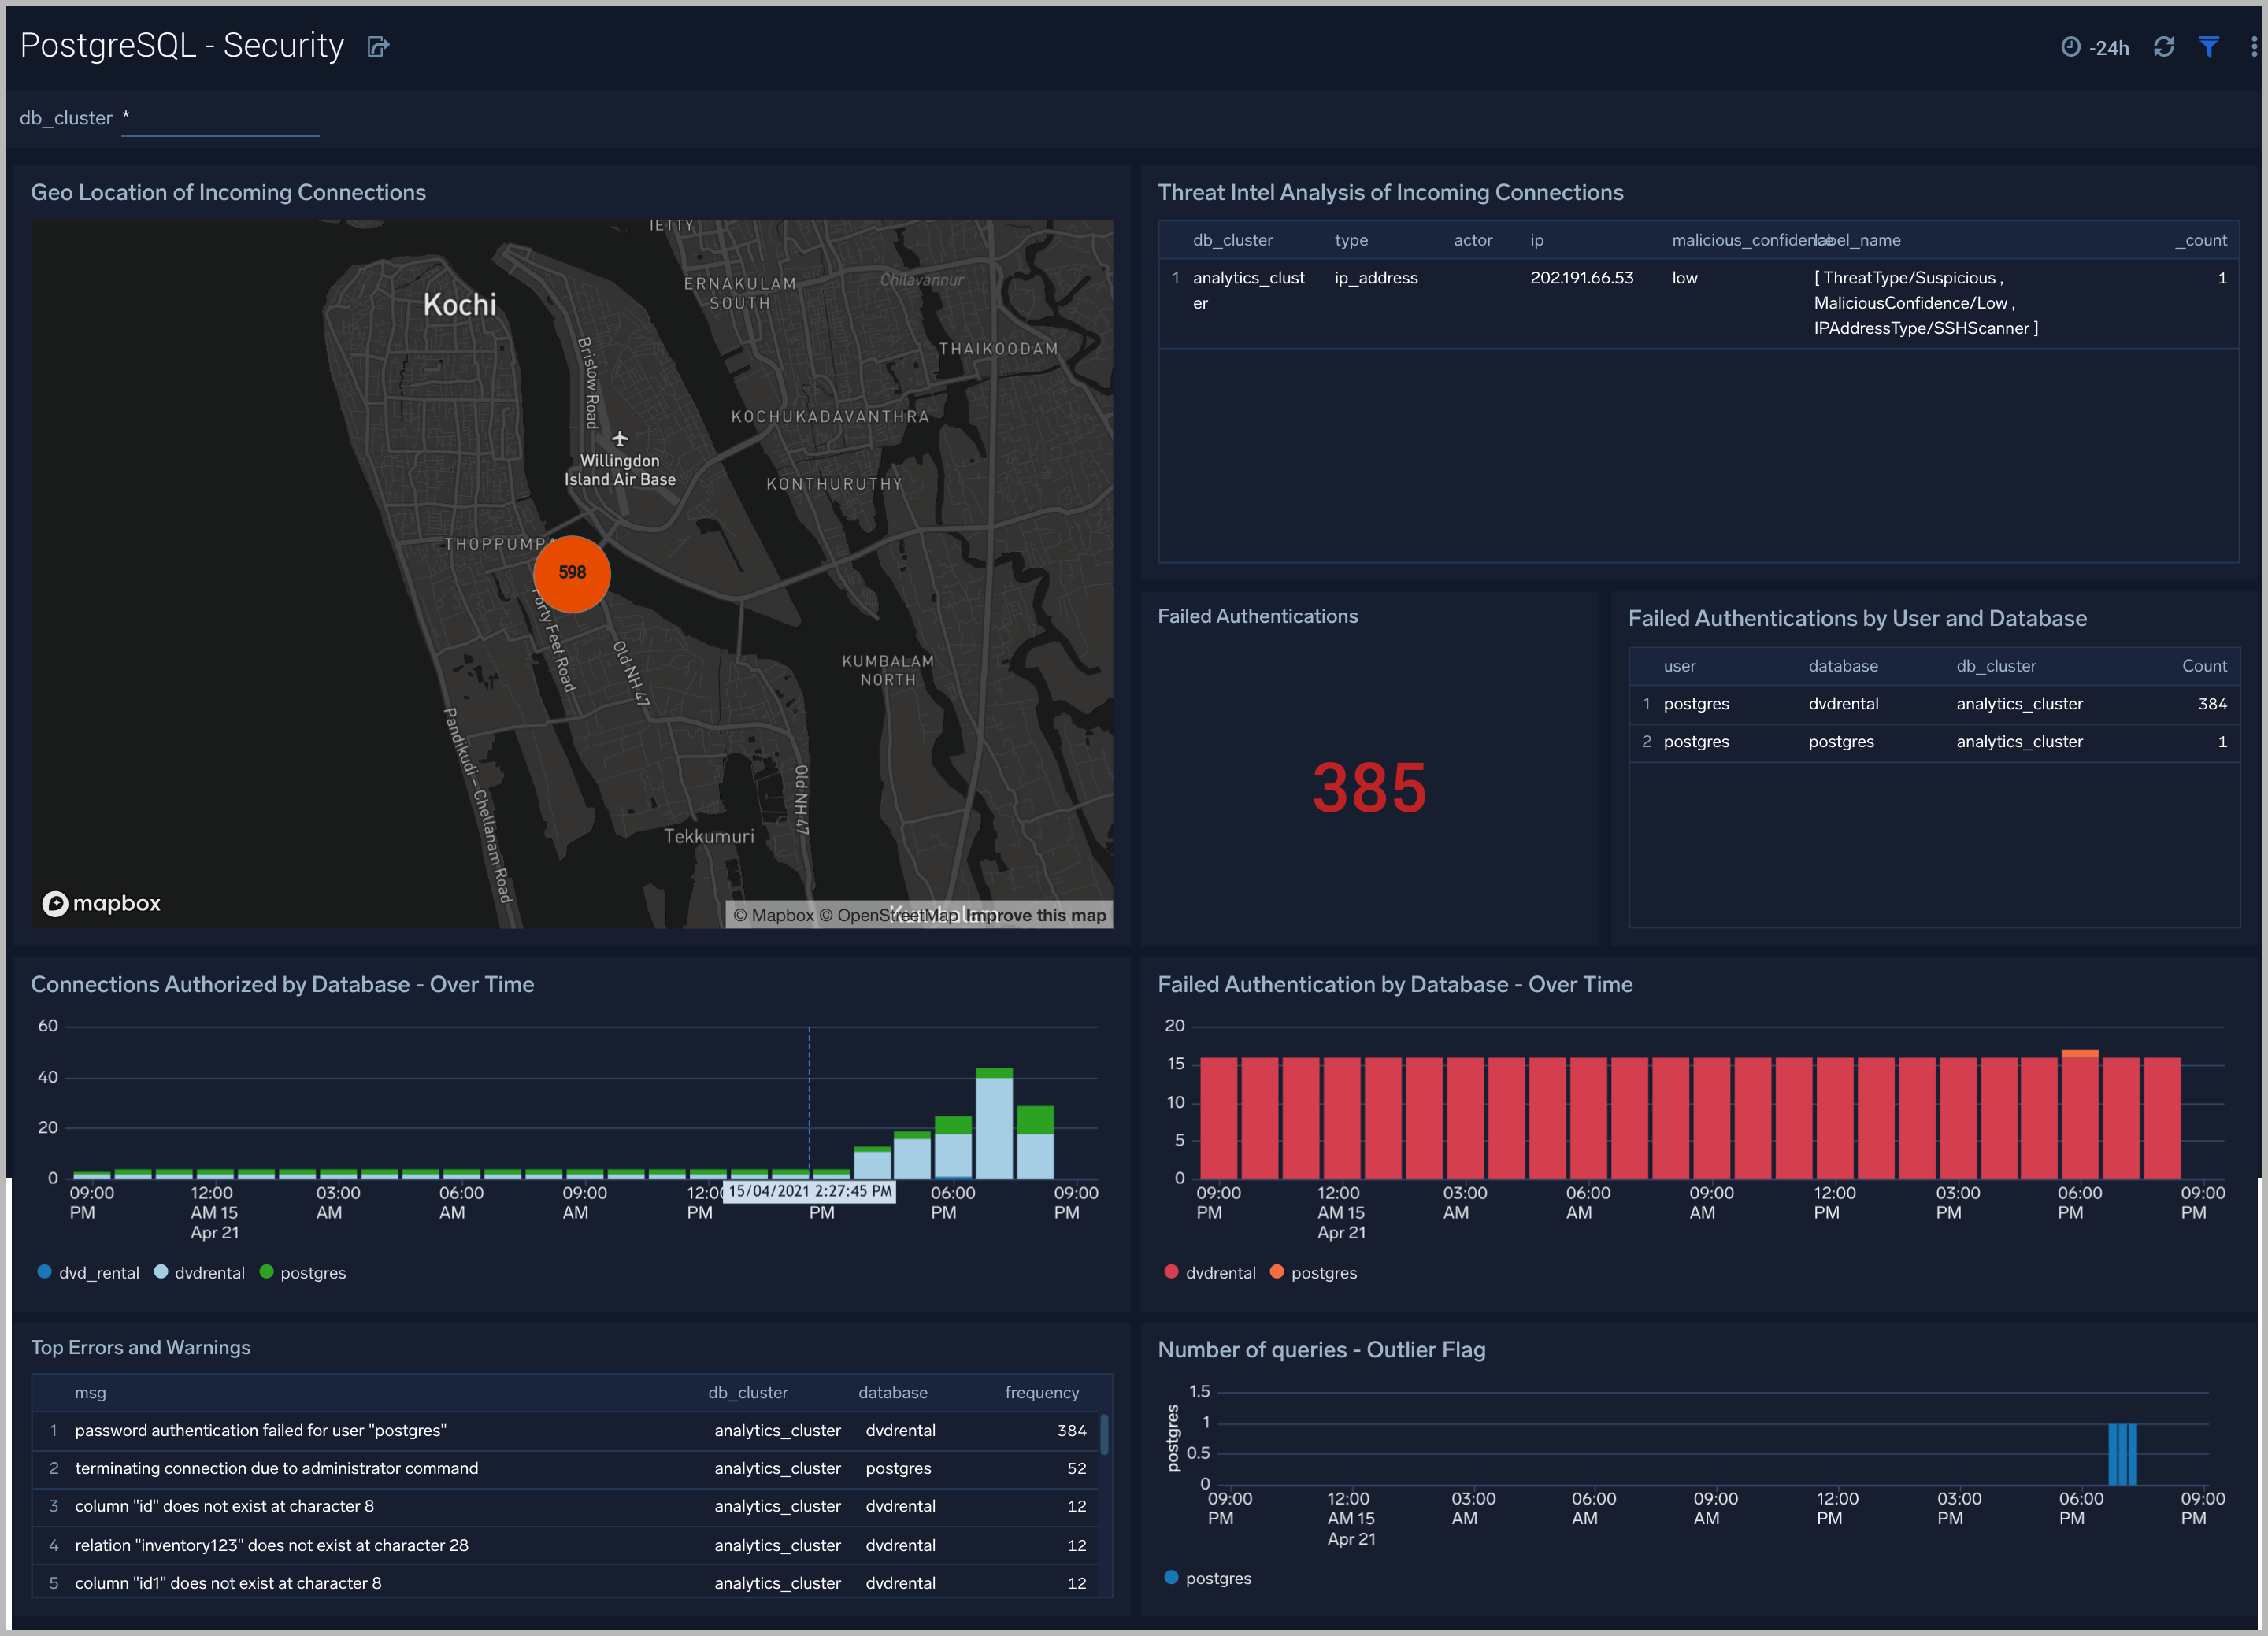
Security
The PostgreSQL - Security dashboard provides insight into locations of incoming connections, failed authentications and top database errors and warnings.
Use this dashboard to:
- Monitor incoming connections, failed authorization requests, and outliers in the number of queries executed outlier.
- Identify known malicious IPs that are accessing your databases and use firewall access control lists to prevent them from sending you traffic going forward.
Error Logs
The PostgreSQL - Error Logs dashboard provides insight into database error logs by specifically monitoring errors, user activity, database activity and database shutdown/start events.
Use this dashboard to:
- Quickly identify errors and patterns in logs for troubleshooting.
- Monitor error trends and quickly identify outliers.
- Identify unexpected database or user activity.

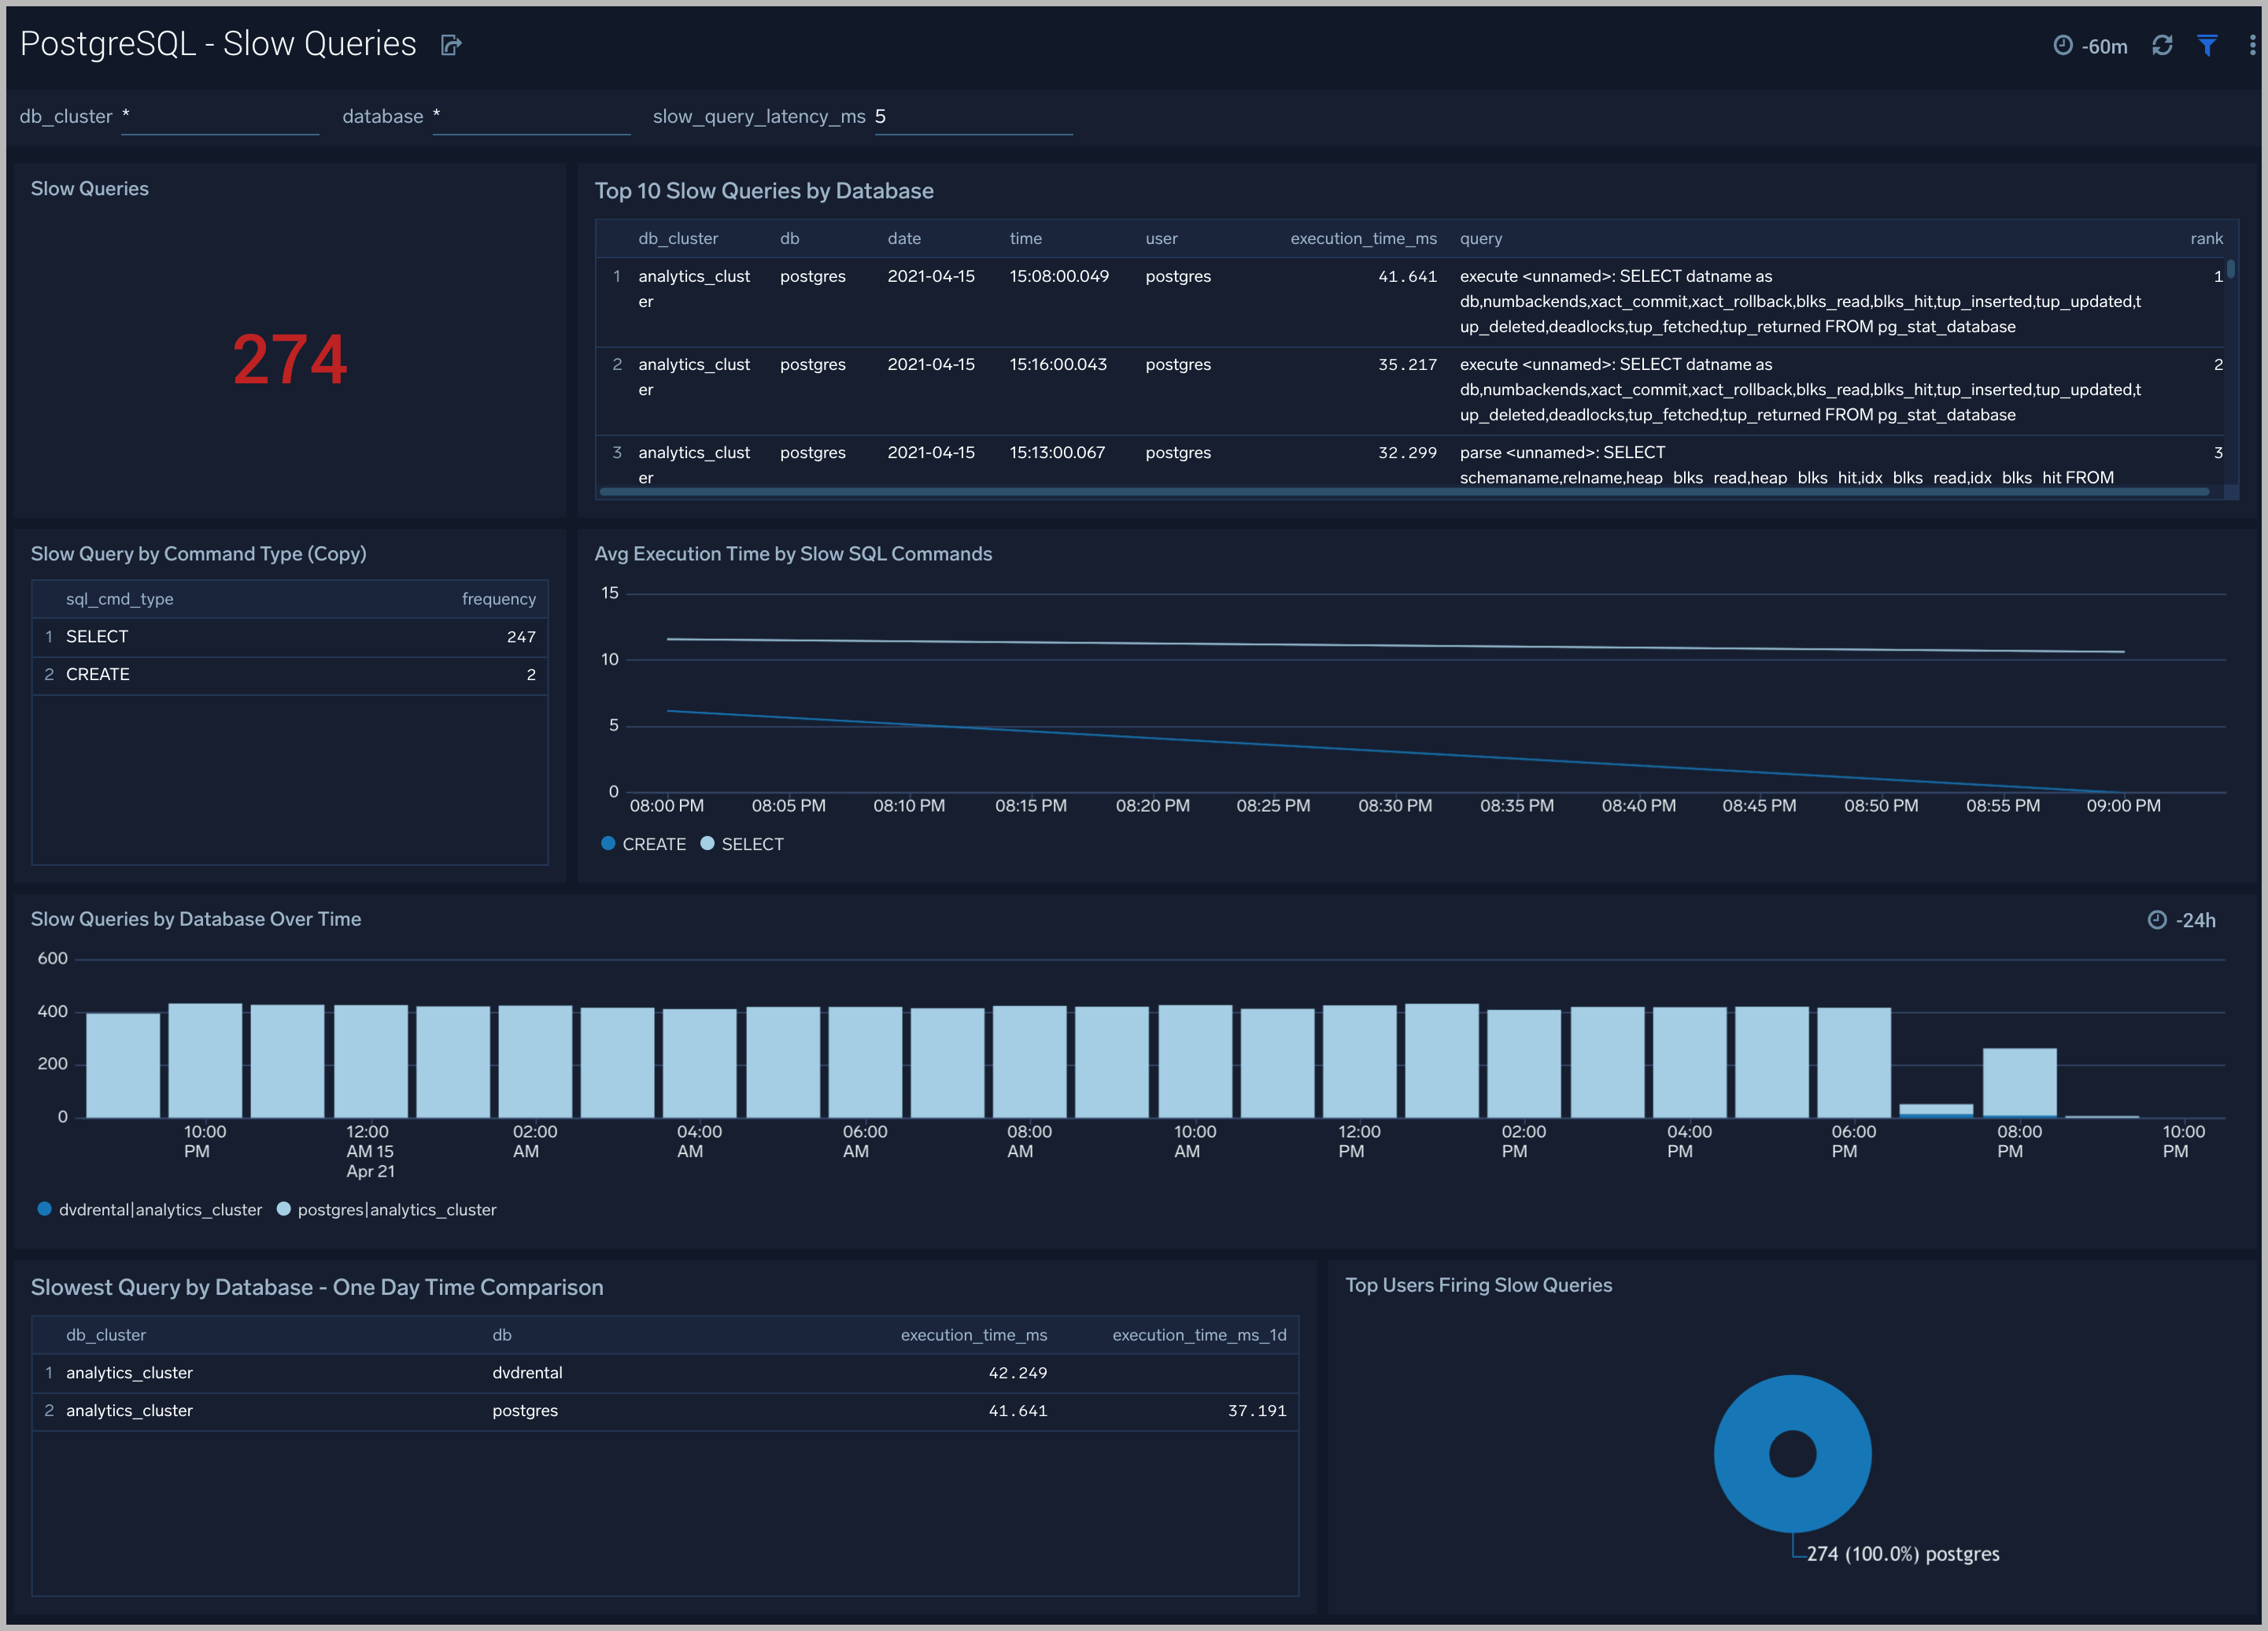
Slow Queries
The PostgreSQL - Slow Queries dashboard provides insights into all slow queries executed on the database.
Use this dashboard to:
- Identify all slow queries
- Monitor users and databases running slow queries.
- Determine which SQL commands are slower than others.
- Examine slow query trends to determine if there are periodic performance bottlenecks in your database clusters.
Relation Metrics
The PostgreSQL - Relation Metrics dashboard allows you to view and analyze the metrics for monitoring the relations in a schema.
Use this dashboard to:
- Monitor PostgreSQL relation metrics (disk blocks, buffer hits, hot updates etc) trends over time.
- Monitor sequential scans and index scans and determine if executed queries are accessing them for a relation.
- Track index utilization of existing indexes in a relation.
Create monitors for PostgreSQL app
From your App Catalog:
- From the Sumo Logic navigation, select App Catalog.
- In the Search Apps field, search for and then select your app.
- Make sure the app is installed.
- Navigate to What's Included tab and scroll down to the Monitors section.
- Click Create next to the pre-configured monitors. In the create monitors window, adjust the trigger conditions and notifications settings based on your requirements.
- Scroll down to Monitor Details.
- Under Location click on New Folder.
note
By default, monitor will be saved in the root folder. So to make the maintenance easier, create a new folder in the location of your choice.
- Enter Folder Name. Folder Description is optional.
tip
Using app version in the folder name will be helpful to determine the versioning for future updates.
- Click Create. Once the folder is created, click on Save.
PostgreSQL Alerts
| Alert Name | Alert Description and conditions | Alert Condition | Recover Condition |
|---|---|---|---|
| PostgreSQL - Instance Down | This alert fires when the Postgres instance is down | >= 1 | < 1 |
| PostgreSQL - TooManyConnections | This alert fires when we detect that a PostgreSQL instance has too many (90% of allowed) connections) | >= 90 | < 90 |
| PostgreSQL - SlowQueries | This alert fires when we detect that the PostgreSQL instance is executing slow queries | >= 1 | < 1 |
| PostgreSQL - Commit Rate Low | This alert fires when we detect that Postgres seems to be processing very few transactions. | commit rate < 10 | commit rate >= 10 |
| PostgreSQL - High Rate of Statement Timeout | This alert fires when we detect Postgres transactions show a high rate of statement timeouts | timeout rate > 3 | timeout rate < 3 |
| PostgreSQL - High Rate Deadlock | This alert fires when we detect deadlocks in a Postgres instance | deadlock rate >= 1 | deadlock rate < 1 |
| PostgreSQL - High Replication Lag | This alert fires when we detect that the Postgres Replication lag (in bytes) is high. | > 1000000000 bytes | < 1000000000 bytes |
| PostgreSQL - SSL Compression Active | This alert fires when we detect database connections with SSL compression are enabled. This may add significant jitter in replication delay. Replicas should turn off SSL compression via sslcompression=0 in recovery.conf | > 0 | <= 0 |
| PostgreSQL - Too Many Locks Acquired | This alert fires when we detect that there are too many locks acquired on the database. If this alert happens frequently, you may need to increase the postgres setting max_locks_per_transaction. | > 20 percent of max allowed locks assuming default max connection = 100 and max_locks per transaction = 64 | < 20 percent of max allowed locks |
| PostgreSQL - Access from Highly Malicious Sources | This alert will fire when a Postgres instance is accessed from known malicious IP addresses. | > 0 | <= 0 |
PostgreSQL Metrics
Here are the metrics available for PostgreSQL (click to expand).
postgresql_numbackends
postgresql_xact_commit
postgresql_xact_rollback
postgresql_blks_read
postgresql_blks_hit
postgresql_tup_inserted
postgresql_tup_updated
postgresql_tup_deleted
postgresql_deadlocks
postgresql_tup_fetched
postgresql_tup_returned
postgresql_checkpoints_timed
postgresql_checkpoints_req
postgresql_buffers_checkpoint
postgresql_buffers_clean
postgresql_buffers_backend
postgresql_stat_ssl_compression_count
postgresql_replication_delay
postgresql_replication_lag
postgresql_replay_lag
postgresql_flush_lag
postgresql_write_lag
postgresql_db_size
postgresql_num_locks
postgresql_seq_scan
postgresql_seq_tup_read
postgresql_idx_scan
postgresql_idx_tup_fetch
postgresql_n_tup_ins
postgresql_n_tup_upd
postgresql_n_tup_del
postgresql_n_tup_hot_upd
postgresql_n_live_tup
postgresql_n_dead_tup
postgresql_idx_scan
postgresql_idx_tup_read
postgresql_idx_tup_fetch
postgresql_idx_blks_read
postgresql_idx_blks_hit
postgresql_heap_blks_read
postgresql_heap_blks_hit
postgresql_idx_blks_read
postgresql_idx_blks_hit
postgresql_index_size
postgresql_table_size