Redis - Classic Collector
Redis is an in-memory data structure implementing a distributed, in-memory key-value database with optional durability.
The Sumo Logic app for Redis helps you monitor the state of the database cluster. The preconfigured dashboards provide information about cluster status, resource usage, commands running, and cache hit rate. You can easily determine the health of the cluster by just a glance at the dashboards.
Log and Metrics types
This Sumo Logic app for Redis supports Metrics and Logs for Redis in Cluster or Standalone mode. The Redis logs are generated in files as configured in the cluster node configuration files in /etc/redis/redis.conf. For more details on Redis logs, click here.
The app supports metrics generated by the Redis plugin for Telegraf and assumes prometheus format metrics.
Sample log messages
- Kubernetes environments
- Non-Kubernetes environments
{
  "timestamp": 1615988485842,
  "log": "1:M 17 Mar 2021 13:41:19.103 * Synchronization with replica 100.96.3.30:6379 succeeded",
  "stream": "stdout",
  "time": "2021-03-17T13:41:19.103646109Z"
}
5275:S 17 Mar 2021 19:13:38.138 * MASTER <-> REPLICA sync: Finished with success
Sample queries
This sample Query is from the the Redis - Logs dashboard > Logs panel.
<Redis_DB_Cluster_Filter> component="database" and db_system="redis"
| json auto maxdepth 1 nodrop
| if (isEmpty(log), _raw, log) as message
| count by message
| limit 100
| fields message
Collecting logs and metrics for Redis
This section provides instructions for configuring log and metric collection for the Sumo Logic app for Redis. Configuring log and metric collection for the Redis ULM app includes the following tasks:
Configure Collection for Redis
Sumo Logic supports collection of logs and metrics data from Redis in both Kubernetes and non-Kubernetes environments. Click on the appropriate tab below based on the environment where your Redis clusters are hosted.
- Kubernetes environments
- Non-Kubernetes environments
In Kubernetes environments, we use the Telegraf Operator, which is packaged with our Kubernetes collection. You can learn more about it here.The diagram below illustrates how data is collected from Redis in Kubernetes environments. In the architecture shown below, there are four services that make up the metric collection pipeline: Telegraf, Telegraf Operator, Prometheus, and Sumo Logic Distribution for OpenTelemetry Collector.
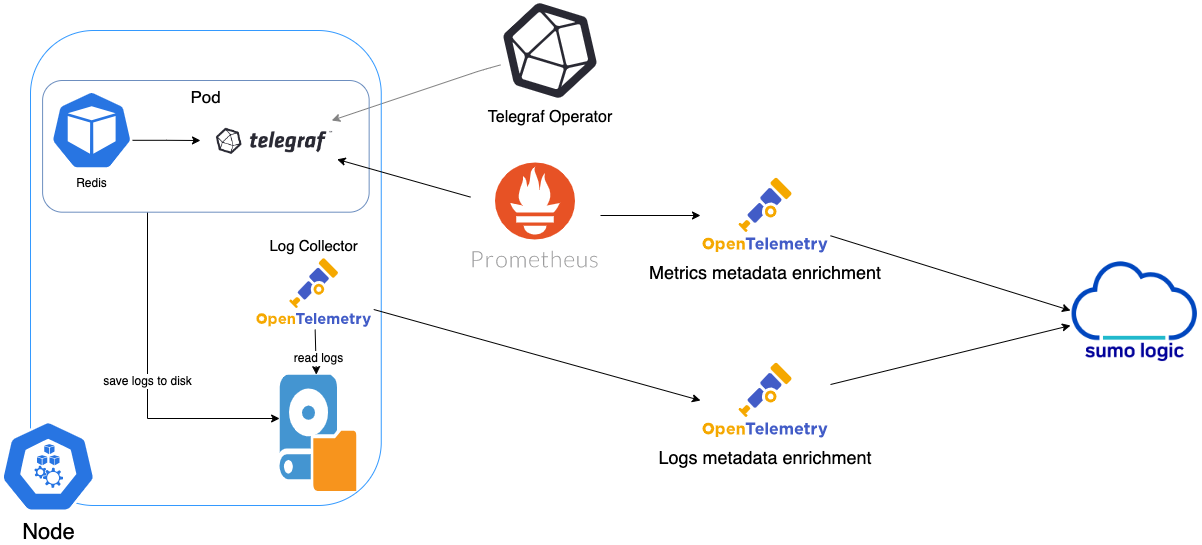
The first service in the metrics pipeline is Telegraf. Telegraf collects metrics from Redis. Note that we’re running Telegraf in each pod we want to collect metrics from as a sidecar deployment: that is, Telegraf runs in the same pod as the containers it monitors. Telegraf uses the Redis input plugin to obtain metrics. (For simplicity, the diagram doesn’t show the input plugins.) The injection of the Telegraf sidecar container is done by the Telegraf Operator. Prometheus pulls metrics from Telegraf and sends them to Sumo Logic Distribution for OpenTelemetry Collector which enriches metadata and sends metrics to Sumo Logic.
In the logs pipeline, Sumo Logic Distribution for OpenTelemetry Collector collects logs written to standard out and forwards them to another instance of Sumo Logic Distribution for OpenTelemetry Collector, which enriches metadata and sends logs to Sumo Logic.
Configure Metrics Collection
Ensure that you are monitoring your Kubernetes clusters with the Telegraf operator. If you are not, then follow these instructions to do so.
- To collect metrics from a Kubernetes environment, add the following annotations on your Redis pods:
 annotations:
    telegraf.influxdata.com/class: sumologic-prometheus
    prometheus.io/scrape: "true"
    prometheus.io/port: "9273"
    telegraf.influxdata.com/inputs: |+
    servers = ["tcp://:<username-CHANGEME>:<password-CHANGEME>@localhost:6379"]
  [inputs.redis.tags]
    environment: "ENV_TO_BE_CHANGED"
    component="database"
    db_system="redis"
    db_cluster: "ENV_TO_BE_CHANGED"
    db_cluster_address = "ENV_TO_BE_CHANGED"
    db_cluster_port = "ENV_TO_BE_CHANGED"
-
Enter in values for the following parameters (marked
ENV_TO_BE_CHANGEDin the snippet above):telegraf.influxdata.com/inputs. As telegraf will be run as a sidecar the host should always be localhost.- In the input plugins section i.e.:
servers. The URL to the Redis server. This can be a comma-separated list to connect to multiple Redis servers.
- In the tags section,
[inputs.redis.tags]:environment. This is the deployment environment where the Redis cluster identified by the value ofserversresides. For example: dev, prod or qa. While this value is optional we highly recommend setting it.db_cluster. Enter a name to identify this Redis cluster. This cluster name will be shown in the Sumo Logic dashboards.db_cluster_address. Enter the cluster hostname or ip address that is used by the application to connect to the database. It could also be the load balancer or proxy endpoint.db_cluster_port. Enter the database port. If not provided, a default port will be used.
- In the input plugins section i.e.:
notedb_cluster_addressanddb_cluster_portshould reflect the exact configuration of DB client configuration in your application, especially if you instrument it with OT tracing. The values of these fields should match exactly the connection string used by the database client (reported as values for net.peer.name and net.peer.port metadata fields).For example, if your application uses “redis-prod.sumologic.com:3306” as the connection string, the field values should be set as follows:
db_cluster_address=redis-prod.sumologic.com db_cluster_port=3306If your application connects directly to a given redis node, rather than the whole cluster, use the application connection string to override the value of the “host” field in the Telegraf configuration: host=redis-prod.sumologic.com
Pivoting to Tracing data from Entity Inspector is possible only for “Redis address” Entities.
- Do not modify the following values, as they will cause the Sumo Logic apps to not function correctly.
telegraf.influxdata.com/class: sumologic-prometheus. This instructs the Telegraf operator what output to use. This should not be changed.prometheus.io/scrape: "true". This ensures our Prometheus will scrape the metrics.prometheus.io/port: "9273". This tells prometheus what ports to scrape on. This should not be changed.telegraf.influxdata.com/inputs- In the tags section, that is
[inputs.redis.tags] component: "database". This value is used by Sumo Logic apps to identify application components.db_system: "redis". This value identifies the database system.
- In the tags section, that is
- See this doc for more parameters that can be configured in the Telegraf agent globally.
- For more information on configuring the Redis input plugin for Telegraf, see this doc.
-
Once this has been done, the Sumo Logic Kubernetes collection will automatically start collecting metrics from the pods having the labels and annotations defined in the previous step.
-
Verify metrics in Sumo Logic by running the following metrics query:
db_cluster=<Your_Redis_Cluster_Name> component="database" \
and db_system="redis"
Configure Logs Collection
This section explains the steps to collect Redis logs from a Kubernetes environment.
-
Collect Redis logs written to standard output. If your Redis helm chart/pod is writing the logs to standard output, then follow the steps listed below.
- Apply the following labels to your Redis pods:
environment: "ENV_TO_BE_CHANGED"
component: "database"
db_system: "redis"
db_cluster: "ENV_TO_BE_CHANGED"
db_cluster_address = "ENV_TO_BE_CHANGED"
db_cluster_port = "ENV_TO_BE_CHANGED"- Enter in values for the following parameters (marked
ENV_TO_BE_CHANGEDabove):environment. This is the deployment environment where the Redis cluster identified by the value of servers resides. For example: dev, prod or qa. While this value is optional we highly recommend setting it.db_cluster. Enter a name to identify this Redis cluster. This cluster name will be shown in the Sumo Logic dashboards.db_cluster_address. Enter the cluster hostname or ip address that is used by the application to connect to the database. It could also be the load balancer or proxy endpoint.db_cluster_port. Enter the database port. If not provided, a default port will be used.
notedb_cluster_addressanddb_cluster_portshould reflect the exact configuration of DB client configuration in your application, especially if you instrument it with OT tracing. The values of these fields should match exactly the connection string used by the database client (reported as values for the net.peer.name and net.peer.port metadata fields).For example, if your application uses “redis-prod.sumologic.com:3306” as the connection string, the field values should be set as follows:
db_cluster_address=redis-prod.sumologic.com db_cluster_port=3306If your application connects directly to a given Redis node, rather than the whole cluster, use the application connection string to override the value of the “host” field in the Telegraf configuration:
host=redis-prod.sumologic.comPivoting to Tracing data from Entity Inspector is possible only for “Redis address” Entities.
- Do not modify these values as they will cause the Sumo Logic apps to not function correctly.
component: “database”. This value is used by Sumo Logic apps to identify application components.db_system: “redis”. This value identifies the database system.
- For all other parameters, see this doc for more parameters that can be configured in the Telegraf agent globally.
- The Sumologic-Kubernetes-Collection will automatically capture the logs from stdout and will send the logs to Sumologic. For more information on deploying Sumologic-Kubernetes-Collection, see this page.
-
Collect Redis logs written to log files (Optional). If your Redis helm chart/pod is writing its logs to log files, you can use a sidecar to send log files to standard out. To do this:
- Determine the location of the Redis log file on Kubernetes. This can be determined from the redis.conf for your Redis cluster along with the mounts on the Redis pods.
- Install the Sumo Logic tailing sidecar operator.
- Add the following annotation in addition to the existing annotations.
annotations:
  tailing-sidecar: sidecarconfig;<mount>:<path_of_redis_log_file>/<redis_log_file_name>
Example:
annotations:
tailing-sidecar: sidecarconfig;data:/redis-master-data/redis.log- Make sure that the Redis pods are running and annotations are applied by using the command:
kubectl describe pod <redis_pod_name>- Sumo Logic Kubernetes collection will automatically start collecting logs from the pods having the annotations defined above.
FER to normalize the fields in Kubernetes environments. Labels created in Kubernetes environments automatically are prefixed with pod_labels. To normalize these for our app to work, a Field Extraction Rule named AppObservabilityRedisDatabaseFER is automatically created for Database Application Components.
For Non-Kubernetes environments, we use the Telegraf Operator for Redis metric collection and Sumo Logic Installed Collector for collecting Redis logs. The diagram below illustrates the components of the Redis collection in a non-Kubernetes environment. Telegraf runs on the same system as Redis, and uses the Redis input plugin to obtain Redis metrics, and the Sumo Logic output plugin to send the metrics to Sumo Logic. Logs from Redis on the other hand are sent to either a Sumo Logic Local File or Syslog source.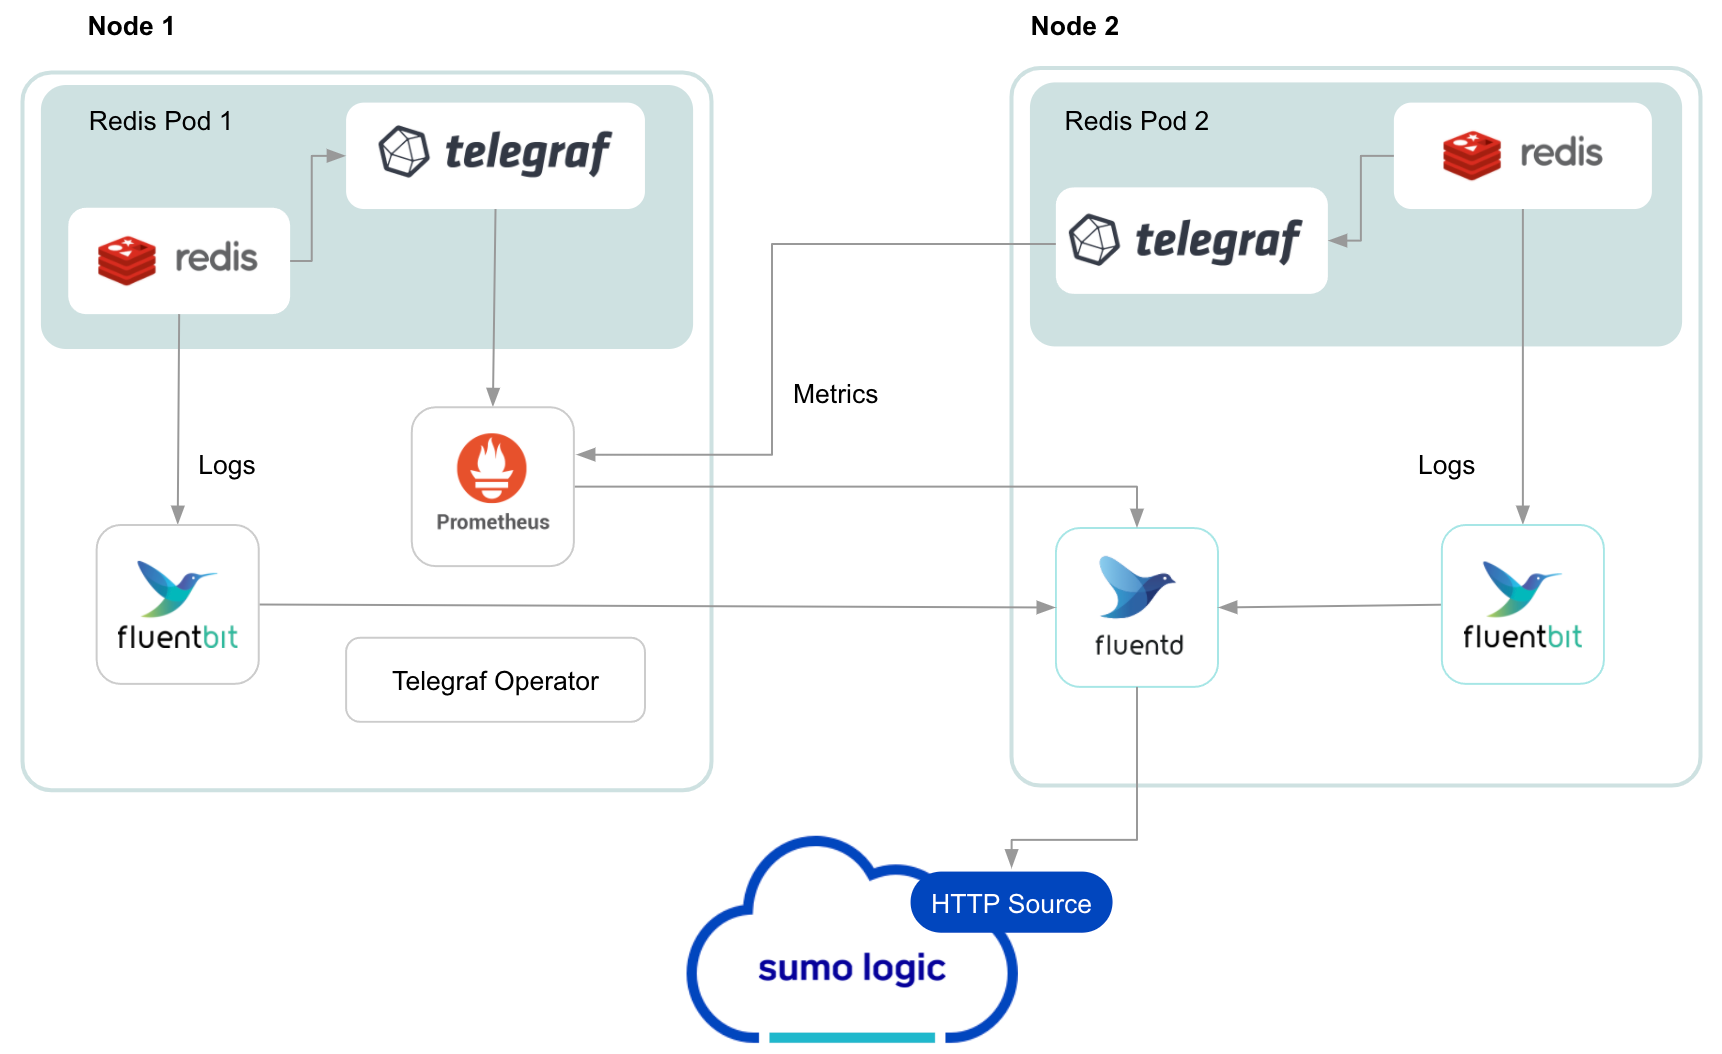
This section provides instructions for configuring metrics collection for the Sumo Logic app for Redis. Follow the instructions below to set up metrics and logs collection for a given Redis cluster:
Configure Metrics Collection
- Configure a Hosted Collector. To create a new Sumo Logic hosted collector, perform the steps in the Configure a Hosted Collector section of the Sumo Logic documentation.
- Configure an HTTP Logs and Metrics Source. Create a new HTTP Logs and Metrics Source in the hosted collector created above by following these instructions. Make a note of the HTTP Source URL.
- Install Telegraf. Follow the steps in this document Use the in this document following steps to install Telegraf.
- Configure and start Telegraf. As part of collecting metrics data from Telegraf, we will use the Redis input plugin to get data from Telegraf and the Sumo Logic output plugin to send data to Sumo Logic.
- Create or modify the telegraf.conf file and copy and paste the text below:
[[inputs.redis]]
  servers = ["tcp://localhost:6379"]
  namepass = ["redis"]
  fieldpass = ["blocked_clients", "clients", "cluster_enabled", "cmdstat_calls", "connected_slaves", "evicted_keys", "expired_keys", "instantaneous_ops_per_sec", "keyspace_hitrate", "keyspace_hits", "keyspace_misses", "master_repl_offset", "maxmemory", "mem_fragmentation_bytes", "mem_fragmentation_ratio", "rdb_changes_since_last_save", "rejected_connections", "slave_repl_offset", "total_commands_processed", "total_net_input_bytes", "total_net_output_bytes", "tracking_total_keys", "uptime", "used_cpu_sys", "used_cpu_user", "used_memory", "used_memory_overhead", "used_memory_rss", "used_memory_startup"]
  [inputs.redis.tags]
  environment = "ENV_TO_BE_CHANGED"
  component ="database"
  db_system ="redis"
  db_cluster: "ENV_TO_BE_CHANGED"
  db_cluster_address = "ENV_TO_BE_CHANGED"
  db_cluster_port = "ENV_TO_BE_CHANGED"
[[outputs.sumologic]]
  url = "<URL Created in Step 3>"
data_format = "prometheus"- Enter values for the following parameters (marked ENV_TO_BE_CHANGED above):
- For the input plugins section:
servers. The URL to the Redis server. This can be a comma-separated list to connect to multiple Redis servers. Please see this doc for more information on additional parameters for configuring the Redis input plugin for Telegraf.
- For tags section (
[inputs.redis.tags]):environment. This is the deployment environment where the Redis cluster identified by the value of servers resides. For example: dev, prod or qa. While this value is optional we highly recommend setting it.db_cluster. Enter a name to identify this Redis cluster. This cluster name will be shown in the Sumo Logic dashboards.db_cluster_address. Enter the cluster hostname or ip address that is used by the application to connect to the database. It could also be the load balancer or proxy endpoint.db_cluster_port. Enter the database port. If not provided, a default port will be used.
db_cluster_address and db_cluster_port should reflect the exact configuration of DB client configuration in your application, especially if you instrument it with OT tracing. The values of these fields should match exactly the connection string used by the database client (reported as values for net.peer.name and net.peer.port metadata fields).
For example, if your application uses “redis-prod.sumologic.com:3306” as the connection string, the field values should be set as follows: db_cluster_address=redis-prod.sumologic.com db_cluster_port=3306
If your application connects directly to a given Redis node, rather than the whole cluster, use the application connection string to override the value of the “host” field in the Telegraf configuration: host=redis-prod.sumologic.com
Pivoting to Tracing data from Entity Inspector is possible only for “Redis address” Entities.
- For output plugins section:
url. This is the HTTP source URL created in step 3. See this doc for more information on additional parameters for configuring the Sumo Logic Telegraf output plugin.
- Do not modify these values, as they will cause the Sumo Logic apps to not function correctly.
data_format - “prometheus”In the output plugins section, for which Metrics are sent in the Prometheus format to Sumo Logic.db_system: “redis”. In the input plugins section: This value identifies the database system.component: “database”. In the input plugins section: This value identifies application components.
- See this doc for more parameters that can be configured in the Telegraf agent globally. Once you have finalized your telegraf.conf file, you can start or reload the telegraf service using instructions from their doc.
At this point, Redis metrics should start flowing into Sumo Logic.
Configure Redis Logs Collection
This section provides instructions for configuring log collection for Redis running on a non-Kubernetes environment for the Sumo Logic app for Redis. By default, Redis logs are stored in a log file. Redis also supports forwarding of logs via Syslog.
Sumo Logic supports collecting logs both via Syslog and a local log file. Utilizing Sumo Logic Cloud Syslog will require TCP TLS Port 6514 to be open in your network. Local log files can be collected via Sumo Logic Installed collectors which requires you to allow outbound traffic to Sumo Logic endpoints for collection to work.
Follow the instructions to set up log collection:
- Configure logging in Redis. Redis supports logging via following methods: syslog, local text log files and stdout. Redis logs have four levels of verbosity. All logging settings are located in redis.conf. To select a level, set
loglevelto one of:- debug - This level produces a lot of information, which could be useful in development/testing environments)
- verbose - This level includes information not often needed, but logs less than debug)
- notice (moderately verbose, ideal for production environments) - this is the default value
- warning (only very important / critical messages are logged)
- Configure Redis to log to a local file or syslog. As part of this step, you will make a decision on how to export Redis logs and then accordingly configure your Redis cluster.
Option A: Configure Redis logs to go to log files
With this option, Redis logs written to a log file can be collected via the Local File Source of a Sumo Logic Installed collector.
To configure the Redis log file, locate your local redis.conf configuration file in the database directory. By default, Redis logs are stored in /var/log/redis/redis-server.log.
After determining the location of conf file modify the redis.conf configuration file logging parameters:
- Open redis.conf configuration file in a text editor.
- Set the following config parameters:
- Specify the server verbosity level. This can be one of:
- debug (a lot of information, useful for development/testing)
- verbose (many rarely useful info, but not a mess like the debug level)
- notice (moderately verbose, what you want in production probably)
- warning (only very important / critical messages are logged) loglevel notice
- Specify the log file name. Also the empty string can be used to force Redis to log on the standard output. Note that if you use standard output for logging but daemonize, logs will be sent to /dev/null logfile
""
- Specify the server verbosity level. This can be one of:
- Save the redis.conf file and restart the redis server:
sudo service redis-server restart
Option B: Configure Redis logs to stream data to a Syslog source
With this option, Redis logs can be streamed to the Syslog Source of a Sumo Logic Installed Collector.
To configure the Redis syslog, locate your local redis.conf configuration file in the database directory.
After determining the location of conf file, modify the redis.conf configuration file logging parameters
- Open redis.conf configuration file in a text editor.
- Set the following config parameters:
- To enable logging to the system logger, just set 'syslog-enabled' to yes, and optionally update the other syslog parameters to suit your needs.
syslog-enabled no- Specify the syslog identity.
syslog-ident redis- Specify the syslog facility. Must be USER or between LOCAL0-LOCAL7.
syslog-facility local0 - Save the redis.conf file and restart the redis server:
sudo service redis-server restart - At this point, Redis will start pushing the logs to the local syslog server.
- Configure an Installed Collector. To add an Installed collector, perform the steps as defined on the page Configure an Installed Collector.
- Configure a Source. To add a Local File Source source for Redis, do the following:
-
Add a Local File Source in the installed collector configured in the previous step.
-
Configure the Local File Source fields as follows:
- Name. (Required)
- Description. (Optional)
- File Path (Required). Enter the path to your error.log or access.log. The files are typically located in /var/log/redis/redis-server.log. If you're using a customized path, check the redis.conf file for this information.
- Source Host. Sumo Logic uses the hostname assigned by the OS unless you enter a different host name
- Source Category. Enter any string to tag the output collected from this Source, such as Redis/Logs. The Source Category metadata field is a fundamental building block to organize and label Sources. For details, see Best Practices.
-
Fields. Set the following fields. For more information on fields, see Sumo Logic Fields:
component = databasedb_system = redisdb_cluster = <Your_Redis_Cluster_Name>environment = <Environment_Name>, such as Dev, QA or Prod.db_cluster_address. Enter the cluster hostname or ip address that is used by the application to connect to the database. It could also be the load balancer or proxy endpoint.db_cluster_port. Enter the database port. If not provided, a default port will be used.
notedb_cluster_addressanddb_cluster_portshould reflect the exact configuration of DB client configuration in your application, especially if you instrument it with OT tracing. The values of these fields should match exactly the connection string used by the database client (reported as values fornet.peer.nameandnet.peer.portmetadata fields). For example, if your application uses“redis-prod.sumologic.com:3306”as the connection string, the field values should be set as follows:db_cluster_address=redis-prod.sumologic.com db_cluster_port=3306. If your application connects directly to a given Redis node, rather than the whole cluster, use the application connection string to override the value of the “host” field in the Telegraf configuration:host=redis-prod.sumologic.comPivoting to Tracing data from Entity Inspector is possible only for “Redis address” Entities.
-
Configure the Advanced section:
- Enable Timestamp Parsing. Select Extract timestamp information from log file entries.
- Time Zone. Choose the option, Ignore time zone from log file and instead use, and then select your Redis Server’s time zone.
- Timestamp Format. The timestamp format is automatically detected.
- Encoding. Select UTF-8 (Default).
- Enable Multiline Processing. Detect messages spanning multiple lines. Select Infer Boundaries - Detect message boundaries automatically.
-
Click Save.
-
- Verify logs are flowing into Sumo Logic by running the following logs query:
db_cluster=<Your_Redis_cluster_Name> component="database" and db_system="redis"
Installing the Redis app
To install the app, do the following:
Next-Gen App: To install or update the app, you must be an account administrator or a user with Manage Apps, Manage Monitors, Manage Fields, Manage Metric Rules, and Manage Collectors capabilities depending upon the different content types part of the app.
- Select App Catalog.
- In the 🔎 Search Apps field, run a search for your desired app, then select it.
- Click Install App.
note
Sometimes this button says Add Integration.
- Click Next in the Setup Data section.
- In the Configure section of your respective app, complete the following fields.
- Is K8S deployment involved. Specify if resources being monitored are partially or fully deployed on Kubernetes (K8s)
- Click Next. You will be redirected to the Preview & Done section.
Post-installation
Once your app is installed, it will appear in your Installed Apps folder, and dashboard panels will start to fill automatically.
Each panel slowly fills with data matching the time range query received since the panel was created. Results will not immediately be available but will be updated with full graphs and charts over time.
As part of the app installation process, the following fields will be created by default:
componentenvironmentdb_systemdb_clusterdb_cluster_addressdb_cluster_port
Additionally, if you are using Redis in the Kubernetes environment, the following additional fields will be created by default during the app installation process:
pod_labels_componentpod_labels_environmentpod_labels_db_systempod_labels_db_clusterpod_labels_db_cluster_addresspod_labels_db_cluster_port
For information on setting up fields, see Fields.
Viewing Redis dashboards
All dashboards have a set of filters that you can apply to the entire dashboard. Use these filters to drill down and examine the data to a granular level.
- You can change the time range for a dashboard or panel by selecting a predefined interval from a drop-down list, choosing a recently used time range, or specifying custom dates and times. Learn more.
- You can use template variables to drill down and examine the data on a granular level. For more information, see Filtering Dashboards with Template Variables.
- Most Next-Gen apps allow you to provide the scope at the installation time and are comprised of a key (
_sourceCategoryby default) and a default value for this key. Based on your input, the app dashboards will be parameterized with a dashboard variable, allowing you to change the dataset queried by all panels. This eliminates the need to create multiple copies of the same dashboard with different queries.
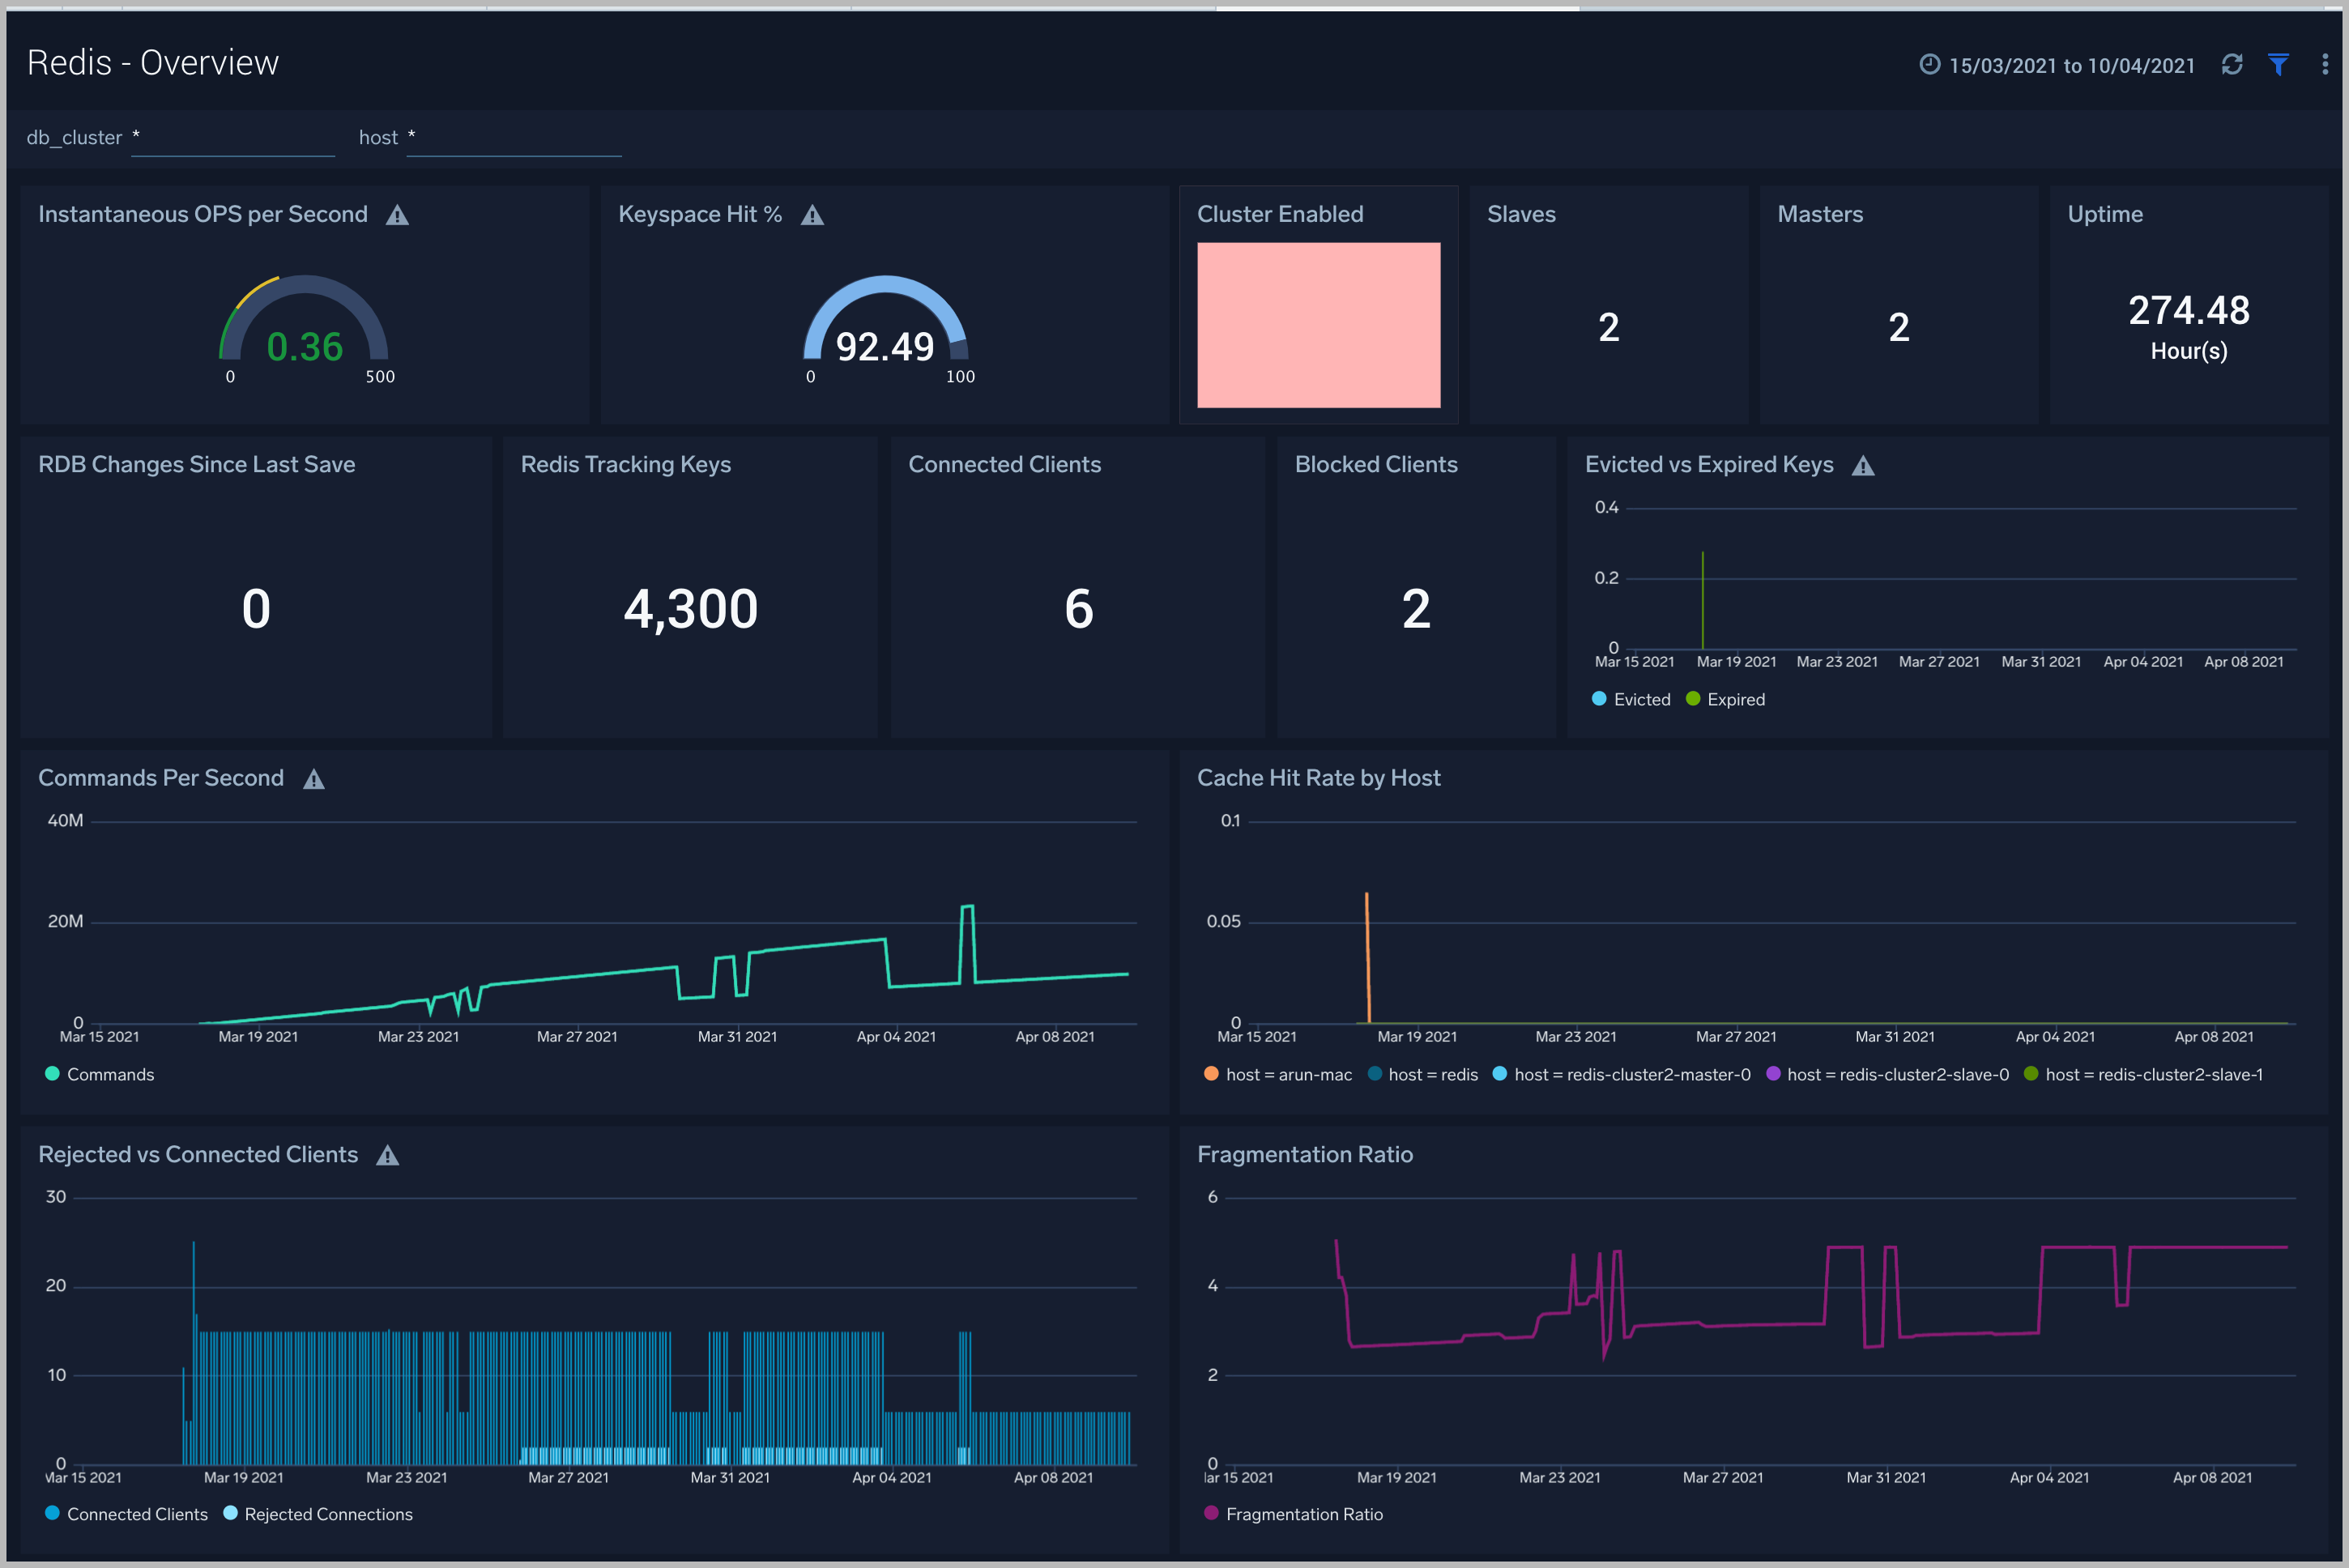
Overview
The Redis - Overview dashboard provides an at-a-glance view of the Redis server status, error logs along with database metrics.
Use this dashboard to:
- Gain insights into Redis cluster Master and Slave status.
- Gain insights into your Redis health using Cache Hit Rate, Fragmentation Ratio, and Slow Queries Log.
- Get insights into Active and rejected client connections.
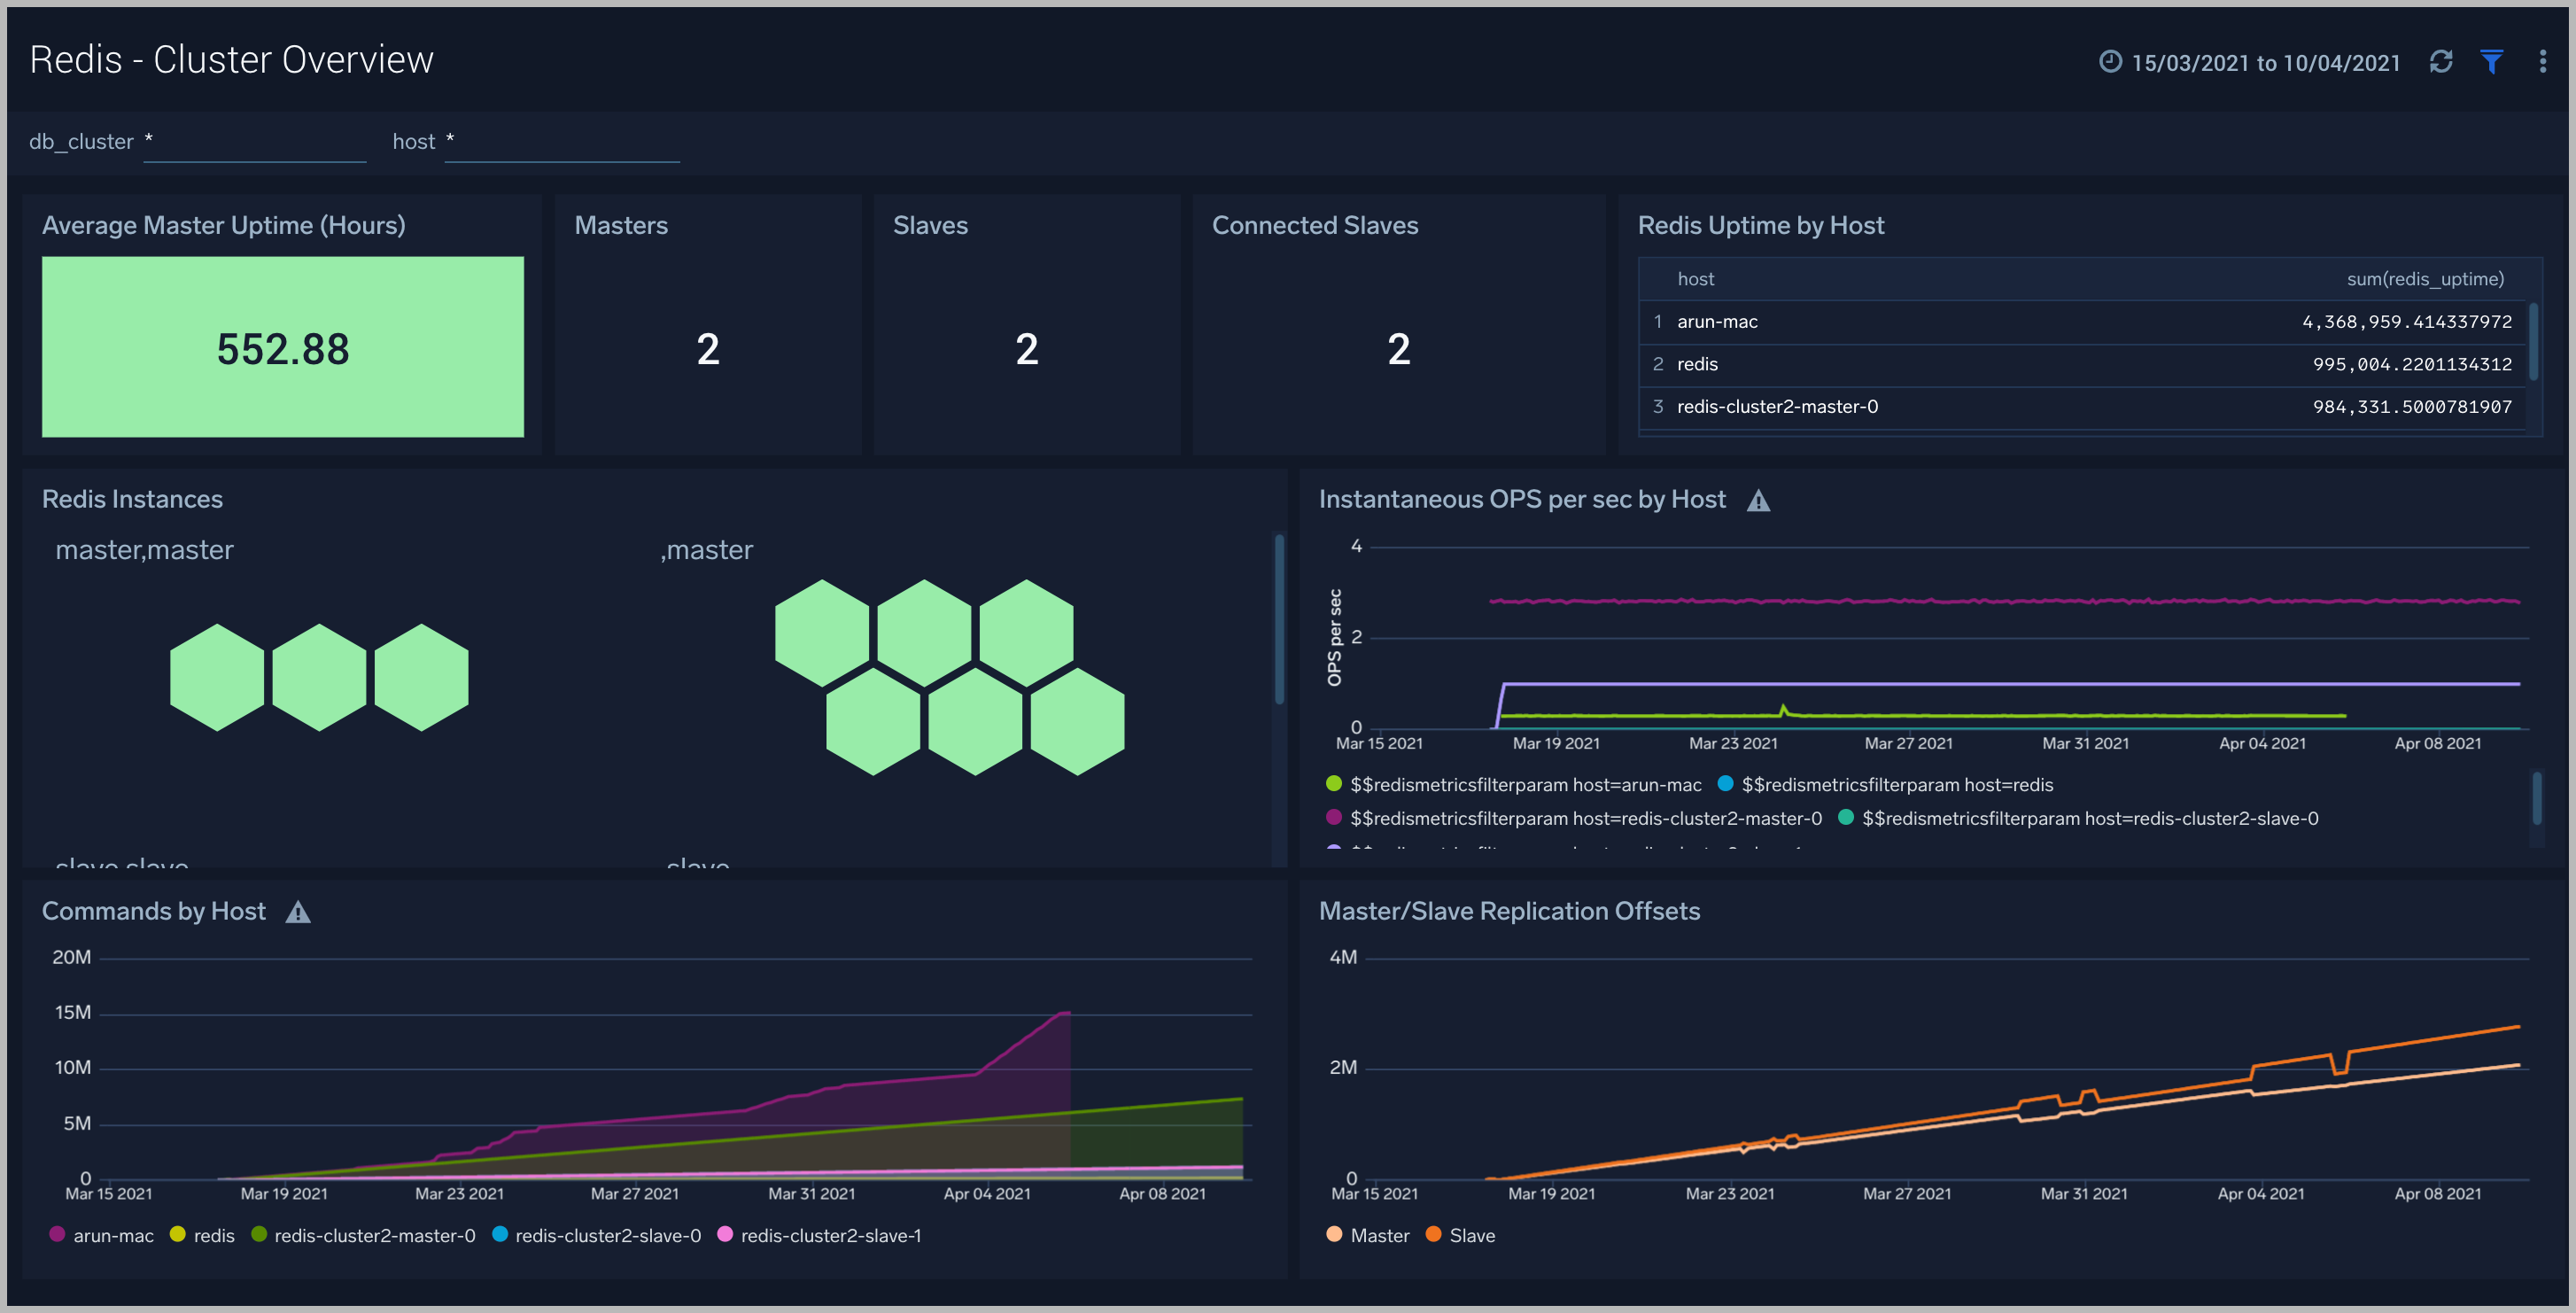
Cluster Overview
The Redis - Cluster Overview dashboard provides a high-level view of cluster infrastructure, comparisons, and trends.
Use this dashboard to:
- Review Cluster infrastructure.
- Manage Redis versions running on nodes.
- Understand Master and Slave replication offsets.
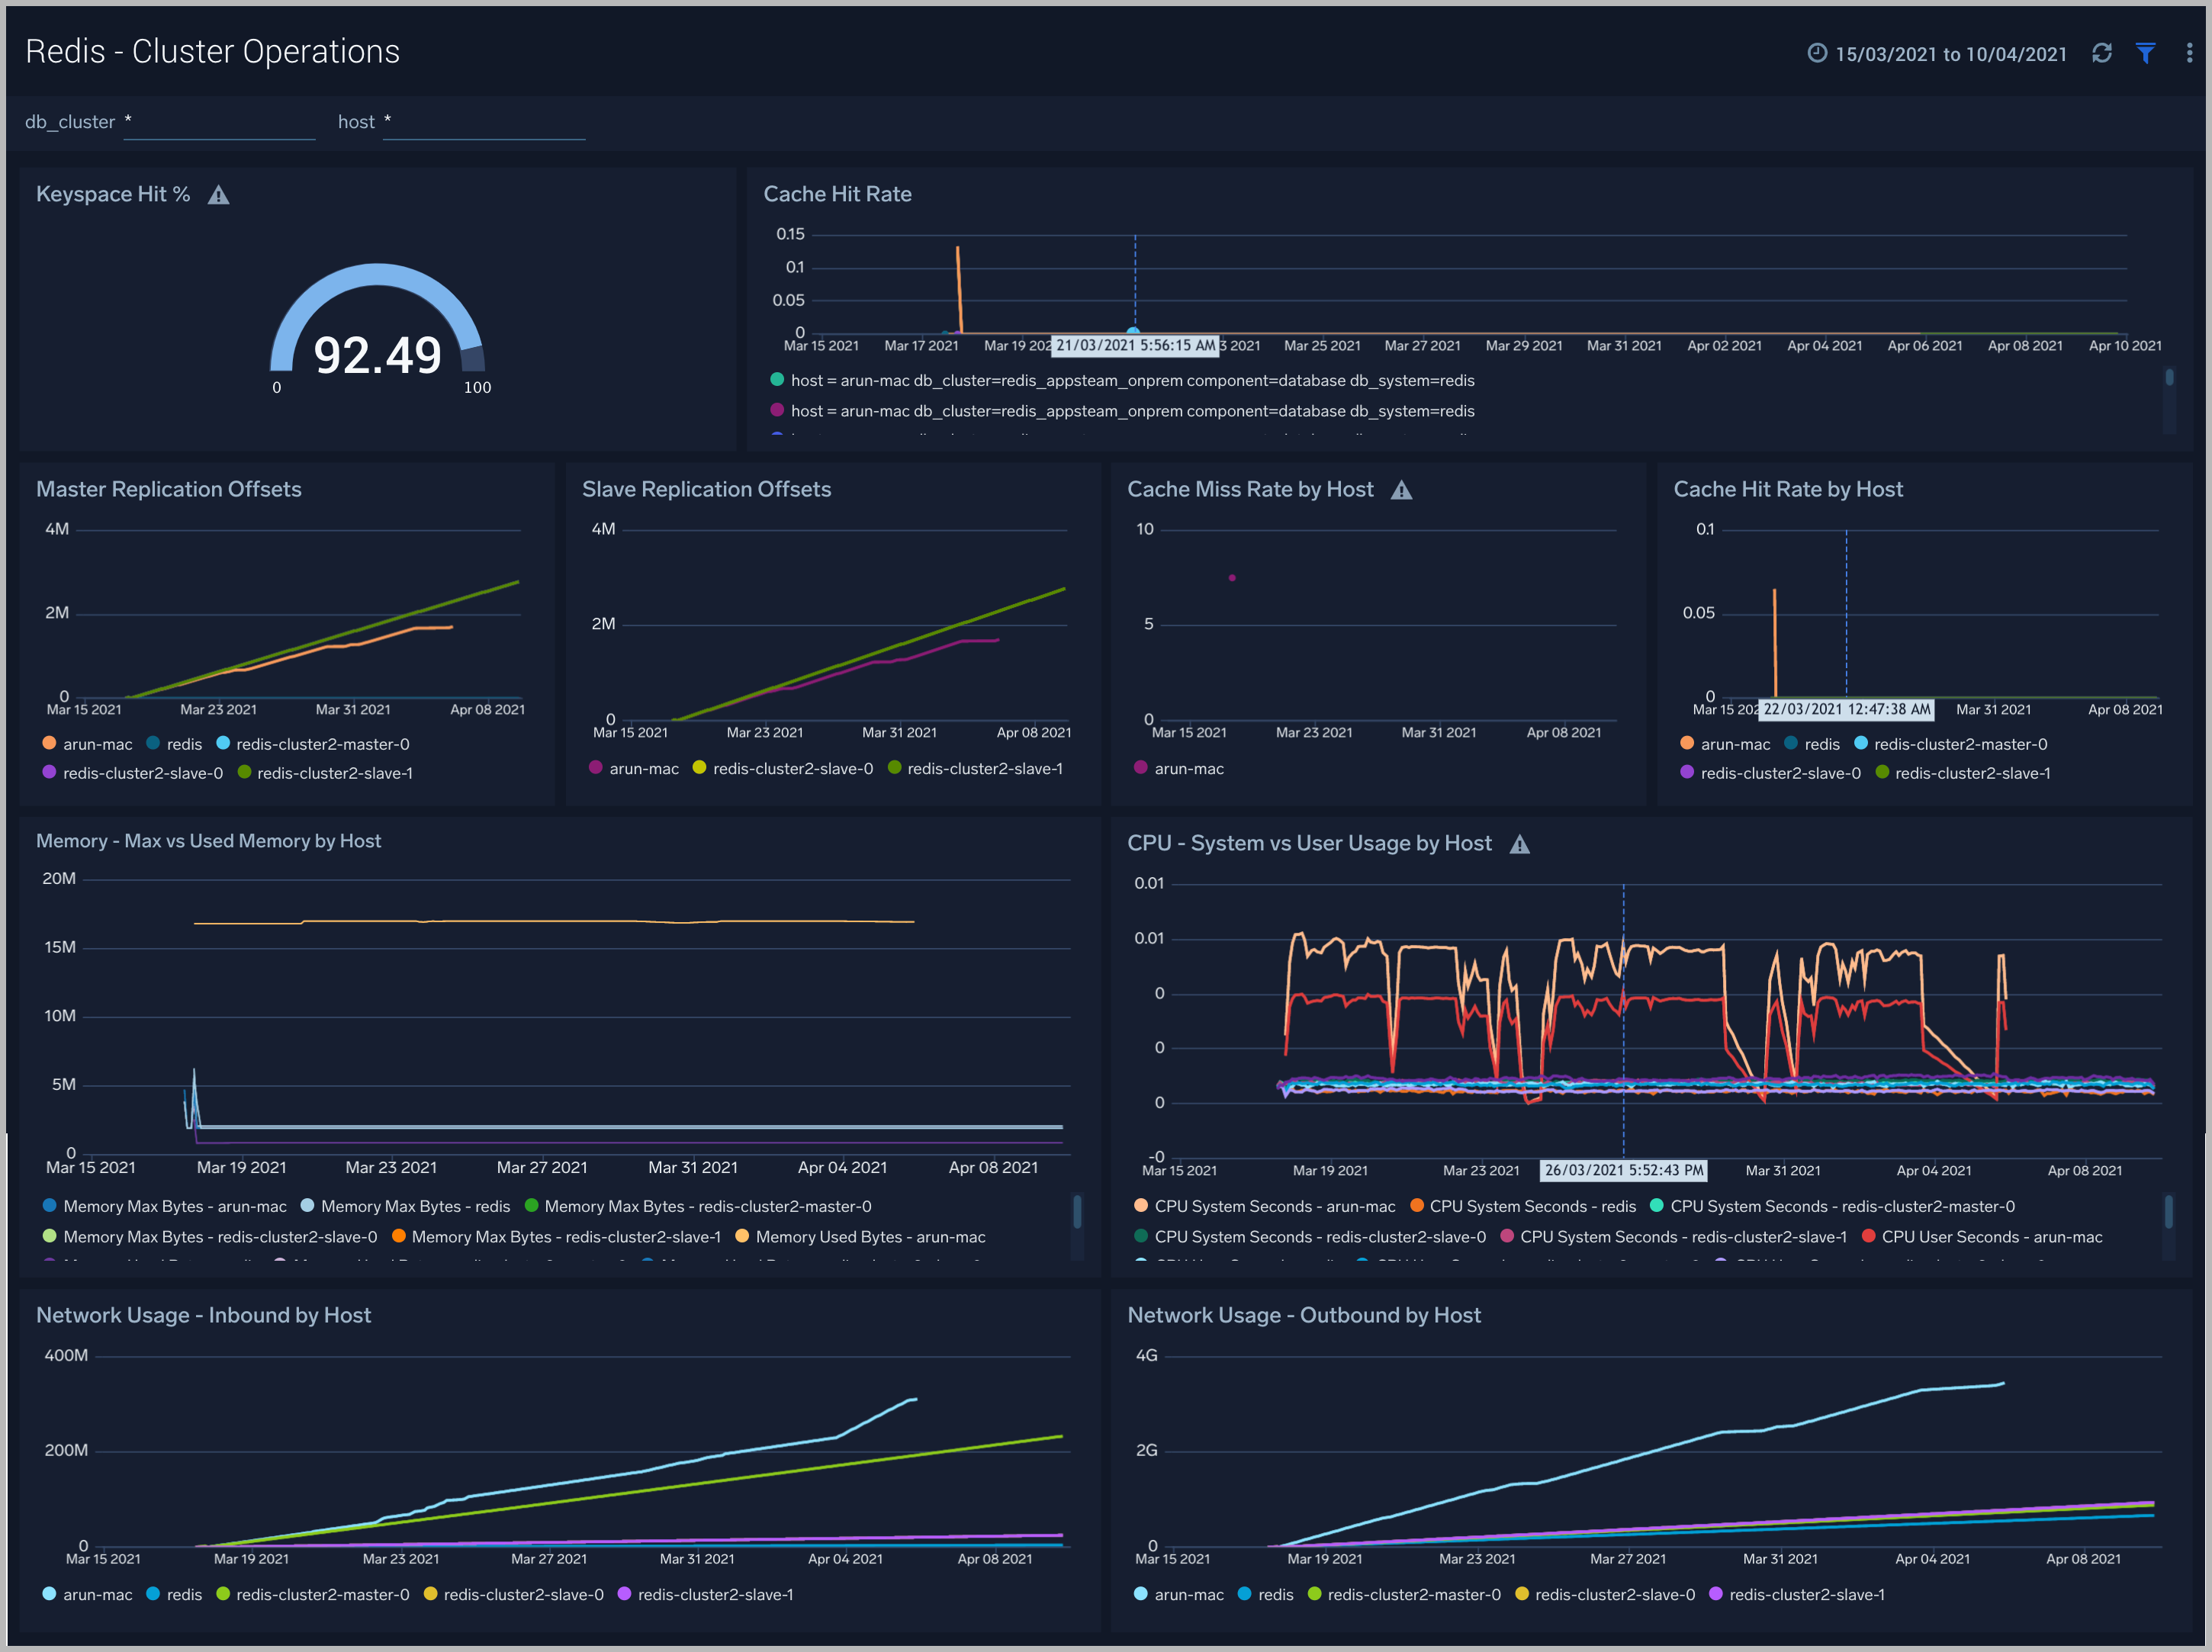
Cluster Operations
The Redis - Cluster Operations dashboard provides a high-level view of the activity and health of Master and Slaves on your network. Dashboard panels display visual graphs and detailed information on replication offsets, cache rate, and most importantly, resource usage.
Use this dashboard to:
- To understand the Cluster resource usage.
- Gain insights into cache hit and miss rates.
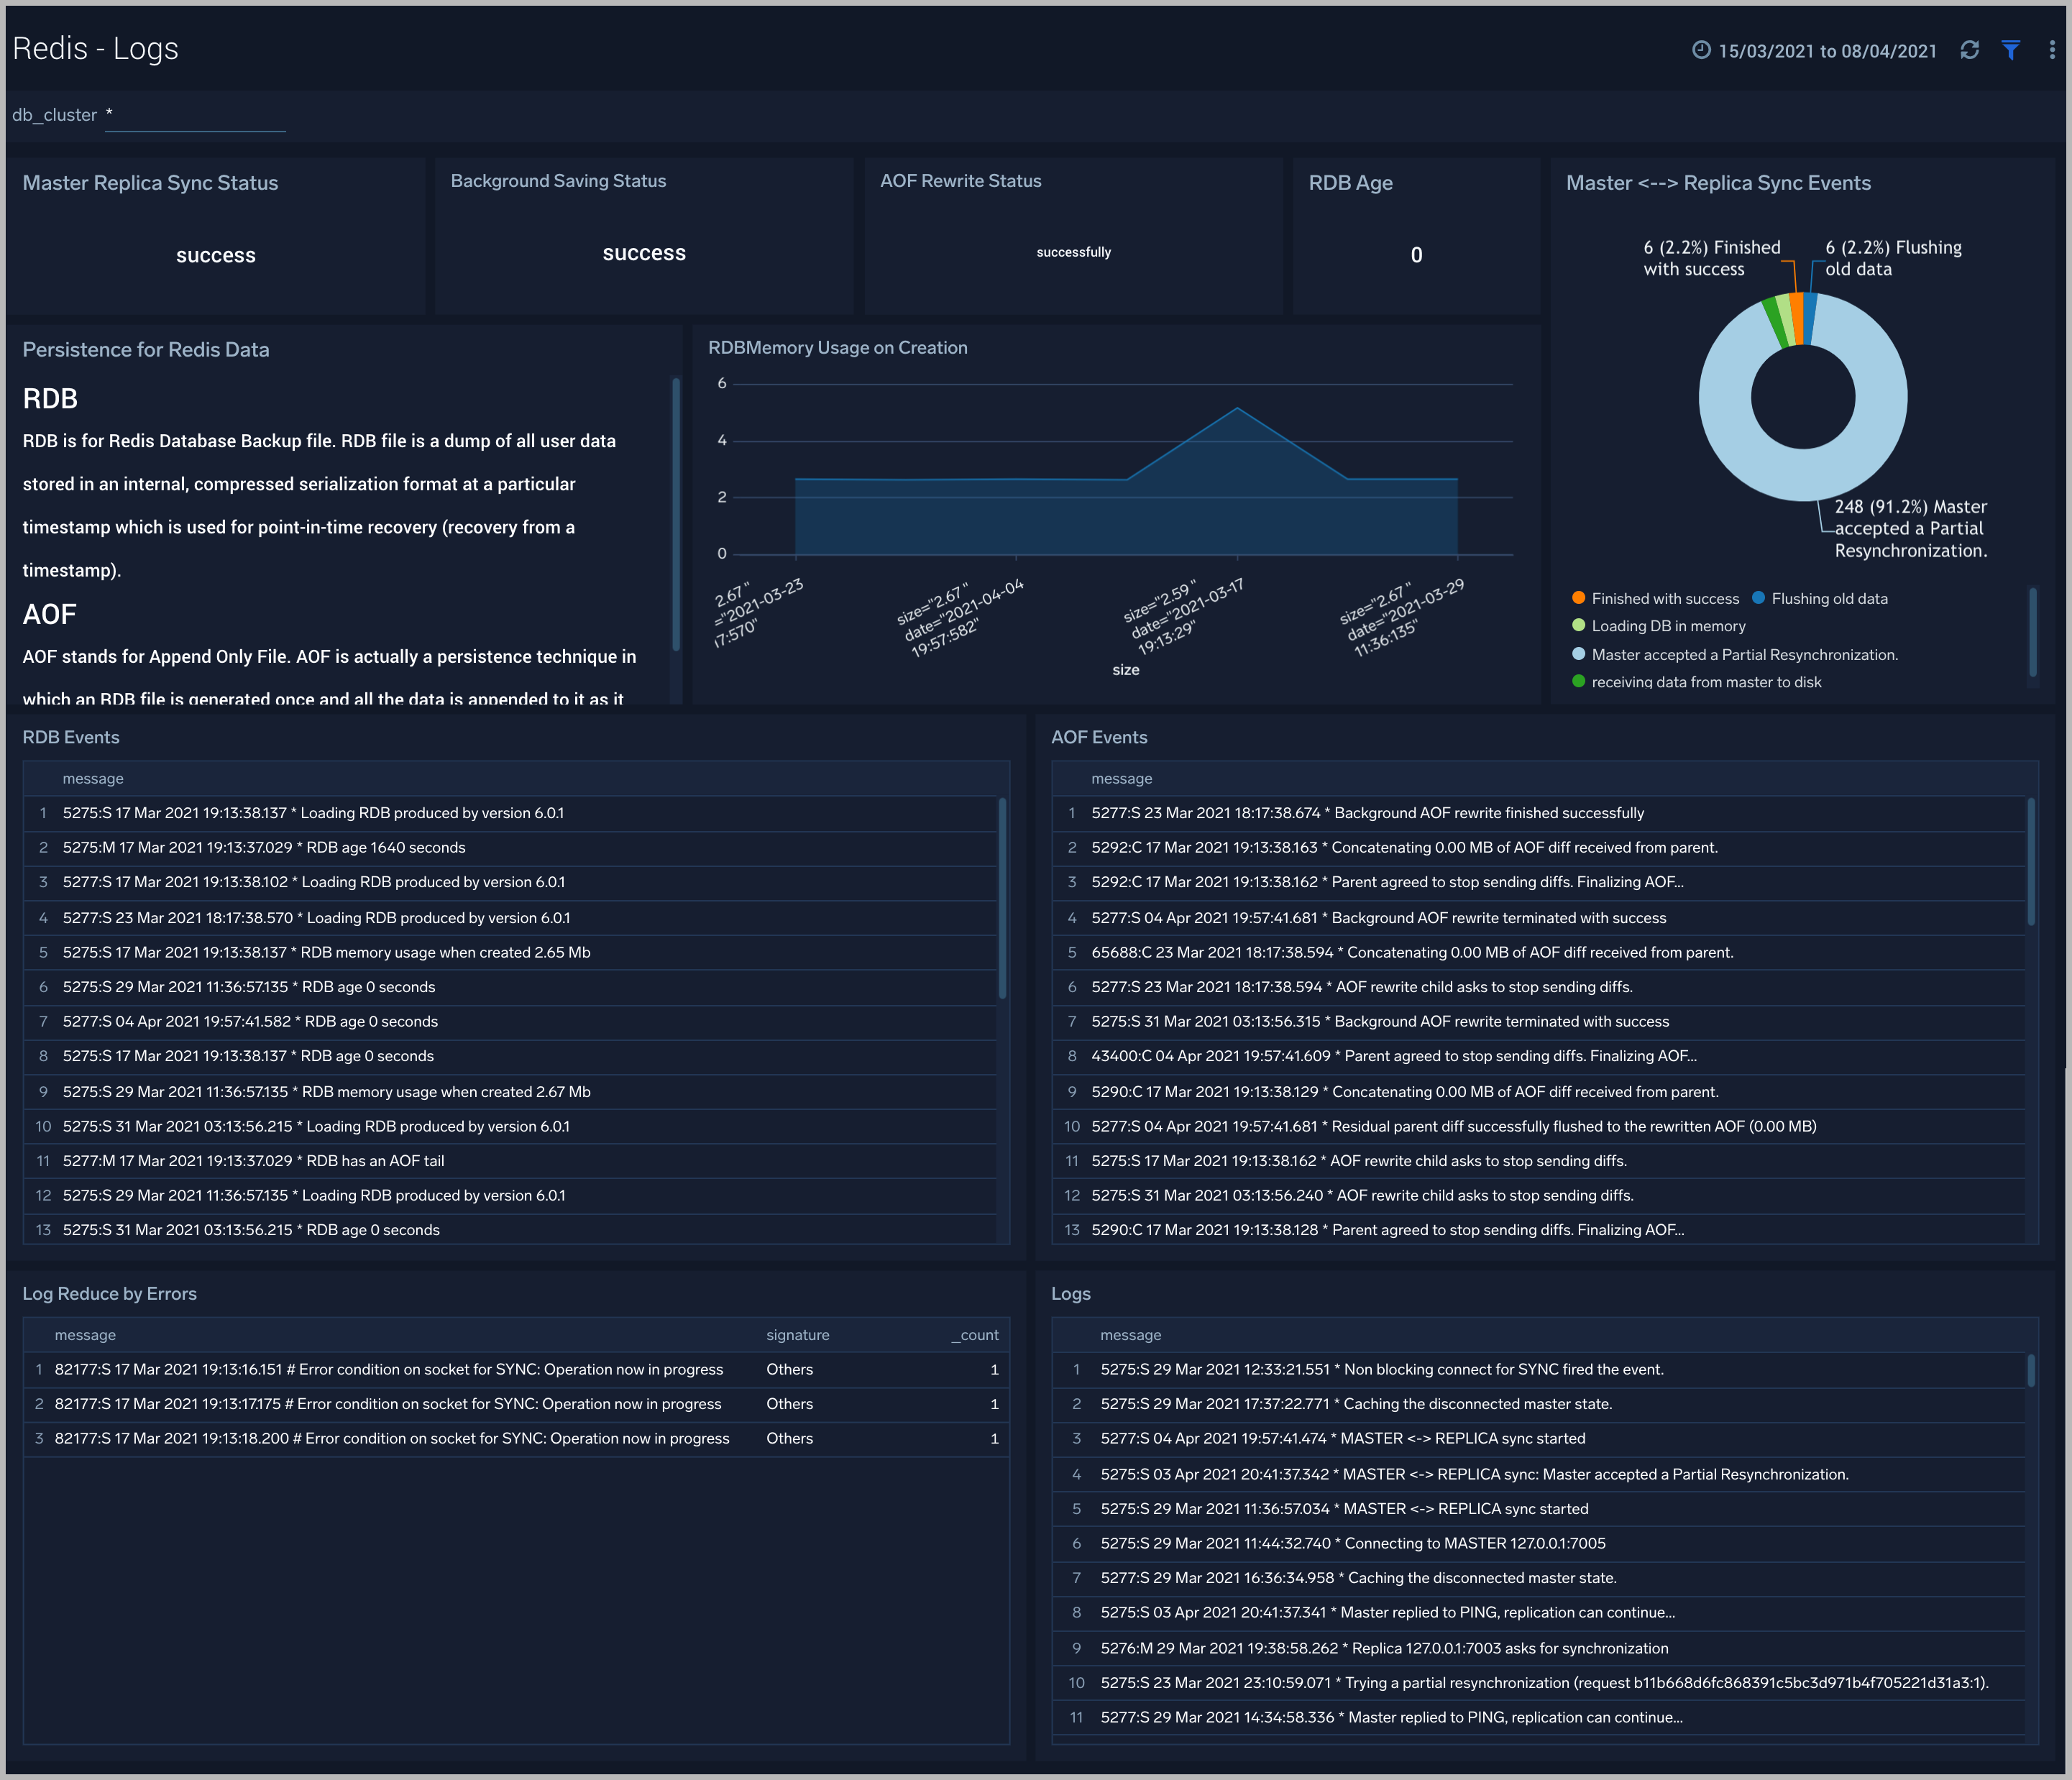
Logs
The Redis - Logs dashboard provides a detailed analysis based on logs. The panels provide details such as RDBMemory Usage, events, RDB, and AOF events.
Use this dashboard to:
- Review errors and warnings generated by the server.
- Review the RDBMemory Usage, events, RDB and AOF events.
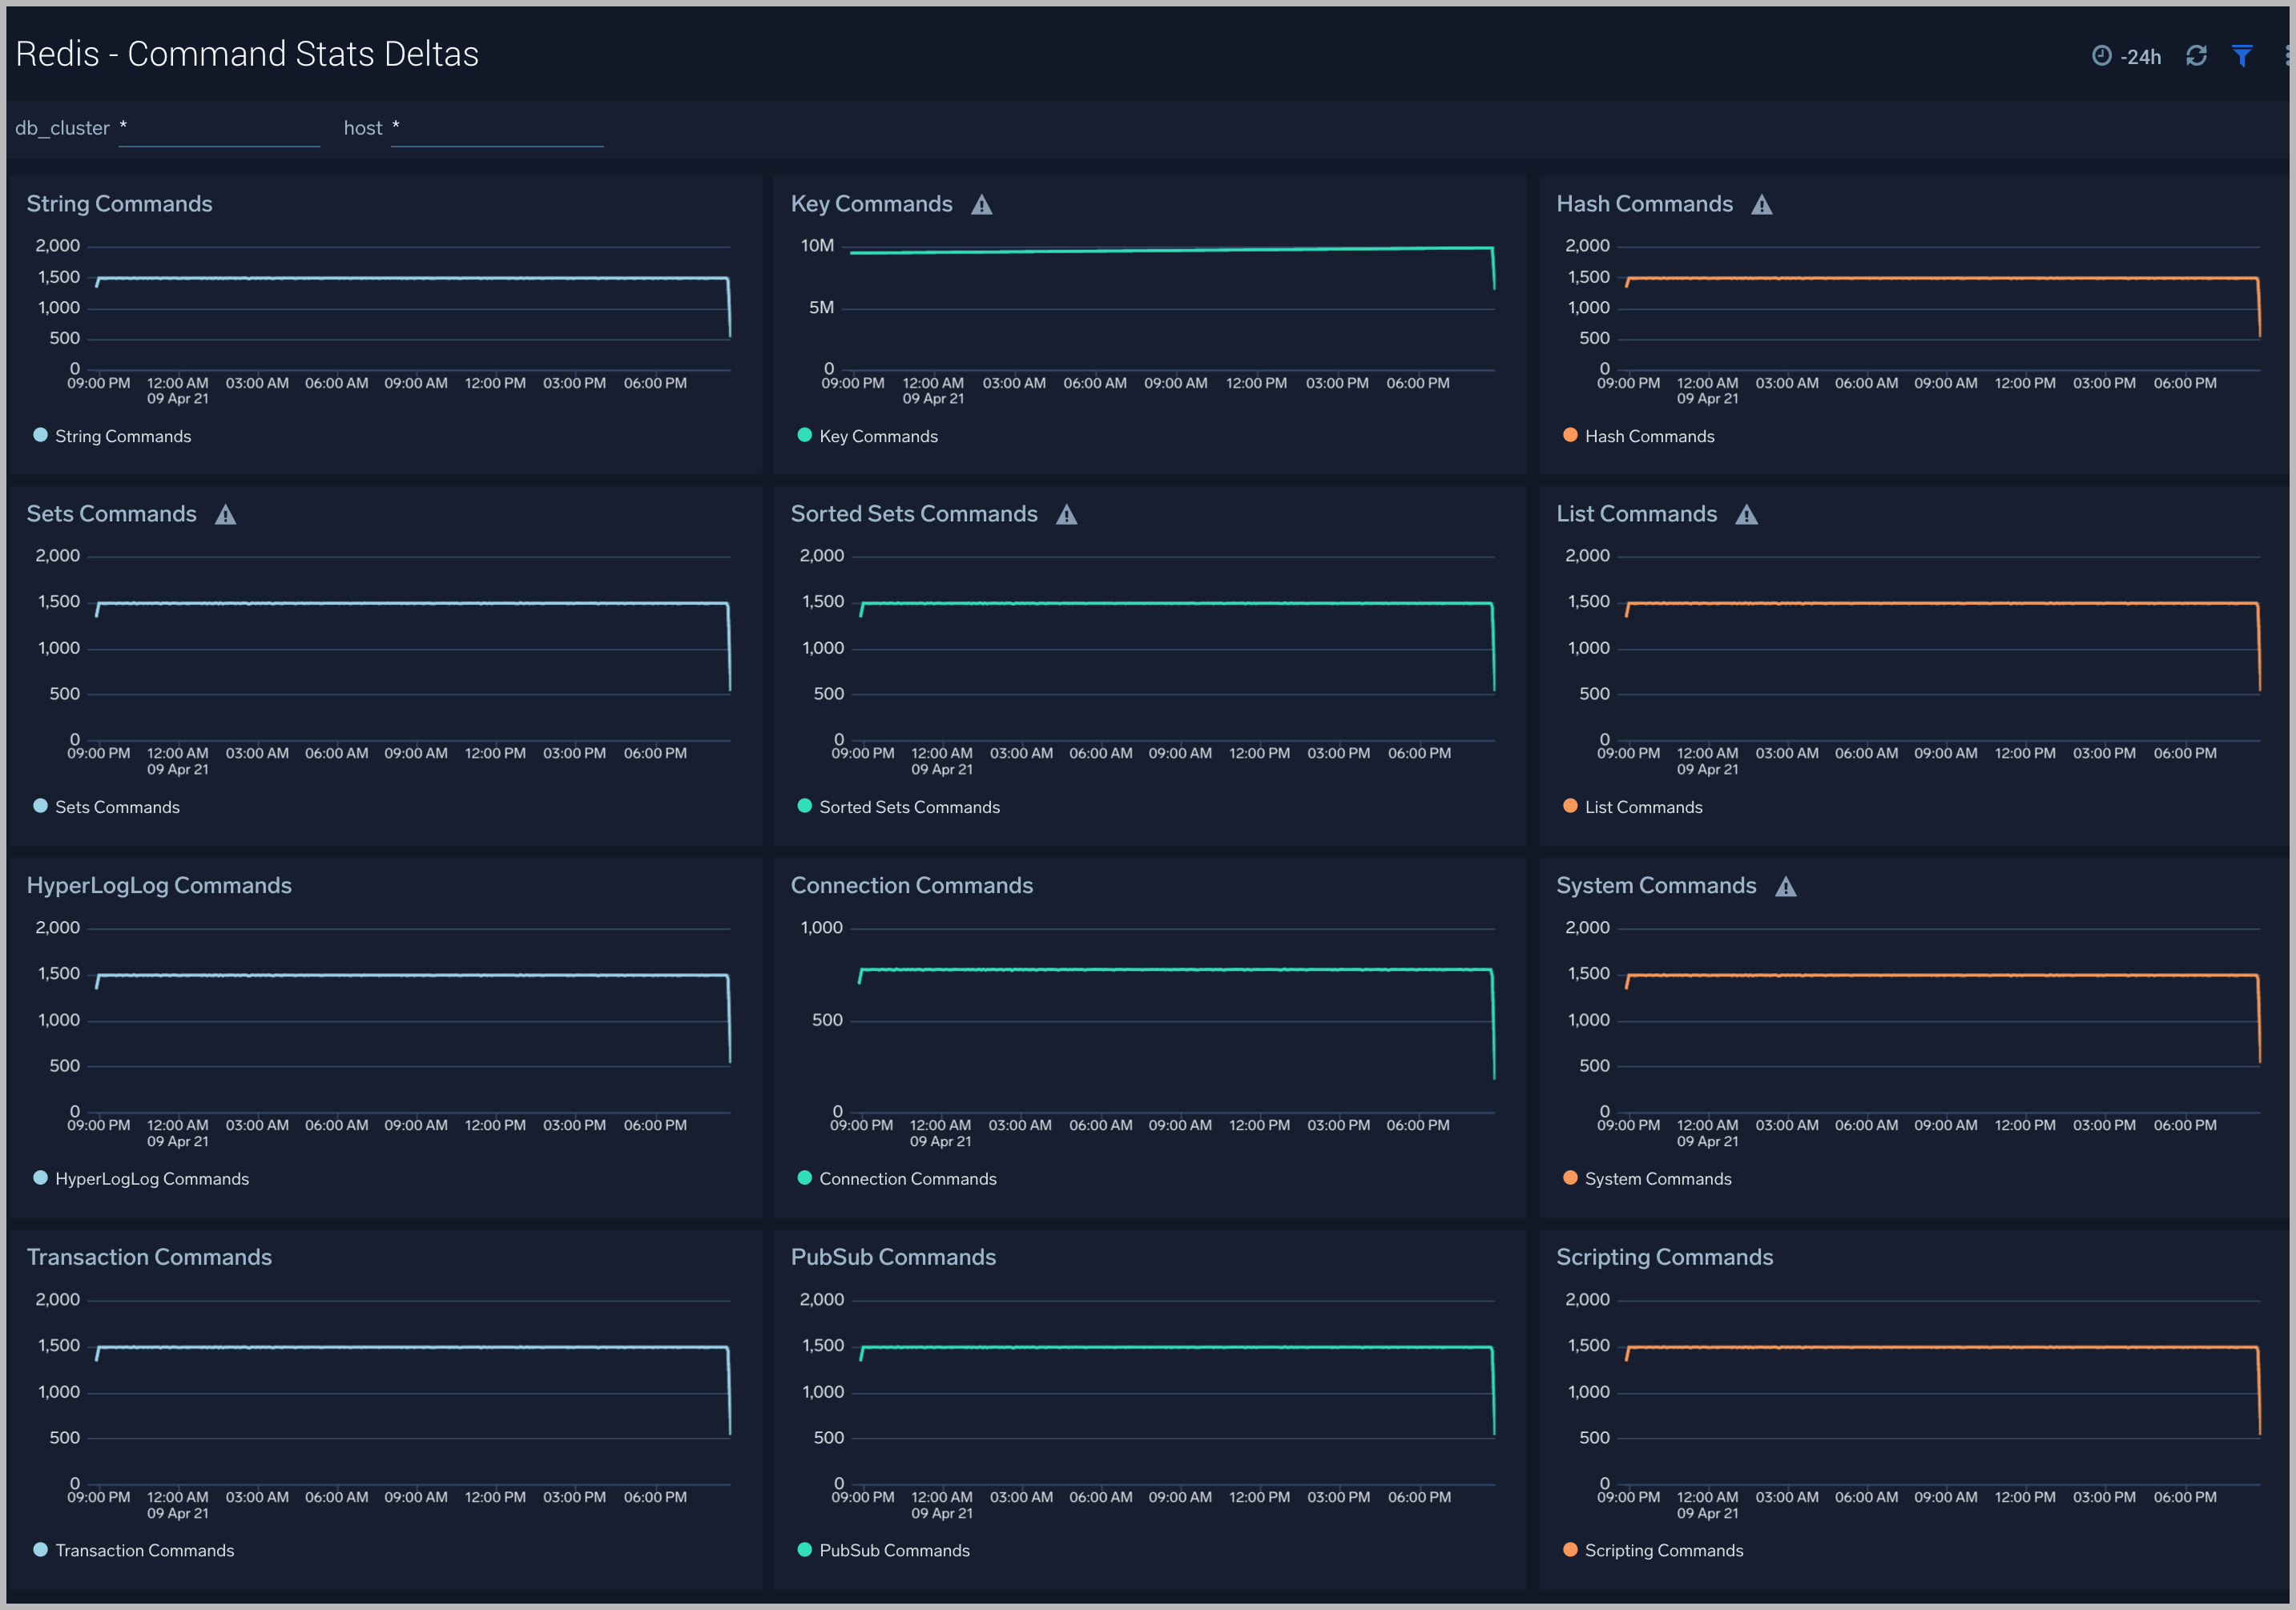
Command Stats Deltas
The Redis - Command Stats Deltas dashboard provides an at-a-glance view of commands running on your Redis server.
Use this dashboard to:
- To gain insights into the commands running on your cluster.
Create monitors for Redis app
From your App Catalog:
- From the Sumo Logic navigation, select App Catalog.
- In the Search Apps field, search for and then select your app.
- Make sure the app is installed.
- Navigate to What's Included tab and scroll down to the Monitors section.
- Click Create next to the pre-configured monitors. In the create monitors window, adjust the trigger conditions and notifications settings based on your requirements.
- Scroll down to Monitor Details.
- Under Location click on New Folder.
note
By default, monitor will be saved in the root folder. So to make the maintenance easier, create a new folder in the location of your choice.
- Enter Folder Name. Folder Description is optional.
tip
Using app version in the folder name will be helpful to determine the versioning for future updates.
- Click Create. Once the folder is created, click on Save.
Redis alerts
| Alert Name | Alert Description and conditions | Alert Condition | Recover Condition |
| Redis - Instance Down | This alert fires when we detect that the Redis instance is down for 5 minutes. | == 0 | >0 |
| Redis - Missing Master | This alert fires when we detect that a Redis cluster has no node marked as master for 5 minutes. | <=0 | >0 |
| Redis - Replication Broken | This alert fires when we detect that a Redis instance has lost a slave. | <0 | >=0 |
| Redis - Too Many Connections | This alert fires when we detect a given Redis server has too many connections (over 100). | >100 | <=100 |
| Redis - Rejected Connections | This alert fires when we detect that some connections to a Redis cluster have been rejected. | >0 | <=0 |
| Redis - High Memory Fragmentation Ratio | This alert fires when the ratio of Redis memory usage to Linux virtual memory pages (mapped to physical memory chunks) is higher than 1.5.
A high ratio will lead to swapping and can adversely affect performance. | >=1.5 | <1.5 |
| Redis - Potential Master-Slave Communication Failure | This alert fires when we detect that communication between the Redis master and slave nodes has not occurred for the past 60 seconds or more. | >=60 | <60 |
| Redis - Replica Lag | This alert fires when we detect that the replica lag for a given Redis cluster is greater than 60 seconds. Please review how replication has been configured. | >60 | <=60 |
| Redis - Replication Broken | This alert fires when we detect that a Redis instance has lost all slaves. This will affect the redundancy of data stored in Redis. Please review how replication has been configured. | <0 | >=0 |
| Redis - Replication Offset | This alert fires when the replication offset in a given Redis cluster is greater than 1 MB for the last five minutes. Please review how replication has been configured. | >=1 | <1 |
| Redis - Out of Memory | This alert fires when we detect that a Redis node is running out of memory (> 90%). | > 90% | < 90% |
| Redis - High CPU Usage | This alert is fired if user and system cpu usage for a host exceeds 80%. | > 80% | < 80% |