Azure Application Gateway
Azure Application Gateway is a web traffic load balancer that enables you to manage traffic to your web applications. It works on application layer (OSI layer 7) and supports URL based routing. This integration helps in analyzing access patterns, tracking performance information for each instance, including total requests served, throughput in bytes, healthy and unhealthy backend instance count.
Log and metric types
For Azure Application Gateway, you can collect the following logs and metrics:
- Access log. These logs provide information on access patterns including the caller's IP, requested URL, response latency, return code, and bytes in and out.
- Performance log. These log captures performance information for each instance, including total requests served, throughput in bytes, total requests served, failed request count, and healthy and unhealthy backend instance count. The Performance log is available only for the v1 SKU. For the v2 SKU, use Metrics for performance data.
- Firewall log. You can use this log to view the requests that are logged through either detection or prevention mode of an application gateway that is configured with the web application firewall.
To learn more about the different resource log category types and schemas collected for Azure Application Gateway, refer to Azure documentation.
-
Activity logs, provides insight into any subscription-level or management group level events that have occurred in the Azure. To learnmore, refer to Azure documentation.
-
Platform Metrics for Azure Application Gateway. These metrics are available in Microsoft.Network/applicationGateways namespace. For more information on supported metrics in Azure Application Gateway v1 and Azure Application Gateway v2, refer to Azure documentation.
Setup
This app supports only Application Gateway V2 since Application Gateway V1 will soon be deprecated.
Azure service sends monitoring data to Azure Monitor, which can then stream data to Eventhub. Sumo Logic supports:
- Logs collection from Azure Monitor using our Azure Event Hubs source.
- Metrics collection using our Azure Metrics Source.
You must explicitly enable diagnostic settings for each Azure Application Gateway you want to monitor. You can forward logs to the same event hub provided they satisfy the limitations and permissions as described here.
When you configure the event hubs source or HTTP source, plan your source category to ease the querying process. A hierarchical approach allows you to make use of wildcards. For example: Azure/ApplicationGateway/Logs, Azure/ApplicationGateway/Metrics.
Configure metrics collection
To set up the Azure Metrics source in Sumo Logic, refer to Azure Metrics Source.
The Sumo Logic Metrics source is currently in beta. To participate, contact your Sumo Logic account executive.
Configure logs collection
Diagnostic logs
In this section, you will configure a pipeline for shipping diagnostic logs from Azure Monitor to an Event Hub.
- To set up the Azure Event Hubs source in Sumo Logic, refer to the Azure Event Hubs Source for Logs.
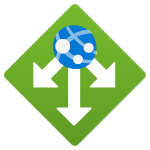
- To create the diagnostic settings in Azure portal, refer to the Azure documentation. Perform the steps below for each Azure application gateway account that you want to monitor.
- Choose Stream to an event hub as the destination.
- Select
allLogs. - Use the Event Hub namespace and Event Hub name configured in the previous step in the destination details section. You can use the default policy
RootManageSharedAccessKeyas the policy name.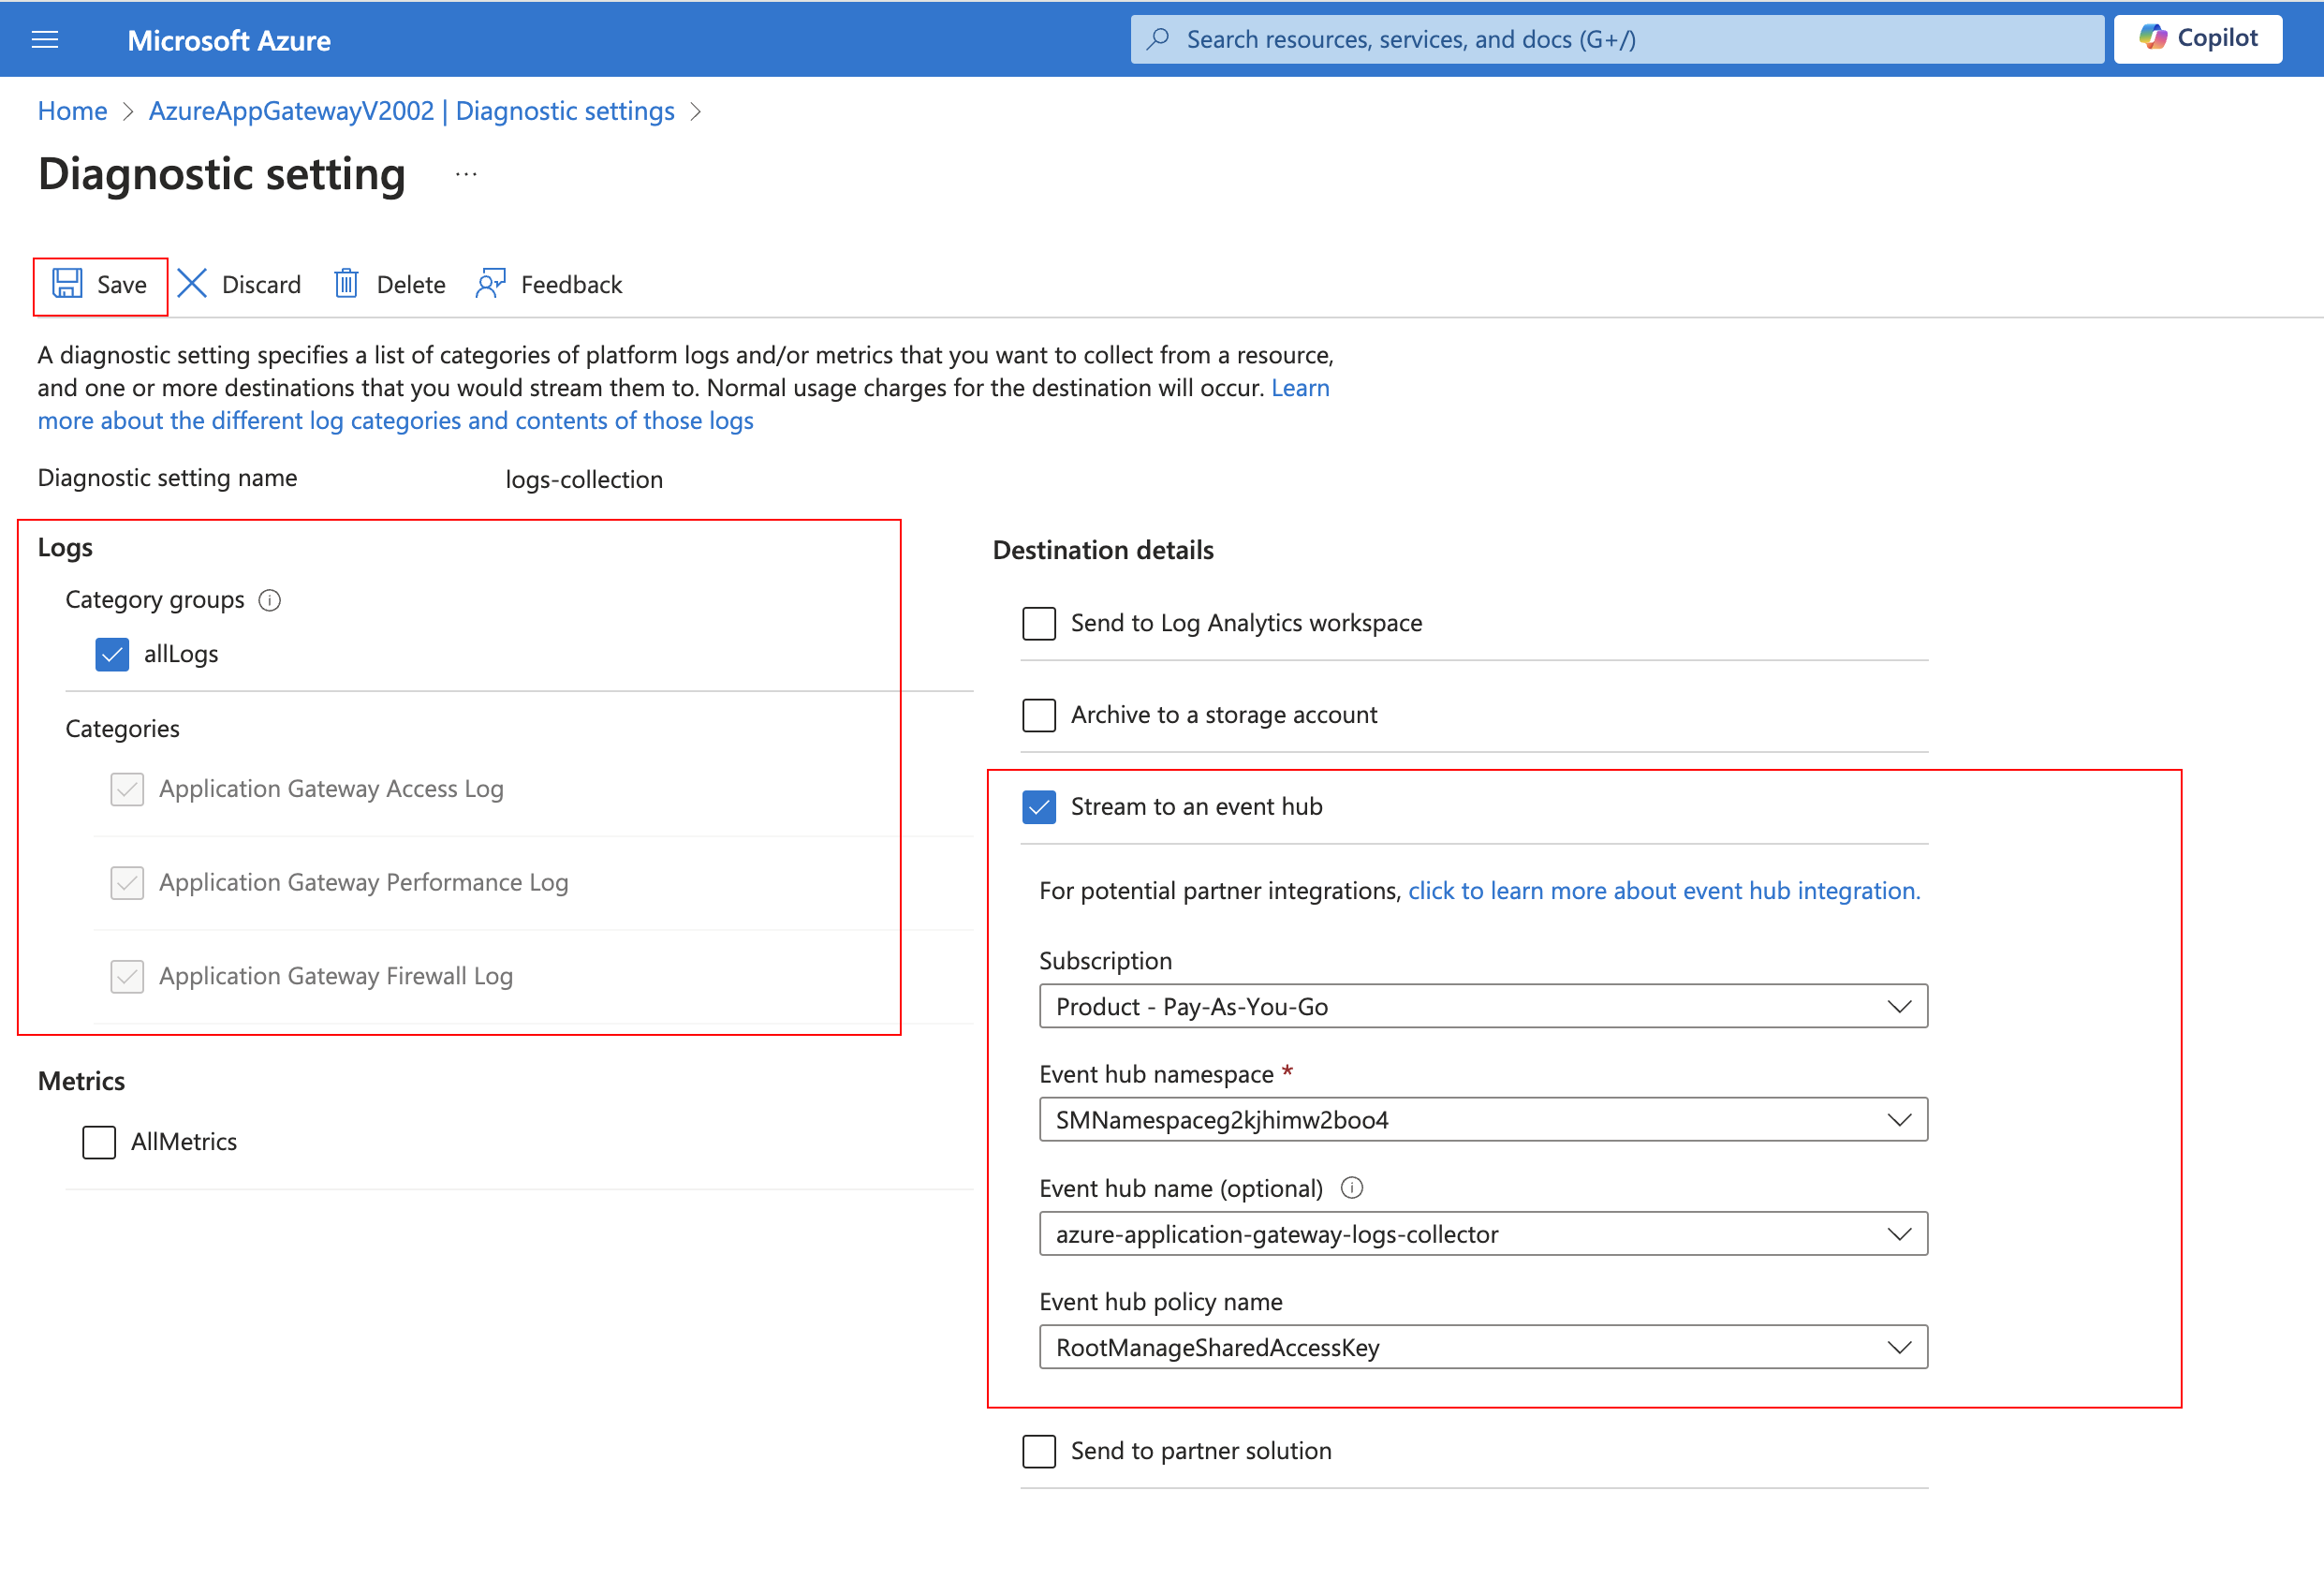
- Tag the location field in the source with right location value.
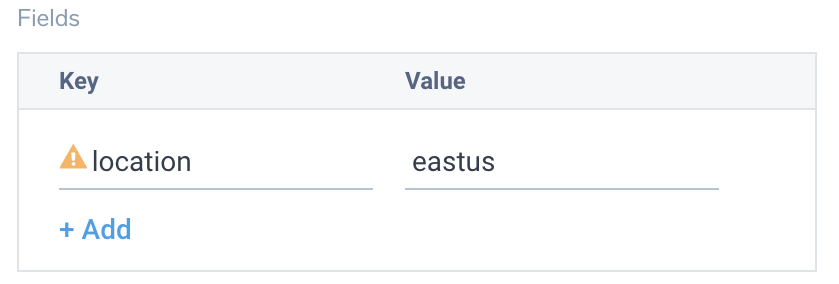
WAF logs and metrics will be available for WAF V2 tier and only after a WAF Policy has been associated with application gateway. Refer to the azure docs for more information. Go to Settings -> Configuration to check your application gateway tier
Activity Logs
To collect activity logs, follow the instructions here. Do not perform this step in case you are already collecting activity logs for a subscription.
Since this source contains logs from multiple regions, make sure that you do not tag this source with the location tag.
Installing the Azure Application Gateway app
Now that you have set up data collection, install the Azure Application Gateway Sumo Logic app to use the pre-configured dashboards that provide visibility into your environment for real-time analysis of overall usage.
To install the app, do the following:
Next-Gen App: To install or update the app, you must be an account administrator or a user with Manage Apps, Manage Monitors, Manage Fields, Manage Metric Rules, and Manage Collectors capabilities depending upon the different content types part of the app.
- Select App Catalog.
- In the 🔎 Search Apps field, run a search for your desired app, then select it.
- Click Install App.
note
Sometimes this button says Add Integration.
- Click Next in the Setup Data section.
- In the Configure App section of your respective app, complete the following field.
- Index. Specify value for _index if the collection is configured with custom partition. Learn more. Default value is set to
sumologic_default(default partition)
- Index. Specify value for _index if the collection is configured with custom partition. Learn more. Default value is set to
- Click Next. You will be redirected to the Preview & Done section.
Post-installation
Once your app is installed, it will appear in your Installed Apps folder, and dashboard panels will start to fill automatically.
Each panel slowly fills with data matching the time range query received since the panel was created. Results will not immediately be available but will be updated with full graphs and charts over time.
As part of the app installation process, the following fields will be created by default:
tenant_name. This field is tagged at the collector level. You can get the tenant name using the instructions here.location. The region to which the resource name belongs to.subscription_id. ID associated with a subscription where the resource is present.resource_group. The resource group name where the Azure resource is present.provider_name. Azure resource provider name (for example, Microsoft.Network).resource_type. Azure resource type (for example, storage accounts).resource_name. The name of the resource (for example, storage account name).service_type. Type of the service that can be accessed with a Azure resource.service_name. Services that can be accessed with an Azure resource (for example, in Azure Container Instances the service is Subscriptions).
Viewing the Azure Application Gateway dashboards
All dashboards have a set of filters that you can apply to the entire dashboard. Use these filters to drill down and examine the data to a granular level.
- You can change the time range for a dashboard or panel by selecting a predefined interval from a drop-down list, choosing a recently used time range, or specifying custom dates and times. Learn more.
- You can use template variables to drill down and examine the data on a granular level. For more information, see Filtering Dashboards with Template Variables.
- Many of the Next-Gen apps allow you to provide the Index at the installation time and a default value for this key (sumologic_default). Based on your input, the app dashboards will be parameterized with a dashboard variable, allowing you to change the data partition queried by all panels. This restricts the query scope of all the dashboard queries to a specific data partition.
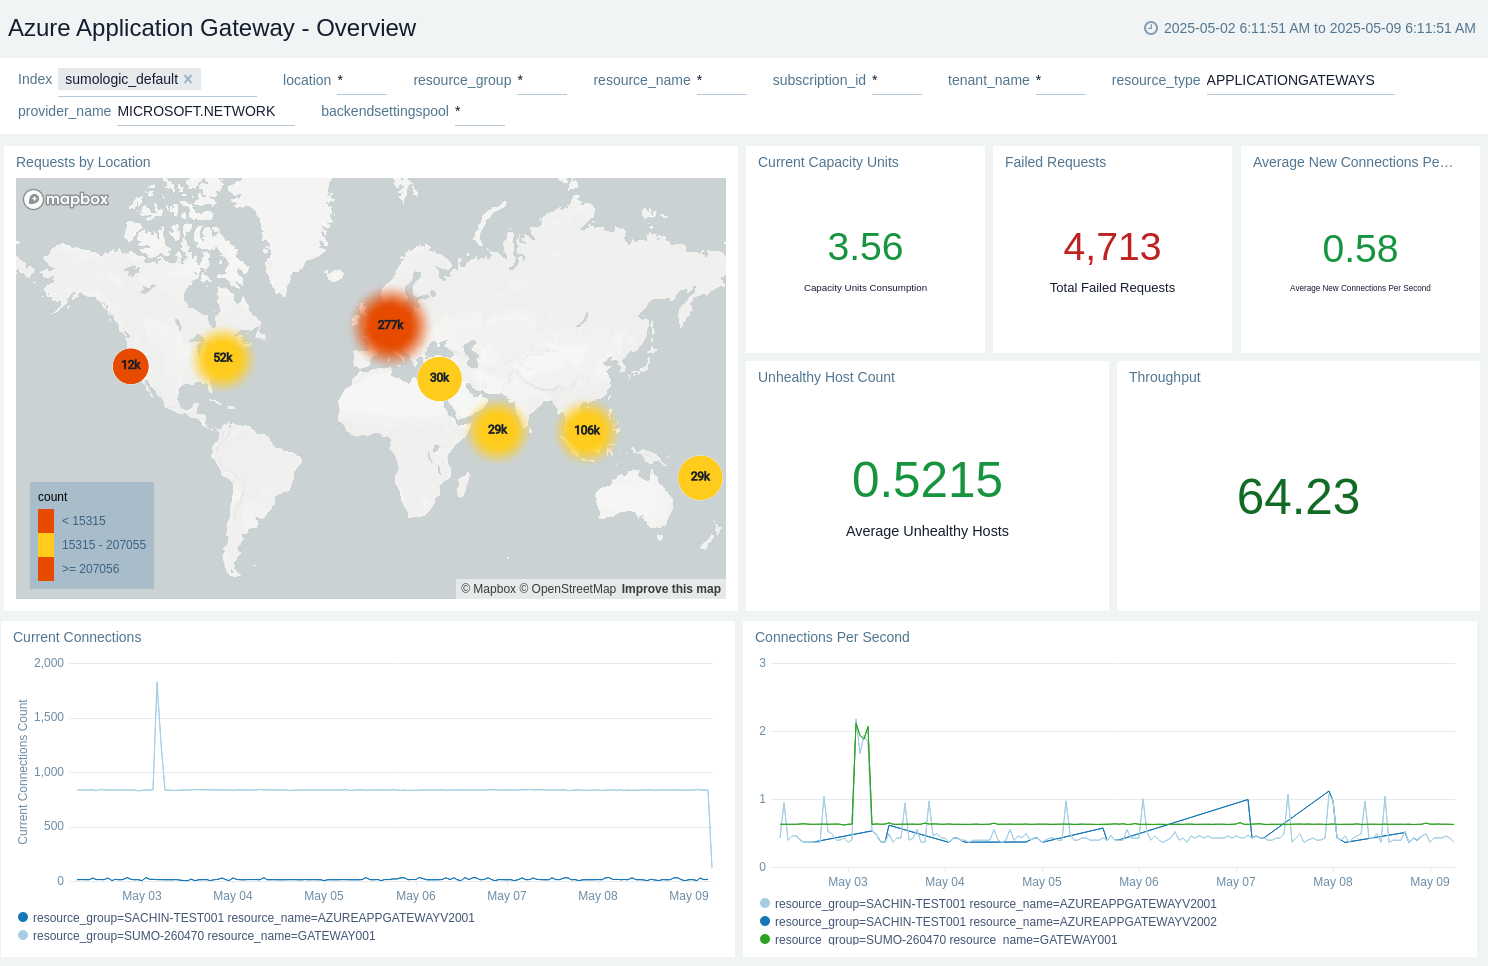
Overview
The Azure Application Gateway - Overview dashboard provides details like requests by location, current capacity units, failed requests count, average new connections per second, throughput - average bytes per second, unhealthy host count, current connections, and connections/sec trends.
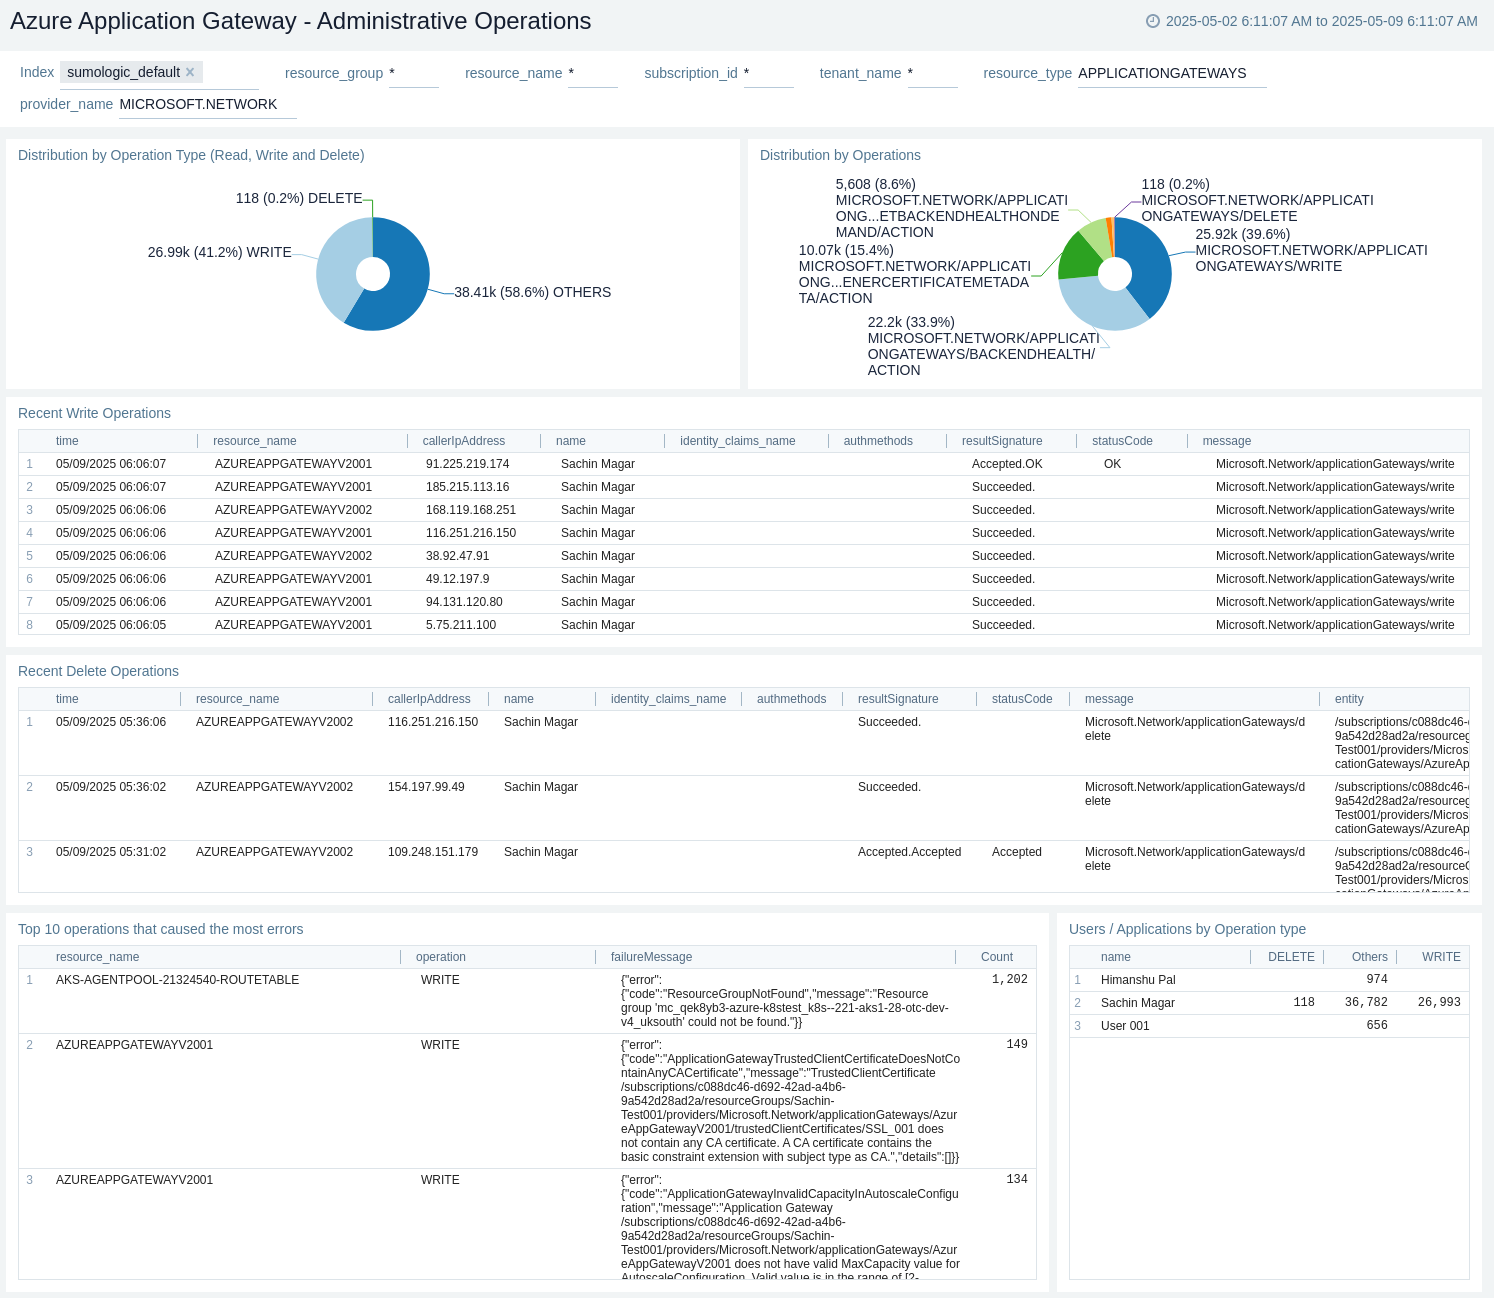
Administrative Operations
The Azure Application Gateway - Administrative Operations dashboard provides details like Changes, Read/Write/Delete specific changes, different operations used, top 10 operations that caused most errors, and most common errors.
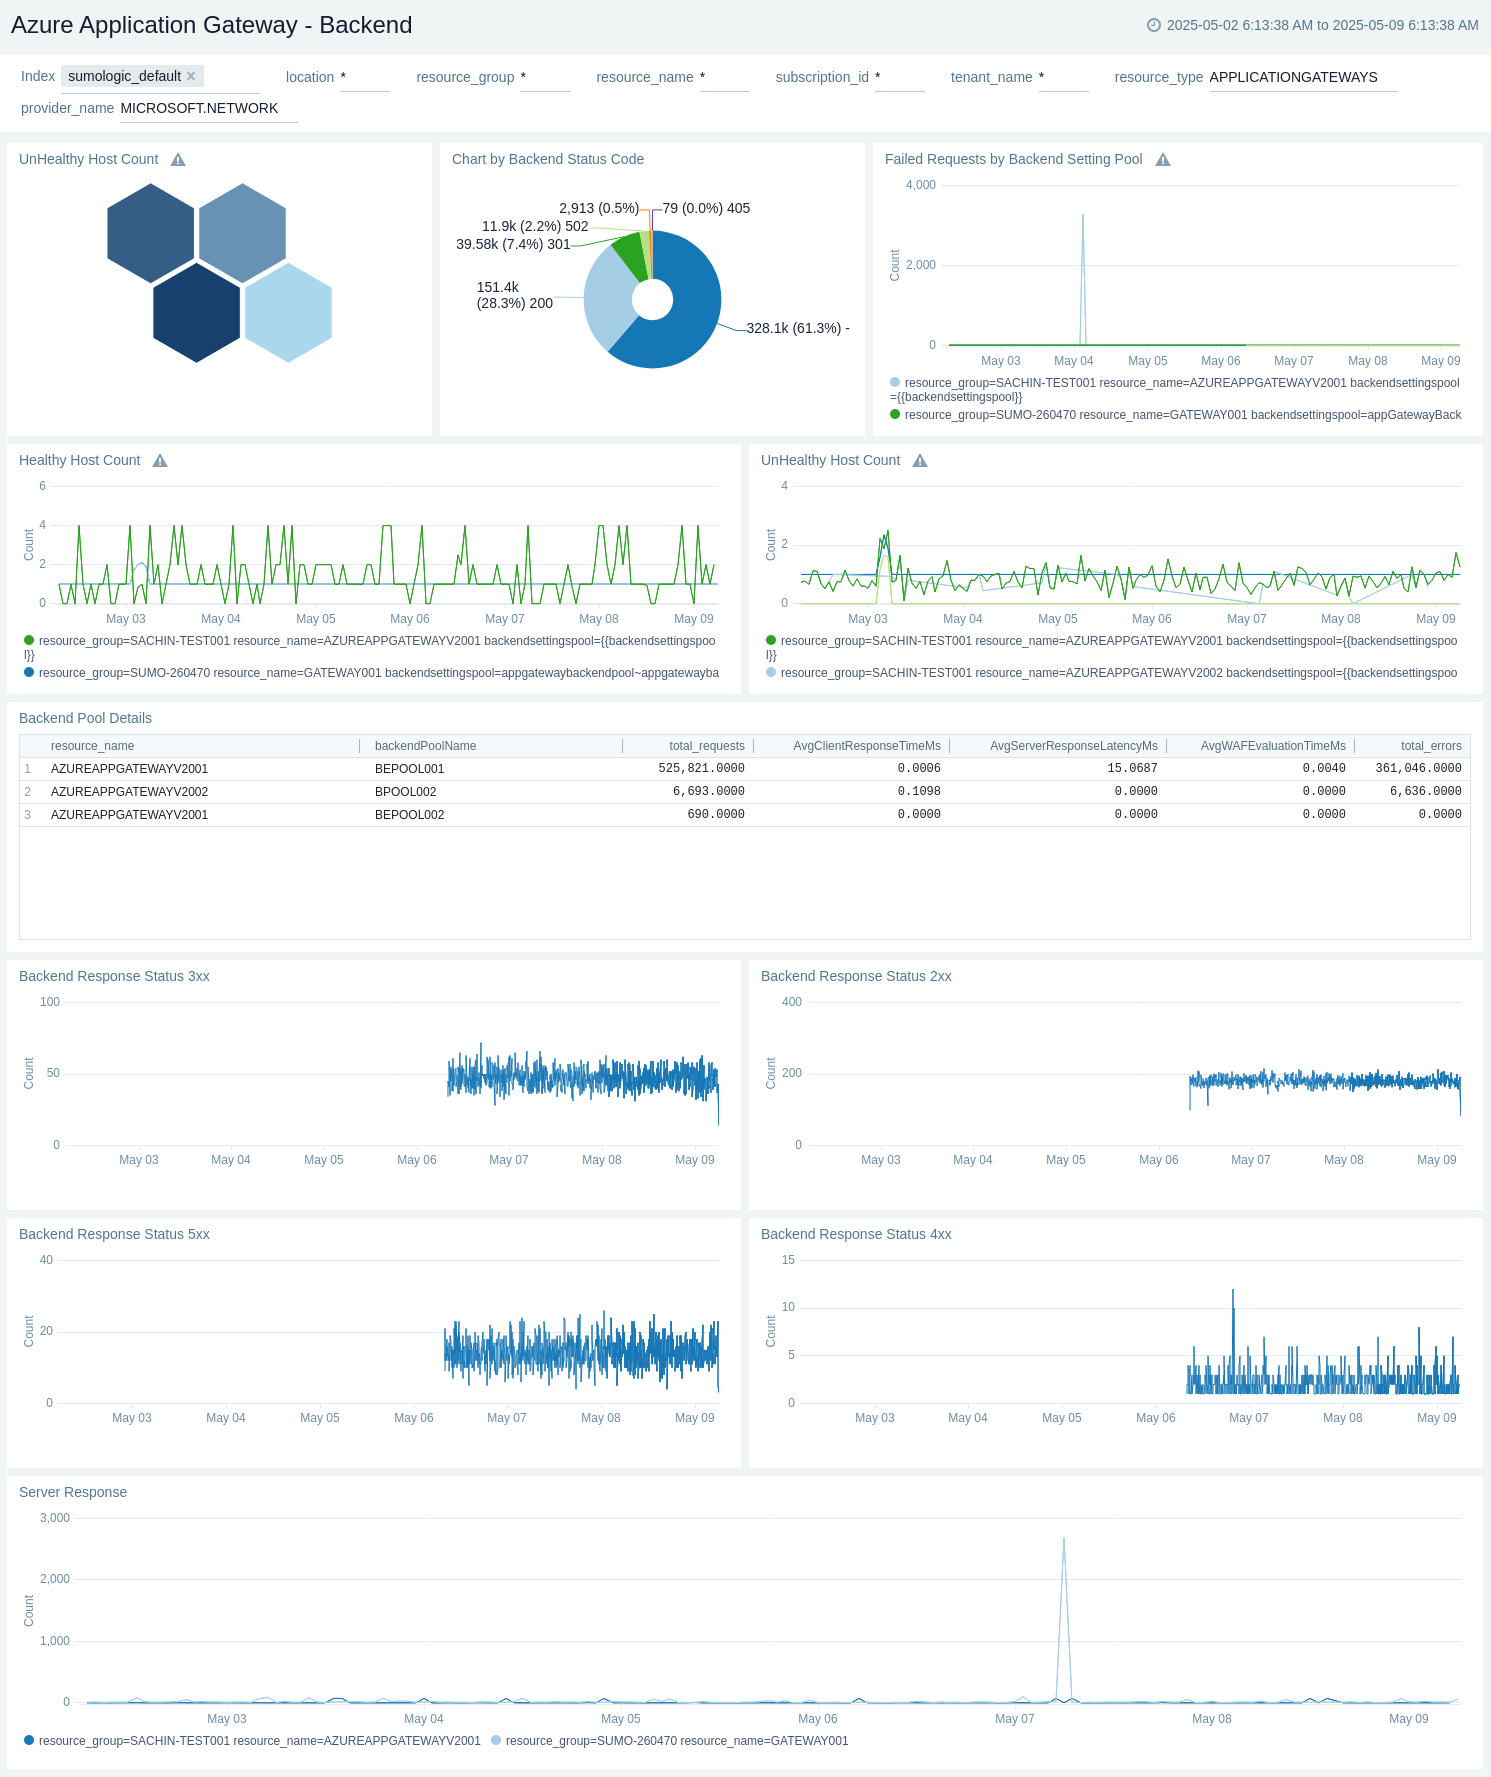
Backend
The Azure Application Gateway - Backend dashboard provides insights like unhealthy host count, server response, backend pool details, healthy host count trend, unhealthy host count trend, chart by backend status code, and backend response status for 2xx, 3xx, 4xx, 5xx.
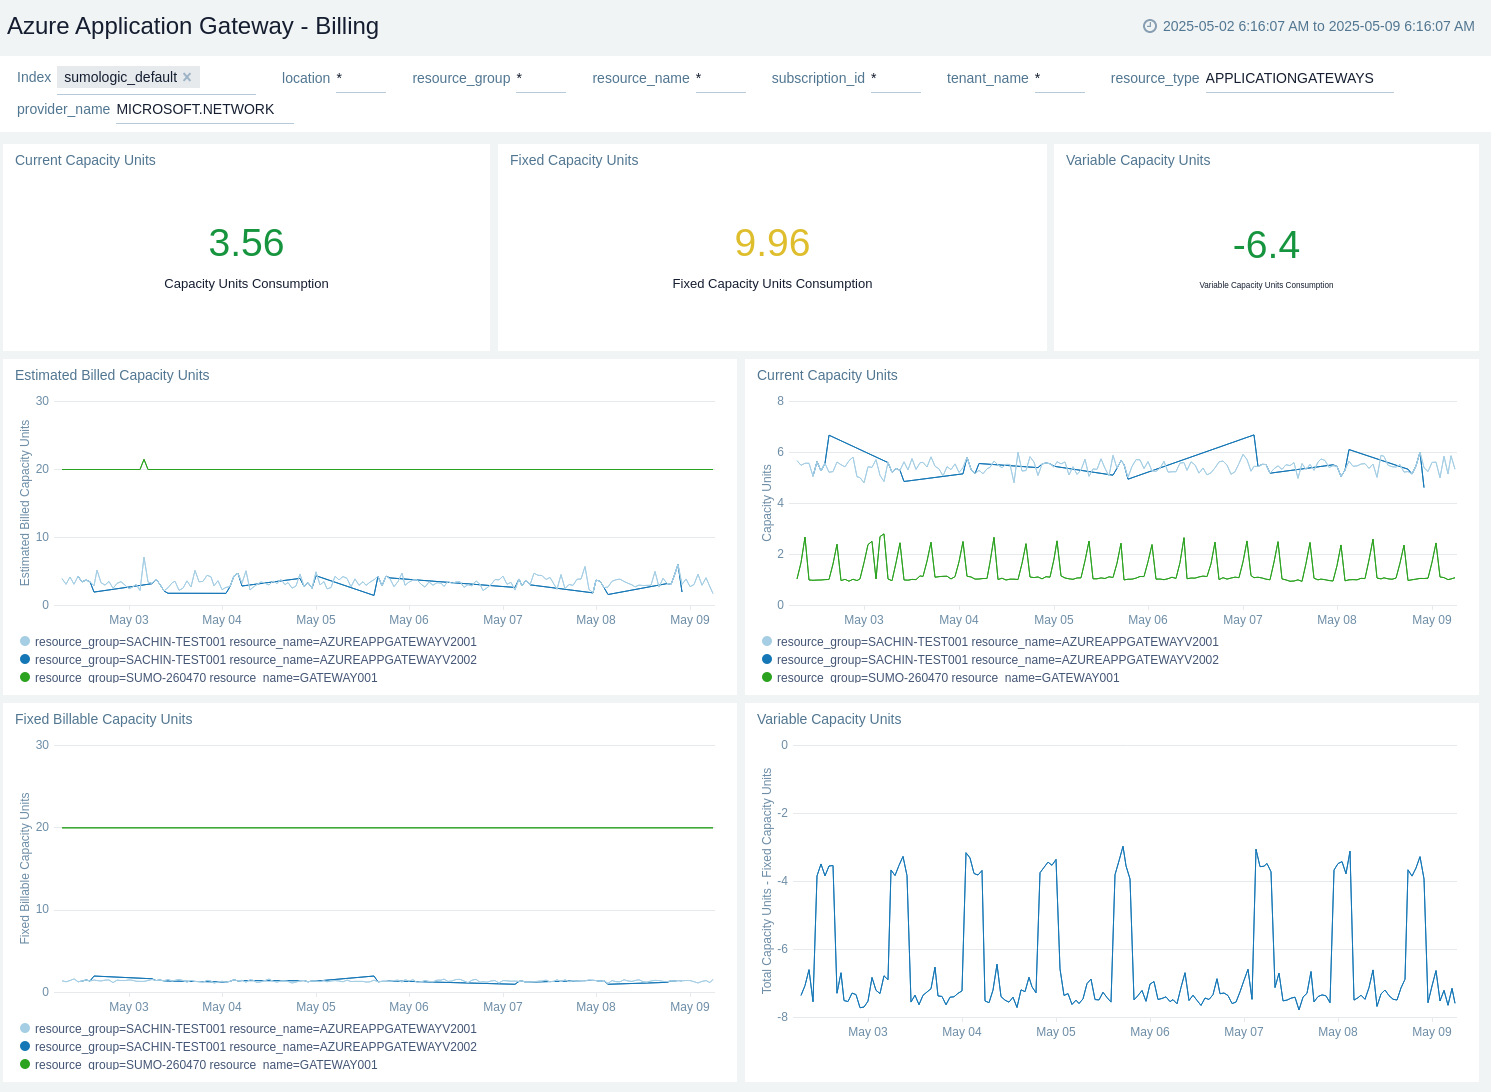
Billing
The Azure Application Gateway - Billing dashboard provides insights like current capacity units, fixed capacity units, variable capacity units, estimated billed capacity units trend, current capacity units trend, fixed billable capacity units trend, and variable capacity units trend.
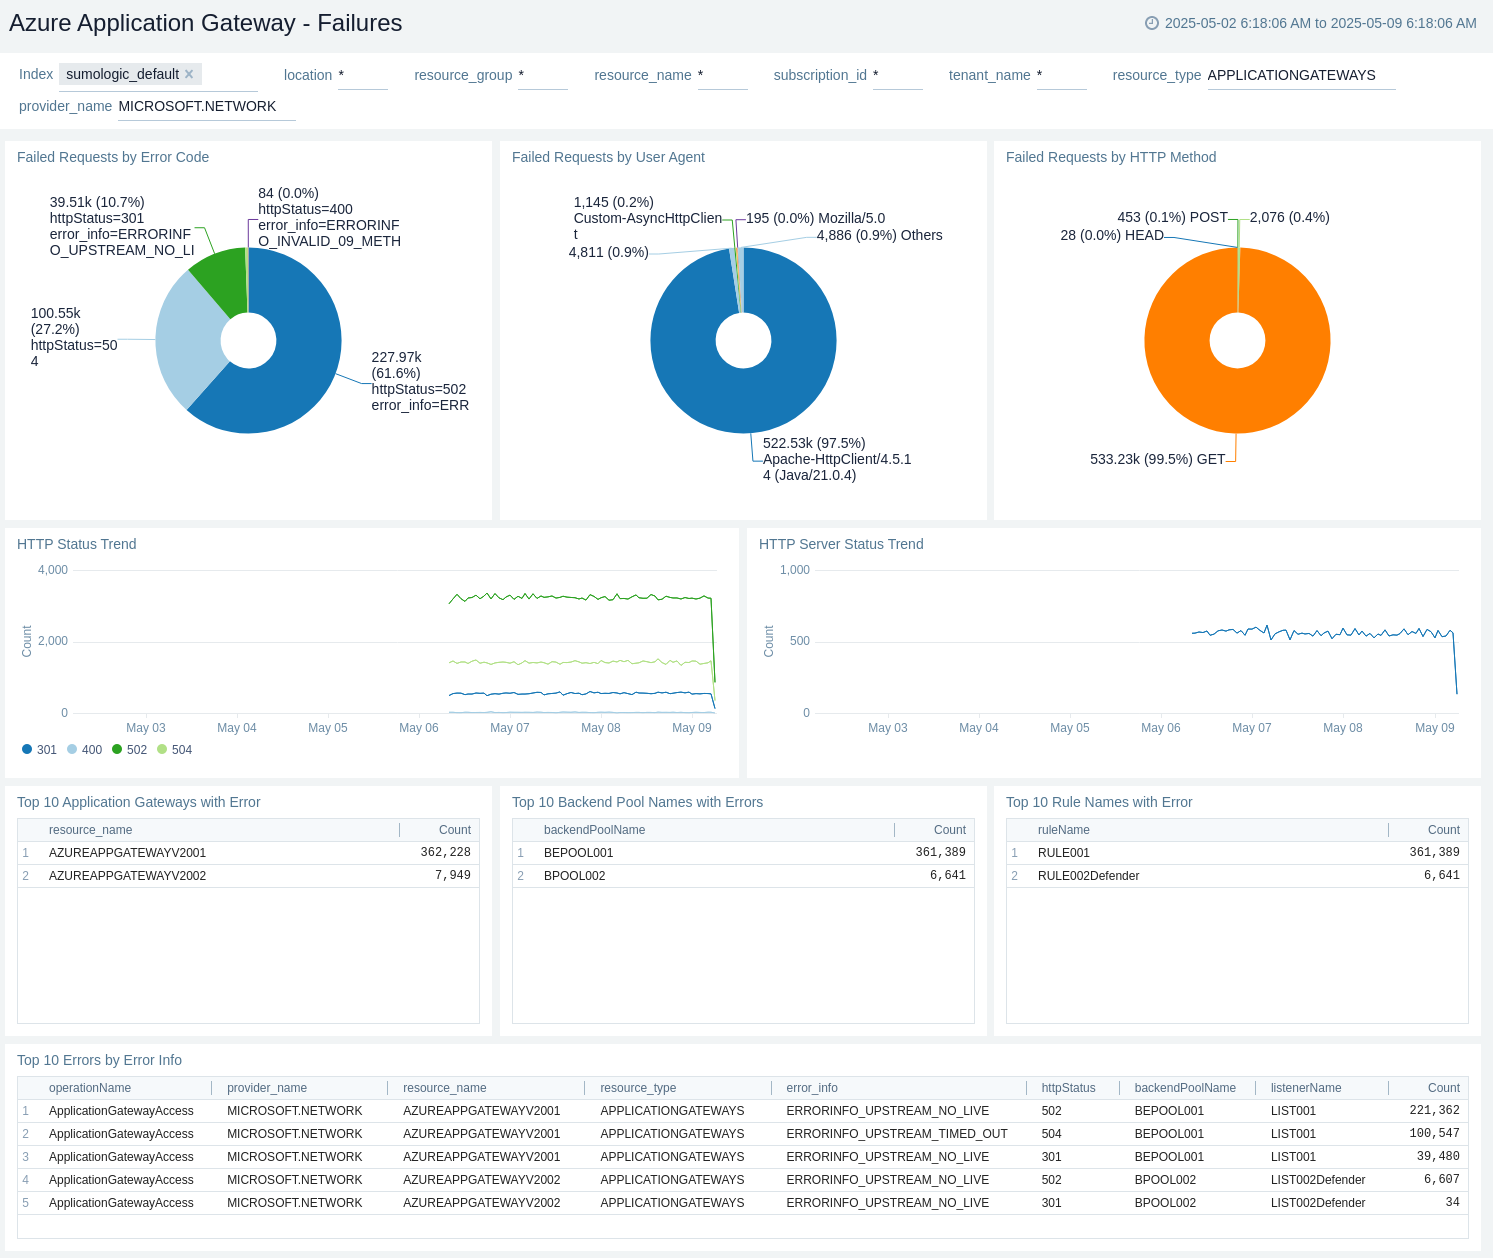
Failures
The Azure Application Gateway - Failures dashboard provides insights like top 10 application gateways with error, top 10 backend pool names with errors, top 10 rule names with error, top 10 errors by error info, chart by error code and error info, and failed requests by user agent and HTTP method.
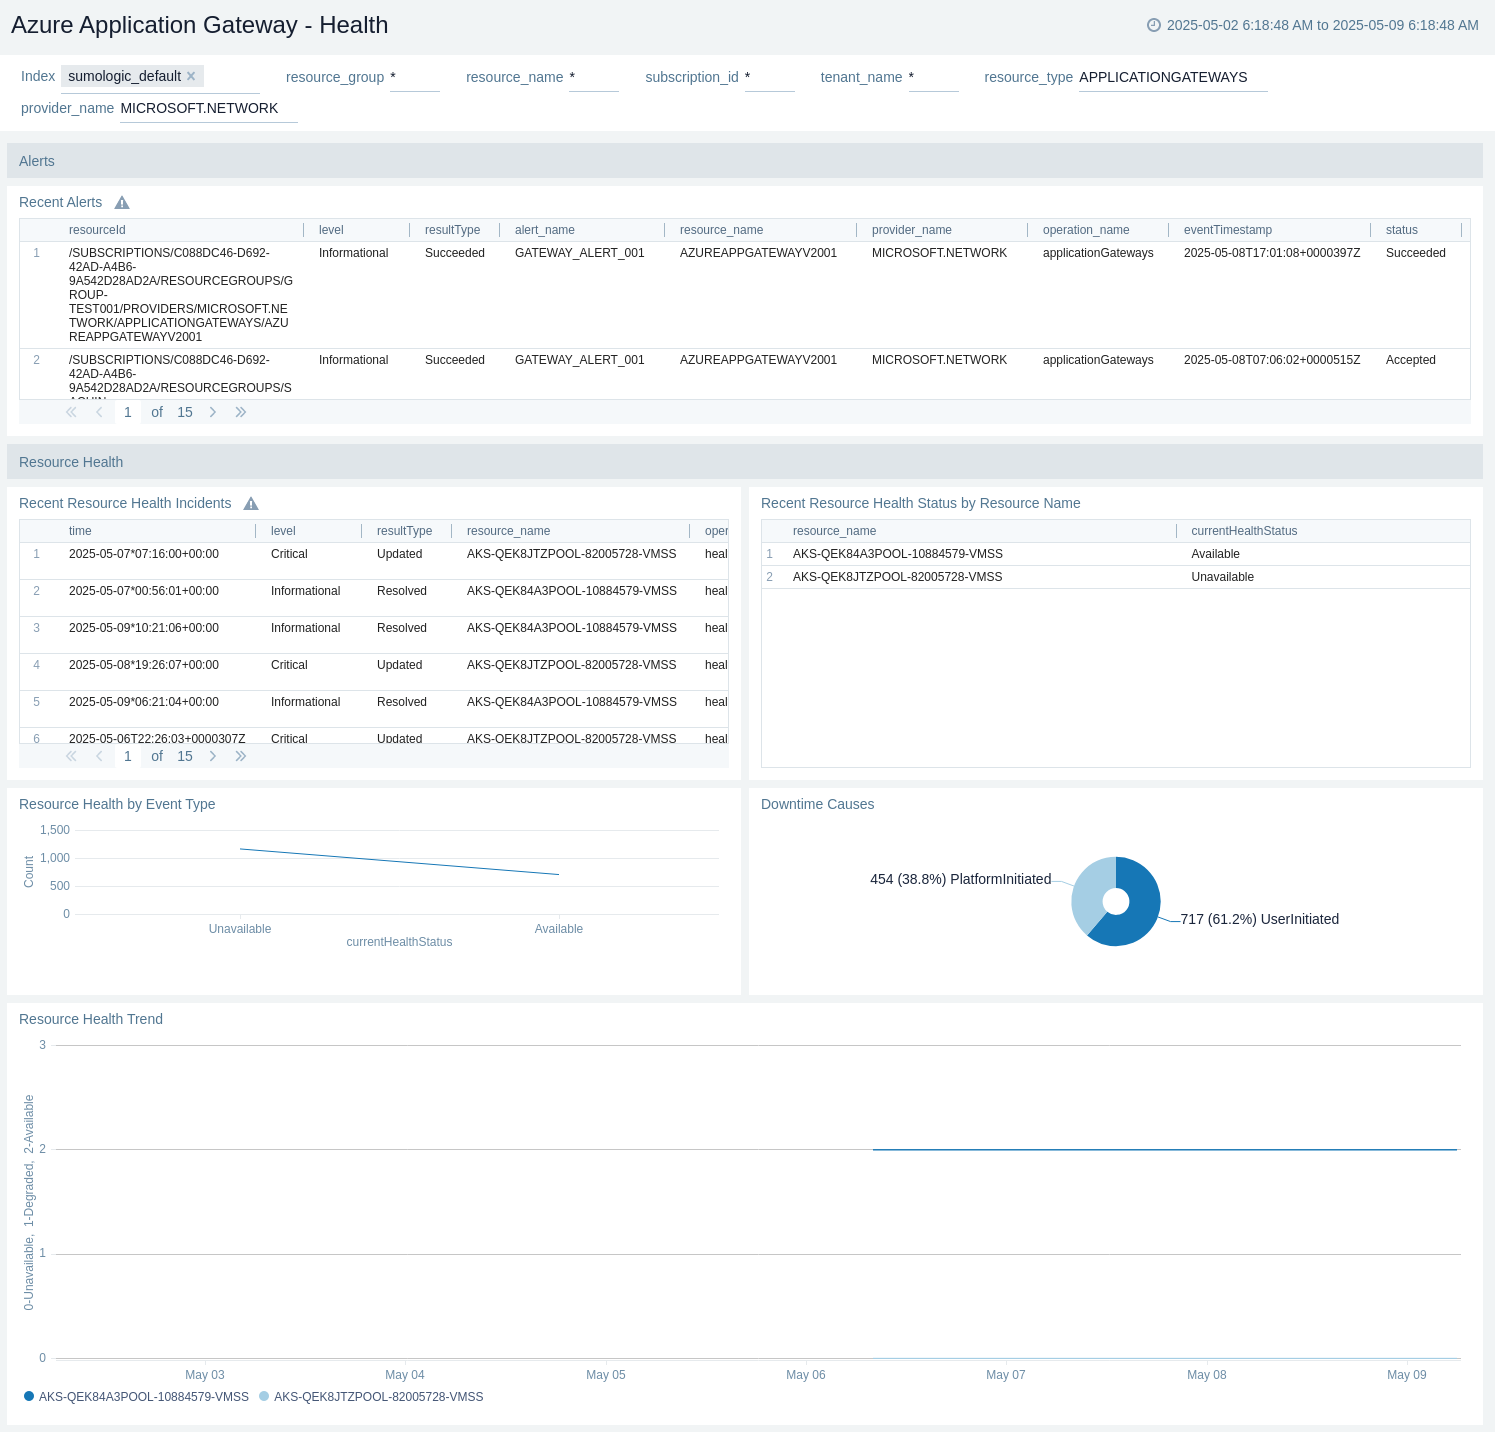
Health
The Azure Application Gateway - Health dashboard provides details like recent alerts, resource health incidents, recent resource health status by resource name, trend by event type, downtime by causes, trend of unavailable, degraded, and available.
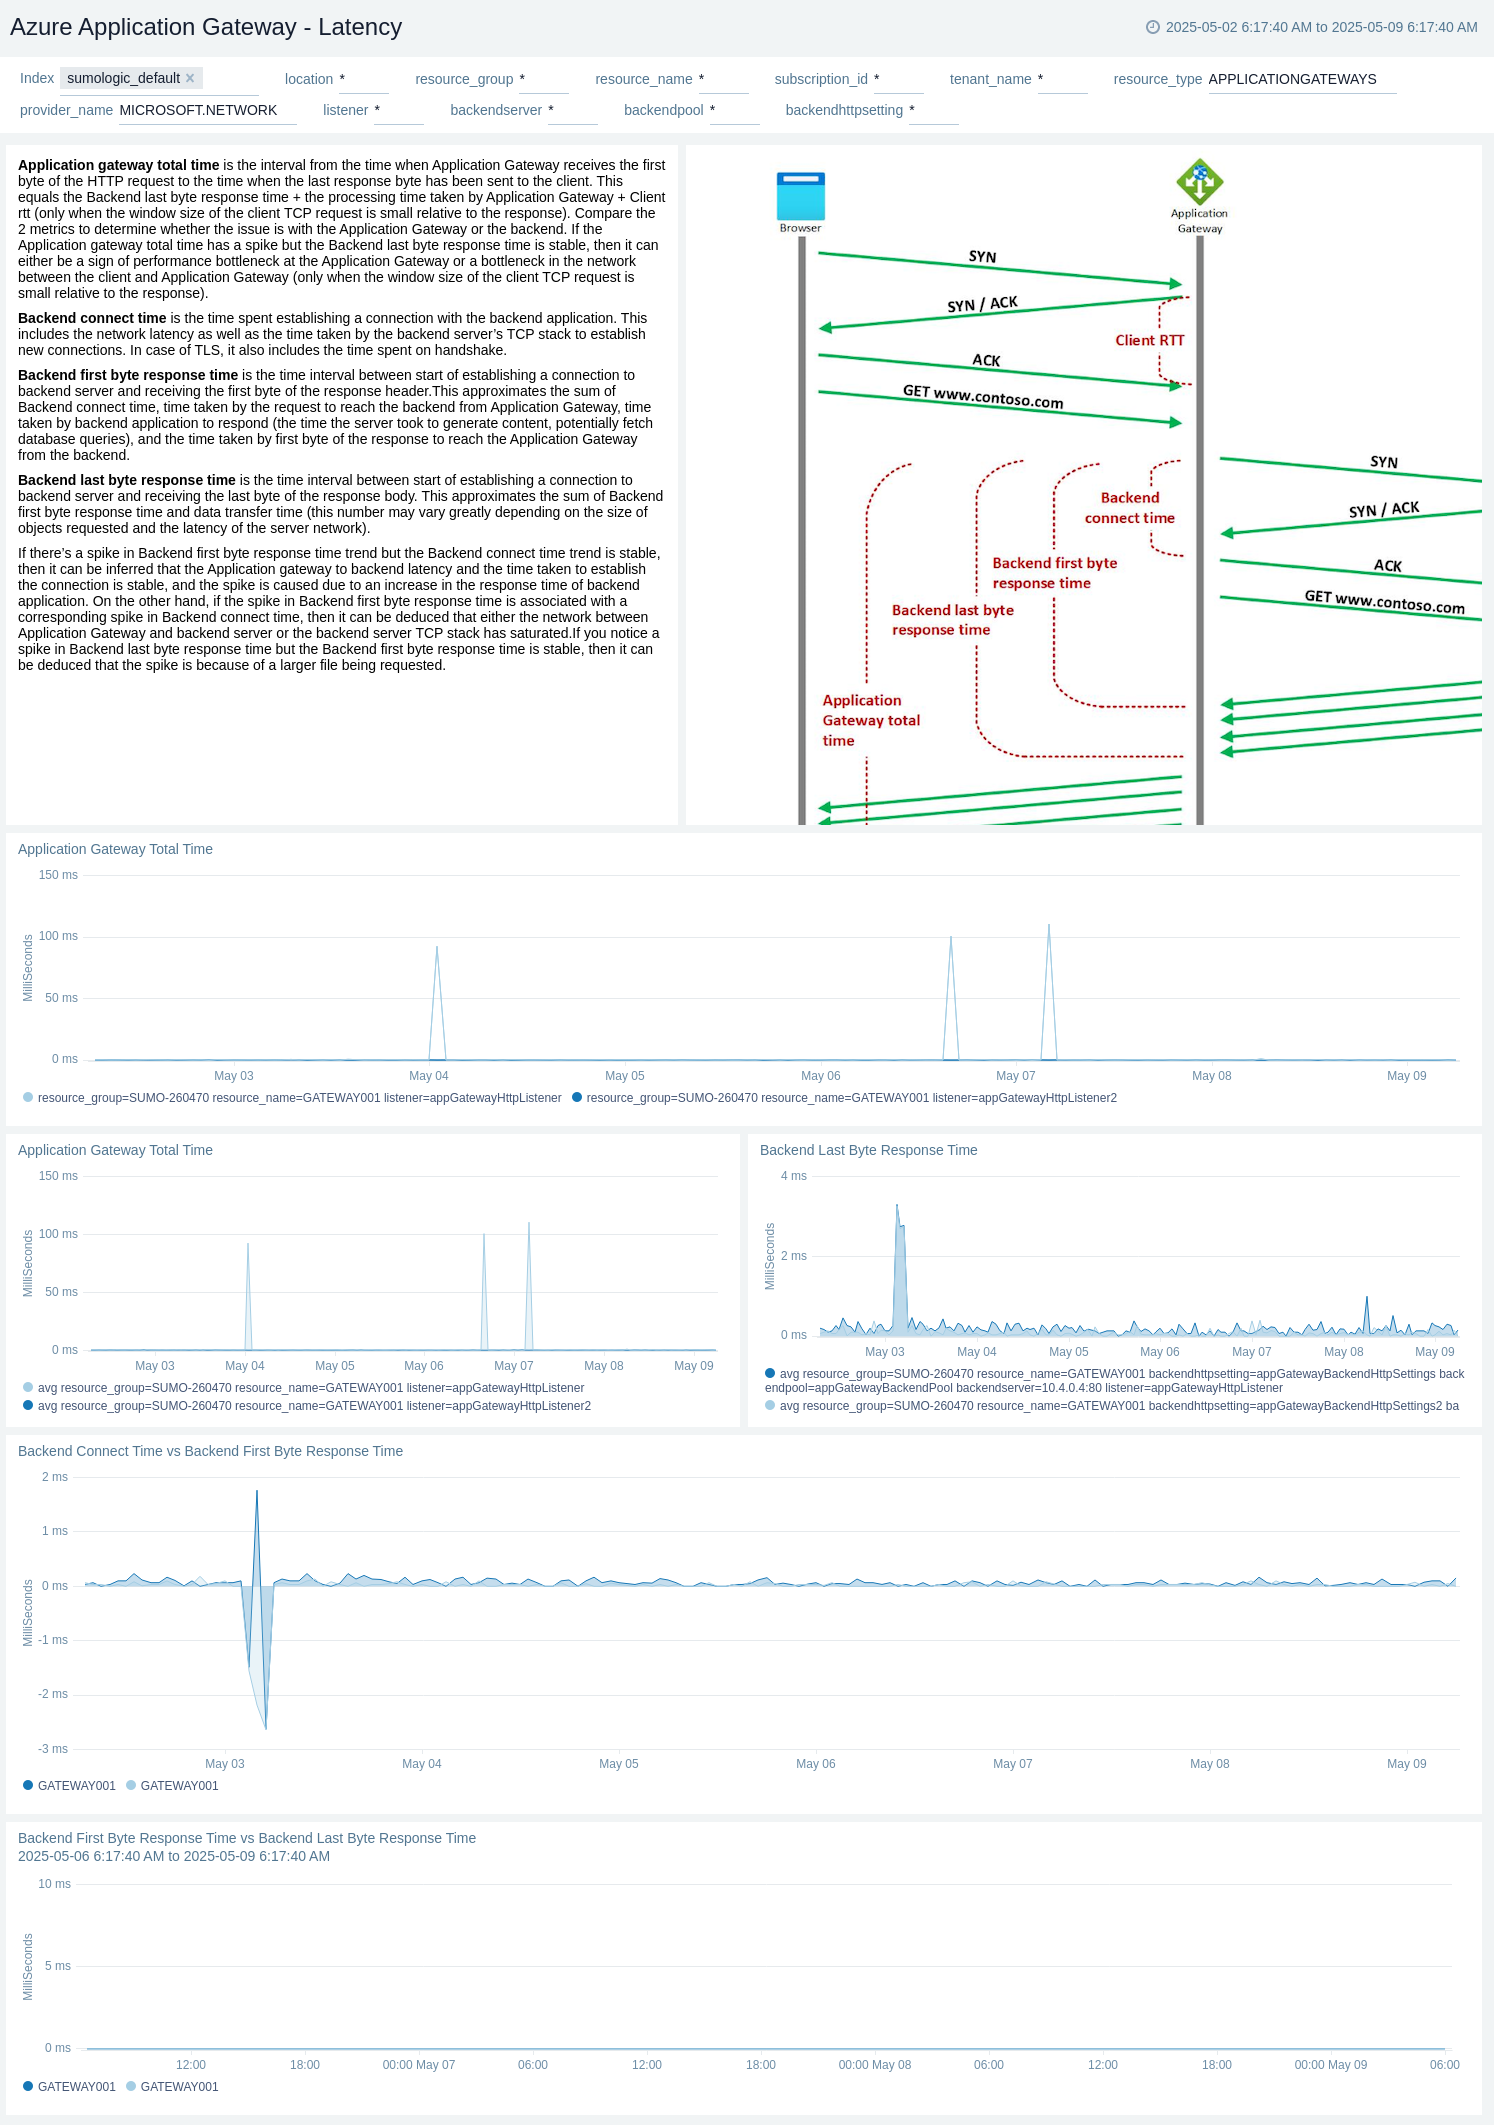
Latency
The Azure Application Gateway - Latency dashboard provides insights into the application gateway total time, application gateway total time versus backend last byte response time, backend connect time versus backend first byte response time, and backend first byte response time versus backend last byte response time.
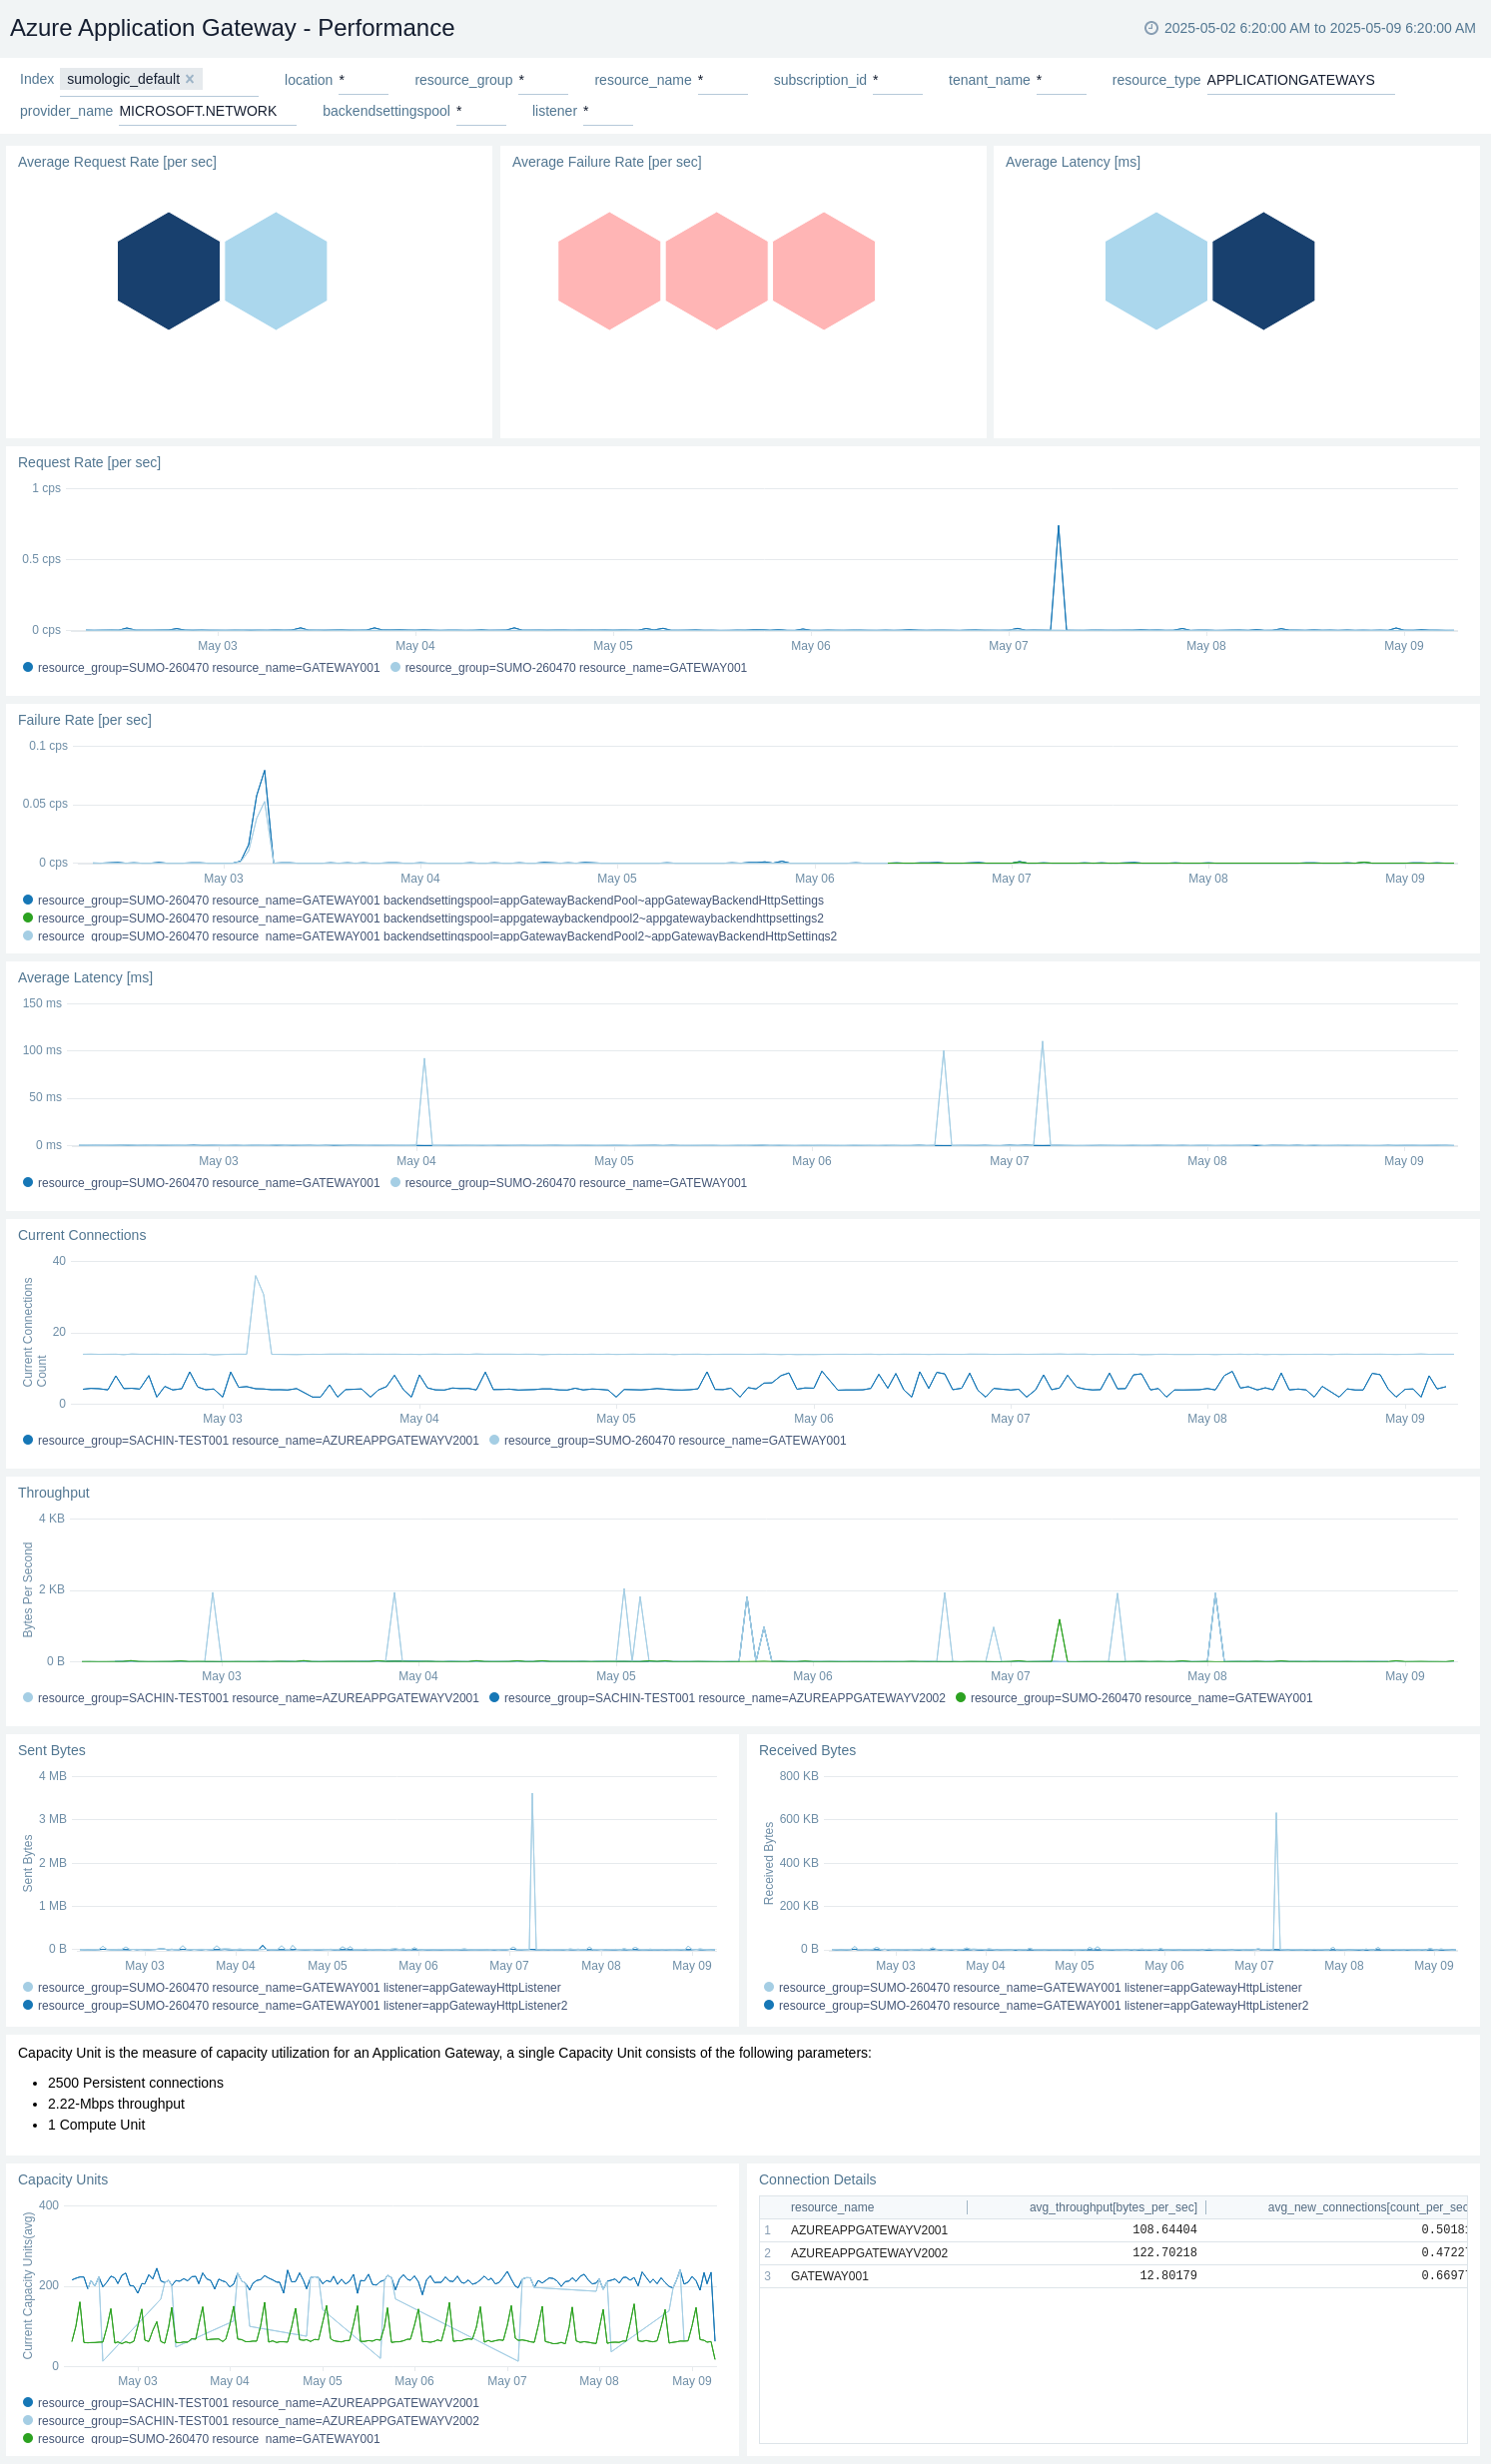
Performance
The Azure Application Gateway - Performance dashboard provides insights into the total request rate, failed request rate, application gateway details, average active connections, capacity units, capacity unit utilization, current connections trend, throughput trend, sent bytes, and received bytes.
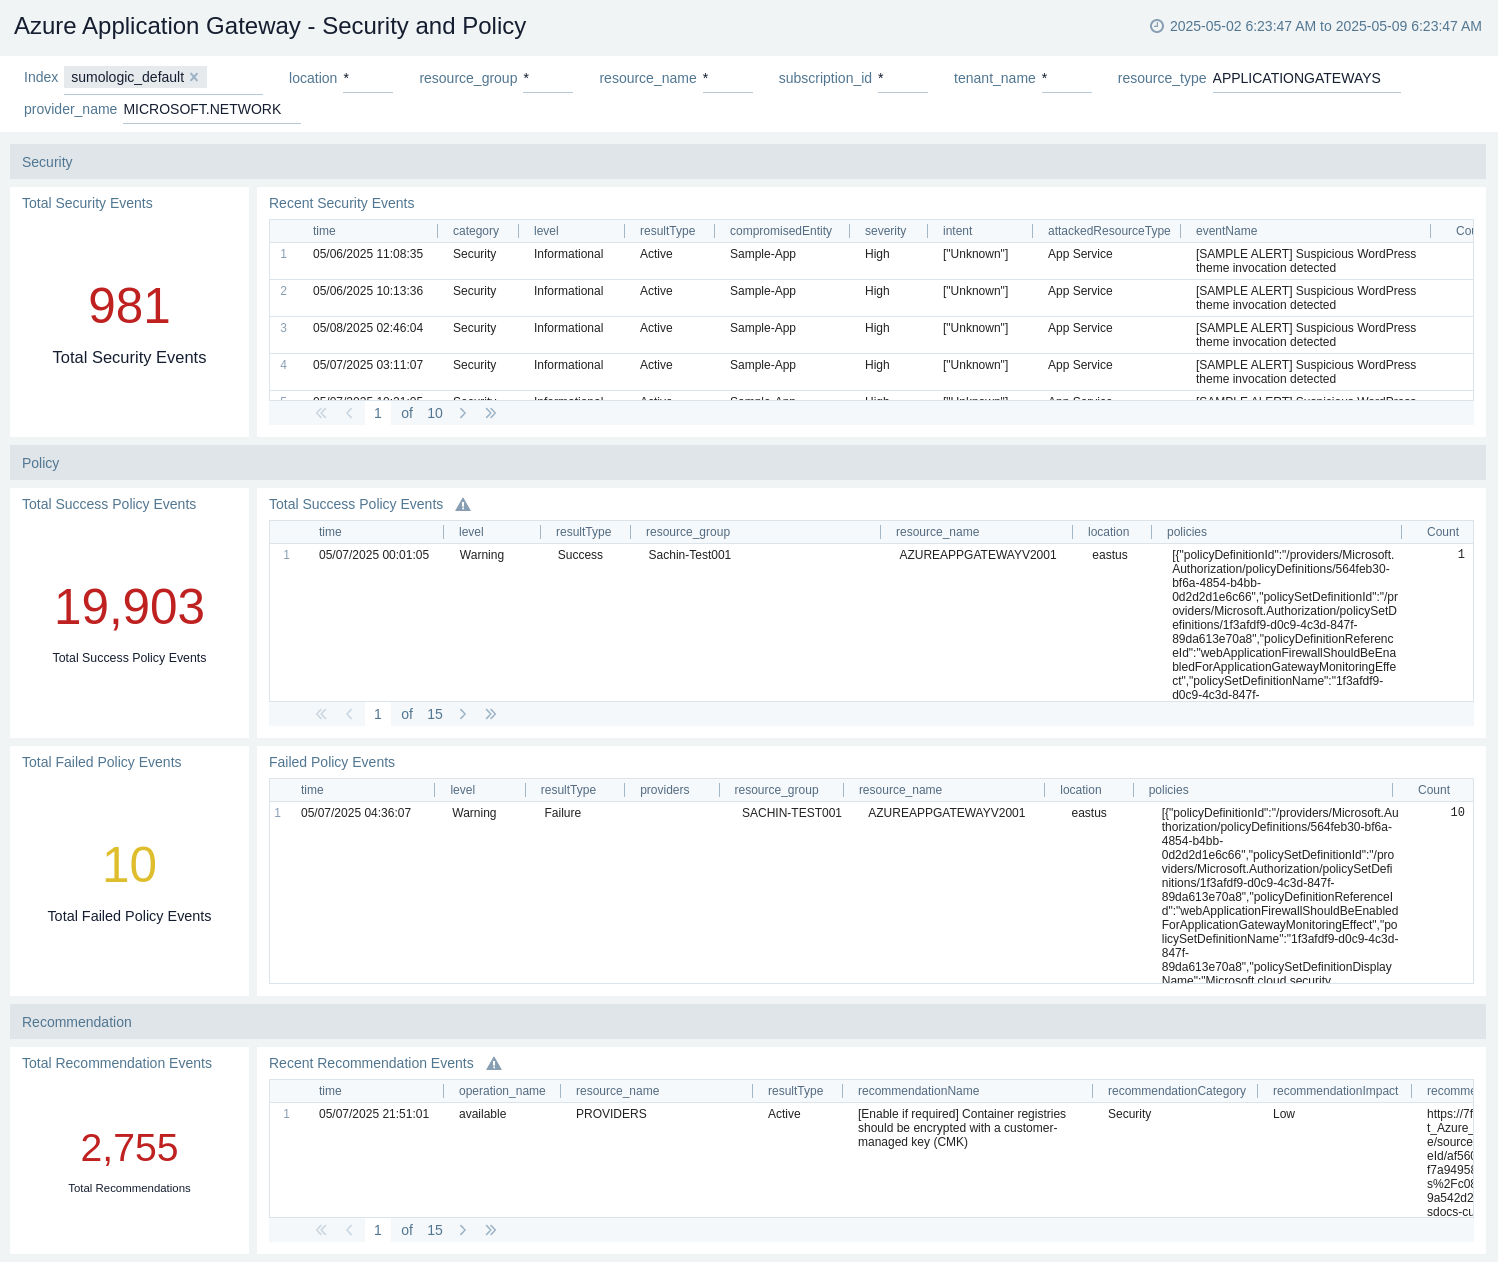
Security and Policy
The Azure Application Gateway - Security and Policy dashboard provides details into the total security events, recent security events, total denied policy events, total success policy events, total failed policy events, total recommendation events, and recent recommendation events.
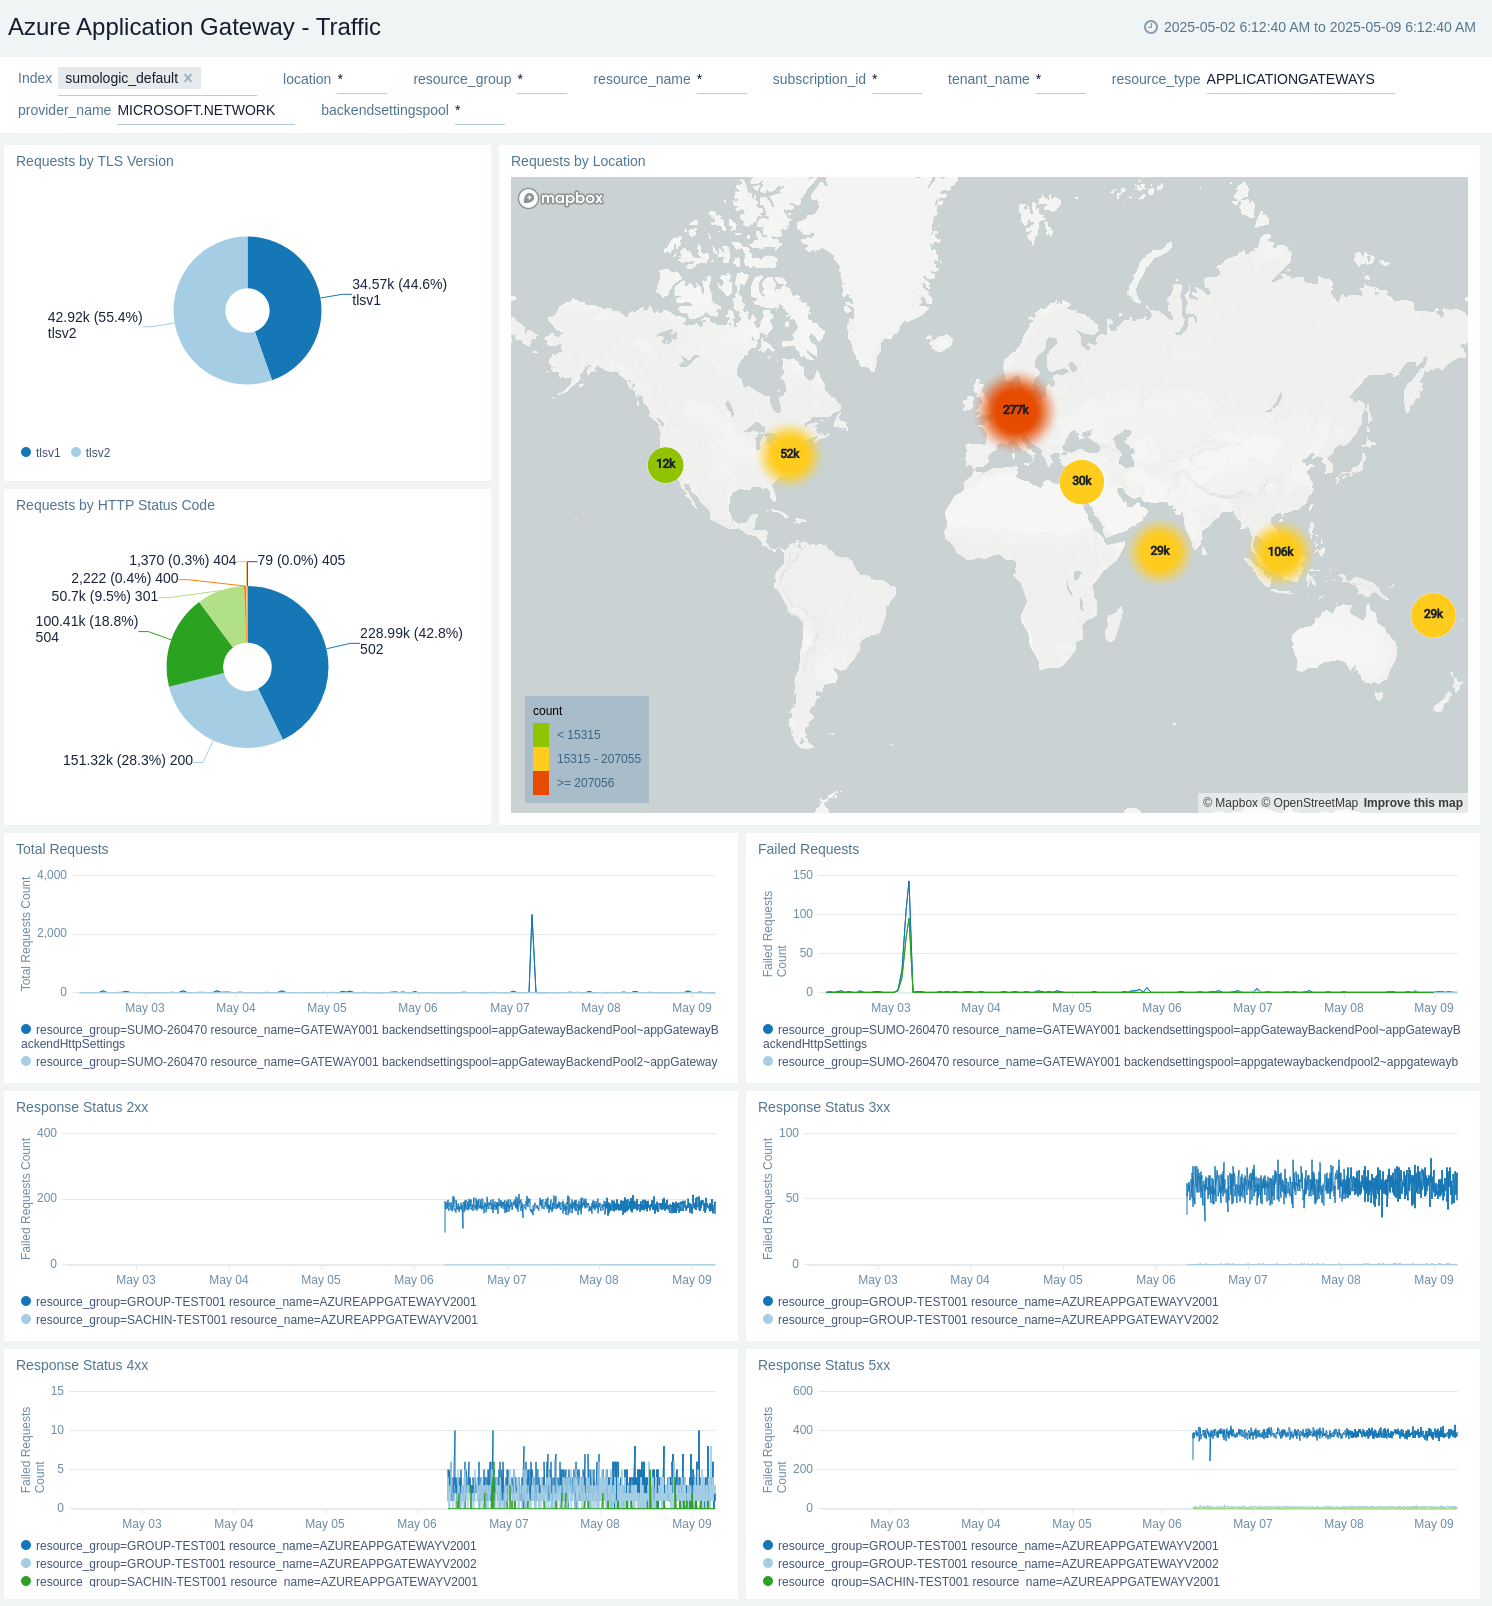
Traffic
The Azure Application Gateway - Traffic dashboard provides details into the requests by client IP location, total requests, failed requests, requests by TLS version, chart by HTTP status code, response status trends for 2xx, 3xx, 4xx, 5xx, and so on.
Upgrade/Downgrade the Azure Application Gateway app (optional)
To update the app, do the following:
Next-Gen App: To install or update the app, you must be an account administrator or a user with Manage Apps, Manage Monitors, Manage Fields, Manage Metric Rules, and Manage Collectors capabilities depending upon the different content types part of the app.
- Select App Catalog.
- In the Search Apps field, search for and then select your app.
Optionally, you can identify apps that can be upgraded in the Upgrade available section. - To upgrade the app, select Upgrade from the Manage dropdown.
- If the upgrade does not have any configuration or property changes, you will be redirected to the Preview & Done section.
- If the upgrade has any configuration or property changes, you will be redirected to the Setup Data page.
- In the Configure section of your respective app, complete the following fields.
- Field Name. If you already have collectors and sources set up, select the configured metadata field name (eg _sourcecategory) or specify other custom metadata (eg: _collector) along with its metadata Field Value.
- Click Next. You will be redirected to the Preview & Done section.
Post-update
Your upgraded app will be installed in the Installed Apps folder and dashboard panels will start to fill automatically.
See our Release Notes changelog for new updates in the app.
To revert the app to a previous version, do the following:
- Select App Catalog.
- In the Search Apps field, search for and then select your app.
- To version down the app, select Revert to < previous version of your app > from the Manage dropdown.
Uninstalling the Azure Application Gateway app (optional)
To uninstall the app, do the following:
- Select App Catalog.
- In the 🔎 Search Apps field, run a search for your desired app, then select it.
- Click Uninstall.
Azure Application Gateway alerts
These alerts are metric based and will work for all Azure Application Gateways.
| Alert Name | Alert Description and Conditions | Alert Condition | Recover Condition |
|---|---|---|---|
Azure Application Gateway - Current Capacity Units | This alert is triggered when Average Capacity Units count is greater than 75. Also, a warning type alert will be triggered when Average Capacity Units count is greater than 65. | percentage >= 75 | percentage < 75 |
Azure Application Gateway - Current Compute Units | This alert is triggered when Average Compute Units count is greater than 75. Also, a warning type alert will be triggered when Average Compute Units count is greater than 65. | percentage >= 75 | percentage < 75 |
Azure Application Gateway - Failed Requests | This alert is triggered when Failed Requests count greater than 1. | Count >= 1 | Count < 1 |
Azure Application Gateway - Healthy Host Count | This alert is triggered when Healthy Host Count is less than 1. | Count < 1 | Count >= 1 |
Azure Application Gateway - UnHealthy Host Count | This alert is triggered when UnHealthy Host Count is greater than 1 | Count >= 1 | Count < 1 |
Troubleshooting
HTTP Logs and Metrics Source used by Azure Functions
To troubleshoot metrics collection, follow the instructions in Collect Metrics from Azure Monitor > Troubleshooting metrics collection.