Azure Front Door

Azure Front Door is Microsoft’s modern cloud Content Delivery Network (CDN) that provides fast, reliable, and secure access between your users and your applications’ static and dynamic web content across the globe. This integration helps in monitoring your application, tracking requests, and identifying performance bottlenecks in your CDN.
Log and metric types
For Azure Front Door, you can collect the following logs and metrics:
- Access logs. These can be used to identify slow requests, determine error rates, and understand how Front Door's caching behavior is working for your solution.
- Web application firewall (WAF) logs. These can be used to detect potential attacks and false positive detections, which indicates legitimate requests that the WAF blocked. For more information on the WAF logs, see Azure Web Application Firewall monitoring and logging.
- Health probe logs. These can be used to identify origins that are unhealthy or that do not respond to requests from some of Front Door's geographically distributed PoPs.
For more information on logs schema, refer to the documentation below:
For more information on metrics, refer to the documentation below. Usage metrics from your CDN endpoint are in the namespaces below:
For more information on supported dimensions, refer to the documentation below:
Setup
Azure service sends monitoring data to Azure Monitor, which can then stream data to Eventhub. Sumo Logic supports:
- Logs collection from Azure Monitor using our Azure Event Hubs source.
- Metrics collection using our HTTP Logs and Metrics source via Azure Functions deployed using the ARM template.
You must explicitly enable diagnostic settings for each Azure Front Door profile you want to monitor. You can forward logs to the same event hub provided they satisfy the limitations and permissions as described here.
When you configure the event hubs source or HTTP source, plan your source category to ease the querying process. A hierarchical approach allows you to make use of wildcards. For example: Azure/FrontDoor/Logs, Azure/FrontDoor/Metrics.
Configure metrics collection
In this section, you will configure a pipeline for shipping metrics from Azure Monitor to an Event Hub, onto an Azure Function, and finally to an HTTP Source on a hosted collector in Sumo Logic.
- Create a hosted collector and tag the
tenant_namefield. You can get the tenant name using the instructions here.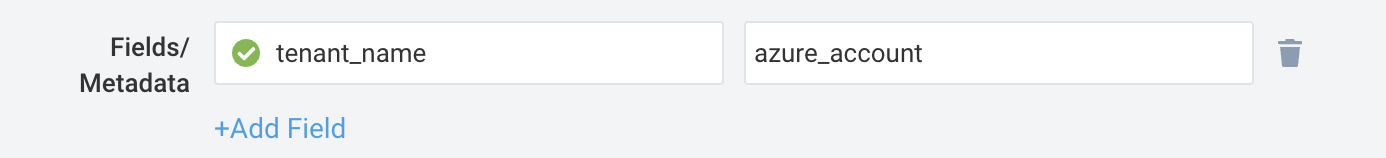
- Configure an HTTP Source.
- Configure and deploy the ARM Template.
- Export metrics to Event Hub. Perform the steps below for each Azure Front Door profile that you want to monitor.
- Choose
Stream to an event hubas the destination. - Select
AllMetrics. - Use the Event hub namespace created by the ARM template in Step 2 above. You can create a new Event hub or use the one created by the ARM template. You can use the default policy
RootManageSharedAccessKeyas the policy name.
- Choose
Configure logs collection
In this section, you will configure a pipeline for shipping diagnostic logs from Azure Monitor to an Event Hub.
- To set up the Azure Event Hubs source in Sumo Logic, refer to Azure Event Hubs Source for Logs.
- To create the Diagnostic settings in the Azure portal, refer to the Azure documentation. Perform the steps below for each Azure Front Door profile that you want to monitor.
- Choose
Stream to an event hubas the destination. - Select the log from
FrontDoorAccessLog, FrontDoorHealthProbeLog, and FrontDoorWebApplicationFirewallLog. - Use the Event hub namespace and Event hub name configured in the previous step in the destination details section. You can use the default policy
RootManageSharedAccessKeyas the policy name.
- Choose
Troubleshooting
HTTP Logs and Metrics Source used by Azure Functions
To troubleshoot metrics collection, follow the instructions in Collect Metrics from Azure Monitor > Troubleshooting metrics collection.