Azure Network Interface
Azure Network Interface (NIC) enables an Azure virtual machine (VM) to communicate with the internet, Azure, and on-premises resources. This integration helps in monitoring packet and data throughput.
Metric types
For Azure Network Interface, you can collect the following metrics:
- Platform Metrics for Azure Network Interface. These metrics are available in Microsoft.Network/networkInterfaces namespace.
Setup
Azure service sends monitoring data to Azure Monitor, which can then stream data to Eventhub. Sumo Logic supports:
- Metrics collection using our HTTP Logs and Metrics source via Azure Functions deployed using the ARM template.
You must explicitly enable diagnostic settings for each Network Interface you want to monitor. You can forward metrics to the same event hub provided they satisfy the limitations and permissions as described here.
When you configure the event hubs source or HTTP source, plan your source category to ease the querying process. A hierarchical approach allows you to make use of wildcards. For example: Azure/NetworkInterface/Metrics.
Configure metrics collection
In this section, you will configure a pipeline for shipping metrics from Azure Monitor to an Event Hub, onto an Azure Function, and finally to an HTTP Source on a hosted collector in Sumo Logic.
- Create a hosted collector and tag the
tenant_namefield. You can get the tenant name using the instructions here.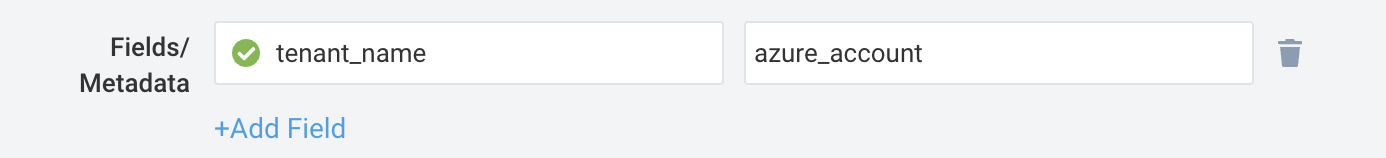
- Configure an HTTP Source.
- Configure and deploy the ARM Template.
- Export metrics to Event Hub. Perform the steps below for each Network Interface that you want to monitor.
- Choose
Stream to an event hubas the destination. - Select
AllMetrics. - Use the Event hub namespace created by the ARM template in Step 2 above. You can create a new Event hub or use the one created by the ARM template. You can use the default policy
RootManageSharedAccessKeyas the policy name.
- Choose
Troubleshooting
HTTP Logs and Metrics Source used by Azure Functions
To troubleshoot metrics collection, follow the instructions in Collect Metrics from Azure Monitor > Troubleshooting metrics collection.