Azure Kubernetes Service
Azure Kubernetes Service (AKS) is a Kubernetes environment with clusters managed by Azure. AKS simplifies deploying and managing container-based applications, while automatically provisioning, upgrading, and scaling resources as needed.
Supported versions
The following are the minimum supported requirements for this application:
| Name | Supported versions |
| Kubernetes | 1.30.10 and later |
Logs and Metric types
The AKS - Control Plane app collects logs for the following Azure Kubernetes Services:
- kube-audit. Contains all Kubernetes API Server audit logs including the events with get and list verbs. These events are useful for monitoring all of the interactions with the Kubernetes API.
- kube-audit-admin. Contains Kubernetes API Server audit logs excluding events with the get and list verbs. These events are useful for monitoring the resource modification requests made to the Kubernetes API.
- kube-apiserver. The API server exposes the underlying Kubernetes APIs. This component provides the interaction for management tools, such as kubectl or the Kubernetes dashboard.
- kube-scheduler. The Scheduler determines what nodes can run the workload when you create or scale applications and then starts them.
- kube-controller-manager. The Controller Manager oversees a number of smaller controllers that perform actions, such as replicating pods and handling node operations.
- cluster-autoscaler. The cluster autoscaler component watches for pods in your cluster that can't be scheduled because of resource constraints. When the cluster autoscaler detects issues, it scales up the number of nodes in the node pool to meet the application demands. It also regularly checks nodes for a lack of running pods and scales down the number of nodes as needed.
Azure Kubernetes Service Metrics are available in Microsoft.ContainerService/managedClusters namespaces.
For more details on Azure Kubernetes Service logs and metrics, refer to the Azure documentation.
Setup
Azure service sends monitoring data to Azure Monitor, which can then stream data to Eventhub.
You must explicitly enable diagnostic settings for each Kubernetes Service you want to monitor. You can forward logs to the same Event Hub provided they satisfy the limitations and permissions as described here.
Sumo Logic supports metrics collection using Azure Metrics Source.
When you configure the Event Hubs source, plan your source category to ease the querying process. A hierarchical approach allows you to make use of wildcards. For example: Azure/AKS/ControlPlane/Logs.
Sample log messages
{
  "category": "kube-audit",
  "operationName": "Microsoft.ContainerService/managedClusters/diagnosticLogs/Read",
  "properties": {
    "pod": "kube-apiserver-57b5944b45-94w49",
    "log": "{\"kind\":\"Event\",\"apiVersion\":\"audit.k8s.io/v1\",\"level\":\"Metadata\",\"auditID\":\"10e60f03-0635-429b-b324-315166f249cc\",\"stage\":\"ResponseComplete\",\"requestURI\":\"/apis/coordination.k8s.io/v1/namespaces/kube-system/leases/external-resizer-file-csi-azure-com\",\"verb\":\"update\",\"user\":{\"username\":\"aksService\",\"groups\":[\"system:masters\",\"system:authenticated\"]},\"sourceIPs\":[\"172.31.35.83\"],\"userAgent\":\"csi-resizer/v0.0.0 (linux/amd64) kubernetes/$Format\",\"objectRef\":{\"resource\":\"leases\",\"namespace\":\"kube-system\",\"name\":\"external-resizer-file-csi-azure-com\",\"uid\":\"b382c78f-c5fa-462b-8f20-ab65ad94c153\",\"apiGroup\":\"coordination.k8s.io\",\"apiVersion\":\"v1\",\"resourceVersion\":\"6910081\"},\"responseStatus\":{\"metadata\":{},\"code\":200},\"requestReceivedTimestamp\":\"2025-04-20T16:29:59.988453Z\",\"stageTimestamp\":\"2025-04-20T16:29:59.994988Z\",\"annotations\":{\"authorization.k8s.io/decision\":\"allow\",\"authorization.k8s.io/reason\":\"\"}}\n",
    "stream": "stdout",
    "containerID": "5aeef33b3cfdafa517d8e1d8c4fe4e08901d99958bc6ad3ca5c74891120a0c44"
  },
  "resourceId": "/SUBSCRIPTIONS/C088DC46-D692-42AD-A4B6-9A542D28AD2A/RESOURCEGROUPS/HPALAKSCLUSTER/PROVIDERS/MICROSOFT.CONTAINERSERVICE/MANAGEDCLUSTERS/ARC-CLUSTER02",
  "serviceBuild": "na",
  "time": "2025-04-20T16:29:59.995191417Z"
}
{
  "category": "kube-audit-admin",
  "operationName": "Microsoft.ContainerService/managedClusters/diagnosticLogs/Read",
  "properties": {
    "pod": "kube-apiserver-6785696748-ck9d8",
    "log": "{\"kind\":\"Event\",\"apiVersion\":\"audit.k8s.io/v1\",\"level\":\"RequestResponse\",\"auditID\":\"2fe81725-6f88-417a-ae6f-ddb634e3c0ee\",\"stage\":\"ResponseComplete\",\"requestURI\":\"/apis/authorization.k8s.io/v1/subjectaccessreviews\",\"verb\":\"create\",\"user\":{\"username\":\"system:node:aks-hpalakspool-35907486-vmss000006\",\"groups\":[\"system:nodes\",\"system:authenticated\"]},\"sourceIPs\":[\"135.237.48.19\"],\"userAgent\":\"kubelet/v1.30.10 (linux/amd64) kubernetes/ccc6907\",\"objectRef\":{\"resource\":\"subjectaccessreviews\",\"apiGroup\":\"authorization.k8s.io\",\"apiVersion\":\"v1\"},\"responseStatus\":{\"metadata\":{},\"code\":201},\"requestObject\":{\"kind\":\"SubjectAccessReview\",\"apiVersion\":\"authorization.k8s.io/v1\",\"metadata\":{\"creationTimestamp\":null},\"spec\":{\"resourceAttributes\":{\"verb\":\"get\",\"version\":\"v1\",\"resource\":\"nodes\",\"subresource\":\"proxy\",\"name\":\"aks-hpalakspool-35907486-vmss000006\"},\"user\":\"system:serviceaccount:kube-system:ama-logs\",\"groups\":[\"system:serviceaccounts\",\"system:serviceaccounts:kube-system\",\"system:authenticated\"],\"extra\":{\"authentication.kubernetes.io/credential-id\":[\"JTI=868e8737-7074-4e55-a0a1-f8b11c24737a\"],\"authentication.kubernetes.io/node-name\":[\"aks-hpalakspool-35907486-vmss000006\"],\"authentication.kubernetes.io/node-uid\":[\"50568ddf-904a-4aba-9d59-4289ebf66fb2\"],\"authentication.kubernetes.io/pod-name\":[\"ama-logs-xglbr\"],\"authentication.kubernetes.io/pod-uid\":[\"2d289f6f-3364-4e41-89b0-b1cef5484151\"]},\"uid\":\"c2f85d8b-5589-463d-9221-8396d3b3c8b3\"},\"status\":{\"allowed\":false}},\"responseObject\":{\"kind\":\"SubjectAccessReview\",\"apiVersion\":\"authorization.k8s.io/v1\",\"metadata\":{\"creationTimestamp\":null,\"managedFields\":[{\"manager\":\"kubelet\",\"operation\":\"Update\",\"apiVersion\":\"authorization.k8s.io/v1\",\"time\":\"2025-04-20T16:32:59Z\",\"fieldsType\":\"FieldsV1\",\"fieldsV1\":{\"f:spec\":{\"f:extra\":{\".\":{},\"f:authentication.kubernetes.io/credential-id\":{},\"f:authentication.kubernetes.io/node-name\":{},\"f:authentication.kubernetes.io/node-uid\":{},\"f:authentication.kubernetes.io/pod-name\":{},\"f:authentication.kubernetes.io/pod-uid\":{}},\"f:groups\":{},\"f:resourceAttributes\":{\".\":{},\"f:name\":{},\"f:resource\":{},\"f:subresource\":{},\"f:verb\":{},\"f:version\":{}},\"f:uid\":{},\"f:user\":{}}}}]},\"spec\":{\"resourceAttributes\":{\"verb\":\"get\",\"version\":\"v1\",\"resource\":\"nodes\",\"subresource\":\"proxy\",\"name\":\"aks-hpalakspool-35907486-vmss000006\"},\"user\":\"system:serviceaccount:kube-system:ama-logs\",\"groups\":[\"system:serviceaccounts\",\"system:serviceaccounts:kube-system\",\"system:authenticated\"],\"extra\":{\"authentication.kubernetes.io/credential-id\":[\"JTI=868e8737-7074-4e55-a0a1-f8b11c24737a\"],\"authentication.kubernetes.io/node-name\":[\"aks-hpalakspool-35907486-vmss000006\"],\"authentication.kubernetes.io/node-uid\":[\"50568ddf-904a-4aba-9d59-4289ebf66fb2\"],\"authentication.kubernetes.io/pod-name\":[\"ama-logs-xglbr\"],\"authentication.kubernetes.io/pod-uid\":[\"2d289f6f-3364-4e41-89b0-b1cef5484151\"]},\"uid\":\"c2f85d8b-5589-463d-9221-8396d3b3c8b3\"},\"status\":{\"allowed\":true,\"reason\":\"RBAC: allowed by ClusterRoleBinding \\\"amalogsclusterrolebinding\\\" of ClusterRole \\\"ama-logs-reader\\\" to ServiceAccount \\\"ama-logs/kube-system\\\"\"}},\"requestReceivedTimestamp\":\"2025-04-20T16:32:59.930178Z\",\"stageTimestamp\":\"2025-04-20T16:32:59.965028Z\",\"annotations\":{\"authorization.k8s.io/decision\":\"allow\",\"authorization.k8s.io/reason\":\"\",\"mutation.webhook.admission.k8s.io/round_0_index_3\":\"{\\\"configuration\\\":\\\"gatekeeper-mutating-webhook-configuration\\\",\\\"webhook\\\":\\\"mutation.gatekeeper.sh\\\",\\\"mutated\\\":false}\"}}\n",
    "containerID": "aade0efa67ae96e18ba9b9b1ccacb5a32a924713ac34947b2475fb8d494b14b7",
    "stream": "stdout"
  },
  "resourceId": "/SUBSCRIPTIONS/C088DC46-D692-42AD-A4B6-9A542D28AD2A/RESOURCEGROUPS/HPALAKSCLUSTER/PROVIDERS/MICROSOFT.CONTAINERSERVICE/MANAGEDCLUSTERS/HPALDEVCLUSTER",
  "serviceBuild": "na",
  "time": "2025-04-20T16:32:59.965276841Z"
}
{
  "operationName":"Microsoft.ContainerService/managedClusters/diagnosticLogs/Read",
  "category":"kube-apiserver",
  "resourceId":"/SUBSCRIPTIONS/C111111-DXXX-4XXX-AXXX-900000000/RESOURCEGROUPS/AG-AKS-RG/PROVIDERS/MICROSOFT.CONTAINERSERVICE/MANAGEDCLUSTERS/AG-AKS-CLUSTER",
  "properties":
  {
    "log":"I0624 20:14:59.855669       1 wrap.go:47] PUT /api/v1/namespaces/kube-system/endpoints/kube-scheduler?timeout=10s:(9.05251ms) 200 [hyperkube/v1.12.8 (linux/amd64) kubernetes/a89f8c1/leader-election 172.31.1.1:48110]",
    "stream":"stderr",
    "pod":"kube-apiserver-796bd9b775-xqk5s",
    "containerID":"2d6cac1300da3226323fd1b936fe8278b87cba2b7a1bbd9c8401da6f8e786f5e"
  },
  "time":"2019-06-24T20:14:59.000Z"
}
{
"operationName":"Microsoft.ContainerService/managedClusters/diagnosticLogs/Read",
"category":"kube-scheduler",
"resourceId":"/SUBSCRIPTIONS/C111111-DXXX-4XXX-AXXX-900000000/RESOURCEGROUPS/AG-AKS-RG/PROVIDERS/MICROSOFT.CONTAINERSERVICE/MANAGEDCLUSTERS/AG-AKS-CLUSTER",
"properties":
{
  "log":"W0622 22:50:25.377565       1 reflector.go:256] k8s.io/client-go/informers/factory.go:131:watch of *v1.StorageClass ended with: too old resource version: 3828720 (3970094)",
  "stream":"stderr",
  "pod":"kube-scheduler-744886667c-cxnvk",
  "containerID":"6093b28d82e1f850fb5a9f59ed8c31aa7179e8a3907449dcd2450a6605341a60"
},
"time":"2019-06-22T22:50:25.000Z"
}
{
"operationName":"Microsoft.ContainerService/managedClusters/diagnosticLogs/Read",
"category":"kube-controller-manager",
"resourceId":"/SUBSCRIPTIONS/C111111-DXXX-4XXX-AXXX-900000000/RESOURCEGROUPS/AG-AKS-RG/PROVIDERS/MICROSOFT.CONTAINERSERVICE/MANAGEDCLUSTERS/AG-AKS-CLUSTER",
"properties":
{
  "log":"I0624 07:27:25.9763861 event.go:221] Event(v1.ObjectReference{Kind:\"DaemonSet\",Namespace:\"kube-system\", Name:\"kube-proxy\", UID:\"2dfb3905-7dac-11e9-b60d-0a58ac1f01f6\",APIVersion:\"apps/v1\", ResourceVersion:\"4150266\", FieldPath:\"\"}): type: 'Normal'reason: 'SuccessfulCreate' Created pod: kube-proxy-xhmv7",
  "stream":"stderr",
  "pod":"kube-controller-manager-59fd65c5bd-694kh",
  "containerID":"667b540db41b66e914ca2ed496e0bef6d4a0b73fc832f5d5eba958d8a56a5e93"
},
"time":"2019-06-24T07:27:25.000Z"
}
{
  "category": "cluster-autoscaler",
  "operationName": "Microsoft.ContainerService/managedClusters/diagnosticLogs/Read",
  "properties": {
    "pod": "cluster-autoscaler-d8b5f9b95-cp67l",
    "stream": "stderr",
    "log": "I0420 16:36:52.392437       1 orchestrator.go:397] ScaleUpToNodeGroupMinSize: scale up not needed\n",
    "containerID": "643aa914e880db7c1c12d3454f375c850ec0af8e9717414b01cbf5d165017672"
  },
  "resourceId": "/SUBSCRIPTIONS/C088DC46-D692-42AD-A4B6-9A542D28AD2A/RESOURCEGROUPS/HPALAKSCLUSTER/PROVIDERS/MICROSOFT.CONTAINERSERVICE/MANAGEDCLUSTERS/HPALDEVCLUSTER",
  "serviceBuild": "na",
  "time": "2025-04-20T16:36:52.392502188Z"
}
Sample queries
tenant_name={{tenant_name}} subscription_id={{subscription_id}} resource_group = {{resource_group}} resource_name={{resource_name}} provider_name={{provider_name}} resource_type={{resource_type}} ("kube-audit")
| json "category", "properties.log", "properties.pod" as category, log, pod
| where category="kube-audit" and pod matches "{{pod}}"
| json field=log "kind","stage", "verb","userAgent","responseStatus.code", "objectRef.resource", "objectRef.namespace", "user.username" as kind, stage, verb, userAgent, status_code, resource, namespace, username
| where (status_code<200 or status_code>=300) and namespace matches "{{namespace}}" and resource matches "{{resource}}" and username matches "{{username}}"
| count by verb
| order by _count, verb
tenant_name={{tenant_name}} subscription_id={{subscription_id}} resource_group = {{resource_group}} resource_name={{resource_name}} provider_name={{provider_name}} resource_type={{resource_type}} ("kube-audit-admin")
| json "category", "properties.log", "properties.pod" as category, log, pod
| where category="kube-audit-admin" and pod matches "{{pod}}"
| json field=log "kind","stage", "verb","userAgent","responseStatus.code", "objectRef.resource", "objectRef.namespace" as kind, stage, verb, userAgent, status_code, resource, namespace
| where (status_code<200 or status_code>=300) and namespace matches "{{namespace}}" and resource matches "{{resource}}"
| count by verb
| order by _count, verb
tenant_name={{tenant_name}} subscription_id={{subscription_id}} resource_group={{resource_group}} resource_name={{resource_name}} provider_name={{provider_name}} resource_type={{resource_type}} location={{location}} method (timeout or abort) ("kube-apiserver")
| json "properties.log", "category", "time", "properties.pod" as log, category, time, pod
| where category ="kube-apiserver" and pod matches "{{pod}}"
| parse regex field=log ".*method=(?<method>\S+)\sURI=\"(?<uri>\S+)\".*"
| count by uri
| sort by uri desc
tenant_name={{tenant_name}} subscription_id={{subscription_id}} resource_group = {{resource_group}} resource_name={{resource_name}} provider_name={{provider_name}} resource_type={{resource_type}} ("kube-controller-manager")
| json "properties.log", "category", "time", "properties.pod", "resourceId" as log, category, time, pod, resourceId
| where category ="kube-controller-manager" and pod matches "{{pod}}"
| parse regex field=log "(?<severity>W|I|F|E)(?<tt>[\S]+) (?<times>[\d:.]+)[\s]+(?<log_msg>.*)"
| count by severity
| sort by _count
tenant_name={{tenant_name}} subscription_id={{subscription_id}} resource_group = {{resource_group}} resource_name={{resource_name}} provider_name={{provider_name}} resource_type={{resource_type}} "kube-scheduler"
| json "properties.log", "category", "time", "properties.pod" as log, category, time, pod
| where category ="kube-scheduler" and pod matches "{{pod}}"
| parse regex field=log "(?<severity>W|I|F|E)(?<tt>[\S]+) (?<times>[\d:.]+)[\s]+(?<log_msg>.*)"
| timeslice 1h
| count by _timeslice, severity
| transpose row _timeslice column severity
| fillmissing timeslice(1h)
tenant_name={{tenant_name}} subscription_id={{subscription_id}} resource_group={{resource_group}} resource_name={{resource_name}} provider_name={{provider_name}} resource_type={{resource_type}} ("cluster-autoscaler")
| json "properties.log", "category", "properties.pod", "resourceId" as log, category, pod, resourceId
| where category ="cluster-autoscaler" and pod matches "{{pod}}"
| parse regex field=log "(?<severity>W|I|F|E)(?<tt>[\S]+) (?<times>[\d:.]+)[\s]+(?<log_msg>.*)"
| count by severity
| sort by _count
Configure collector
Create a hosted collector if not already configured and tag the tenant_name field. You can get the tenant name using the instructions here. Make sure you create the required sources in this collector. 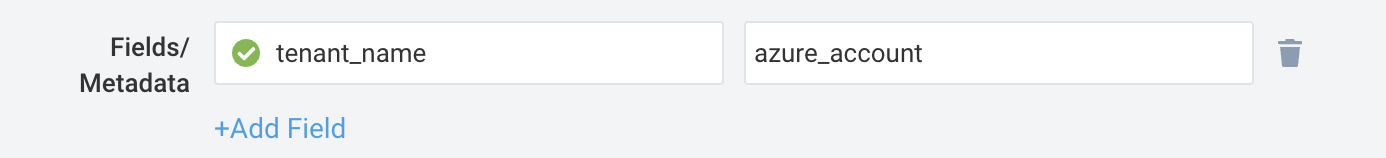
Configure metrics collection
To set up the Azure Metrics source in Sumo Logic, refer to Azure Metrics Source.
Collecting logs for the Azure Kubernetes Cluster
This section walks you through the process of configuring a pipeline to send logs from Azure Monitor to Sumo Logic.
-
To set up the logs collection in Sumo Logic, refer to Azure Event Hubs Source for Logs.
Enable the Kubernetes master node logs in Azure Kubernetes Service to send logs to an Event Hub.
-
Push logs from Azure Monitor to Event Hub.
- Sign in to Azure Portal.
- Go to Kubernetes Services. Select your AKS cluster from which you want to collect logs.
- In the Monitoring Section, the Diagnostic Settings blade displays any existing settings. Click Edit Setting if you want to change your existing settings, or click Add diagnostic setting to add a new one. You can have a maximum of three settings.
- Enter a name.
- Check the Stream to an event hub box and click Event hub / Configure.
- Select an Azure subscription.
- Event hub namespace. If you have chosen Method 1 (Azure Event Hubs Source) for collecting logs, select the EventHubNamespace created manually, or else if you have chosen Method 2 (Collect logs from Azure monitor using Azure functions), then select
SumoAzureLogsNamespace<UniqueSuffix>namespace created by the ARM template. - Event hub name (optional). If you have chosen Method 1 (Azure Event Hub Source) for collecting logs, select the event hub name, which you created manually, or if you have chosen Method 2 (Collect logs from Azure monitor using Azure functions), then select insights-operational-logs.
- Select RootManageSharedAccessKey from Select event hub policy name dropdown.
- Select the checkbox for log types under Categories which you want to ingest.
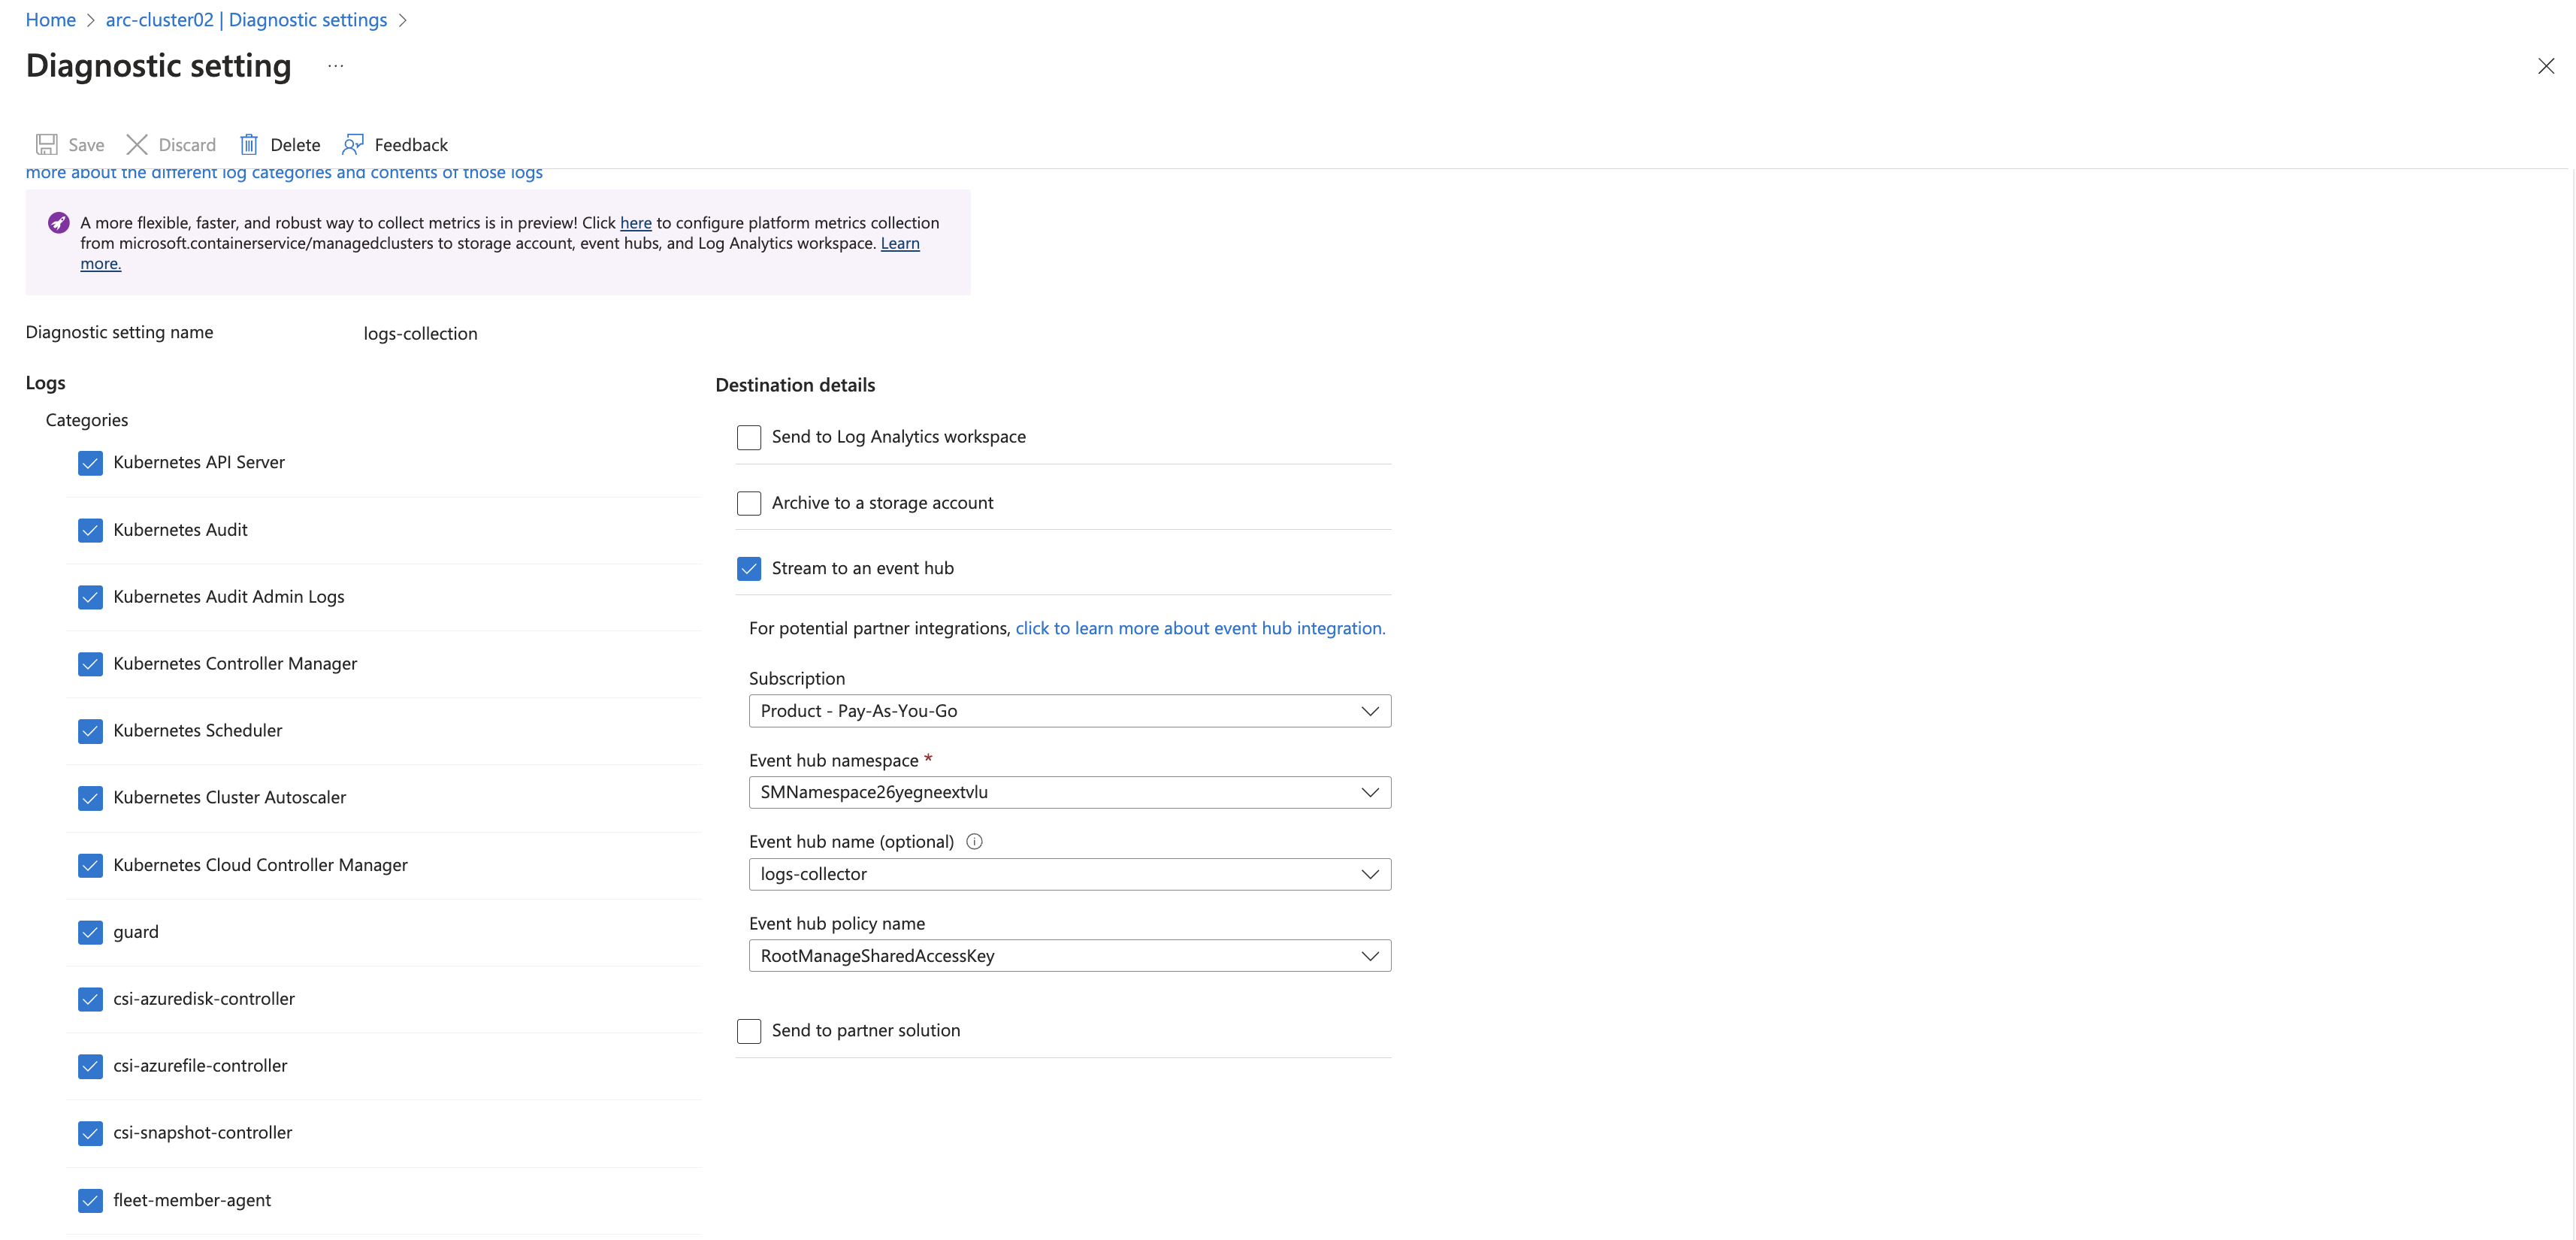
- Click Save.
Installing the Azure Kubernetes Service app
Now that you have set up collection for Azure Kubernetes Cluster, you can install the Sumo Logic app for Azure Kubernetes Service and access the pre-configured Kubernetes dashboards for visibility into your Azure Kubernetes Service environment from a single-pane-of-glass.
All the dashboards are linked to the Kubernetes views so they can be easily accessed by clicking the Cluster in the navigation pane of the tab.
To install the app, do the following:
Next-Gen App: To install or update the app, you must be an account administrator or a user with Manage Apps, Manage Monitors, Manage Fields, Manage Metric Rules, and Manage Collectors capabilities depending upon the different content types part of the app.
- Select App Catalog.
- In the 🔎 Search Apps field, run a search for your desired app, then select it.
- Click Install App.
note
Sometimes this button says Add Integration.
- Click Next in the Setup Data section.
- In the Configure App section of your respective app, complete the following field.
- Index. Specify value for _index if the collection is configured with custom partition. Learn more. Default value is set to
sumologic_default(default partition)
- Index. Specify value for _index if the collection is configured with custom partition. Learn more. Default value is set to
- Click Next. You will be redirected to the Preview & Done section.
Post-installation
Once your app is installed, it will appear in your Installed Apps folder, and dashboard panels will start to fill automatically.
Each panel slowly fills with data matching the time range query received since the panel was created. Results will not immediately be available but will be updated with full graphs and charts over time.
As part of the app installation process, the following fields will be created by default:
tenant_name. This field is tagged at the collector level. You can get the tenant name using the instructions here.location. The region to which the resource name belongs to.subscription_id. ID associated with a subscription where the resource is present.resource_group. The resource group name where the Azure resource is present.provider_name. Azure resource provider name (for example, Microsoft.Network).resource_type. Azure resource type (for example, storage accounts).resource_name. The name of the resource (for example, storage account name).service_type. Type of the service that can be accessed with a Azure resource.service_name. Services that can be accessed with an Azure resource (for example, in Azure Container Instances the service is Subscriptions).
Viewing the Azure Kubernetes Service dashboards
All dashboards have a set of filters that you can apply to the entire dashboard. Use these filters to drill down and examine the data to a granular level.
- You can change the time range for a dashboard or panel by selecting a predefined interval from a drop-down list, choosing a recently used time range, or specifying custom dates and times. Learn more.
- You can use template variables to drill down and examine the data on a granular level. For more information, see Filtering Dashboards with Template Variables.
- Many of the Next-Gen apps allow you to provide the Index at the installation time and a default value for this key (sumologic_default). Based on your input, the app dashboards will be parameterized with a dashboard variable, allowing you to change the data partition queried by all panels. This restricts the query scope of all the dashboard queries to a specific data partition.
Overview
The Azure Kubernetes Service - Overview dashboard provides insights like Audit Requests by Location, Active/Total Clusters, Clusters with API Server Errors, Clusters with Autoscaler Errors, Clusters with Kube Controller Manager Errors, Clusters with Scheduler Errors, Clusters with Cloud Control Manager Errors, Nodes Across Cluster, and Critical Nodes Across Cluster.

Administrative Operations
The Azure Kubernetes Service - Administrative Operations dashboard provides details like Top 10 Operations That Caused The Most Errors, Distribution by Operation Type (Read, Write, and Delete), Distribution by Operations, Recent Write Operations, Recent Delete Operations, Users / Applications by Operation type, and Distribution by Status.

Audit
The Azure Kubernetes Service - Audit dashboard provides details about the Requests by Location, Failure by Operations, Failure by Stages, Failure by Reason, Distribution by Status Code, Top 10 Failed Resources, Successful Resource Details, Top 10 Users, Failure Trend by User, and Failure Details.

Audit Admin
The Azure Kubernetes Service - Audit Admin dashboard details about the Requests by Location, Failure by Operations, Failure by Stages, Failure by Reason, Distribution by Status Code, Top 10 Failed Resources, Successful Resource Details, Top 10 Users, Failure Trend by User, and Failure Details.

API Server
The Azure Kubernetes Service - API Server dashboard provides insights about the Failed Urls, Total Requests by Url, Failed Methods, Total Requests by Method, Requests by Severity, Errors by Severity, and Error Log Events.

Cloud Control Manager
The Azure Kubernetes Service - Cloud Control Manager dashboard provides insights about the Severity Breakdown, Severity Over Time, Error Message Count, and Error Log Stream.

Cluster Autoscaler
The Azure Kubernetes Service - Cluster Autoscaler dashboard provides insights about the Severity Breakdown, Severity Over Time, Error Message Count, and Error Log Stream.

Controller Manager
The Azure Kubernetes Service - Controller Manager dashboard provides insights about the Severity Breakdown, Severity Over Time, Error Message Count, and Error Log Stream.

Policy and Recommendations
The Azure Kubernetes Service - Policy and Recommendations dashboard provides details like Total Recommendation Events, Total Success Policy Events, Total Failed Policy Events, Failed Policy Events, Recent Recommendation Events, Recommendation, and Policy.

Scheduler
The Azure Kubernetes Service - Scheduler dashboard provides details about the Severity Over Time, Severity Breakdown, and Error Messages.

Apiserver
The Azure Kubernetes Service - Apiserver dashboard provides insights about the Average API Server CPU Usage (%), Average API Server Memory Usage (%), Average Inflight Requests Count, API Server CPU Usage (%), API Server Memory Usage (%), and Average Inflight Requests.

Autocluster
The Azure Kubernetes Service - Autocluster dashboard provides insights about Unschedulable Pods, Unneeded Nodes Count, Cluster Health Count, Scale Down Cooldown Count, Unschedulable Pods, Unneeded Nodes Count, Cluster Health Count and Scale Down Cooldown Count.

Etcd
The Azure Kubernetes Service - Etcd dashboard provide insights Etcd Memory Usage(%), Etcd CPU Usage(%), Etcd Database Usage(%), Etcd Memory Usage(%), Etcd CPU Usage (%) and Etcd Database Usage (%).

Node Overview
The Azure Kubernetes Service - Node Overview dashboard provide insights about Disk Used (Bytes), CPU Usage (Millicores), CPU Usage (%), Disk Used (%), Nodes, Nodes Ready, Nodes Not Ready, Critical Nodes, Total Allocatable CPU Cores, Total Allocatable Memory Bytes, Total In Bytes, Total Out Bytes, Number of Pods by Phase, Number of Pods in Ready State, Disk Used (Bytes), Node Network In vs Out (Bytes), CPU Usage (Millicores), Disk Used (%) and CPU Usage (%).

Node Memory
The Azure Kubernetes Service - Node Memory dashboard provides insights about Memory Working Set (Bytes), Memory RSS (Bytes), Memory RSS (%), Memory Working Set (%), Total Number of Available CPU Cores in a Managed Cluster, Total Amount of Available Memory in a Managed Aluster (Bytes), Memory RSS (Bytes), Memory RSS (%), Memory Working Set (Bytes), Memory Working Set (%), Total Amount of Available Memory in a Managed Aluster (Bytes) and Total Number of Available CPU Cores in a Managed Cluster.

Create monitors for Azure Kubernetes Service
From your App Catalog:
- From the Sumo Logic navigation, select App Catalog.
- In the Search Apps field, search for and then select your app.
- Make sure the app is installed.
- Navigate to What's Included tab and scroll down to the Monitors section.
- Click Create next to the pre-configured monitors. In the create monitors window, adjust the trigger conditions and notifications settings based on your requirements.
- Scroll down to Monitor Details.
- Under Location click on New Folder.
note
By default, monitor will be saved in the root folder. So to make the maintenance easier, create a new folder in the location of your choice.
- Enter Folder Name. Folder Description is optional.
tip
Using app version in the folder name will be helpful to determine the versioning for future updates.
- Click Create. Once the folder is created, click on Save.
Azure Kubernetes Service alerts
These alerts are metric based and will work for all Azure Kubernetes Managed Clusters.
| Alert Name | Alert Description and Conditions | Alert Condition | Recover Condition |
|---|---|---|---|
Azure Kubernetes Service - High CPU Usage | This alert is triggered when CPU usage percentage is greater than 95%. Also, a warning type alert will be triggered when CPU usage percentage is greater than 85%. | percentage >= 95 | percentage < 95 |
Azure Kubernetes Service - Unreachable Kube Node(s) | This alert is triggered when kube node(s) unreachable count greater than 1. | Count >= 1 | Count < 1 |
Azure Kubernetes Service - High Memory Working Set | This alert is triggered when memory working set is greater than 100%. | percentage >= 100 | percentage < 100 |
Azure Kubernetes Service - High Node Disk Usage | This alert is triggered when node disk usage is greater than 80% . Also, a warning alert will be triggered when node disk usage is greater than 70%. | percentage >= 80 | percentage < 80 |
Upgrade/Downgrade the Azure Kubernetes Service app (optional)
To update the app, do the following:
Next-Gen App: To install or update the app, you must be an account administrator or a user with Manage Apps, Manage Monitors, Manage Fields, Manage Metric Rules, and Manage Collectors capabilities depending upon the different content types part of the app.
- Select App Catalog.
- In the Search Apps field, search for and then select your app.
Optionally, you can identify apps that can be upgraded in the Upgrade available section. - To upgrade the app, select Upgrade from the Manage dropdown.
- If the upgrade does not have any configuration or property changes, you will be redirected to the Preview & Done section.
- If the upgrade has any configuration or property changes, you will be redirected to the Setup Data page.
- In the Configure section of your respective app, complete the following fields.
- Field Name. If you already have collectors and sources set up, select the configured metadata field name (eg _sourcecategory) or specify other custom metadata (eg: _collector) along with its metadata Field Value.
- Click Next. You will be redirected to the Preview & Done section.
Post-update
Your upgraded app will be installed in the Installed Apps folder and dashboard panels will start to fill automatically.
See our Release Notes changelog for new updates in the app.
To revert the app to a previous version, do the following:
- Select App Catalog.
- In the Search Apps field, search for and then select your app.
- To version down the app, select Revert to < previous version of your app > from the Manage dropdown.
Uninstalling the Azure Kubernetes Service app (optional)
To uninstall the app, do the following:
- Select App Catalog.
- In the 🔎 Search Apps field, run a search for your desired app, then select it.
- Click Uninstall.
Troubleshooting
Metrics collection via Azure Metrics Source
To troubleshoot metrics collection via Azure Metrics Source, follow the instructions in Troubleshooting Azure Metrics Source.