Microsoft Defender for Endpoint
The Azure Security – Microsoft Defender for Endpoint app empowers organizations to strengthen endpoint protection and proactively defend against advanced cyber threats. By centralizing alert data from devices like desktops, laptops, mobile devices, and servers, the app offers actionable insights that help security teams detect, investigate, and respond to suspicious activity faster and more effectively.
Leveraging advanced analytics and contextual threat intelligence, the app highlights patterns of malicious behavior, suspicious processes, and high-severity alerts. This visibility equips security teams to pinpoint vulnerabilities, monitor risk exposure, and understand the evolving threat landscape impacting endpoints. With its comprehensive pre-configured dashboards and visualizations, the app helps identify users, devices, or locations associated with recurring security incidents. This capability supports faster investigation and more targeted mitigation, reducing dwell time and potential damage.
By providing a holistic view of your organization’s endpoint security posture, the Azure Security – Microsoft Defender for Endpoint app ensures security teams remain agile, informed, and ready to respond to emerging threats — strengthening defenses and safeguarding critical assets.
Log types
This app uses SumoLogic’s Microsoft Graph Security source to collect Alerts from the Microsoft Defender for Endpoint to the Sumo Logic platform.
Sample log message
Alerts log message
{
  "id": "adf3a5c9bc83f5cfd175152516139fd01df4845a64d36f0d4481",
  "providerAlertId": "5bd1db63c29f8f4f17e6be7f8b4b1751525161523a3adee797b414fbaf6b1af1",
  "incidentId": "16",
  "status": "new",
  "severity": "high",
  "classification": "truePositive",
  "determination": "compromisedUser",
  "serviceSource": "microsoftDefenderForEndpoint",
  "detectionSource": "microsoftDataLossPrevention",
  "detectorId": "ImpossibleTravel",
  "tenantId": "3adb963c-8e61-48e8-a06d-6dbb0dacea39",
  "title": "Atypical travel",
  "description": "Sign-in from an atypical location based on the user\u2019s recent sign-ins",
  "recommendedActions": "",
  "category": "InitialAccess",
  "assignedTo": null,
  "alertWebUrl": "https://stravinmonsal.cajueiro.buzz/alerts/adf3a5c9bc83f5cfd39fd08df4845a64d36f0d4481?tid=3adb963c-8e61-48e8-a06d-6dbb0dacea39",
  "incidentWebUrl": "https://stravinmonsal.cajueiro.buzz/incidents/16?tid=3adb963c-8e61-48e8-a06d-6dbb0dacea39",
  "actorDisplayName": null,
  "threatDisplayName": null,
  "threatFamilyName": null,
  "mitreTechniques": ["T1078", "T1078.004"],
  "createdDateTime": "2025-07-03T12:16:01+053088Z",
  "lastUpdateDateTime": "2025-07-03T12:16:01+0530333Z",
  "resolvedDateTime": null,
  "firstActivityDateTime": "2025-07-03T12:16:01+0530577Z",
  "lastActivityDateTime": "2025-07-03T12:16:01+0530577Z",
  "comments": [
    {
      "@odata.type": "#microsoft.graph.security.alertComment",
      "comment": "Not valid",
      "createdByDisplayName": "John",
      "createdDateTime": "2025-07-03T12:16:01+053088Z"
    }
  ],
  "evidence": [
    {
      "@odata.type": "#microsoft.graph.security.userEvidence",
      "createdDateTime": "2025-07-03T12:16:01.523Z",
      "verdict": "unknown",
      "remediationStatus": "none",
      "remediationStatusDetails": null,
      "roles": ["compromised"],
      "detailedRoles": [],
      "tags": [],
      "userAccount": {
        "accountName": "tseapps",
        "domainName": null,
        "userSid": "S-1-12-1-1751525161-1751525161-589068932-1751525161",
        "azureAdUserId": "f5e829f5-4b1f-4fcf-847a-1c234c1b3b82",
        "userPrincipalName": "danny@euvzrzebjk.com",
        "displayName": null
      }
    },
    {
      "@odata.type": "#microsoft.graph.security.ipEvidence",
      "createdDateTime": "2025-07-03T12:16:01.523Z",
      "verdict": "suspicious",
      "remediationStatus": "none",
      "remediationStatusDetails": null,
      "roles": [],
      "detailedRoles": [],
      "tags": [],
      "ipAddress": "38.180.52.2",
      "countryLetterCode": "IN"
    },
    {
      "@odata.type": "#microsoft.graph.security.ipEvidence",
      "createdDateTime": "2025-07-03T12:16:01.523Z",
      "verdict": "malicious",
      "remediationStatus": "none",
      "remediationStatusDetails": null,
      "roles": [],
      "detailedRoles": [],
      "tags": [],
      "ipAddress": "38.180.52.2",
      "countryLetterCode": "US"
    },
    {
      "@odata.type": "#microsoft.graph.security.deviceEvidence",
      "createdDateTime": "2025-07-03T12:16:01.523Z",
      "verdict": "String",
      "remediationStatus": "String",
      "remediationStatusDetails": "String",
      "roles": ["String"],
      "tags": ["String"],
      "firstSeenDateTime": "2025-07-03T12:16:01+053088Z",
      "mdeDeviceId": "String",
      "azureAdDeviceId": "String",
      "deviceDnsName": "String",
      "osPlatform": "String",
      "osBuild": "Integer",
      "version": "String",
      "rbacGroupId": "Integer",
      "rbacGroupName": "String",
      "healthStatus": "String",
      "riskScore": "String",
      "onboardingStatus": "String",
      "defenderAvStatus": "String",
      "vmMetadata": {
        "@euvzrzebjk.type": "microsoft.graph.security.vmMetadata"
      },
      "loggedOnUsers": [
        { "@euvzrzebjk.type": "microsoft.graph.security.loggedOnUser" }
      ]
    }
  ]
}
Sample query
_sourceCategory="Labs/MicrosoftGraphSecurity"
|json"id","status","severity","category","title","description","classification","determination","serviceSource","detectionSource","alertWebUrl" ,"comments[*]","evidence[*]"as  alert_id,status,severity,category,title,description,classification,determination,service_source,detection_source,alert_url,comments,evidence_info nodrop

| where toLowerCase(service_source) = "microsoftdefenderforendpoint"

// global filters
| where if ("{{severity}}" = "*", true, severity matches "{{severity}}")
| where if ("{{status}}" = "*", true, status matches "{{status}}")
| where if ("{{classification}}" = "*", true, classification matches "{{classification}}")

// panel specific
| count by alert_id
| count
Collection configuration and app installation
Skip this step if you have already configured the Microsoft Graph Security API Source. Use an existing source and install the app option to install the app using the _sourceCategory of Microsoft Graph Security API Source.
Depending on the set up collection method, you can configure and install the app in three ways:
- Create a new collector and install the app. Create a new Sumo Logic Cloud-to-Cloud (C2C) source under a new Sumo Logic Collector and later install the app, or
- Use an existing collector and install the app. Create a new Sumo Logic Cloud-to-Cloud (C2C) source under an existing Sumo Logic Collector and later install the app, or
- Use existing source and install the app. Use your existing configured Sumo Logic Cloud-to-Cloud (C2C) source and install the app.
Create a new collector and install the app
To set up collection and install the app, do the following:
Next-Gen App: To install or update the app, you must be an account administrator or a user with Manage Apps, Manage Monitors, Manage Fields, Manage Metric Rules, and Manage Collectors capabilities depending upon the different content types part of the app.
- Select App Catalog.
- In the 🔎 Search Apps field, run a search for your desired app, then select it.
- Click Install App.
note
Sometimes this button says Add Integration.
- In the Set Up Collection section of your respective app, select Create a new Collector.
- Collector Name. Enter a Name to display the Source in the Sumo Logic web application. The description is optional.
- Timezone. Set the default time zone when it is not extracted from the log timestamp. Time zone settings on Sources override a Collector time zone setting.
- (Optional) Metadata. Click the +Add Metadata link to add a custom log Metadata Fields. Define the fields you want to associate, each metadata field needs a name (key) and value.
 A green circle with a checkmark is shown when the field exists and is enabled in the Fields table schema.
 An orange triangle with an exclamation point is shown when the field doesn't exist, or is disabled in the Fields table schema. In this case, you'll see an option to automatically add or enable the nonexistent fields to the Fields table schema. If a field is sent to Sumo Logic but isn’t present or enabled in the schema, it’s ignored and marked as Dropped.
- Click Next.
- Configure the source as specified in the
Infobox above, ensuring all required fields are included. - In the Configure section of your respective app, complete the following fields.
- Field Name. If you already have collectors and sources set up, select the configured metadata field name (eg _sourcecategory) or specify other custom metadata (eg: _collector) along with its metadata Field Value.
- Click Next. You will be redirected to the Preview & Done section.
Post-installation
Once your app is installed, it will appear in your Installed Apps folder, and dashboard panels will start to fill automatically.
Each panel slowly fills with data matching the time range query received since the panel was created. Results will not immediately be available but will be updated with full graphs and charts over time.
Use an existing collector and install the app
To set up the source in the existing collector and install the app, do the following:
Next-Gen App: To install or update the app, you must be an account administrator or a user with Manage Apps, Manage Monitors, Manage Fields, Manage Metric Rules, and Manage Collectors capabilities depending upon the different content types part of the app.
- Select App Catalog.
- In the 🔎 Search Apps field, run a search for your desired app, then select it.
- Click Install App.
note
Sometimes this button says Add Integration.
- In the Set Up Collection section of your respective app, select Use an existing Collector.
- From the Select Collector dropdown, select the collector that you want to set up your source with and click Next.
- Configure the source as specified in the
Infobox above, ensuring all required fields are included. - In the Configure section of your respective app, complete the following fields.
- Field Name. If you already have collectors and sources set up, select the configured metadata field name (eg _sourcecategory) or specify other custom metadata (eg: _collector) along with its metadata Field Value.
- Click Next. You will be redirected to the Preview & Done section.
Post-installation
Once your app is installed, it will appear in your Installed Apps folder, and dashboard panels will start to fill automatically.
Each panel slowly fills with data matching the time range query received since the panel was created. Results will not immediately be available but will be updated with full graphs and charts over time.
Use an existing source and install the app
To skip collection and only install the app, do the following:
Next-Gen App: To install or update the app, you must be an account administrator or a user with Manage Apps, Manage Monitors, Manage Fields, Manage Metric Rules, and Manage Collectors capabilities depending upon the different content types part of the app.
- Select App Catalog.
- In the 🔎 Search Apps field, run a search for your desired app, then select it.
- Click Install App.
note
Sometimes this button says Add Integration.
- In the Set Up Collection section of your respective app, select Skip this step and use existing source and click Next.
- In the Configure section of your respective app, complete the following fields.
- Field Name. If you already have collectors and sources set up, select the configured metadata field name (eg _sourcecategory) or specify other custom metadata (eg: _collector) along with its metadata Field Value.
- Click Next. You will be redirected to the Preview & Done section.
Post-installation
Once your app is installed, it will appear in your Installed Apps folder, and dashboard panels will start to fill automatically.
Each panel slowly fills with data matching the time range query received since the panel was created. Results will not immediately be available but will be updated with full graphs and charts over time.
Use the Cloud-to-Cloud Integration for Microsoft Graph Security API to create the source and use the same source category while installing the app. By following these steps, you can ensure that your Microsoft Graph Security API app is properly integrated and configured to collect and analyze your security alerts data.
Viewing Microsoft Defender for Endpoint dashboards
All dashboards have a set of filters that you can apply to the entire dashboard. Use these filters to drill down and examine the data to a granular level.
- You can change the time range for a dashboard or panel by selecting a predefined interval from a drop-down list, choosing a recently used time range, or specifying custom dates and times. Learn more.
- You can use template variables to drill down and examine the data on a granular level. For more information, see Filtering Dashboards with Template Variables.
- Most Next-Gen apps allow you to provide the scope at the installation time and are comprised of a key (
_sourceCategoryby default) and a default value for this key. Based on your input, the app dashboards will be parameterized with a dashboard variable, allowing you to change the dataset queried by all panels. This eliminates the need to create multiple copies of the same dashboard with different queries.
Overview
The Azure Security - Microsoft Defender for Endpoint - Overview dashboard offers a detailed view into security threats detected across endpoints, enabling analysts to assess and act swiftly on potential incidents. With a broad set of visualizations, it displays total alerts, high-severity alerts, and their distribution by status, classification, determination, service source, and detection source.
Security teams can quickly identify which alert categories are most prevalent, view recent alerts for immediate awareness, and also track which analysts are actively assigned to incidents. By highlighting the top users linked to alerts, the dashboard helps uncover potential insider threats or compromised accounts that require further investigation.
Geo-location mapping visualizes the alert origin, supporting risk assessment tied to specific regions. Together, these insights provide a balanced blend of historical context and real-time visibility, empowering teams to prioritize high-impact threats and respond effectively.
Overall, this dashboard serves as an essential tool for maintaining situational awareness, tracking alert trends, and strengthening your organization’s response strategy against evolving endpoint threats.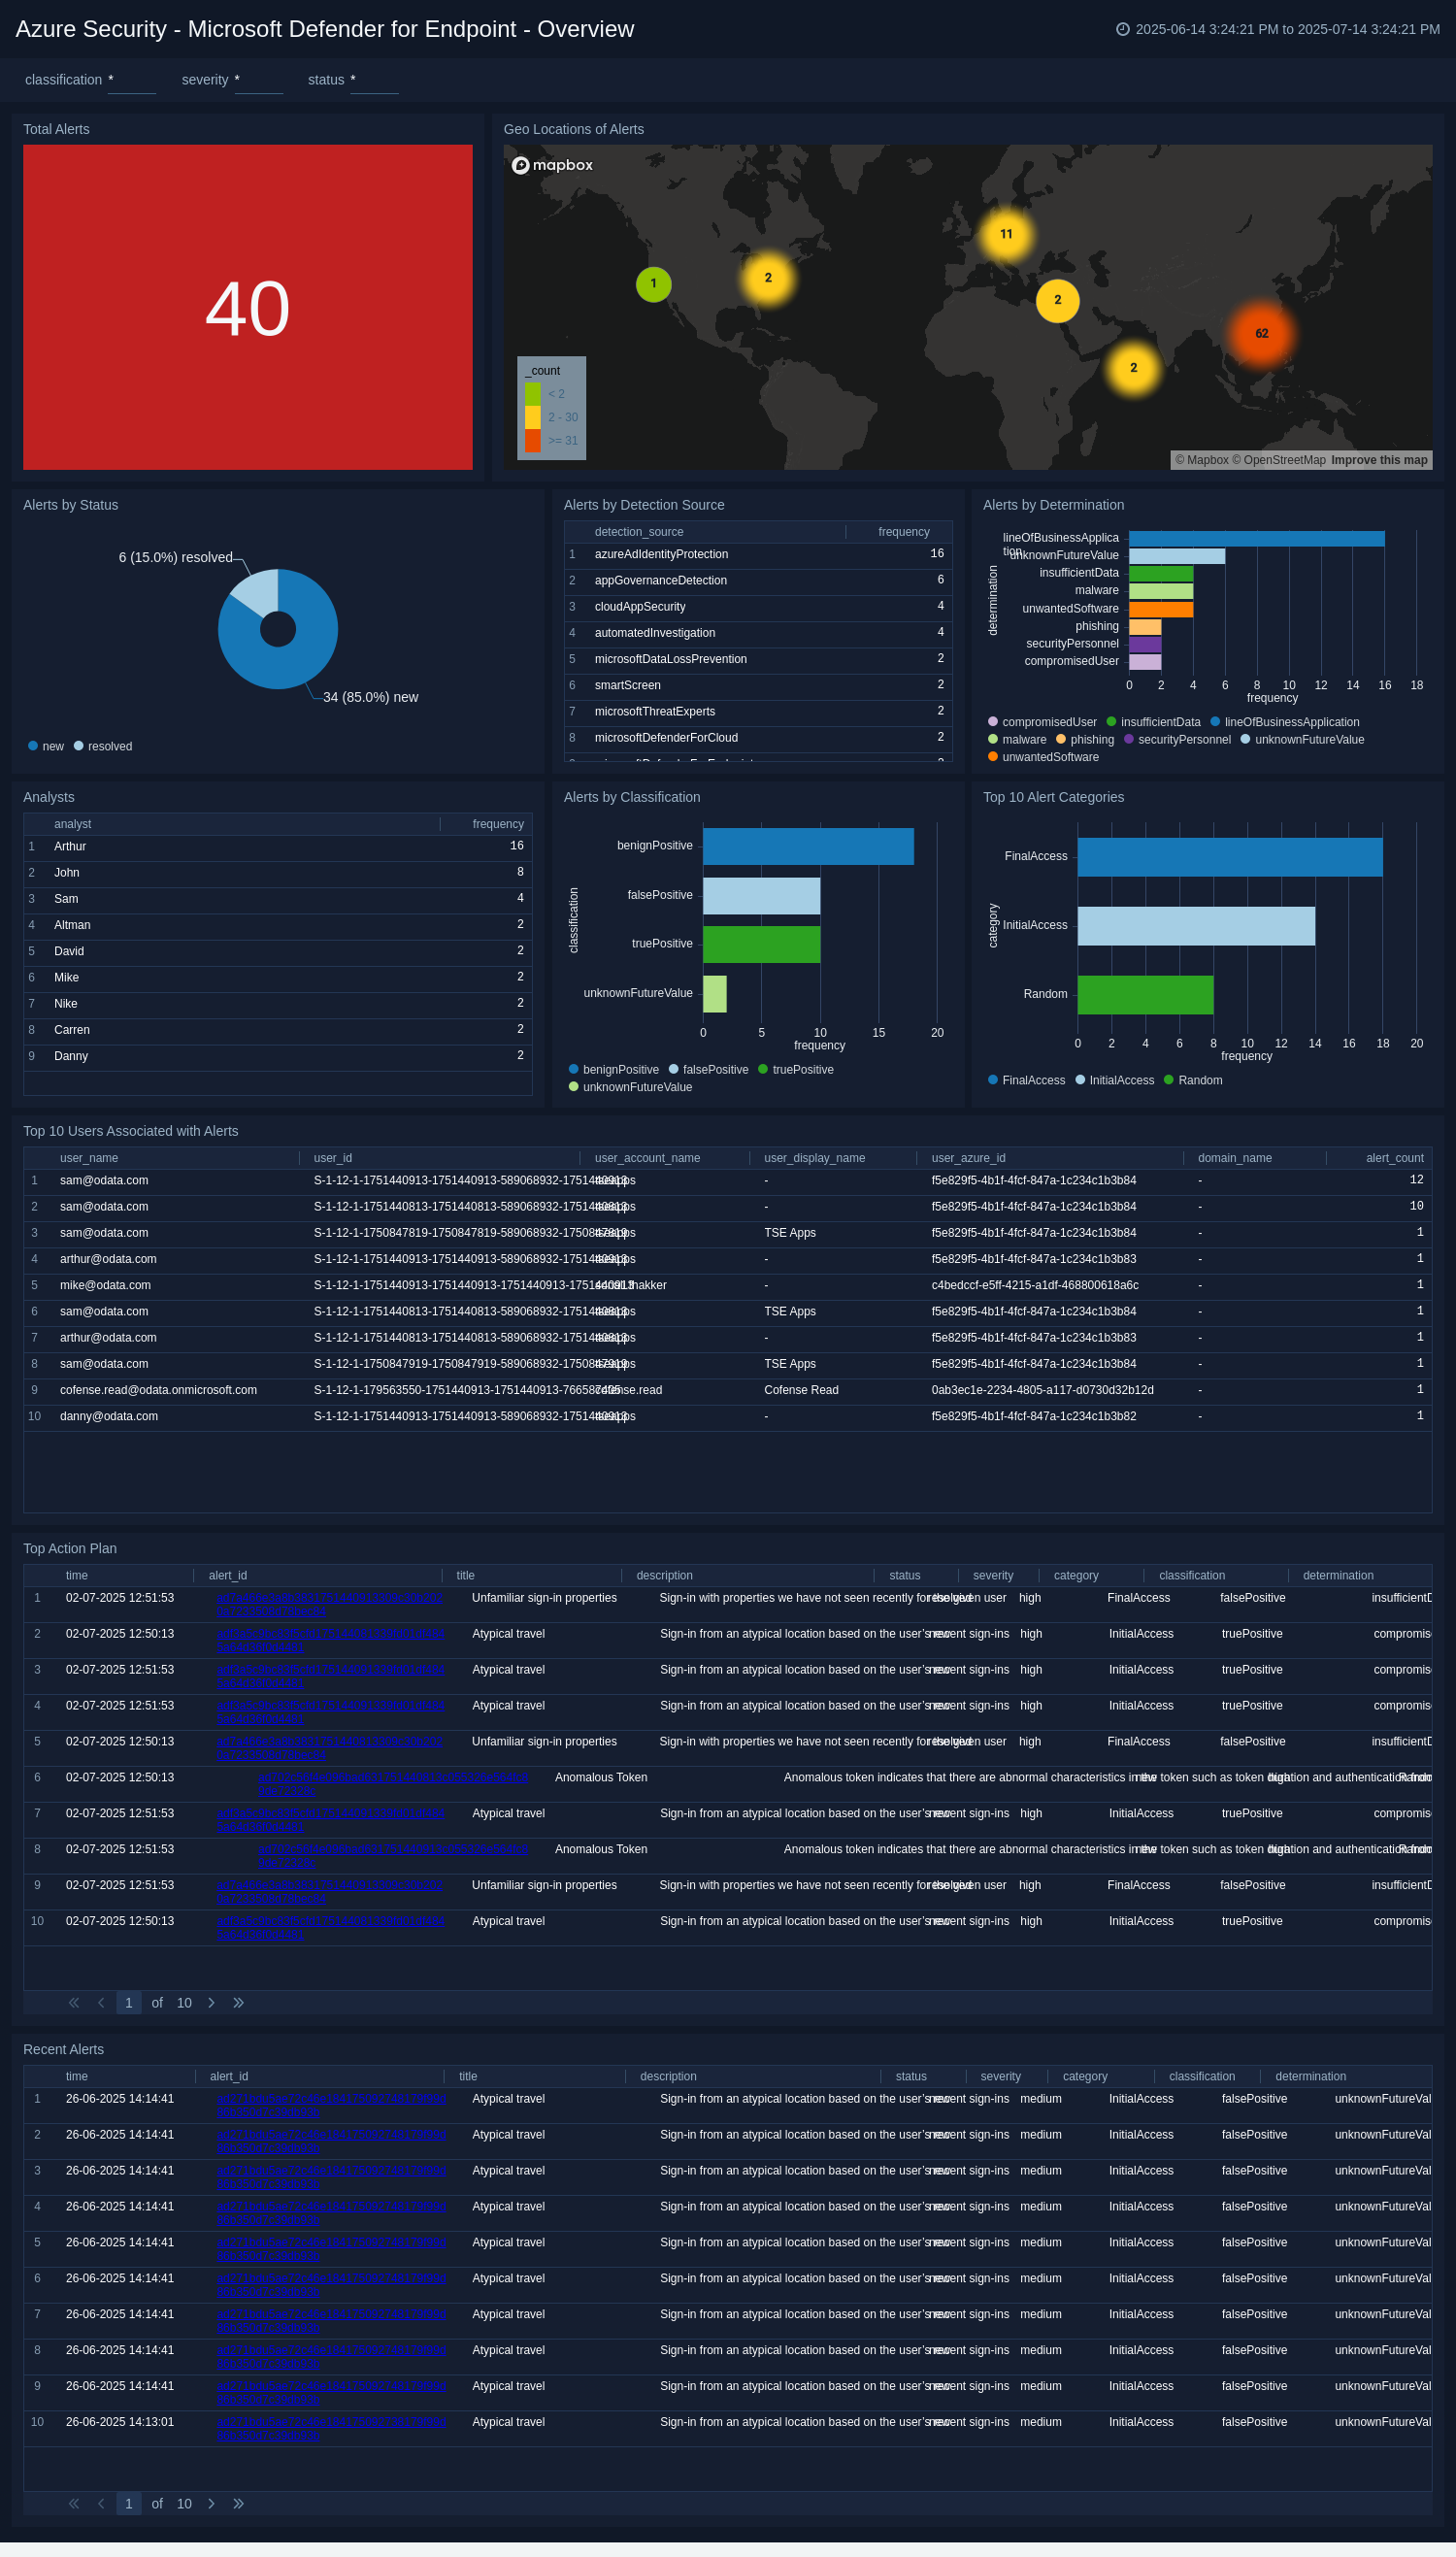
Security
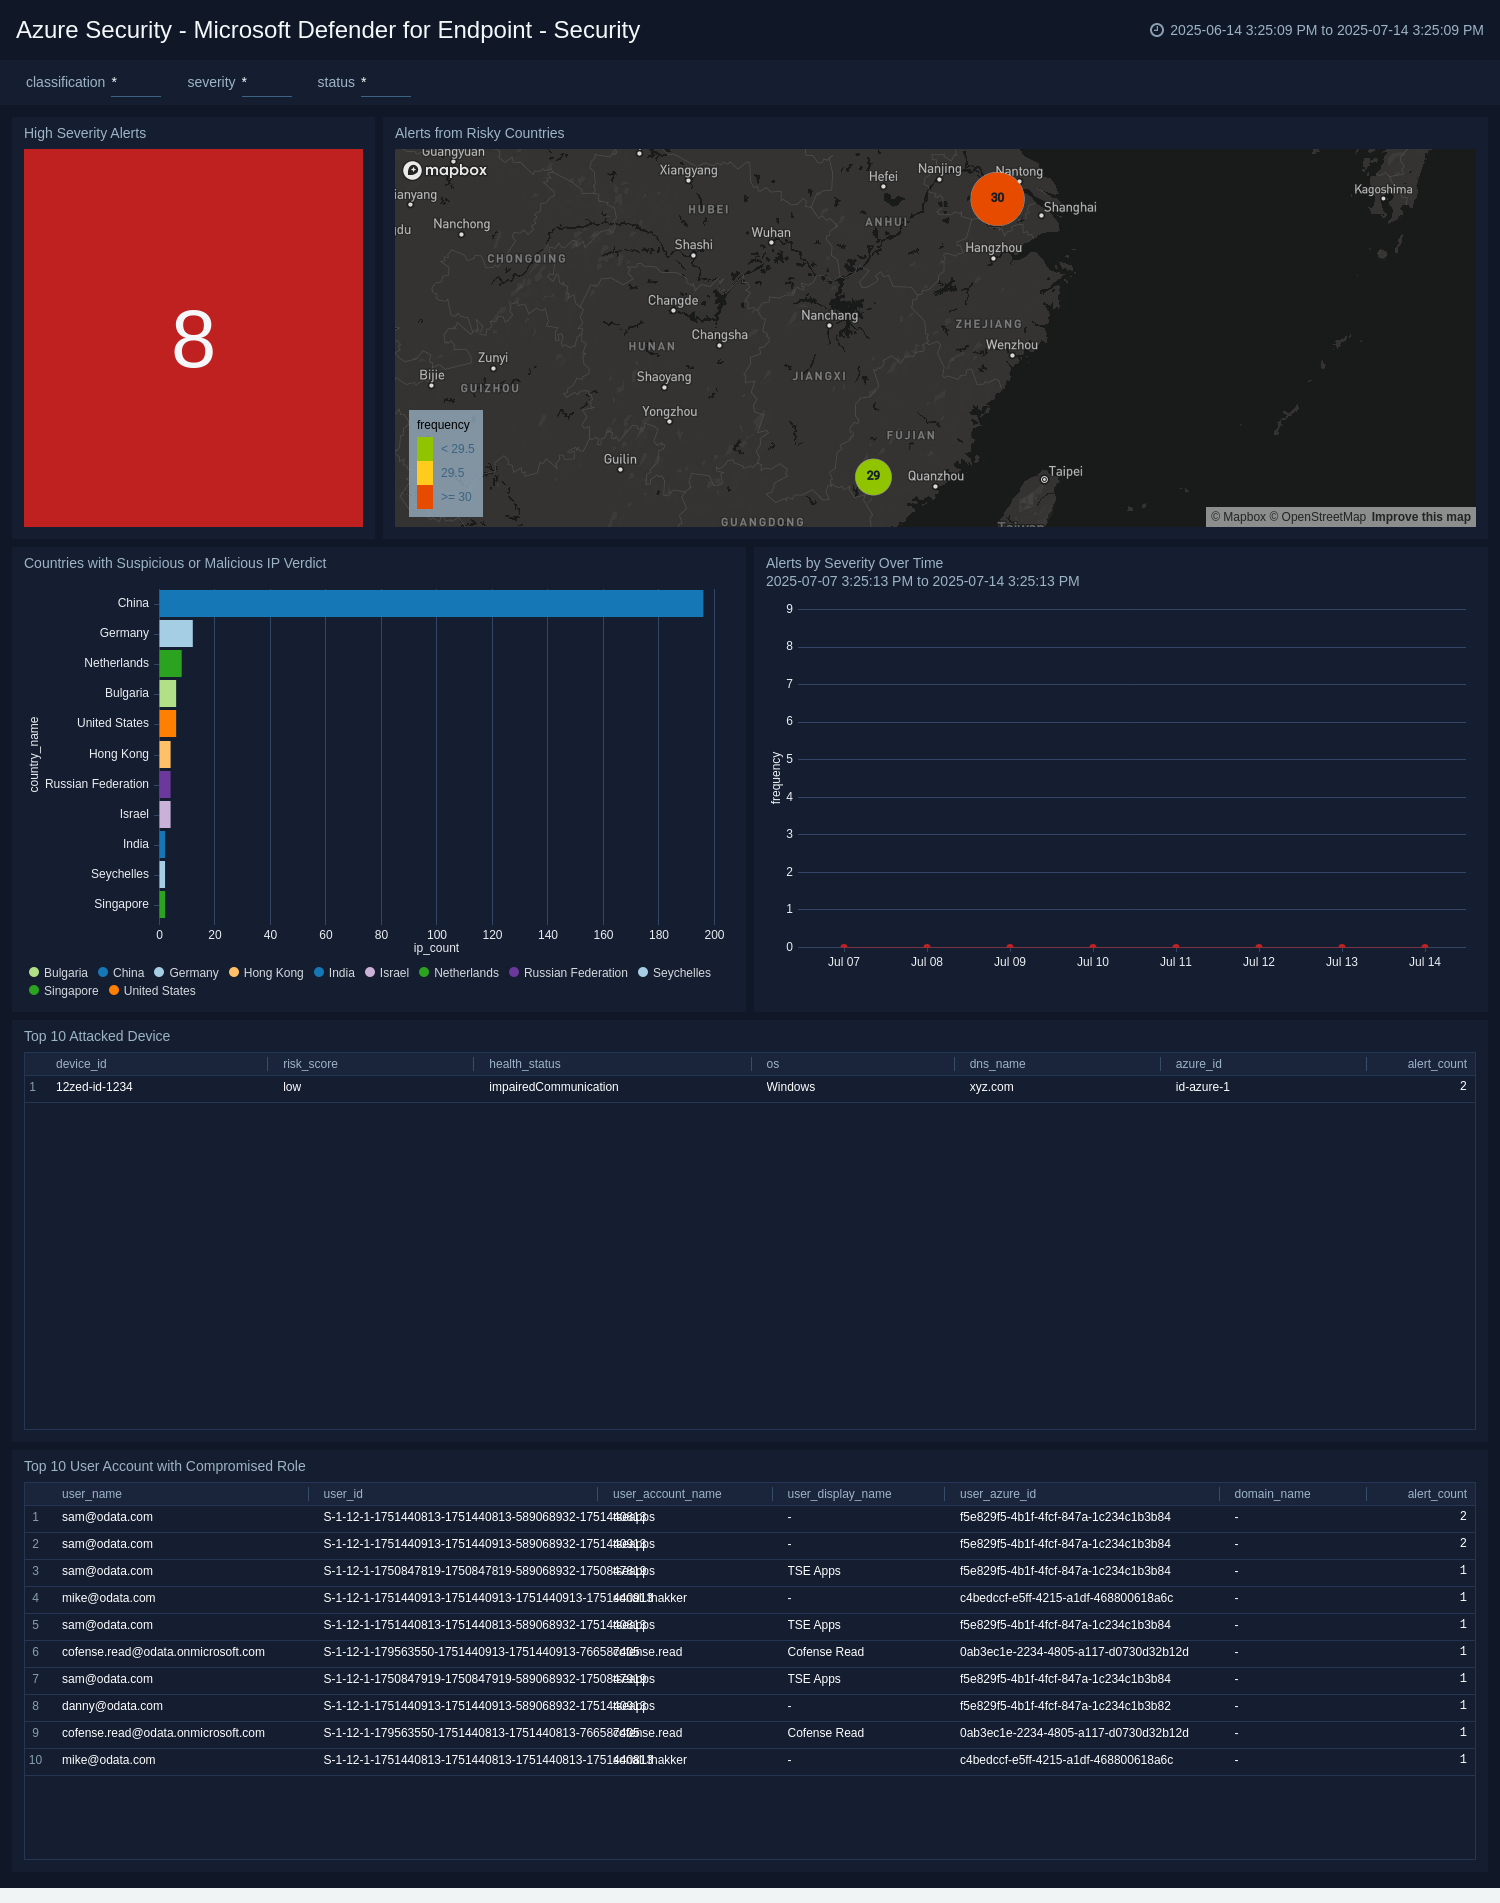
The Azure Security - Microsoft Defender for Endpoint - Security dashboard delivers a high-level view of your organization’s endpoint threat landscape, helping teams identify where risks concentrate and how they evolve over time. Visual trend panels illustrate changes in alert severity, revealing whether high-risk incidents are increasing and guiding prioritization of response efforts.
Geo-location data highlights alerts emerging from risky countries, allowing teams to assess exposure to region-specific threats. The dashboard also surfaces critical context, such as the top user accounts with compromised roles, which can signal targeted attacks on privileged accounts.
In addition, the dashboard ranks the most frequently attacked devices and countries linked to suspicious or malicious IP activity, offering clarity on which assets and locations are most at risk. This intelligence supports more targeted defenses and timely intervention.
By combining trend analysis, threat origins, and user risk insights, the Security dashboard equips analysts to recognize patterns, respond to emerging threats proactively, and bolster the organization’s overall security posture against complex endpoint attacks.