Windows Performance
The Windows Performance app provides insight into your system's operation and events so that you can better manage and maintain your Windows systems. The app uses predefined Dashboards and searches that provide visibility into your environment for real-time analysis of system and network performance and overall usage.
Log types
The Windows Performance app assumes events are coming from Windows Performance sources.
Also, you'll need to configure an additional custom query for each Source. For details, see Collect Logs for Windows Performance App.
Sample log messages
instance of Win32_PerfFormattedData_PerfProc_Process
{
    CreatingProcessID = 2612;
    ElapsedTime = "3252";
    HandleCount = 756;
    IDProcess = 2580;
    IODataBytesPersec = "0";
    IODataOperationsPersec = "0";
    IOOtherBytesPersec = "0";
    IOOtherOperationsPersec = "0";
    IOReadBytesPersec = "0";
    IOReadOperationsPersec = "0";
    IOWriteBytesPersec = "0";
    IOWriteOperationsPersec = "0";
    Name = "explorer";
    PageFaultsPersec = 0;
    PageFileBytes = "38965248";
    PageFileBytesPeak = "48934912";
    PercentPrivilegedTime = "6";
    PercentProcessorTime = "7";
    PercentUserTime = "23";
    PoolNonpagedBytes = 53104;
    PoolPagedBytes = 410728;
    PriorityBase = 8;
    PrivateBytes = "38965248";
    ThreadCount = 27;
    VirtualBytes = "235999232";
    VirtualBytesPeak = "270917632";
    WorkingSet = "52269056";
    WorkingSetPeak = "56279040";
    WorkingSetPrivate = "23617536";
}

instance of Win32_PerfFormattedData_PerfOS_Memory
{
	AvailableBytes = "1238610176";
	AvailableKBytes = "1111924";
	AvailableMBytes = "1085";
	CacheBytes = "49934336";
	CacheBytesPeak = "155365376";
	CacheFaultsPersec = 0;
	CommitLimit = "4294033408";
	CommittedBytes = "1131204608";
	DemandZeroFaultsPersec = 175;
	FreeAndZeroPageListBytes = "630083584";
	FreeSystemPageTableEntries = 33555674;
	ModifiedPageListBytes = "46796800";
	PageFaultsPersec = 175;
	PageReadsPersec = 10;
	PagesInputPersec = 0;
	PagesOutputPersec = 0;
	PagesPersec = 0;
	PageWritesPersec = 3;
	PercentCommittedBytesInUse = 26;
	PoolNonpagedAllocs = 126788;
	PoolNonpagedBytes = "46321664";
	PoolPagedAllocs = 105056;
	PoolPagedBytes = "145367040";
	PoolPagedResidentBytes = "145051648";
	StandbyCacheCoreBytes = "0";
	StandbyCacheNormalPriorityBytes = "420179968";
	StandbyCacheReserveBytes = "88346624";
	SystemCacheResidentBytes = "49934336";
	SystemCodeResidentBytes = "2596864";
	SystemCodeTotalBytes = "7192576";
	SystemDriverResidentBytes = "5947392";
	SystemDriverTotalBytes = "5259264";
	TransitionFaultsPersec = 0;
	TransitionPagesRePurposedPersec = 0;
	WriteCopiesPersec = 0;
}
Sample queries
_sourceCategory=OS/Windows "Win32_PerfFormattedData_PerfOS_Memory" "AvailableBytes"
| parse regex "winbox = (?<dest_host>\S+)" nodrop
| if (isNull(dest_host) or dest_host="",_sourceHost,dest_host) as host
| kv regex "= (?:\"|)(.*?)(?:\"|);" keys "AvailableBytes" as aBytes
| timeslice 1m
| avg(aBytes) as AvgAvailableBytes by host,_timeslice
| int(AvgAvailableBytes/(1024*1024)) as AvgAvailMBytes
| where AvgAvailMBytes < 100 // 100MB is the threshold for this alert
| count as DataPoints by host
| where DataPoints >10 // another threshold: more than 10 minutes where the limit drops under the above threshold
_sourceCategory=OS/Windows "Win32_PerfFormattedData_PerfOS_Processor" "_Total"
| parse regex "winbox = (?<dest_host>\S+)" nodrop
| if (isNull(dest_host) or dest_host="",_sourceHost,dest_host) as host
| kv regex "= (?:\"|)(.*?)(?:\"|);" keys "PercentProcessorTime" as procTime
| timeslice 1m
| avg(procTime) as AvgProcTime by host,_timeslice | sort - _timeslice | transpose row _timeslice column host
Collecting logs for the Windows Performance app
This section provides instructions for configuring log collection for the Windows Performance app, as well as example log files and queries.
Configure a Collector and Source
To collect logs for the Windows Performance app, you will need to configure an Installed Collector, and either a Local or Remote Windows Performance Monitor Log Source.
To collect logs for the Windows Performance App, do the following:
- Install a collector as described in Installed Collector.
- Configure a Windows Performance Source, choosing the one appropriate for on your environment:
Add a Custom Query to the Windows Performance Source
To complete the configuration, you'll need to edit each Windows Performance Source (you are using to collect logs) to add a custom query.
- Classic UI. In the main Sumo Logic menu, select Manage Data > Collection > Collection.
New UI. In the Sumo Logic top menu select Configuration, and then under Data Collection select Collection. You can also click the Go To... menu at the top of the screen and select Collection. - Find the Collector and the Windows Performance Source.
- For the Source, click Edit.
- Under Perfmon Queries select the check boxes for these queries:
- CPU
- Physical Disk
- Memory
- Network
- Click Add Query.
- For Name, enter CPU per Process.
- For Query, enter select * from Win32_PerfFormattedData_PerfProc_Process.
- Click Save.
Installing the Windows Performance app
To install the app, do the following:
Next-Gen App: To install or update the app, you must be an account administrator or a user with Manage Apps, Manage Monitors, Manage Fields, Manage Metric Rules, and Manage Collectors capabilities depending upon the different content types part of the app.
- Select App Catalog.
- In the 🔎 Search Apps field, run a search for your desired app, then select it.
- Click Install App.
note
Sometimes this button says Add Integration.
- Click Next in the Setup Data section.
- In the Configure section of your respective app, complete the following fields.
- Field Name. If you already have collectors and sources set up, select the configured metadata field name (eg _sourcecategory) or specify other custom metadata (eg: _collector) along with its metadata Field Value.
- Click Next. You will be redirected to the Preview & Done section.
Post-installation
Once your app is installed, it will appear in your Installed Apps folder, and dashboard panels will start to fill automatically.
Each panel slowly fills with data matching the time range query received since the panel was created. Results will not immediately be available but will be updated with full graphs and charts over time.
Viewing Windows Performance dashboards
All dashboards have a set of filters that you can apply to the entire dashboard. Use these filters to drill down and examine the data to a granular level.
- You can change the time range for a dashboard or panel by selecting a predefined interval from a drop-down list, choosing a recently used time range, or specifying custom dates and times. Learn more.
- You can use template variables to drill down and examine the data on a granular level. For more information, see Filtering Dashboards with Template Variables.
- Most Next-Gen apps allow you to provide the scope at the installation time and are comprised of a key (
_sourceCategoryby default) and a default value for this key. Based on your input, the app dashboards will be parameterized with a dashboard variable, allowing you to change the dataset queried by all panels. This eliminates the need to create multiple copies of the same dashboard with different queries.
Windows Performance Overview
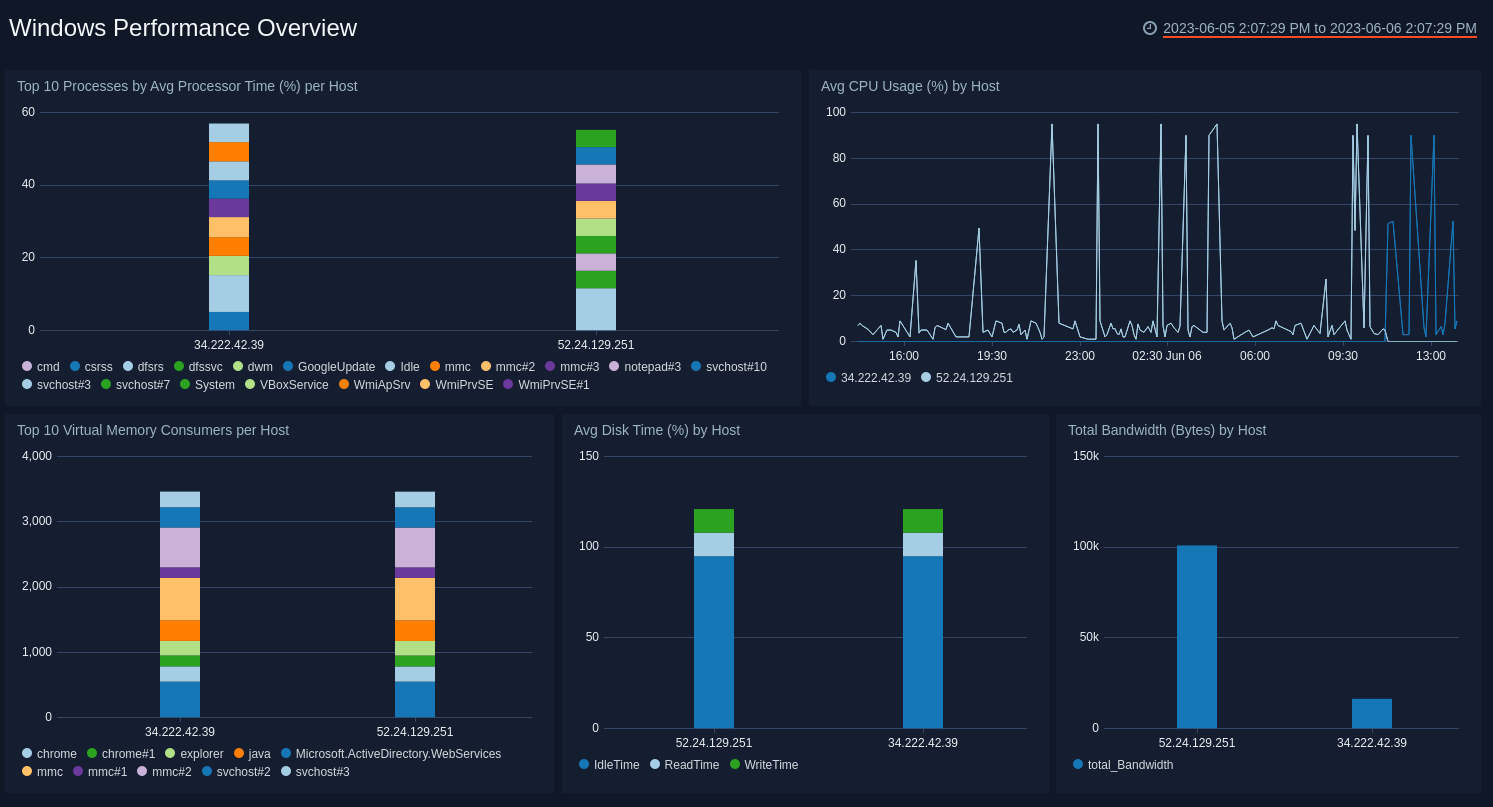
Top 10 Processes by Average Processor Time (%) per Host. Displays the top 10 processes per host by average processor time in a stacked column chart for the last 15 minutes. The legend lists the processes.
Average CPU Usage (%) by Host. Shows the average CPU usage percentage by host in a line chart on a timeline for the last 15 minutes.
Top 10 Virtual Memory Consumers per Host. Provides information on the top 10 virtual memory consumers per host for the last 15 minutes as a stacked column chart. The legend lists the consumers.
Average Disk Time (%) by Host. Displays the average disk time percentage for each host as a stacked column chart for the last 15 minutes. The legend lists the disk time status.
Total Bandwidth (Bytes) by Host. Shows the average current network bandwidth by interface for each host as a stacked column chart for the last 15 minutes.
CPU Performance
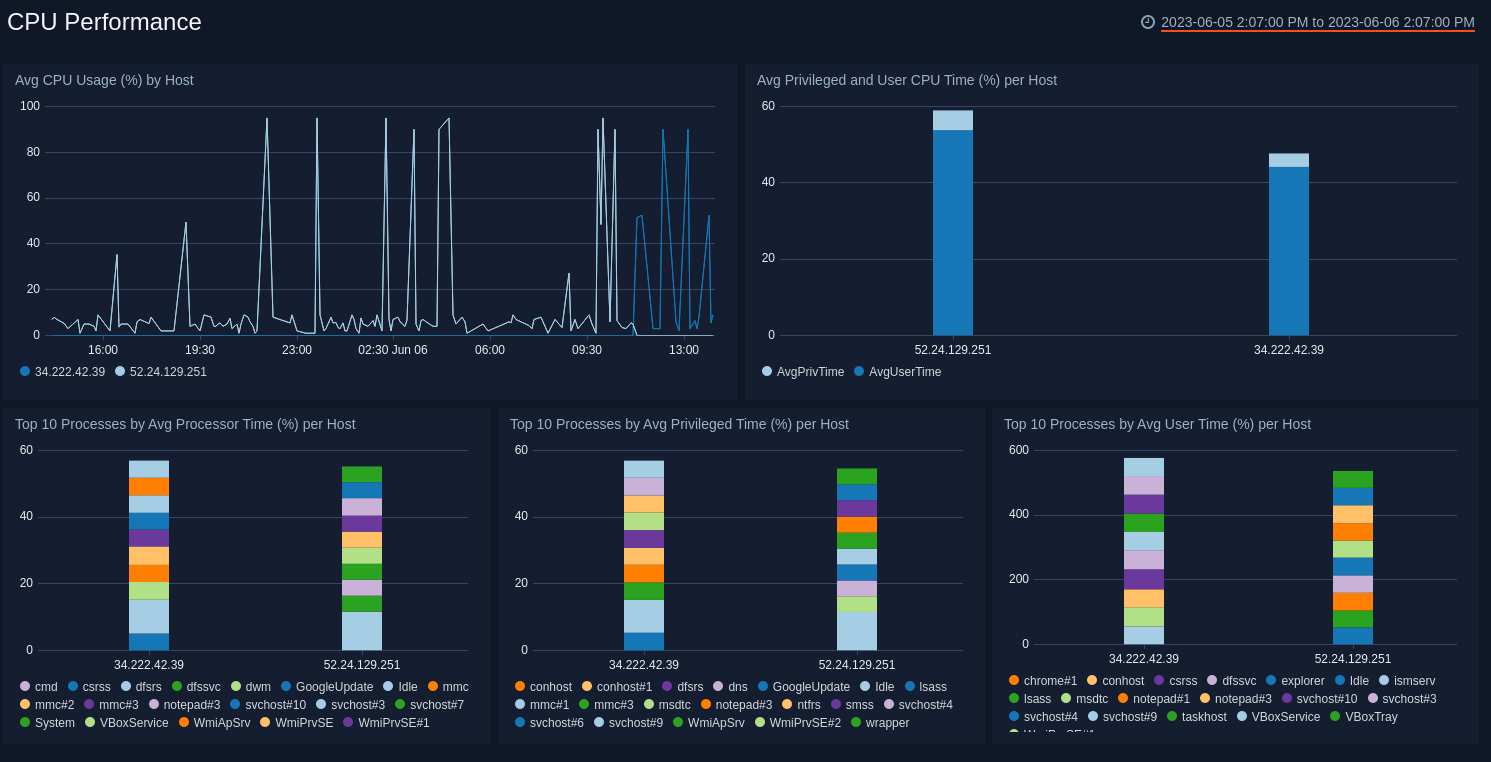
Average CPU Usage (%) by Host. Displays the average CPU usage of the systems in your environment as a line graph on a timeline using timeslices of one minute for the last 15 minutes.
Average Privileged and User CPU Time (%) per Host. Shows the average privileged and user CPU time for each host as a stacked column chart for the last 15 minutes.
Top 10 Processes by Average Processor Time (%) per Host. Provides information on processes by average processor time for each host displayed in a stacked column chart for the last 15 minutes. The legend lists the processes.
Top 10 Processes by Average Privileged Time (%) per Host. Shows processes by average privileged time by percentage for each host displayed in a stacked column chart for the last 15 minutes. The legend lists the processes.
Top 10 Processes by Average User Time (%) per Host. Shows processes by average user time by percentage for each host displayed in a stacked column chart for the last 15 minutes. The legend lists the processes.
Disk Performance
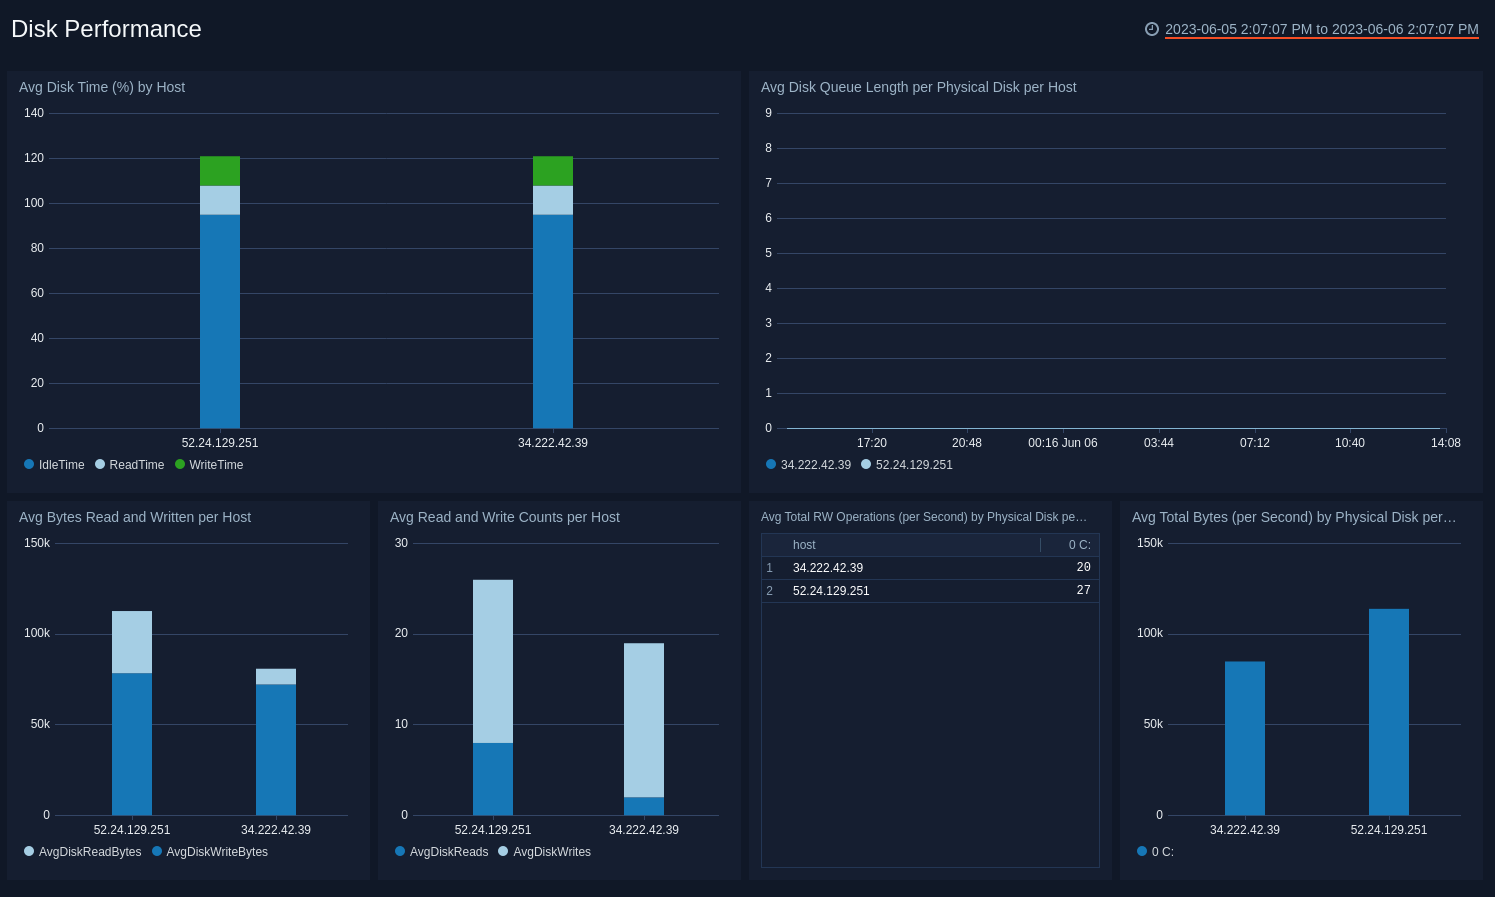
Average Disk Time Percentage by Host. Displays the average disk time percentage for each host as a stacked column chart for the last 15 minutes. The legend lists the disk time status.
Average Disk Queue Length per Physical Disk per Host. Shows the average disk queue length per physical disk for each host as a line chart on a timeline using timeslices of one minute for the last 15 minutes.
Average Bytes Read and Written per Host. Shows the average bytes read per physical disk per host as a stacked column chart for the last 15 minutes.
Average Read and Write Counts per Host. Displays the average read and write counts per host for each host as a stacked column chart for the last 15 minutes.
Average Total RW Operators (per Second) by Physical Disk per Host. Shows the average total disk read and write time per physical disk for each host as an aggregation table for the last 15 minutes.
Average Total Bytes (per Second) by Physical Disk. Displays the average total bytes per second per physical disk for each host as a column chart for the last 15 minutes.
Memory Performance
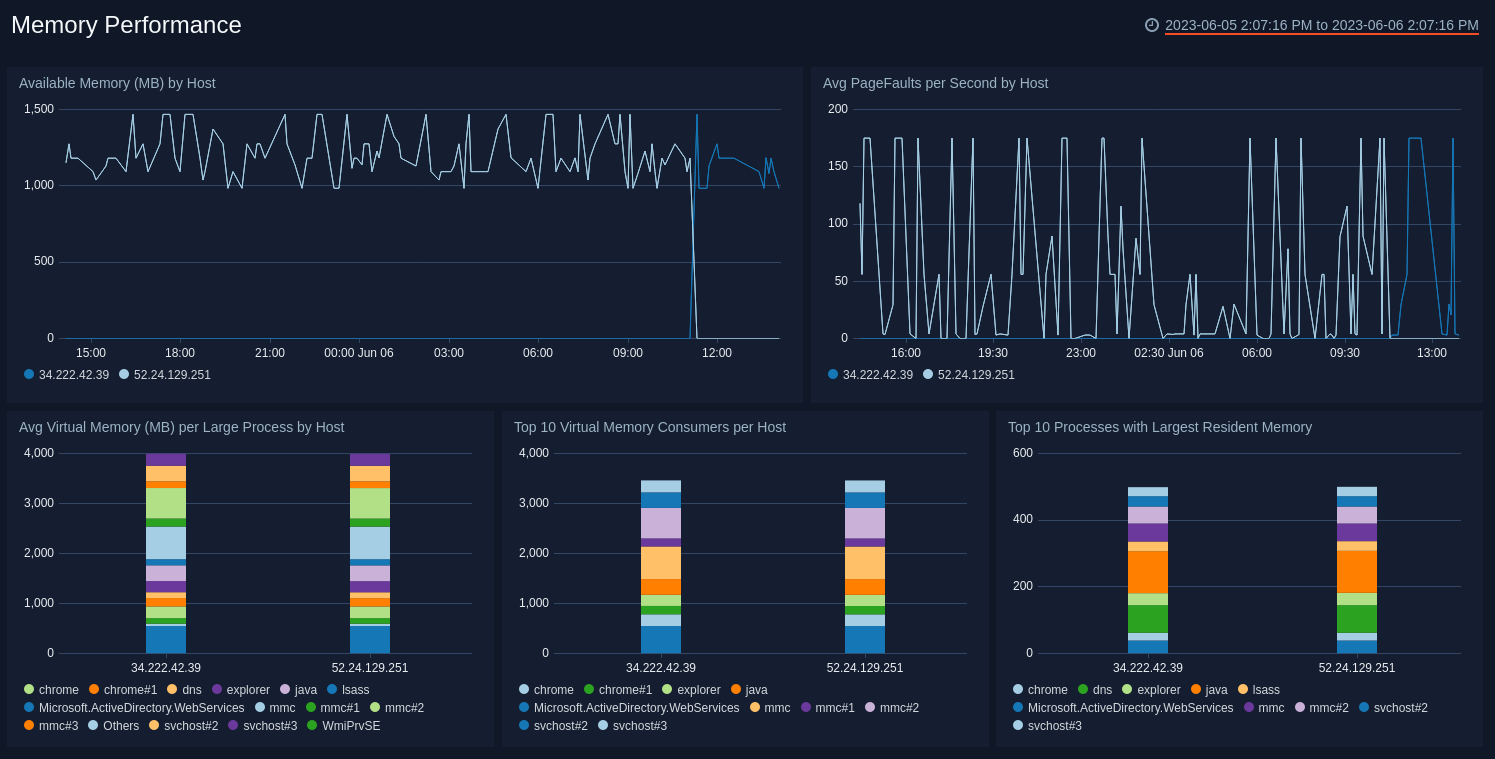
Available Memory (MB) by Host. Displays the available memory in MBs for each host as a line chart on a timeline using timeslices for one minute for the last 15 minutes.
Average PageFaults per Second by Host. Displays the average number of PageFaults per second for each host as a line chart on a timeline using timeslices of one minute for the last 15 minutes. A high number of this metric indicates a memory shortage.
Average Virtual Memory (MB) per Large Process by Host. Shows the average virtual memory in MBs per large process (more than 100MB) for each host as a stacked column chart for the last 15 minutes. The legend lists the processes.
Top 10 Virtual Memory Consumers per Host. Provides information on the top 10 virtual memory consumers per host for the last 15 minutes as a stacked column chart. The legend lists the consumers.
Top 10 Processes with Largest Resident Memory. Displays the top 10 processes with the largest resident memory per host for the last 15 minutes as a stacked column chart for the last 15 minutes. The legend lists the processes.
Network Performance
Average Bytes Received per Second by Host. Displays the average number of bytes received per second for each host as an area chart on a timeline using timeslices of one minute for the last 15 minutes.
Average Bytes Sent per Second by Host. Displays the average number of bytes sent per second for each host as an area chart on a timeline using timeslices of one minute for the last 15 minutes.
Average Inbound Packets per Second. Shows the average number of inbound packets per second for each host as a line chart for the last 15 minutes. The legend lists the packet status.
Average Outbound Packets. Shows the average number of outbound packets per second for each host as a line chart for the last 15 minutes. The legend lists the packet status.
Average Current Bandwidth by Interface per Host. Shows the average current network bandwidth by interface for each host as a stacked column chart for the last 15 minutes. The legend lists the interface.
Average Output Queue Length. Displays the average length of the output queue as a line chart on a timeline using timeslices of one minute for the last 15 minutes.
Upgrade/Downgrade the Windows Performance app (Optional)
To update the app, do the following:
Next-Gen App: To install or update the app, you must be an account administrator or a user with Manage Apps, Manage Monitors, Manage Fields, Manage Metric Rules, and Manage Collectors capabilities depending upon the different content types part of the app.
- Select App Catalog.
- In the Search Apps field, search for and then select your app.
Optionally, you can identify apps that can be upgraded in the Upgrade available section. - To upgrade the app, select Upgrade from the Manage dropdown.
- If the upgrade does not have any configuration or property changes, you will be redirected to the Preview & Done section.
- If the upgrade has any configuration or property changes, you will be redirected to the Setup Data page.
- In the Configure section of your respective app, complete the following fields.
- Field Name. If you already have collectors and sources set up, select the configured metadata field name (eg _sourcecategory) or specify other custom metadata (eg: _collector) along with its metadata Field Value.
- Click Next. You will be redirected to the Preview & Done section.
Post-update
Your upgraded app will be installed in the Installed Apps folder and dashboard panels will start to fill automatically.
See our Release Notes changelog for new updates in the app.
To revert the app to a previous version, do the following:
- Select App Catalog.
- In the Search Apps field, search for and then select your app.
- To version down the app, select Revert to < previous version of your app > from the Manage dropdown.
Uninstalling the Windows Performance app (Optional)
To uninstall the app, do the following:
- Select App Catalog.
- In the 🔎 Search Apps field, run a search for your desired app, then select it.
- Click Uninstall.