Microsoft SQL Server - Classic Collector

The Sumo Logic App for Microsoft SQL Server is an unified logs and metrics app that provides insight into your SQL server performance metrics and errors. The App consists of predefined Dashboards, providing visibility into your environment for real-time or historical analysis on backup, latency, performance counter, restore, mirroring, database monitoring, general health and operations of your system.
This App has been tested with following SQL Server versions:
- Microsoft SQL Server 2012
Collecting logs and metrics for the Microsoft SQL Server App
This section provides instructions for configuring a local file source to collect SQL Server ERRORLOG data, and a script source to collect SQL Server performance metrics. A sample log message is also provided.
Collect Logs and Metrics
Sumo Logic supports collection of logs and metrics data from SQL Server in both Kubernetes and non-Kubernetes environments. Click on the appropriate tabs below based on the environment where your SQL Server clusters are hosted.
- Kubernetes environments
- Non-Kubernetes environments
In Kubernetes environments, we use the Telegraf Operator, which is packaged with the Kubernetes collection (learn more). The diagram below illustrates how data is collected from SQL Server in Kubernetes environments. In the architecture shown below, there are four services that make up the metric collection pipeline: Telegraf, Telegraf Operator, Prometheus, and Sumo Logic Distribution for OpenTelemetry Collector. 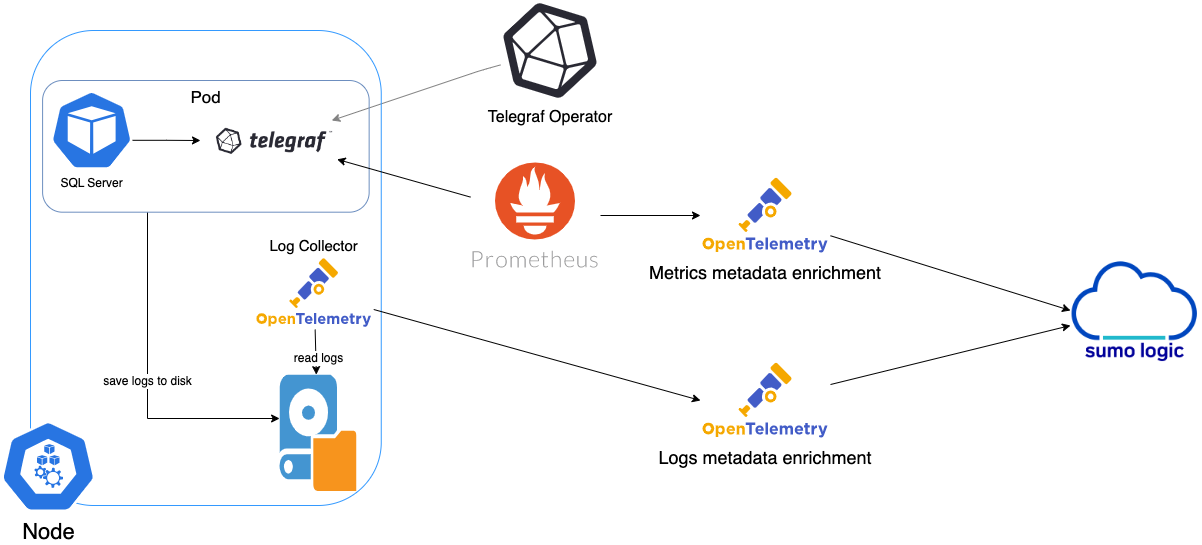
The first service in the pipeline is Telegraf. Telegraf collects metrics from SQL Server. Note that we are running Telegraf as a sidecar deployment in each pod from which we want to collect metrics. This means that Telegraf is running in the same pod as the containers it monitors. Telegraf uses the SQL Server input plugin to obtain metrics. For simplicity, the diagram doesn’t show the input plugins. The injection of the Telegraf sidecar container is done by the Telegraf Operator. Prometheus pulls metrics from Telegraf and sends them to Sumo Logic Distribution for OpenTelemetry Collector which enriches metadata and sends metrics to Sumo Logic.
In the logs pipeline, Sumo Logic Distribution for OpenTelemetry Collector collects logs written to standard out and forwards them to another instance of Sumo Logic Distribution for OpenTelemetry Collector, which enriches metadata and sends logs to Sumo Logic.
Follow the below instructions to set up the metric collection:
- Configure Metrics Collection
- Setup Kubernetes Collection with the Telegraf operator
- Add annotations on your SQL Server pods
- Configure Logs Collection
- Configure logging in SQL Server.
- Add labels on your SQL Server pods to capture logs from standard output.
- Collecting SQL Server Logs from a Log file.
Prerequisites
It’s assumed that you are using the latest helm chart version. If not, upgrade using the instructions here.
Step 1: Configure Metrics Collection
This section explains the steps to collect SQL Server metrics from a Kubernetes environment.
In Kubernetes environments, we use the Telegraf Operator, which is packaged with our Kubernetes collection. Learn more. Follow the steps listed below to collect metrics from a Kubernetes environment:
- Set up Kubernetes Collection with the Telegraf Operator.
- Add annotations on your SQL Server pods. Before you add annotations, you need to create a login on every SQL Server pod you want to monitor, with following script:
USE master;
GO
CREATE LOGIN [Username_ENV_TO_BE_CHANGED] WITH PASSWORD=N'Password_CHANGE_ME';
GO
GRANT VIEW SERVER STATE TO [Username_ENV_TO_BE_CHANGED];
GO
GRANT VIEW ANY DEFINITION TO [Username_ENV_TO_BE_CHANGED];
GO
On your SQL Server Pods, add the following annotations:
 annotations:
    telegraf.influxdata.com/class: sumologic-prometheus
    prometheus.io/scrape: "true"
    prometheus.io/port: "9273"
    telegraf.influxdata.com/inputs: |+
[[inputs.sql server]]
    servers = ["Server=<IP_ENV_TO_BE_CHANGED>;Port=<Port_ENV_TO_BE_CHANGED| default 1433>;User Id=<Username_ENV_TO_BE_CHANGED>;Password=<Password_ENV_TO_BE_CHANGED>;app name=telegraf;log=1;",]
   database_type = "SQLServer"
   exclude_query =  [ 'SQLServerSchedulers' , 'SQLServerRequests']
     [inputs.sqlserver.tags]
    environment="ENV_TO_BE_CHANGED"
    component="database"
    db_system = "sqlserver"
    db_cluster = "ENV_TO_BE_CHANGED"
    db_cluster_address = "ENV_TO_BE_CHANGED"
    db_cluster_port = "ENV_TO_BE_CHANGED"
Enter in values for the following parameters (marked ENV_TO_BE_CHANGED in the snippet above):
-
telegraf.influxdata.com/inputs. This contains the required configuration for the Telegraf SQL Server Input plugin. Refer to this doc for more information on configuring the SQL Server input plugin for Telegraf. Note: As telegraf will be run as a sidecar the host should always be localhost. -
In the input plugins section, which is
[[inputs.sqlserver]]:- servers. The URL to the SQLserver server. This can be a comma-separated list to connect to multiple SQLserver servers. Refer to this doc for more information on additional parameters for configuring the SQLserver input plugin for Telegraf.
-
In the tags section, which is
[inputs.sqlserver.tags]- environment. This is the deployment environment where the SQLserver cluster identified by the value of servers resides. For example: dev, prod, or qa. While this value is optional we highly recommend setting it.
- db_cluster. Enter a name to identify this SQLserver cluster. This cluster name will be shown in the Sumo Logic dashboards.
- db_cluster_address. Enter the cluster hostname or ip address that is used by the application to connect to the database. It could also be the load balancer or proxy endpoint.
- db_cluster_port. Enter the database port. If not provided, a default port will be used.
notedb_cluster_addressanddb_cluster_portshould reflect exact configuration of DB client configuration in your application, especially if you instrument it with OT tracing. The values of these fields should match exactly the connection string used by the database client (reported as values fornet.peer.nameandnet.peer.portmetadata fields).For example, if your app uses
“sqlserver-prod.sumologic.com:3306”as the connection string, the field values should be set as follows:db_cluster_address=sqlserver-prod.sumologic.com db_cluster_port=3306.If your application connects directly to a given SQL server node, rather than the whole cluster, use the application connection string to override the value of the “host” field in the Telegraf configuration:
host=sqlserver-prod.sumologic.com.Pivoting to Tracing data from Entity Inspector is possible only for “SQLServer address” Entities.
Do not modify the following values, as they will cause the Sumo Logic apps to not function correctly.
-
telegraf.influxdata.com/class: sumologic-prometheus. This instructs the Telegraf operator what output to use. This should not be changed. -
prometheus.io/scrape: "true". This ensures our Prometheus will scrape the metrics. -
prometheus.io/port: "9273". This tells prometheus what ports to scrape on. This should not be changed. -
telegraf.influxdata.com/inputs. In the tags section, which is[inputs.sqlserver.tags]:component: “database”. This value is used by Sumo Logic apps to identify application components.db_system: “sqlserver”. This value identifies the database system.
For all other parameters, see this doc for more parameters that can be configured in the Telegraf agent globally.
- Sumo Logic Kubernetes collection will automatically start collecting metrics from the pods having the labels and annotations defined in the previous step.
- Verify metrics in Sumo Logic.
Step 2: Configure Logs Collection
This section explains the steps to collect SQL Server logs from a Kubernetes environment.
-
(Recommended Method) Add labels on your SQL server pods to capture logs from standard output. Make sure that the logs from SQL Server are sent to stdout. Follow the instructions below to capture SQL Server logs from stdout on Kubernetes.
-
Apply following labels to the SQL server pods:
environment: "prod_CHANGE_ME"
component: "database"
db_system: "SQLserver"
db_cluster: "SQLserver_prod_CHANGE_ME"
Enter in values for the following parameters (marked CHANGE_ME above):
-
environment. This is the deployment environment where the SQL server cluster identified by the value of servers resides. For example: dev, prod or qa. While this value is optional we highly recommend setting it. -
db_cluster. Enter a name to identify this SQL server cluster. This cluster name will be shown in the Sumo Logic dashboards.Do not modify the following values set by this configuration as it will cause the Sumo Logic app to not function correctly.
-
component: “database”. This value is used by Sumo Logic apps to identify application components. -
db_system: “SQLserver”. This value identifies the database system. -
db_cluster_address. Enter the cluster hostname or ip address that is used by the application to connect to the database. It could also be the load balancer or proxy endpoint. -
db_cluster_port. Enter the database port. If not provided, a default port will be used.
notedb_cluster_addressanddb_cluster_portshould reflect the exact configuration of DB client configuration in your application, especially if you instrument it with OT tracing. The values of these fields should match exactly the connection string used by the database client (reported as values for net.peer.name and net.peer.port metadata fields).For example, if your application uses
“sqlserver-prod.sumologic.com:3306”as the connection string, the field values should be set as follows:db_cluster_address=sqlserver-prod.sumologic.com db_cluster_port=3306If your application connects directly to a given SQL server node, rather than the whole cluster, use the application connection string to override the value of the “host” field in the Telegraf configuration:
host=sqlserver-prod.sumologic.comPivoting to Tracing data from Entity Inspector is possible only for “SQLServer address” Entities.
For all other parameters, please see this doc for more parameters that can be configured in the Telegraf agent globally.
- The Sumologic-Kubernetes-Collection will automatically capture the logs from stdout and will send the logs to Sumologic. For more information on deploying Sumologic-Kubernetes-Collection, visit here.
- Verify logs in Sumo Logic.
-
-
(Optional) Collecting SQL server Logs from a Log File. Follow the steps below to capture SQL server logs from a log file on Kubernetes.
-
Determine the location of the SQL server log file on Kubernetes. This can be determined from the SQLserver.conf for your SQL server cluster along with the mounts on the SQL server pods.
-
Install the Sumo Logic tailing sidecar operator.
-
Add the following annotation in addition to the existing annotations.
annotations:
  tailing-sidecar: sidecarconfig;<mount>:<path_of_SQLserver_log_file>/<SQLserver_log_file_name>
Example:
annotations:
tailing-sidecar: sidecarconfig;data:/var/opt/mssql/errorlog -
Make sure that the SQL server pods are running and annotations are applied by using the command:
kubectl describe pod <SQLserver_pod_name> -
Sumo Logic Kubernetes collection will automatically start collecting logs from the pods having the annotations defined above.
-
Verify logs in Sumo Logic.
-
Add a FER to normalize the fields in Kubernetes environments. Labels created in Kubernetes environments automatically are prefixed with pod_labels. To normalize these for our app to work, we need to create a Field Extraction Rule if not already created for Proxy Application Components. To do so:
-
New UI. In the main Sumo Logic menu select Data Management, and then under Logs select Field Extraction Rules. You can also click the Go To... menu at the top of the screen and select Field Extraction Rules.
Classic UI. In the main Sumo Logic menu, select Manage Data > Logs > Field Extraction Rules. -
Click the + Add Rule button on the top right of the table.
-
The Add Field Extraction Rule form will appear.
-
Enter the following options:
-
Rule Name. Enter the name as App Observability - Proxy.
-
Applied At. Choose Ingest Time
-
Scope. Select Specific Data
-
Scope. Enter the following keyword search expression:
 pod_labels_environment=* pod_labels_component=database
 pod_labels_db_system=*
pod_labels_db_cluster=* -
Parse Expression. Enter the following parse expression:
if (!isEmpty(pod_labels_environment), pod_labels_environment, "") as environment
| pod_labels_component as component
| pod_labels_db_system as db_system
| if (!isEmpty(pod_labels_db_cluster), pod_labels_db_cluster, null) as db_cluster
-
-
Click Save to create the rule.
In Non-Kubernetes environments, Sumo Logic uses the Telegraf operator for SQL Server metric collection and the Installed Collector for collecting SQL Server logs. The diagram below illustrates the components of the SQL Server collection in a non-Kubernetes environment. 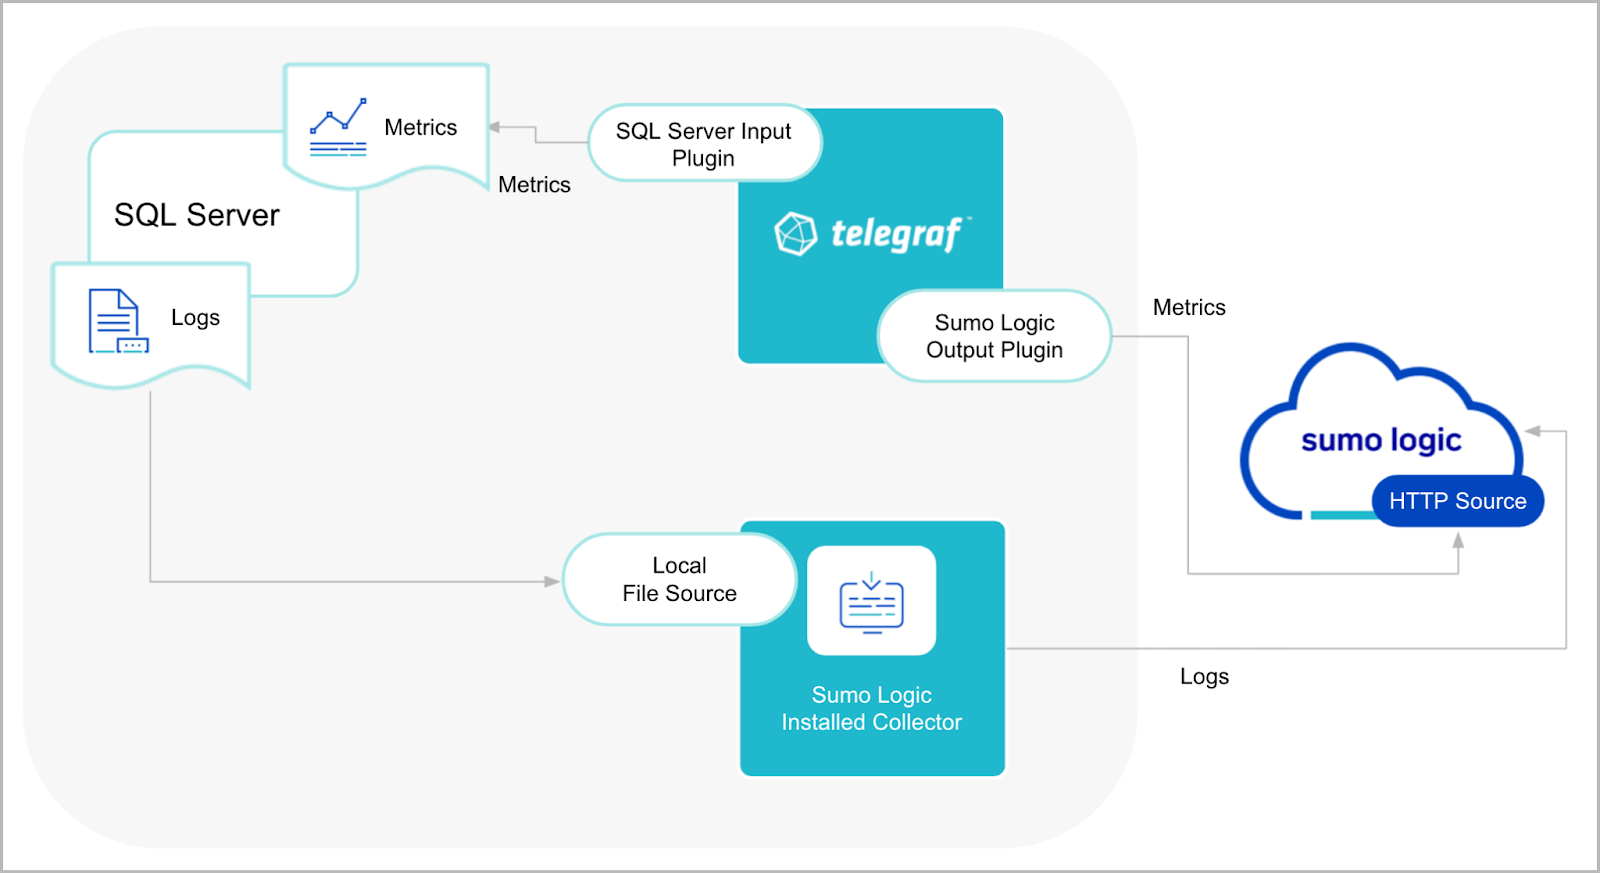
Telegraf uses the SQL Server input plugin to obtain SQL Server metrics and the Sumo Logic output plugin to send the metrics to Sumo Logic. Logs from SQL Server are collected by a Local File source.
The process to set up collection for SQL Server data is done through the following steps:
- Configure Logs Collection
- Configure logging in SQL Server
- Configure Sumo Logic Installed Collector
- Configure a local file source
- Save
- Configure Metrics Collection
- Configure a Hosted Collector
- Configure an HTTP Logs and Metrics Source
- Install Telegraf
- Configure and start Telegraf
Configure Logs Collection
This section provides instructions for configuring log collection for SQL Server running on a non-Kubernetes environment for the Sumo Logic App for SQL Server.
-
Make sure logging is turned on in SQL Server. Follow this documentation to enable it.
The Microsoft SQL Server App’s queries and dashboards depend on logs from the SQL Server
ERRORLOG, which is typically found at:C:\Program Files\Microsoft SQL Server\MSSQL11.MSSQLSERVER\MSSQL\Log\ERRORLOG \. TheERRORLOGis typically in UTF-16LE encoding, but verify the file encoding used in your SQL Server configuration. On Windows, this can be found by using a tool such as Notepad++. -
Configure an Installed Collector. If you have not already done so, install and configure an installed collector for Windows by following the documentation.
-
Configure a local file source to ingest the
ERRORLOG.- On the Collection Management screen, click Add, next to the collector, then select Add Source.
- Select Local File as the source type.
- Configure the Local File Source fields as follows:
-
Name (Required). Enter a name for the source.
-
Description (Optional).
-
File Path (Required). Enter the path to your
ERRORLOGand be sure to account for log rotations by using a wildcard:C:\Program Files\Microsoft SQL Server\MSSQL11.MSSQLSERVER\MSSQL\Log\ERRORLOG* -
Collection should begin. Set this for how far back historically you want to start collecting.
-
Source Host (Optional). Sumo Logic uses the hostname assigned by the OS unless you enter a different host name
-
Source Category (Recommended). Be sure to follow the Best Practices for Source Categories. A recommended Source Category may be
Prod/DB/MSSQL/ERRORLOG. -
Fields. Set the following fields:
component = databasedb_system = SQLserverdb_cluster = <Your_SQLserver_Cluster_Name>.Enter Default if you do not have one.environment = <Your_Environment_Name>(for example,Dev,QA, orProd)db_cluster_address. Enter the cluster hostname or ip address that is used by the application to connect to the database. It could also be the load balancer or proxy endpoint.db_cluster_port. Enter the database port. If not provided, a default port will be used.
notedb_cluster_addressanddb_cluster_portshould reflect the exact configuration of DB client configuration in your application, especially if you instrument it with OT tracing. The values of these fields should match exactly the connection string used by the database client (reported as values fornet.peer.nameandnet.peer.portmetadata fields).For example, if your application uses
“sqlserver-prod.sumologic.com:3306”as the connection string, the field values should be set as follows:db_cluster_address=sqlserver-prod.sumologic.com db_cluster_port=3306If your application connects directly to a given SQL server node, rather than the whole cluster, use the application connection string to override the value of the
“host”field in the Telegraf configuration:host=sqlserver-prod.sumologic.comPivoting to Tracing data from Entity Inspector is possible only for “SQLServer address” Entities.
-
-
In the Advanced section, select the following options:
- Enable Timestamp Parsing. Select Extract timestamp information from log file entries.
- Time Zone. Choose the option, Ignore time zone from the log file and instead use, and then select your SQL Server Server’s time zone.
- Timestamp Format. The timestamp format is automatically detected.
- Encoding. Select the encoding of the
ERRORLOGyou found in step 1, which will typically be UTF-16LE. - Enable Multiline Processing. Detect messages spanning multiple lines
- Infer Boundaries. Detect message boundaries automatically
-
Click Save.
At this point, the installed collector will start scanning the ERRORLOG and send it to Sumo Logic.
Configure Metrics Collection
Set up a Sumo Logic HTTP Source
- Configure a Hosted Collector for Metrics. To create a new Sumo Logic hosted collector, perform the steps in the Configure a Hosted Collector documentation.
- Configure an HTTP Logs & Metrics source:
- On the created Hosted Collector on the Collection Management screen, select Add Source.
- Select HTTP Logs & Metrics.
- Name. (Required). Enter a name for the source.
- Description. (Optional).
- Source Category (Recommended). Be sure to follow the Best Practices for Source Categories. A recommended Source Category may be Prod/DB/MSSQL/Metrics.
- Click Save.
- Take note of the URL provided once you click Save. You can retrieve it again by selecting Show URL next to the source on the Collection Management screen.
Set up Telegraf
- Install Telegraf if you haven’t already. Use the following steps to install Telegraf.
- Configure and start Telegraf. As part of collecting metrics data from Telegraf, we will use the SQL Server input plugin to get data from Telegraf and the Sumo Logic output plugin to send data to Sumo Logic.
Before you configure Telegraf, you will need to create a login on every SQL Server instance you want to monitor with the following script. This script will create a user in SQL Server which will be used as input to the Telegraf configuration.
USE master;
GO
CREATE LOGIN [<Username_ENV_TO_BE_CHANGED>] WITH PASSWORD=N'<Password_ENV_TO_BE_CHANGED>';
GO
GRANT VIEW SERVER STATE TO [<Username_ENV_TO_BE_CHANGED>];
GO
GRANT VIEW ANY DEFINITION TO [<Username_ENV_TO_BE_CHANGED>];
GO
Create or modify telegraf.conf and copy and paste the text below:
[[inputs.sqlserver]]
  servers = [ "Server=<IP_ENV_TO_BE_CHANGED>;Port=<Port_ENV_TO_BE_CHANGED>;User Id=<Username_ENV_TO_BE_CHANGED>;Password=<Password_ENV_TO_BE_CHANGED>;app name=telegraf;log=1;",]
  database_type = "SQLServer"
  exclude_query = [ 'SQLServerSchedulers' , 'SQLServerRequests' ]
  tagexclude = ['physical_filename','volume_mount_point']
    [inputs.sqlserver.tags]
       environment="prod"
       component="database"
       db_cluster= "ENV_TO_BE_CHANGED"
       db_cluster_address = "ENV_TO_BE_CHANGED"
       db_cluster_port = "ENV_TO_BE_CHANGED"
       db_system = "sqlserver"
[[outputs.sumologic]]
  url = "<URL_from_HTTP_Logs_and_Metrics_Source>"
  data_format = "prometheus"
Enter values for fields annotated with <ENV_TO_BE_CHANGED> to the appropriate values. Do not include the brackets (< >) in your final configuration:
-
Input plugins section, which is
[[inputs.sqlserver]]:servers. The URL to the SQL server. For more information on additional parameters to configure the SQL Server input plugin for Telegraf see this doc.
-
In the tags section, which is
[inputs.sqlserver.tags]:environment. This is the deployment environment where the SQL Server cluster identified by the value of servers resides. For example; dev, prod, or QA. While this value is optional we highly recommend setting it.db_cluster. Enter a name to identify this SQLserver cluster. This cluster name will be shown in our dashboards.db_cluster_address. Enter the cluster hostname or ip address that is used by the application to connect to the database. It could also be the load balancer or proxy endpoint.db_cluster_port. Enter the database port. If not provided, a default port will be used.
notedb_cluster_addressanddb_cluster_portshould reflect the exact configuration of DB client configuration in your application, especially if you instrument it with OT tracing. The values of these fields should match exactly the connection string used by the database client (reported as values fornet.peer.nameandnet.peer.portmetadata fields).For example, if your application uses
“sqlserver-prod.sumologic.com:3306”as the connection string, the field values should be set as follows:db_cluster_address=sqlserver-prod.sumologic.com db_cluster_port=3306If your application connects directly to a given SQL server node, rather than the whole cluster, use the application connection string to override the value of the
“host”field in the Telegraf configuration:host=sqlserver-prod.sumologic.comPivoting to Tracing data from Entity Inspector is possible only for “SQLServer address” Entities.
-
In the output plugins section, which is
[[outputs.sumologic]]:- URL. This is the HTTP source URL created previously. See this doc for more information on additional parameters for configuring the Sumo Logic Telegraf output plugin.
Here’s an explanation for additional values set by this Telegraf configuration.
If you haven’t defined a cluster in SQL Server, then enter default for db_cluster.
There are additional values set by the Telegraf configuration. We recommend not to modify these values as they might cause the Sumo Logic app to not function correctly.
-
data_format: “prometheus”. In the output[[outputs.sumologic]]plugins section. Metrics are sent in the Prometheus format to Sumo Logic. -
component = “database”. In the input[[inputs.SQLserver]]plugins section. This value is used by Sumo Logic apps to identify application components. -
db_system = “sqlserver”. In the input plugins sections. This value identifies the database system.See this doc for all other parameters that can be configured in the Telegraf agent globally.
After you've finalized your telegraf.conf file, you can start or reload the telegraf service using instructions from this doc.
At this point, Telegraf should start collecting the SQL Server metrics and forward them to the Sumo Logic HTTP Source.
Installing the Microsoft SQL Server app
To install the app, do the following:
Next-Gen App: To install or update the app, you must be an account administrator or a user with Manage Apps, Manage Monitors, Manage Fields, Manage Metric Rules, and Manage Collectors capabilities depending upon the different content types part of the app.
- Select App Catalog.
- In the 🔎 Search Apps field, run a search for your desired app, then select it.
- Click Install App.
note
Sometimes this button says Add Integration.
- Click Next in the Setup Data section.
- In the Configure section of your respective app, complete the following fields.
- Is K8S deployment involved. Specify if resources being monitored are partially or fully deployed on Kubernetes (K8s)
- Click Next. You will be redirected to the Preview & Done section.
Post-installation
Once your app is installed, it will appear in your Installed Apps folder, and dashboard panels will start to fill automatically.
Each panel slowly fills with data matching the time range query received since the panel was created. Results will not immediately be available but will be updated with full graphs and charts over time.
As part of the app installation process, the following fields will be created by default:
componentenvironmentdb_systemdb_clusterdb_cluster_addressdb_cluster_port
Additionally, if you are using SQL Server in the Kubernetes environment, the following additional fields will be created by default during the app installation process:
pod_labels_componentpod_labels_environmentpod_labels_db_systempod_labels_db_clusterpod_labels_db_cluster_addresspod_labels_db_cluster_port
For information on setting up fields, see Fields.
Viewing Microsoft SQL Server dashboards
All dashboards have a set of filters that you can apply to the entire dashboard. Use these filters to drill down and examine the data to a granular level.
- You can change the time range for a dashboard or panel by selecting a predefined interval from a drop-down list, choosing a recently used time range, or specifying custom dates and times. Learn more.
- You can use template variables to drill down and examine the data on a granular level. For more information, see Filtering Dashboards with Template Variables.
- Most Next-Gen apps allow you to provide the scope at the installation time and are comprised of a key (
_sourceCategoryby default) and a default value for this key. Based on your input, the app dashboards will be parameterized with a dashboard variable, allowing you to change the dataset queried by all panels. This eliminates the need to create multiple copies of the same dashboard with different queries.
Overview
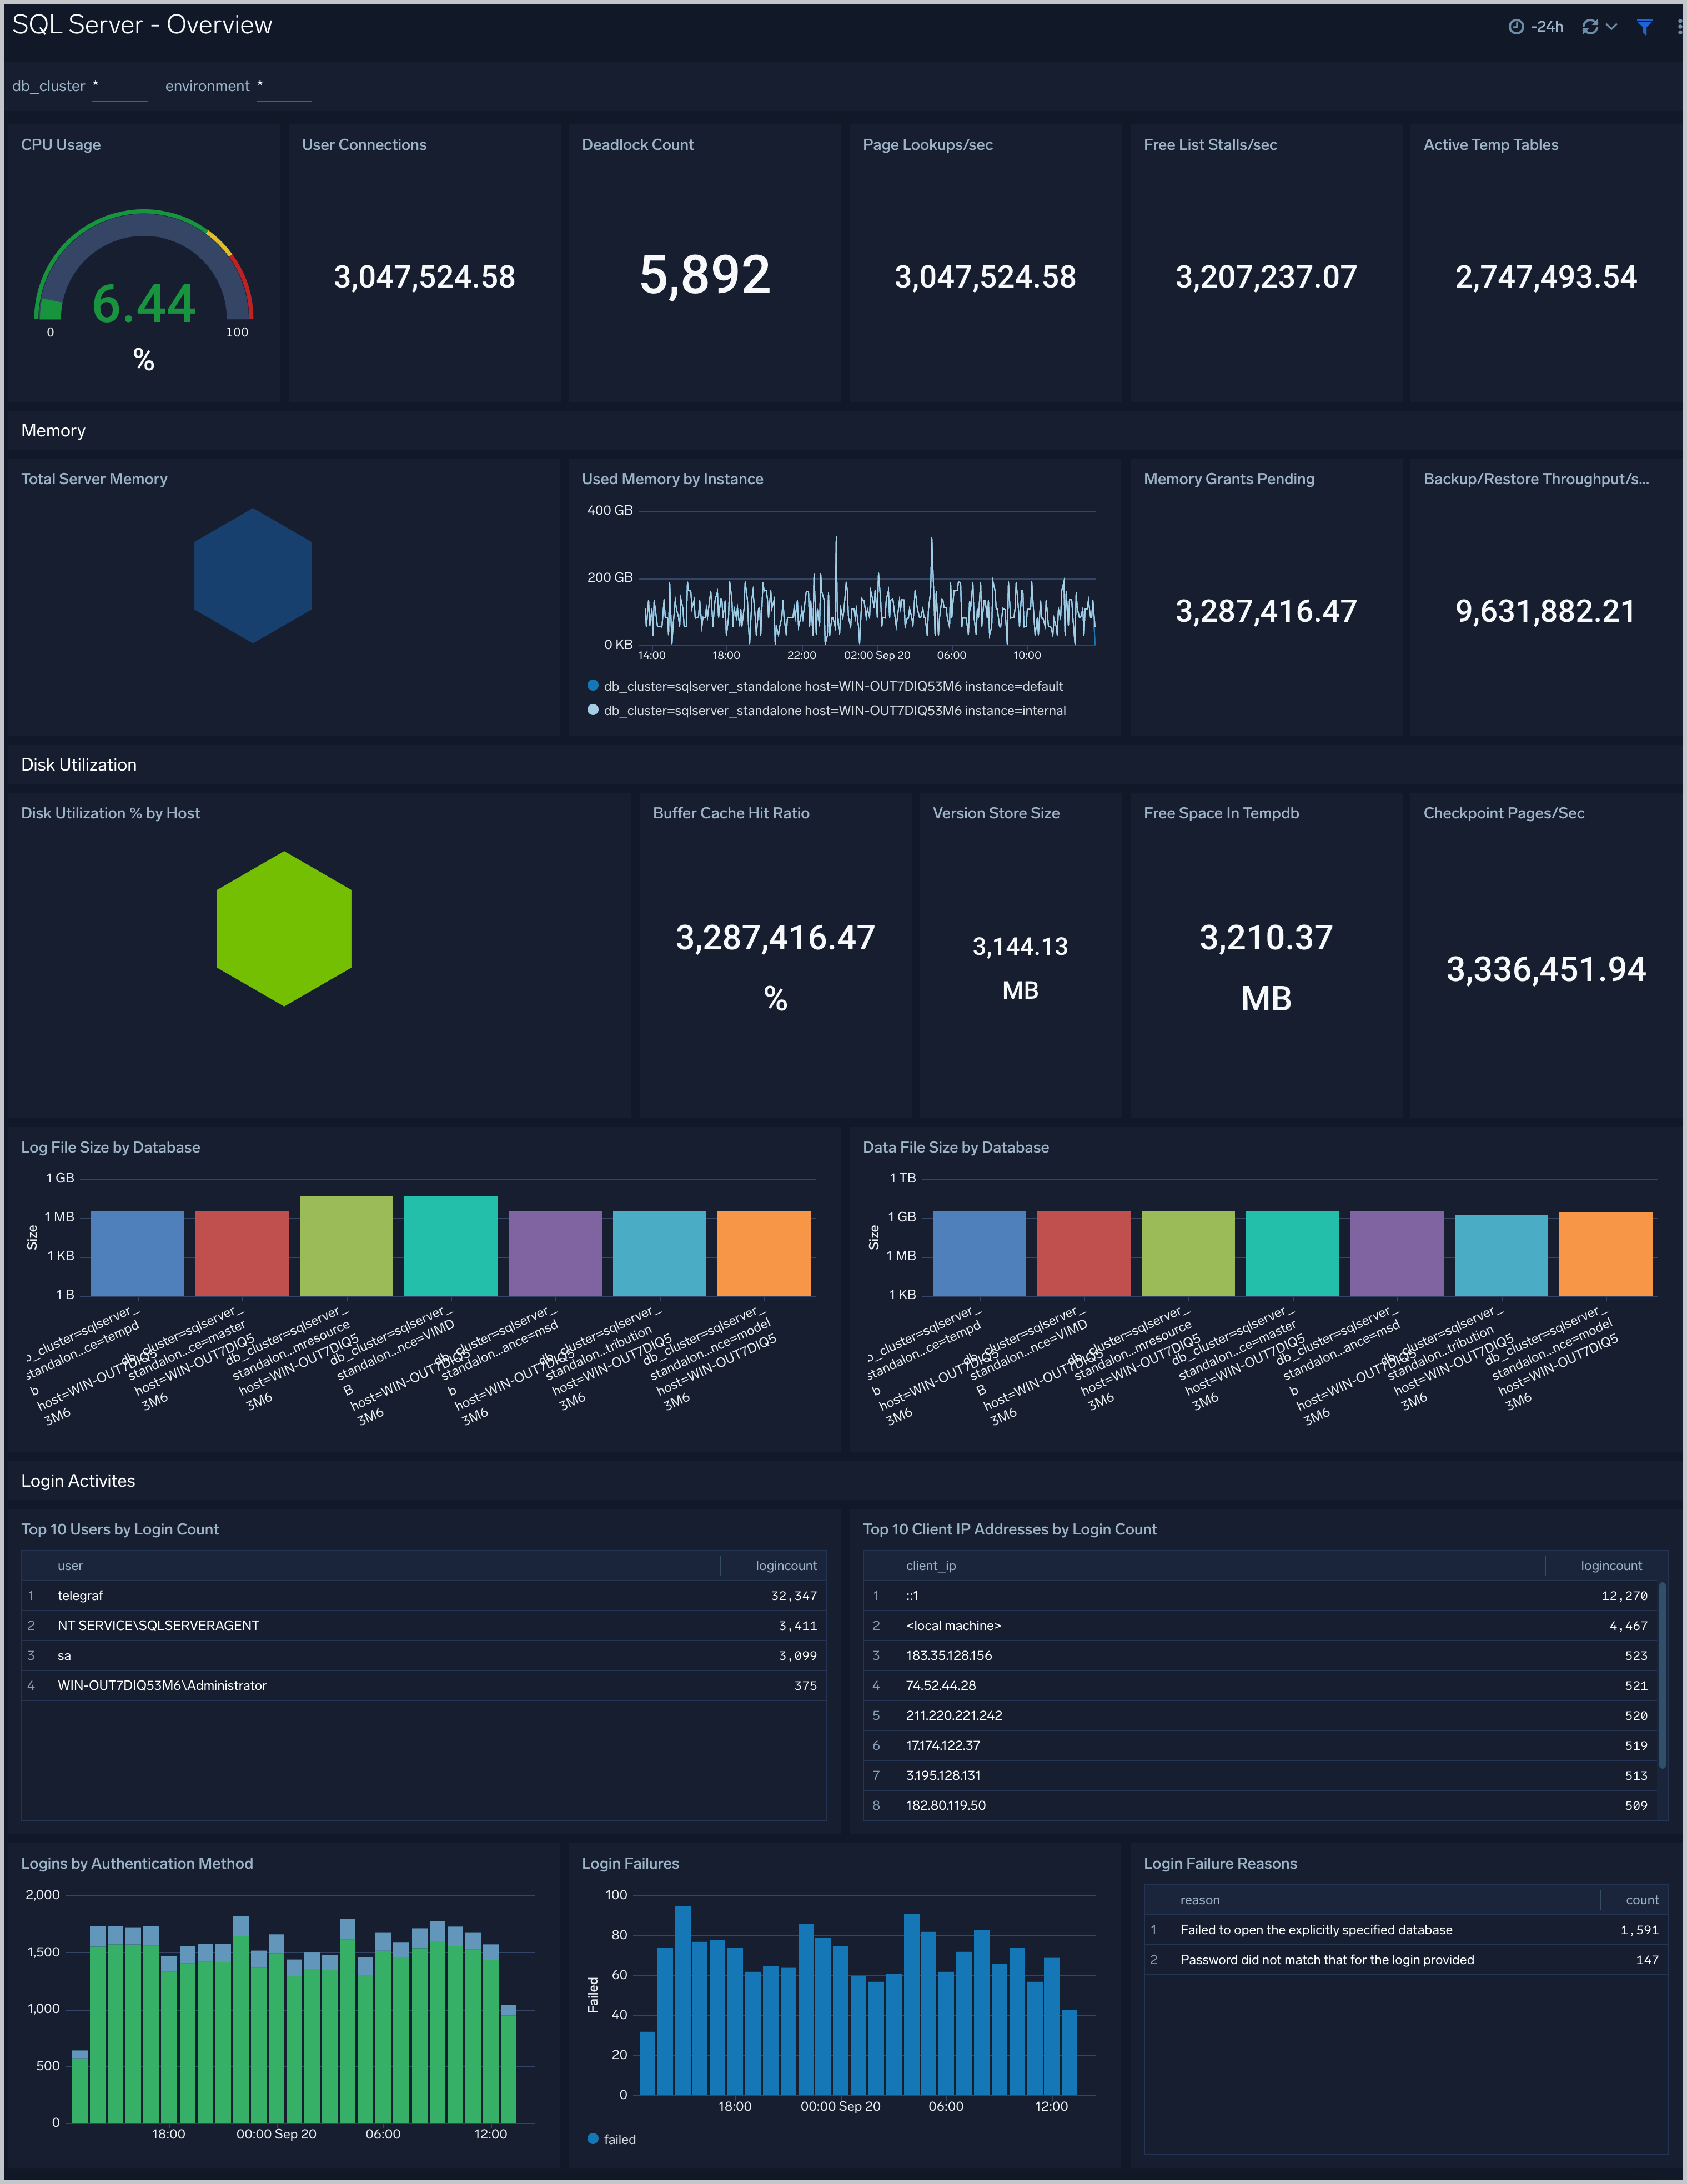
The SQL Server - Overview dashboard provides a snapshot overview of your SQL Server instance. Use this dashboard to understand CPU, Memory, and Disk utilization of your SQL Server (s) deployed in your cluster. This dashboard also provides login activities and methods by users.
Use this dashboard to:
- Analyze CPU, Memory and disk utilization.
- Examine Login activities, failures, and failure reasons.
General Health
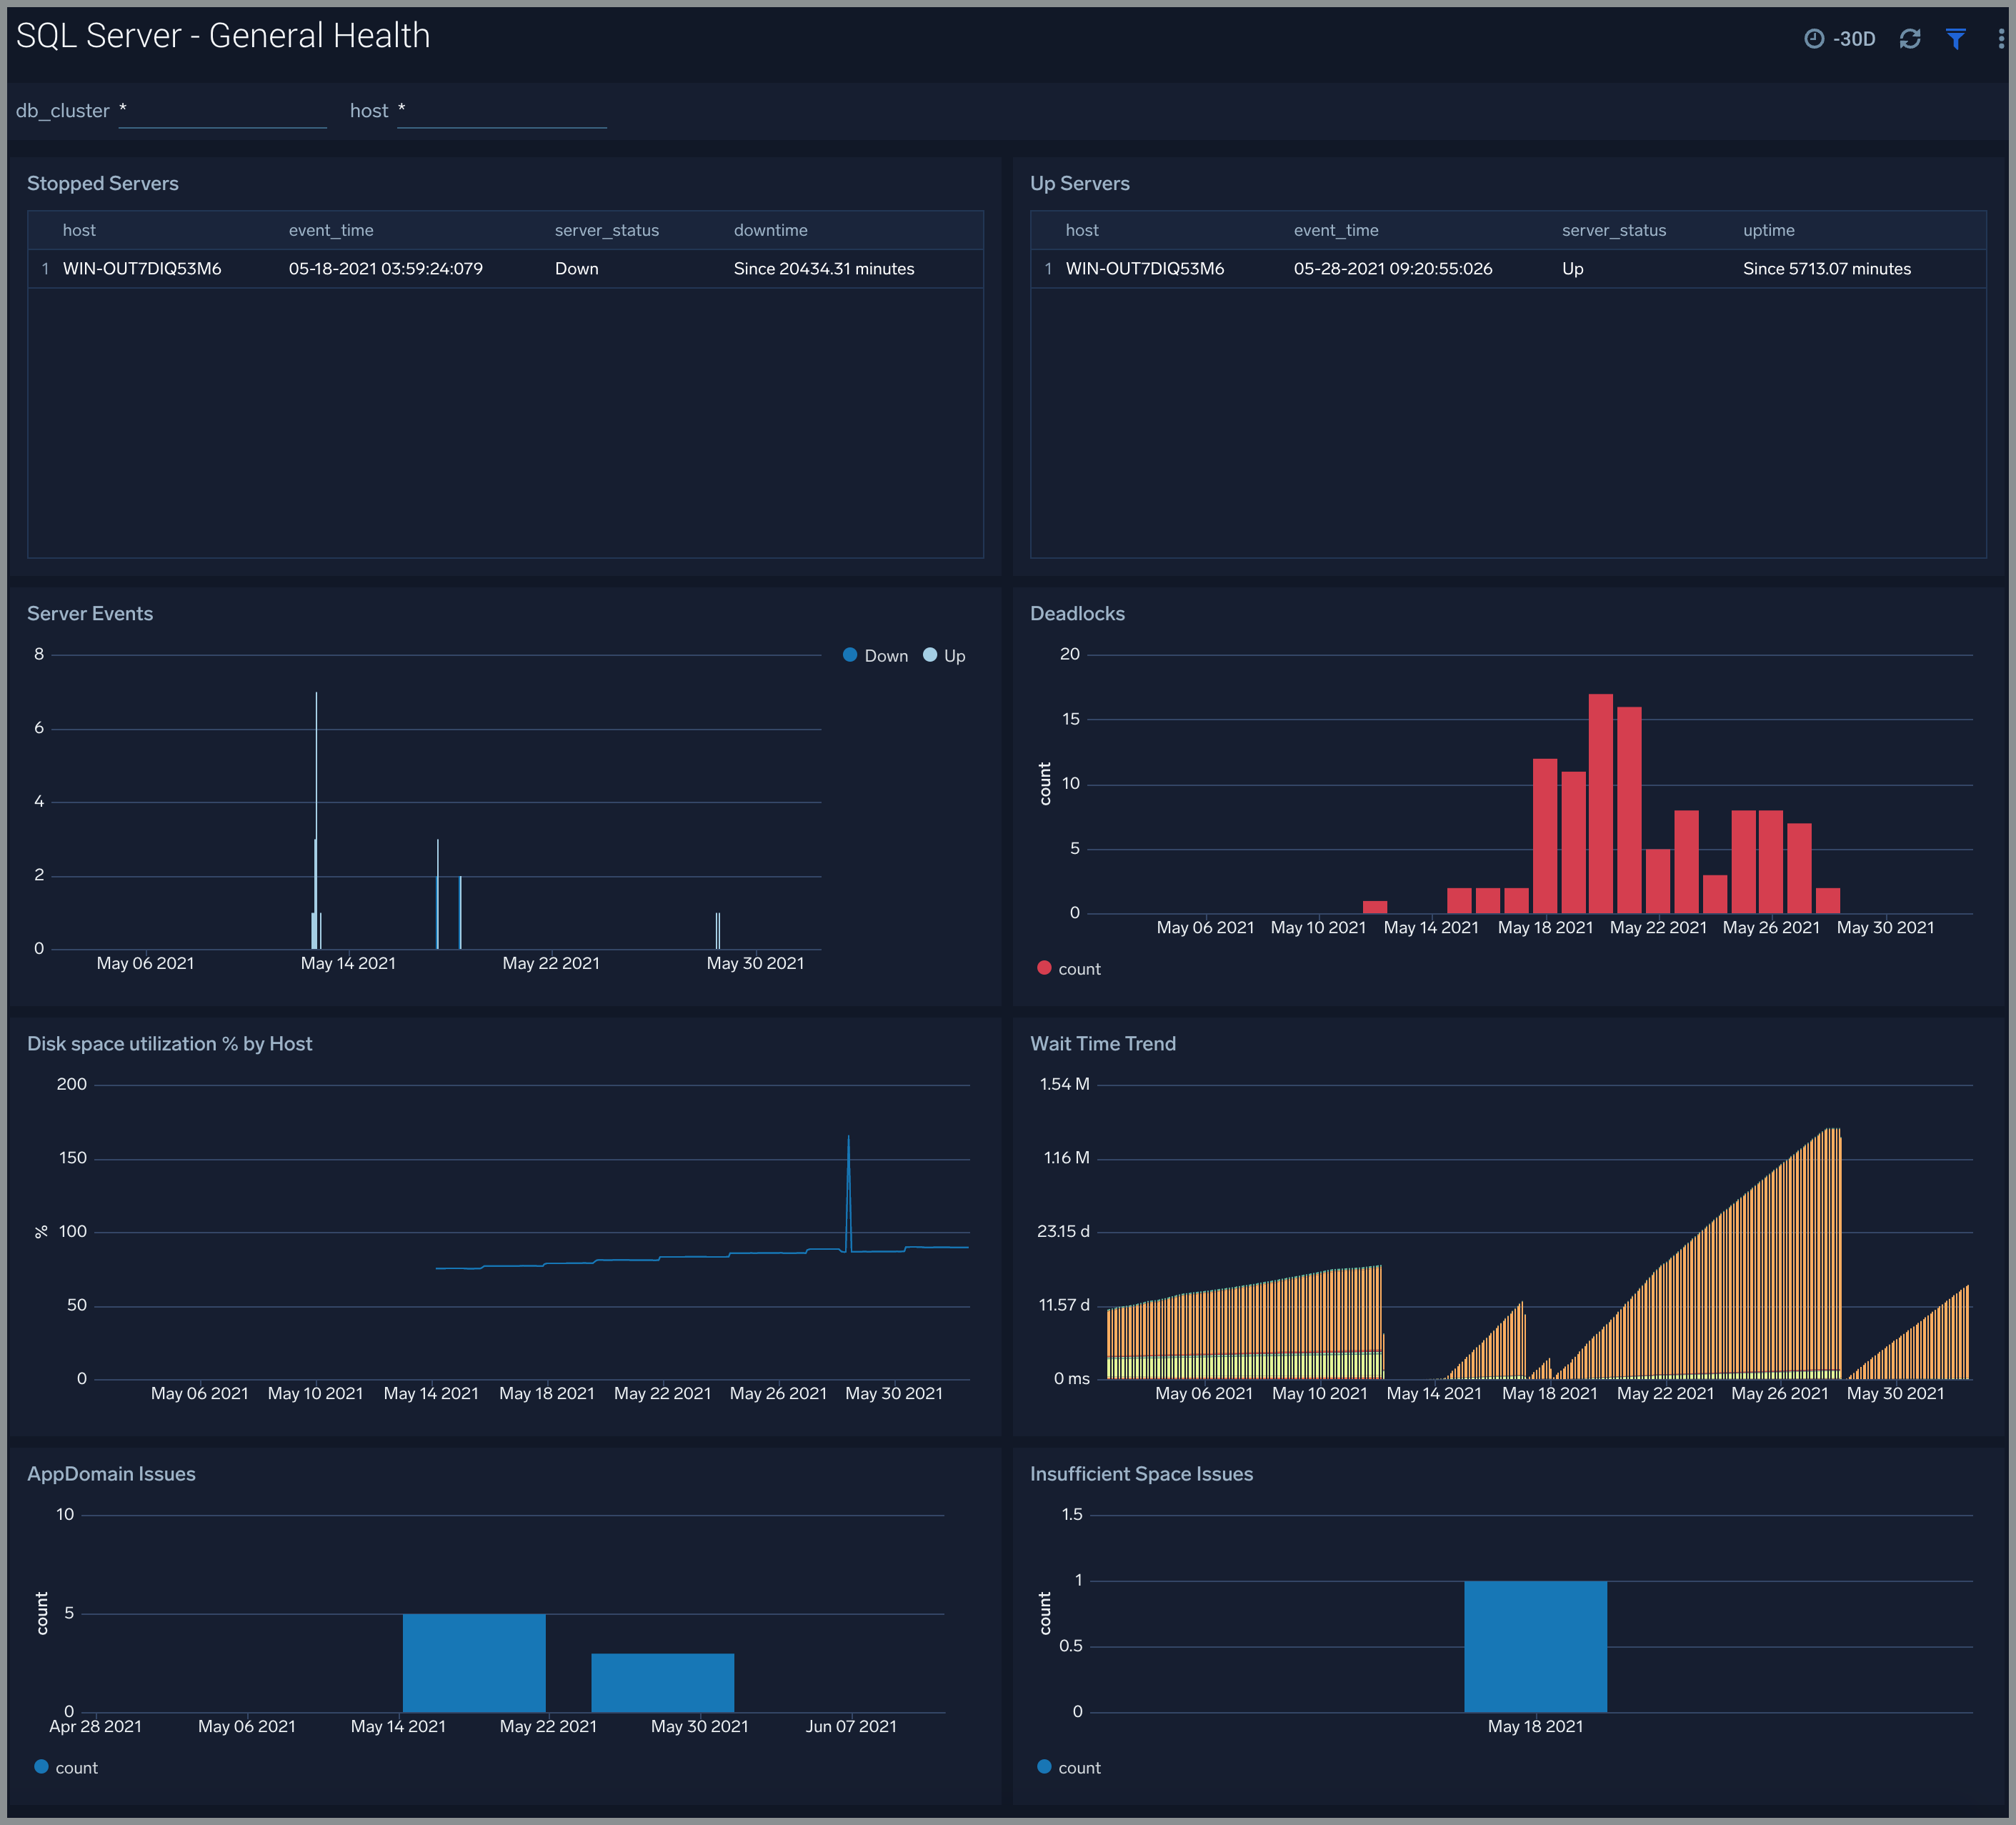
The SQL Server - General Health dashboard gives you the overall health of SQL Server. Use this dashboard to analyze server events including stopped/up servers, and corresponding down/uptime, monitor disk space percentage utilization, wait time trend, app-domain issues by SQL server.
Use this dashboard to:
- Analyze server events including stopped/up servers, and corresponding down/uptime.
- Monitor server events trends including SQL Server wait time.
- Get insight into app-domain and percentage disk utilization issues by SQL Server.
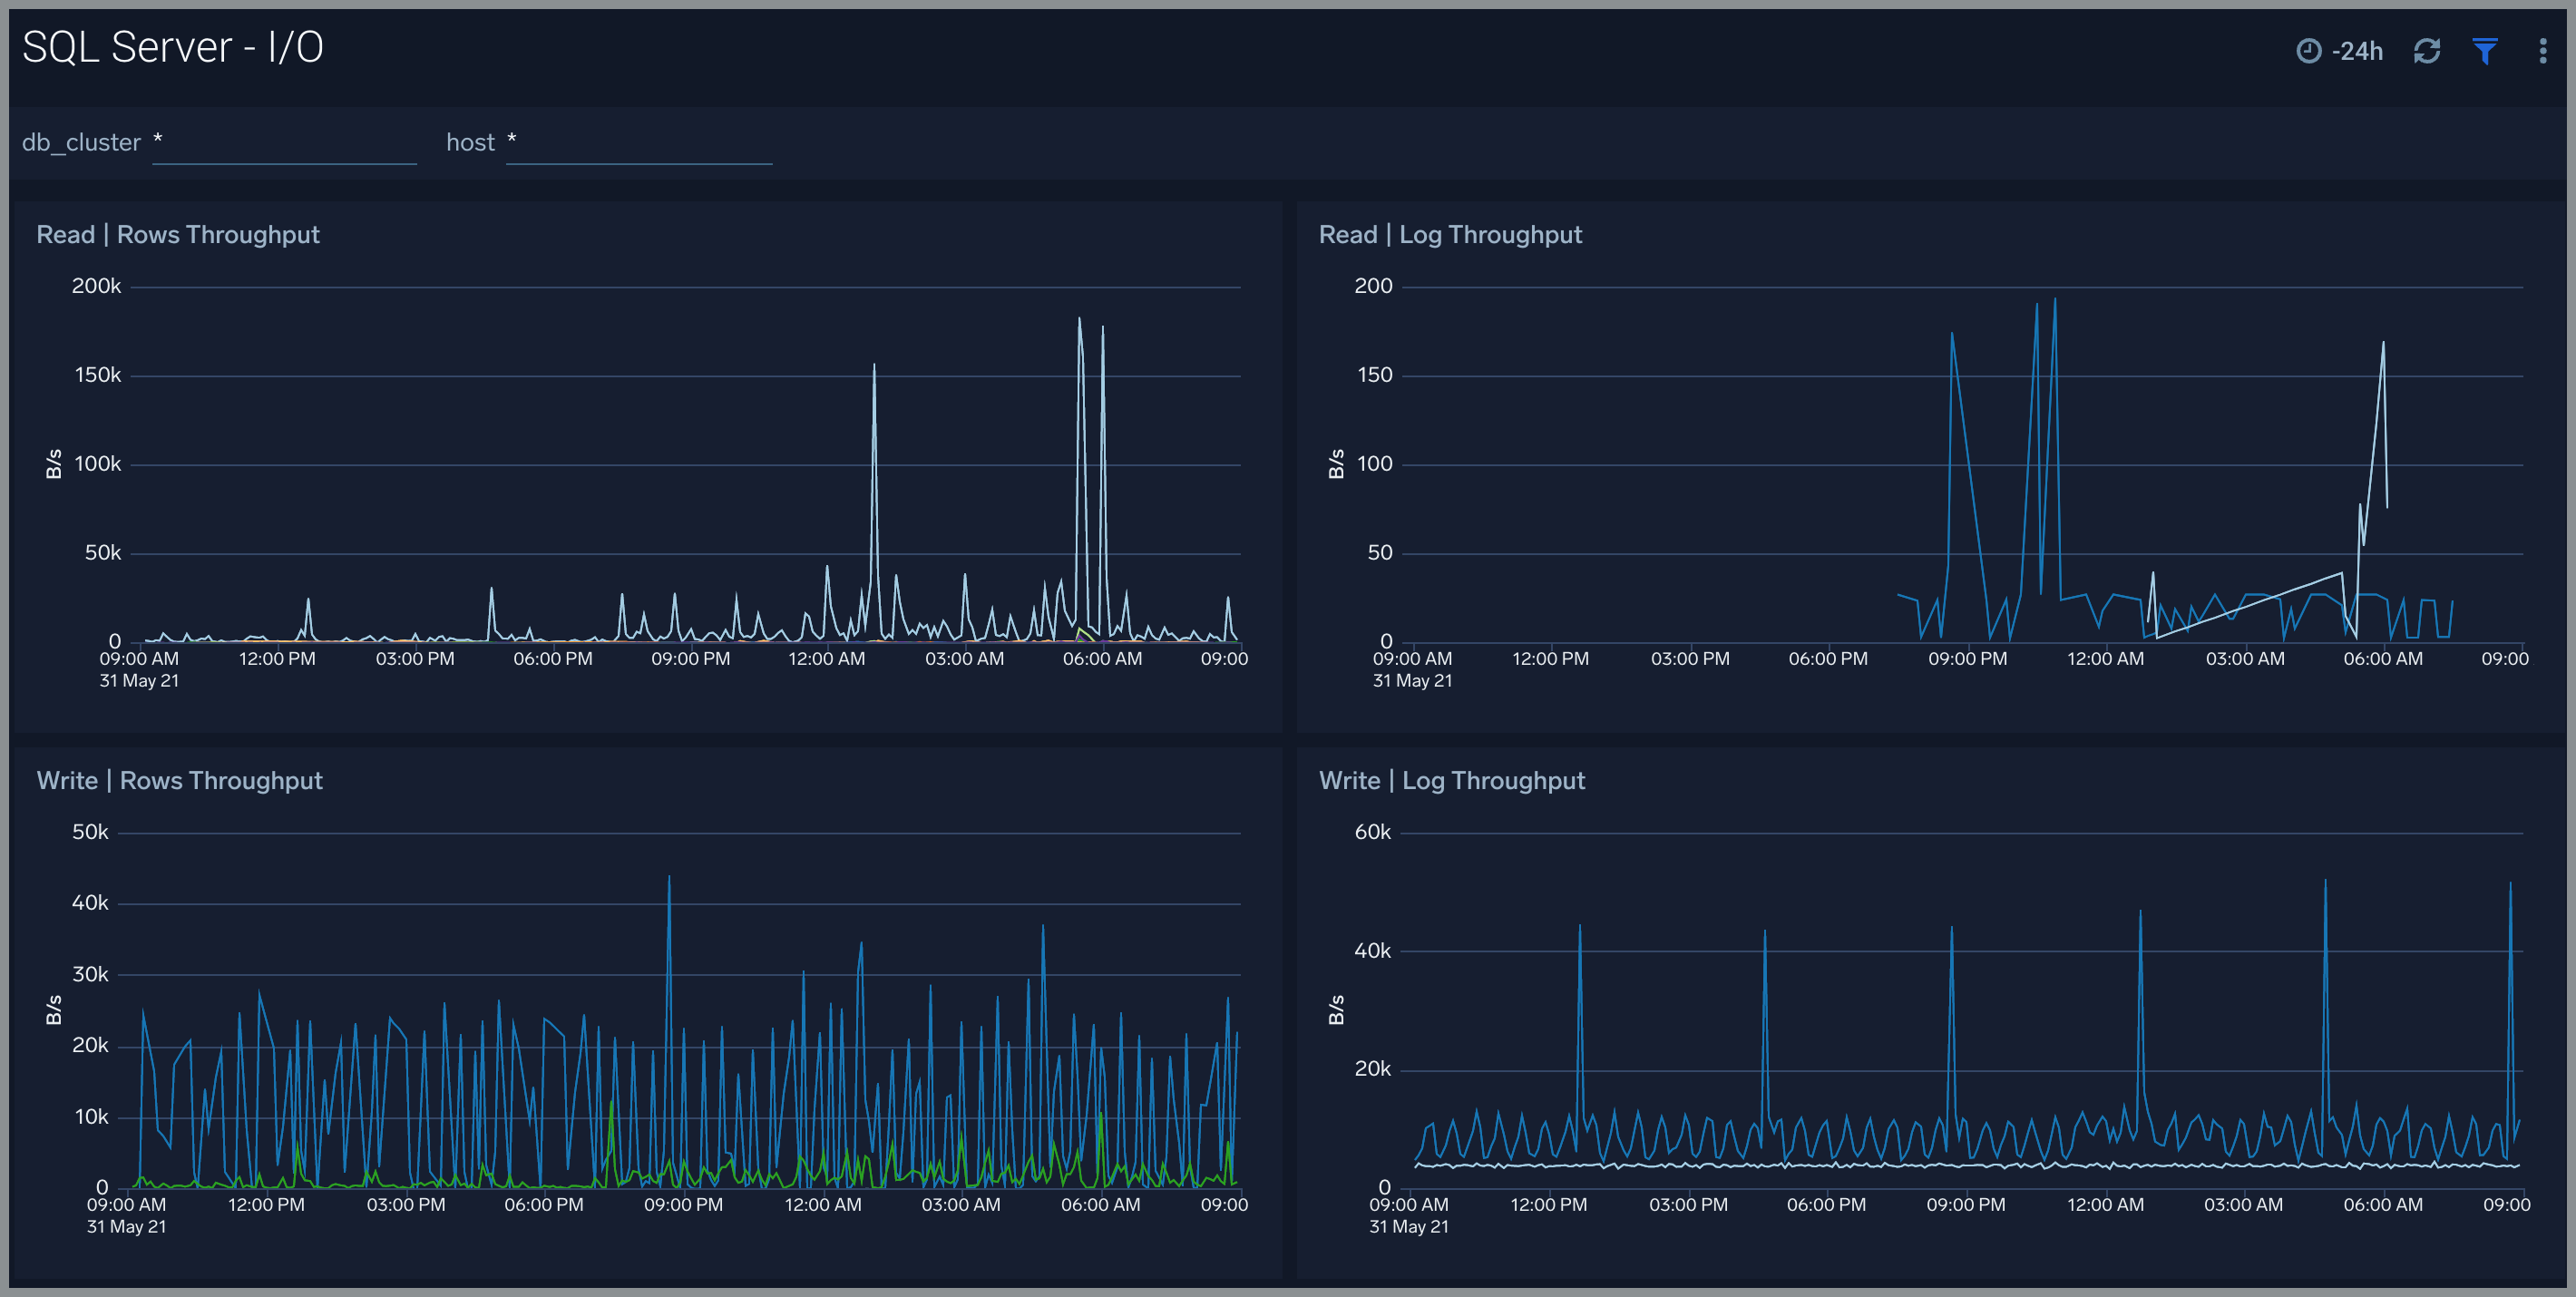
I/O
The SQL Server - I/O dashboard provides read and write bytes throughput by SQL Server.
Use this dashboard to:
- Analyze performance of SQL server by monitoring read and write bytes throughput of your SQL server instance.
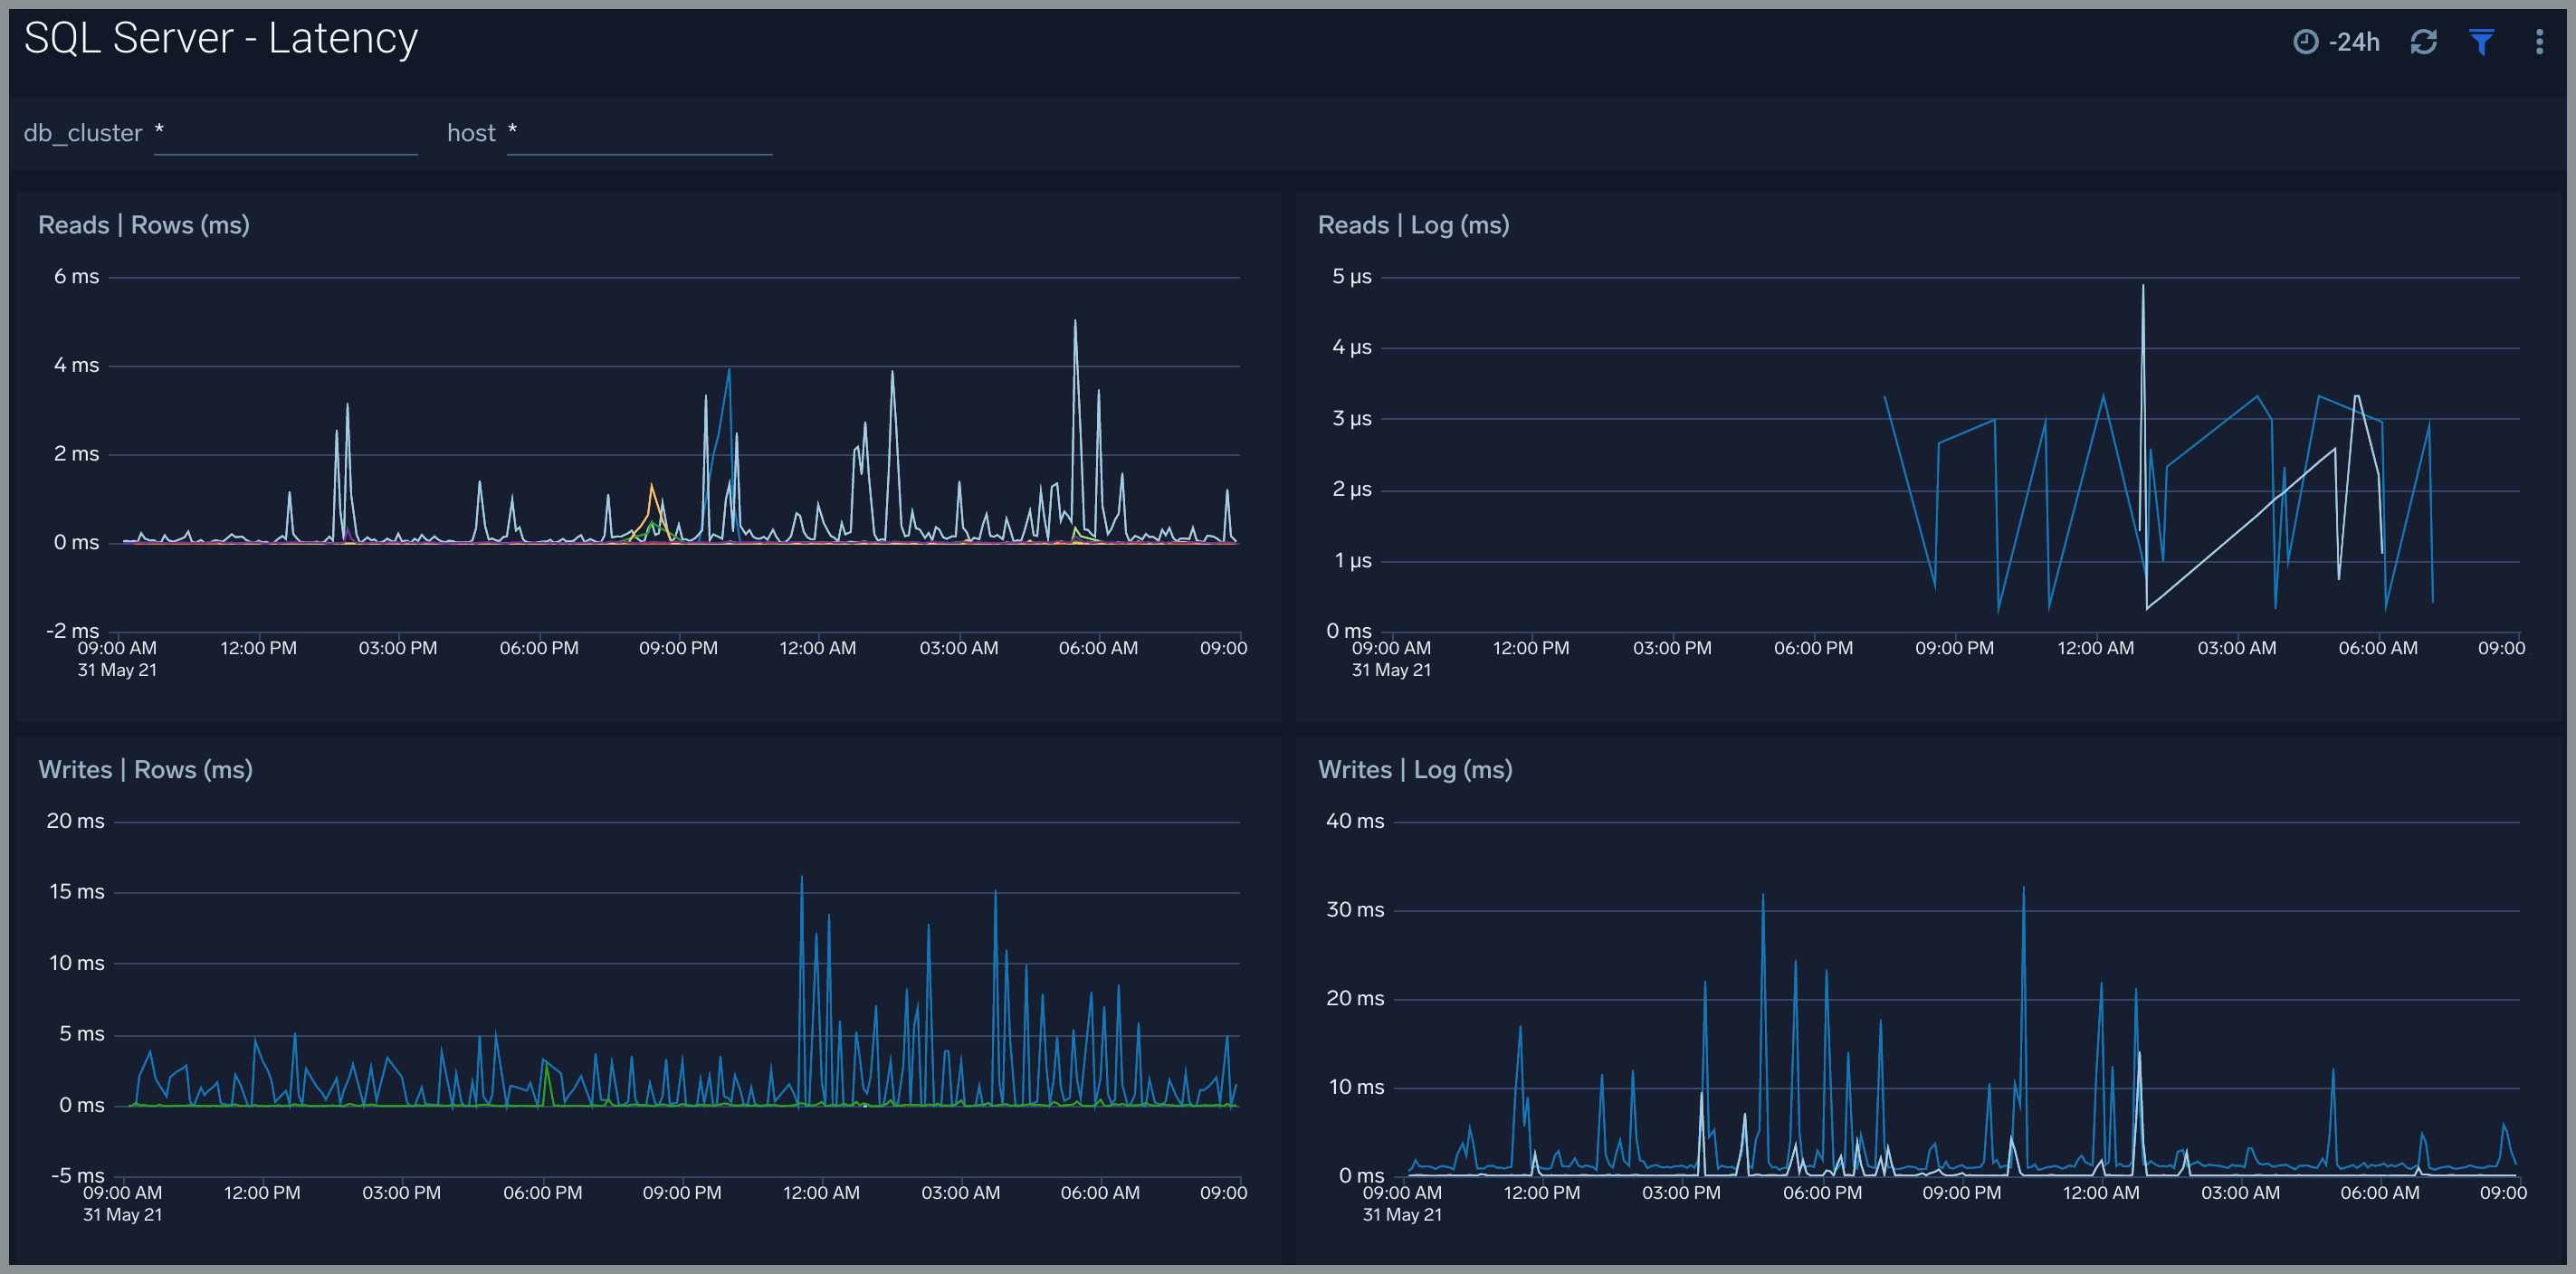
Latency
The SQL Server - Latency dashboard provides read and write latency trend by SQL Server.
Use this dashboard to:
- Analyze performance of SQL server by monitoring read and write latency of your SQL server instance.
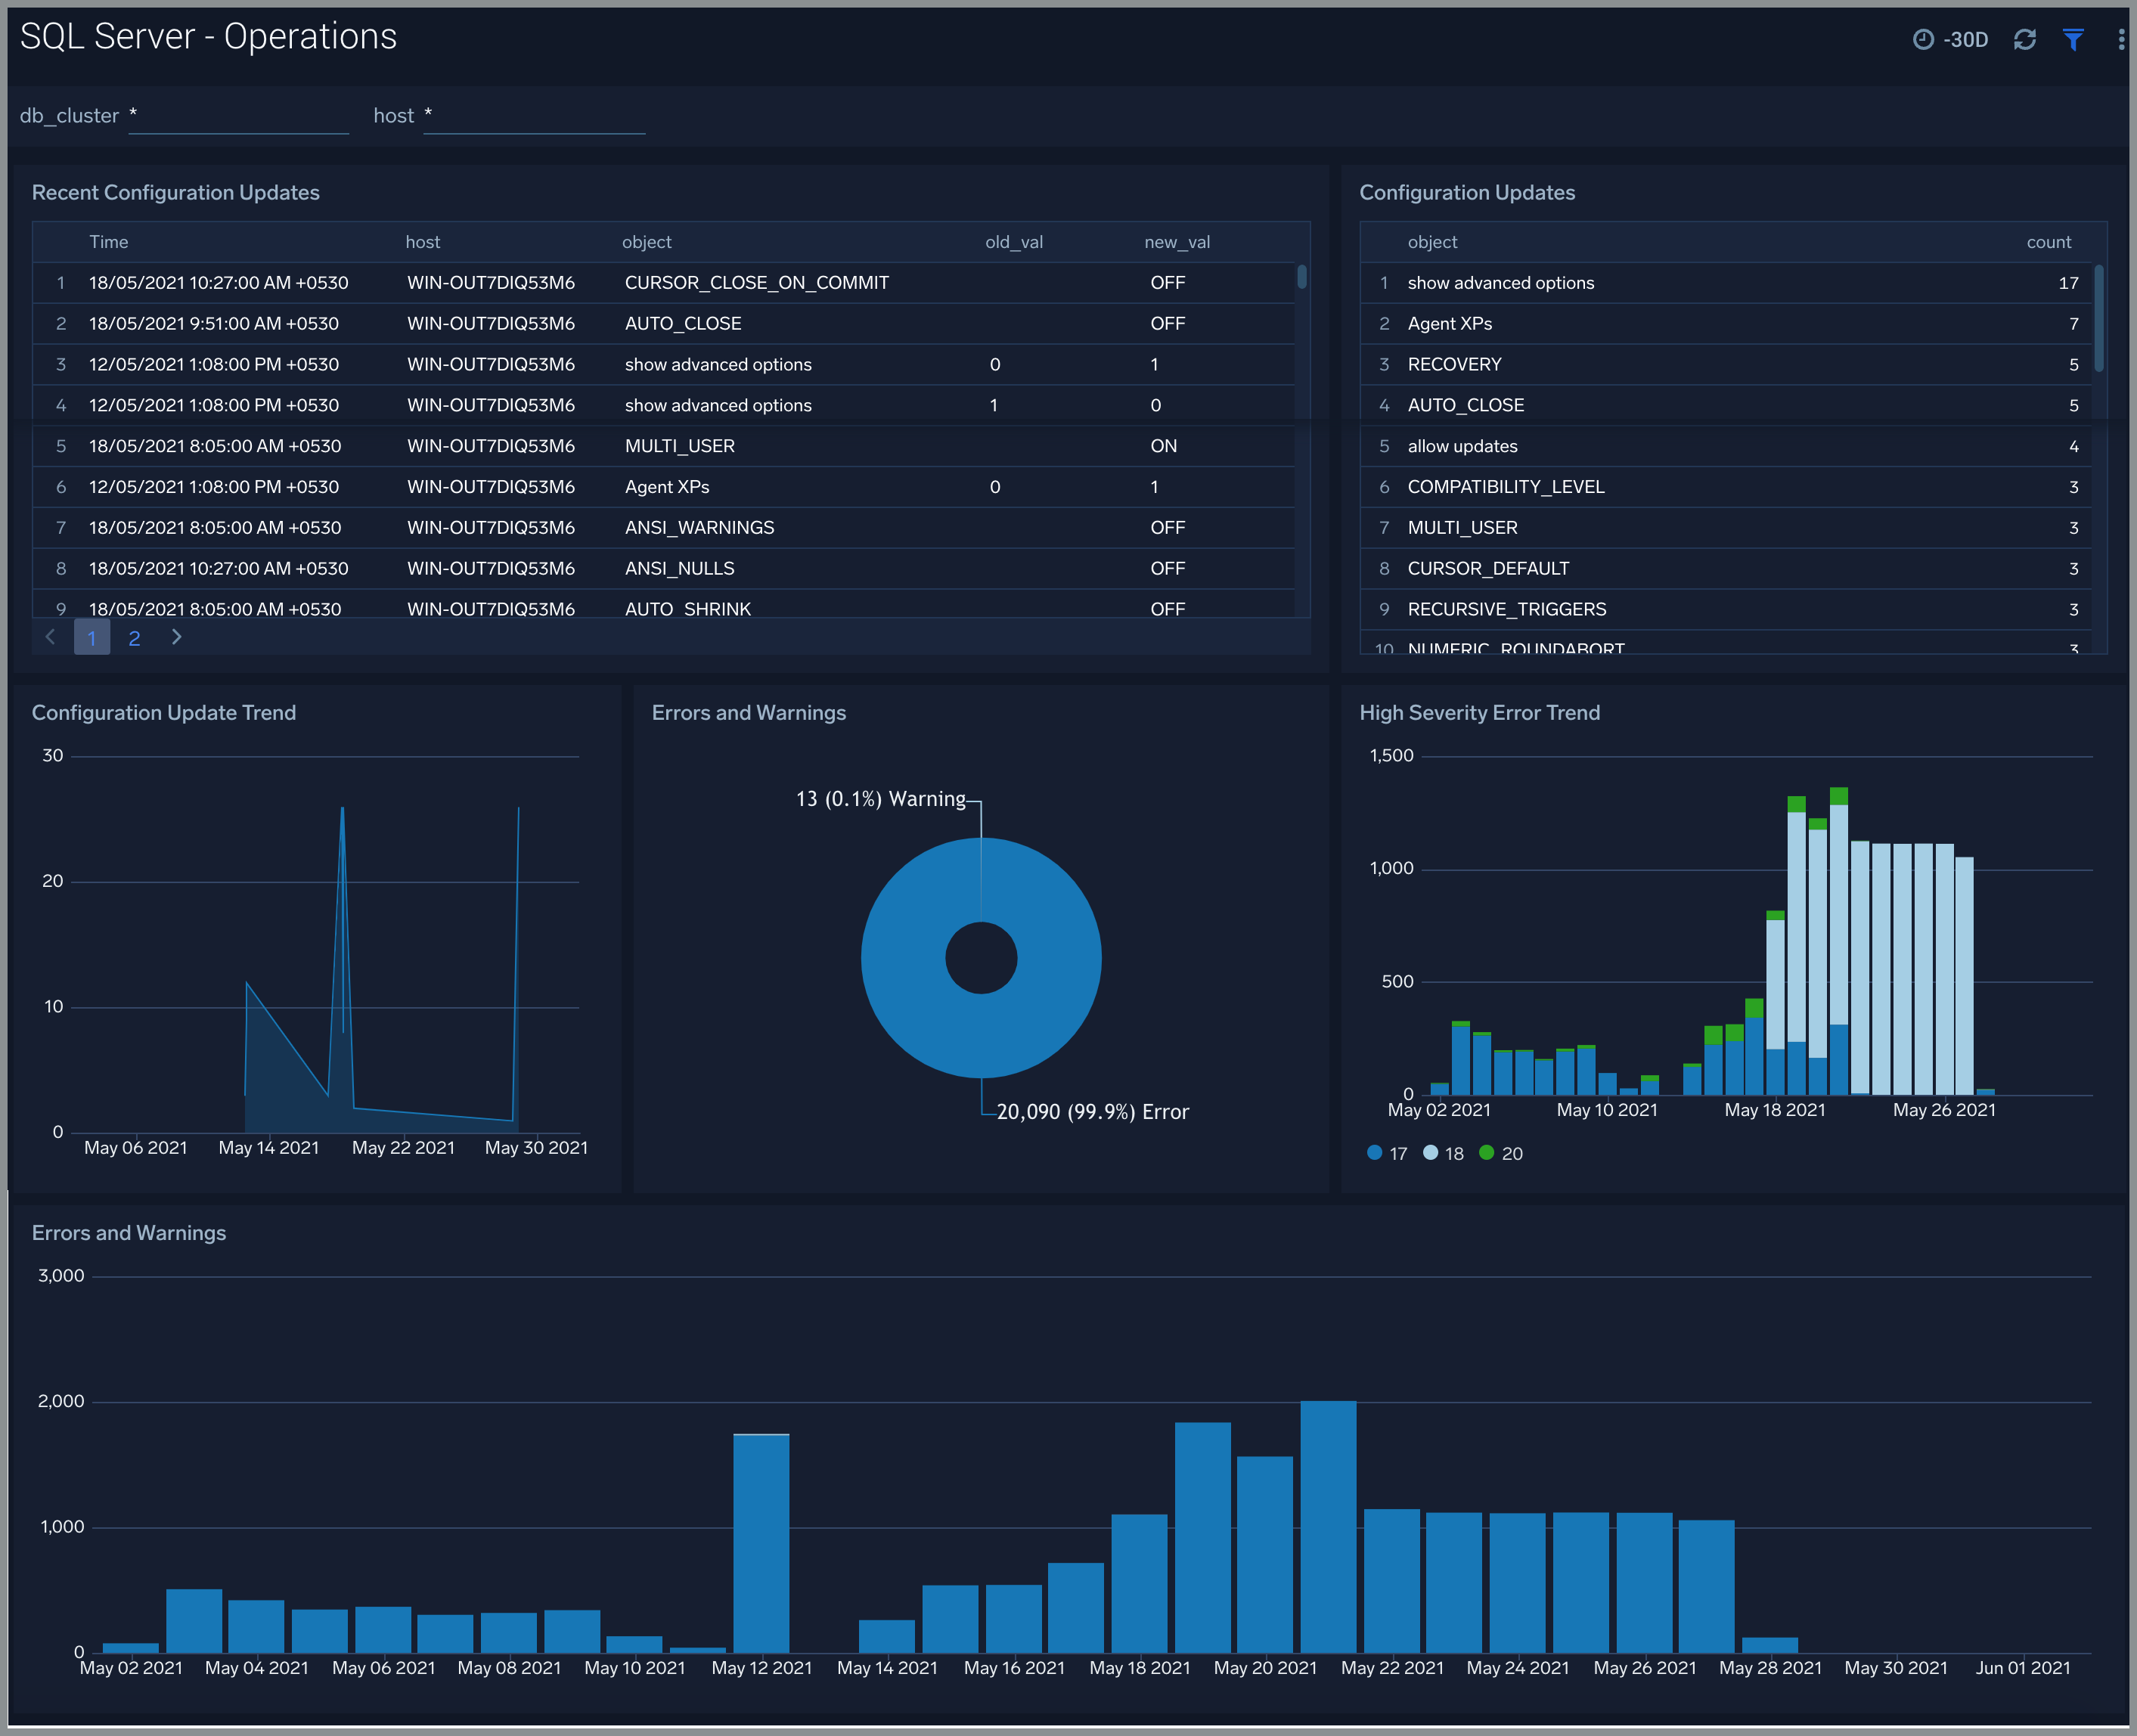
Operations
The SQL Server - Operations displays recent server configuration changes, number & type of configuration updates, error and warnings, high severity error, and warning trends.
Use this dashboard to:
- Get insights into configuration changes and updates to SQL server instance.
- Monitor any errors and warnings.
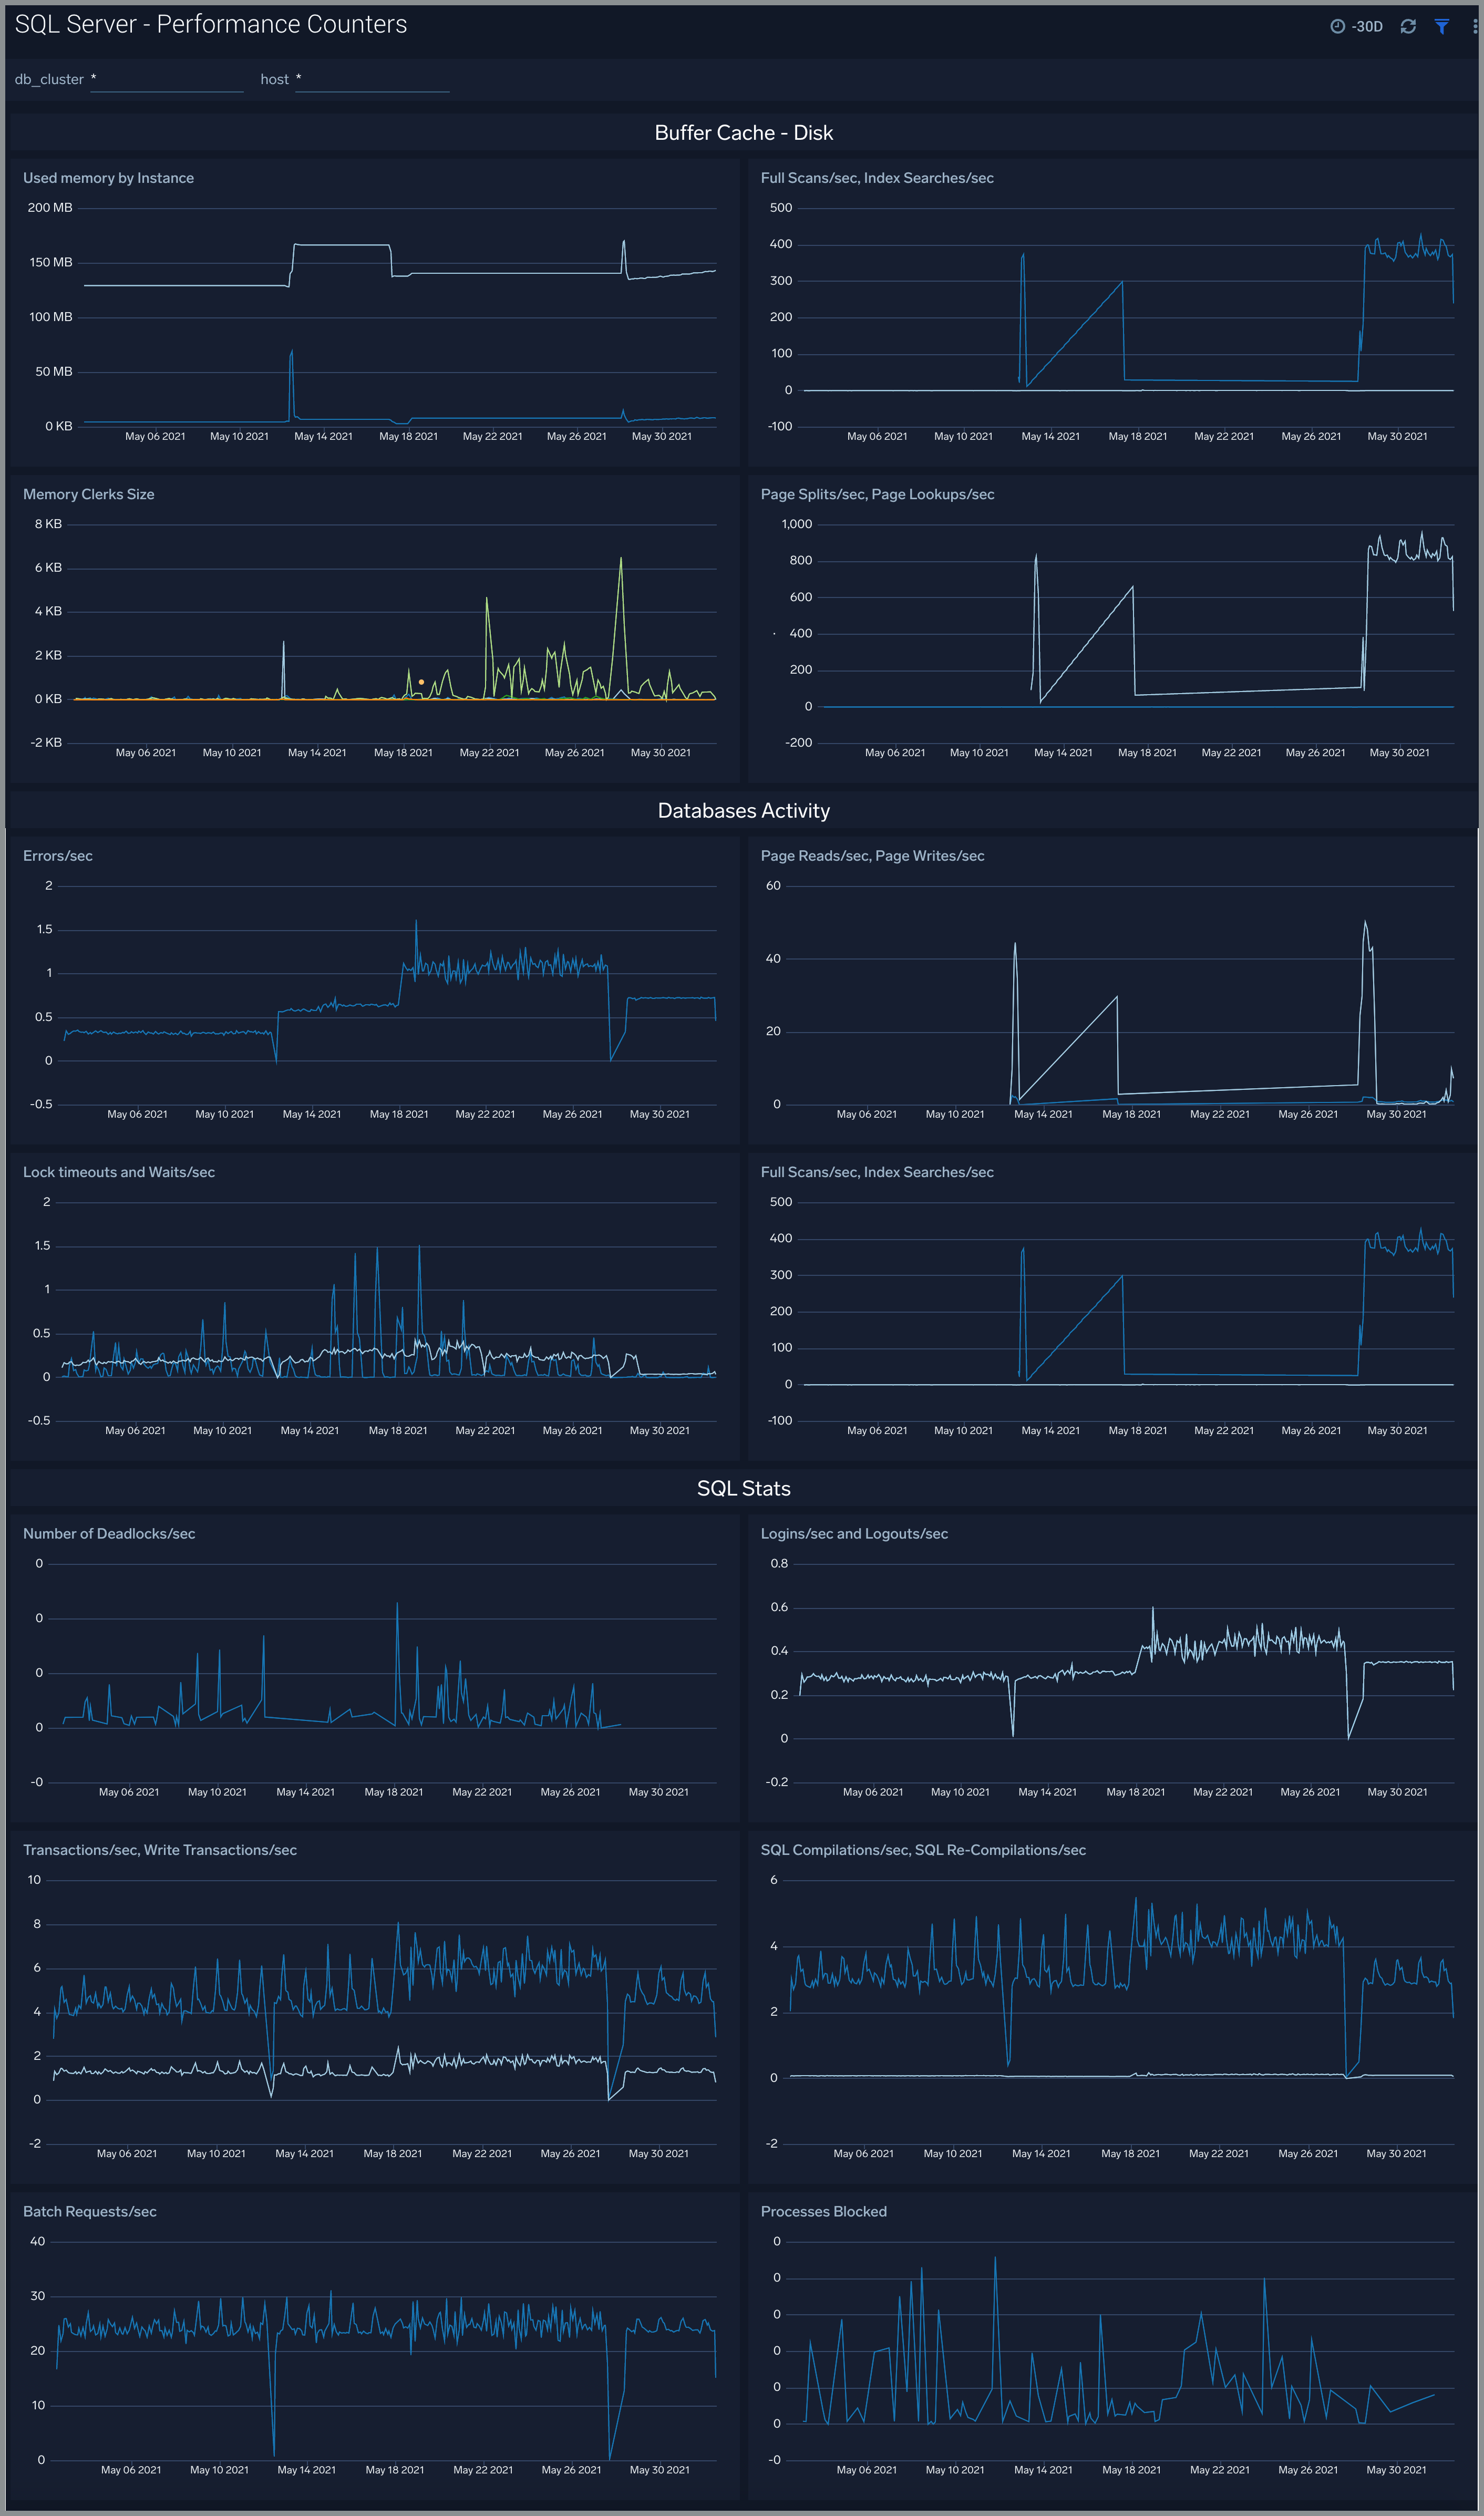
Performance Counters
The SQL Server - Performance Counters dashboard shows performance counters related to database activities, SQL statistics, and buffer cache.
Use this dashboard to:
- Get insights into database activities such as errors/sec, lock timeouts/sec, and wait/sec, deadlocks/sec, and write transactions/sec.
- Monitor important SQL statistics such as login/sec, logout/sec, sql compilations/sec, processes blocked and batch requests/sec.
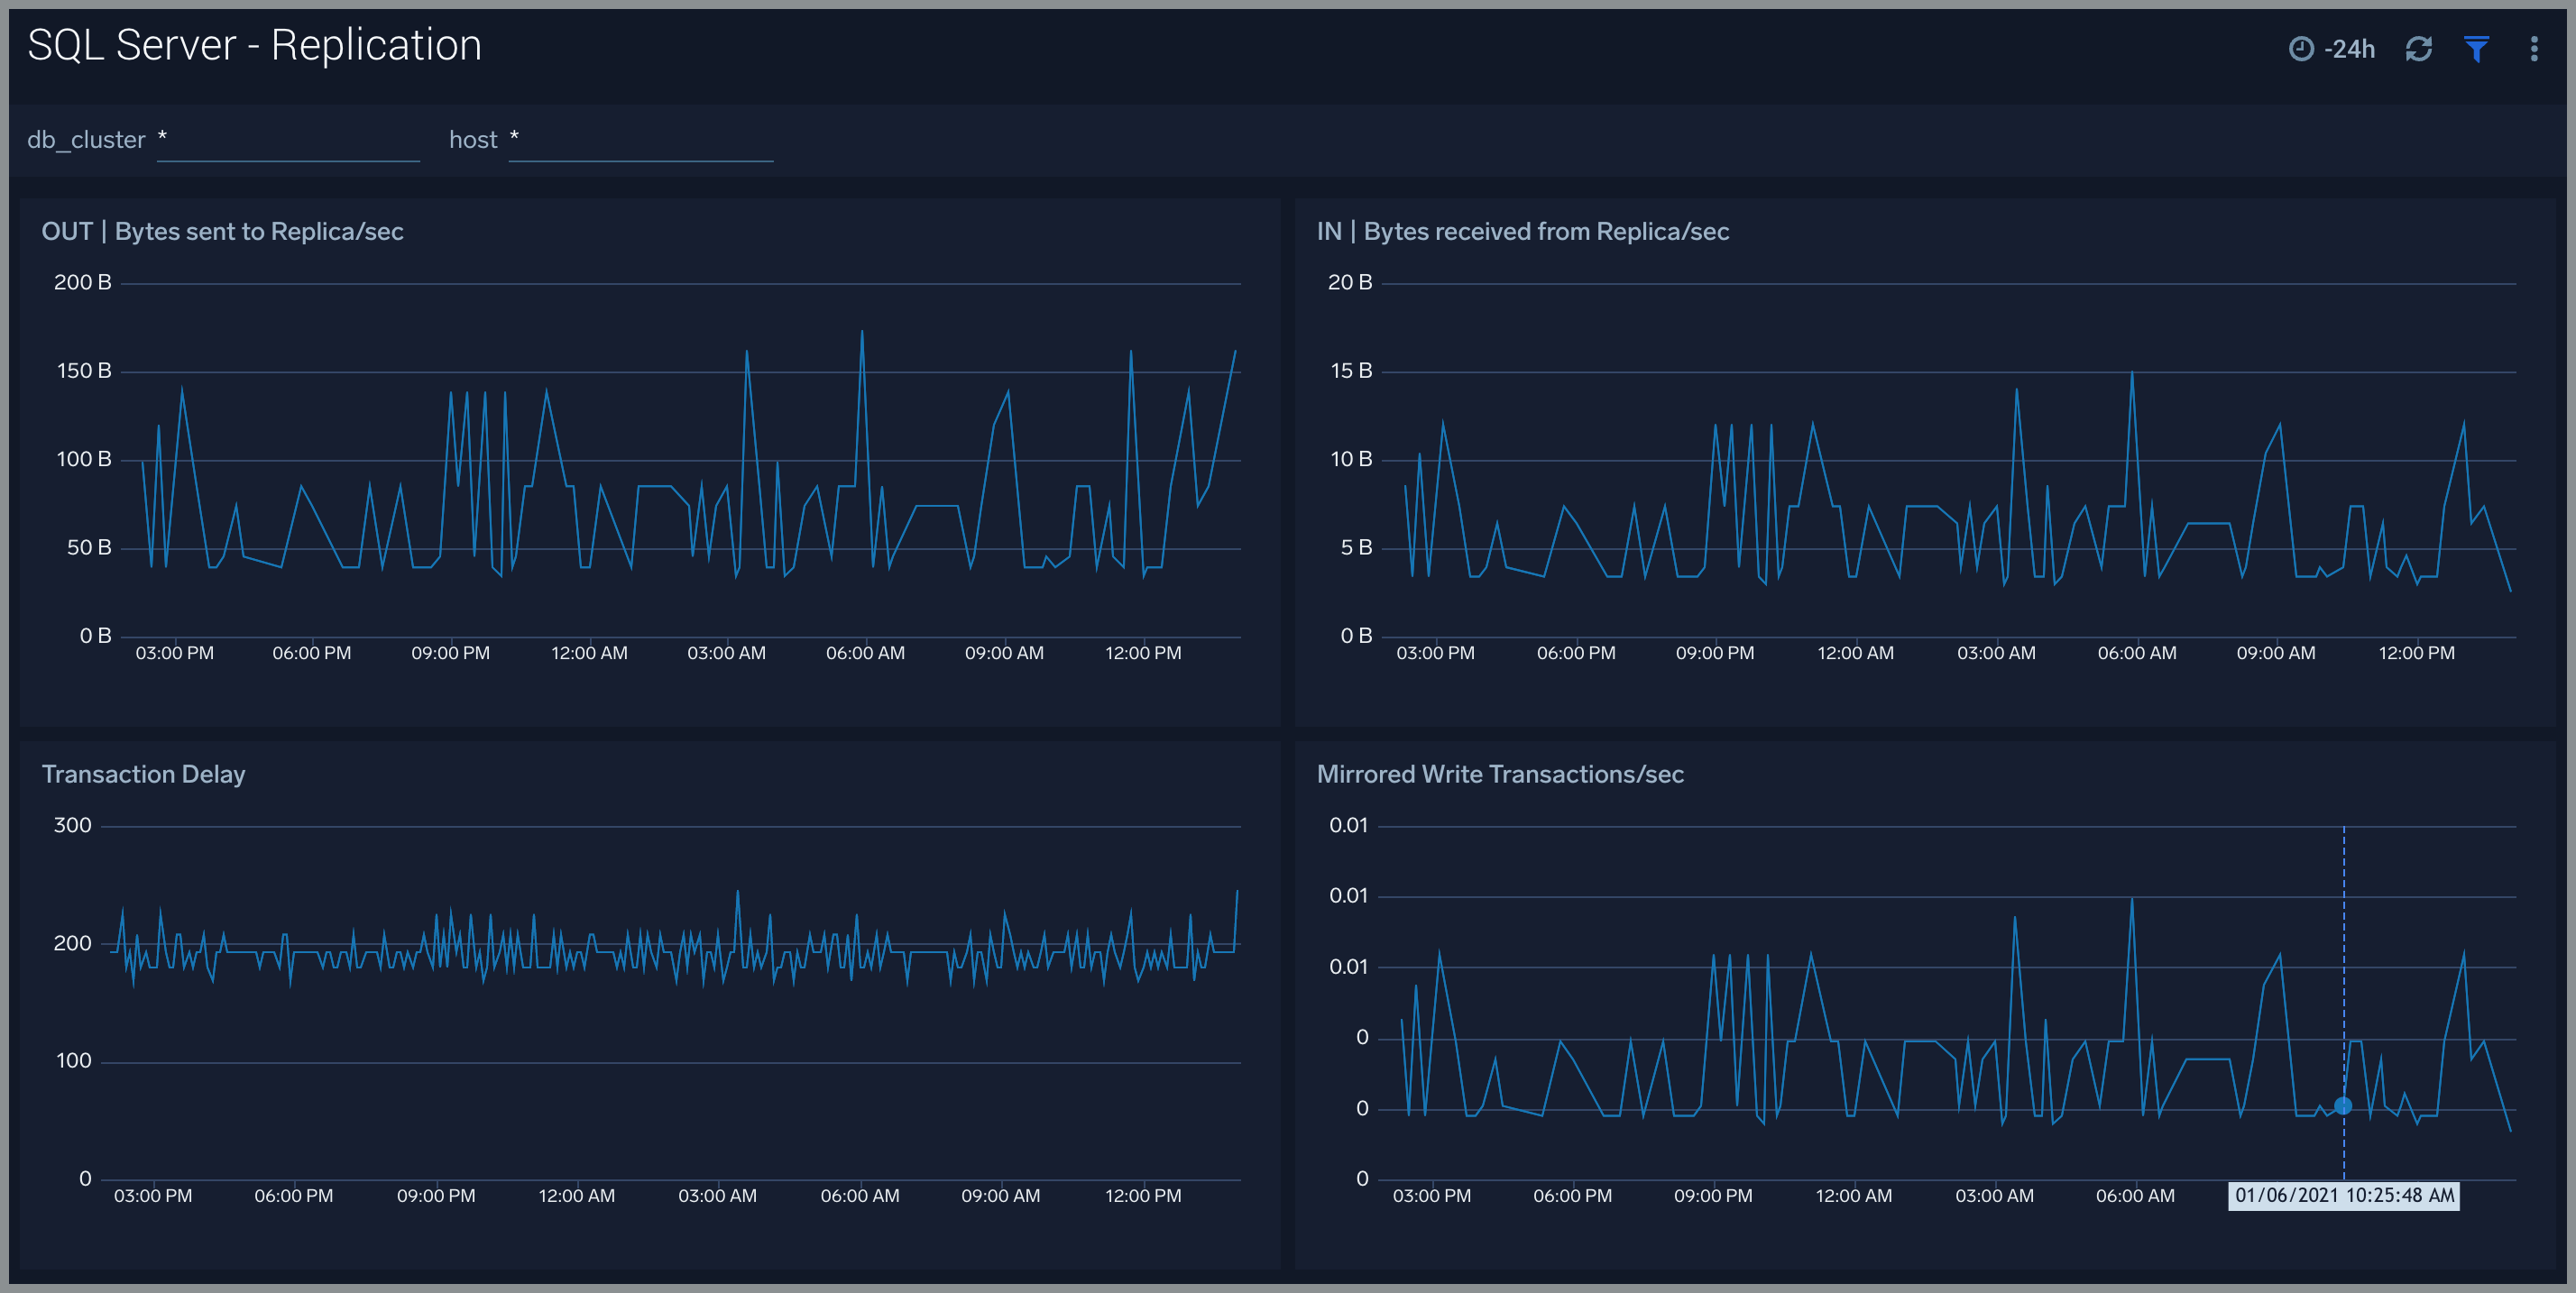
Replication
The SQL Server - Replication dashboard provides insights into SQL Server replication performance. Use this dashboard to monitor bytes sent and received from replica instance, transaction delays, and mirrored white transaction/sec.
Use this dashboard to:
- Get insights into bytes sent to and received from replica instance.
- Analyze transaction delays, and mirrored white transaction/sec.
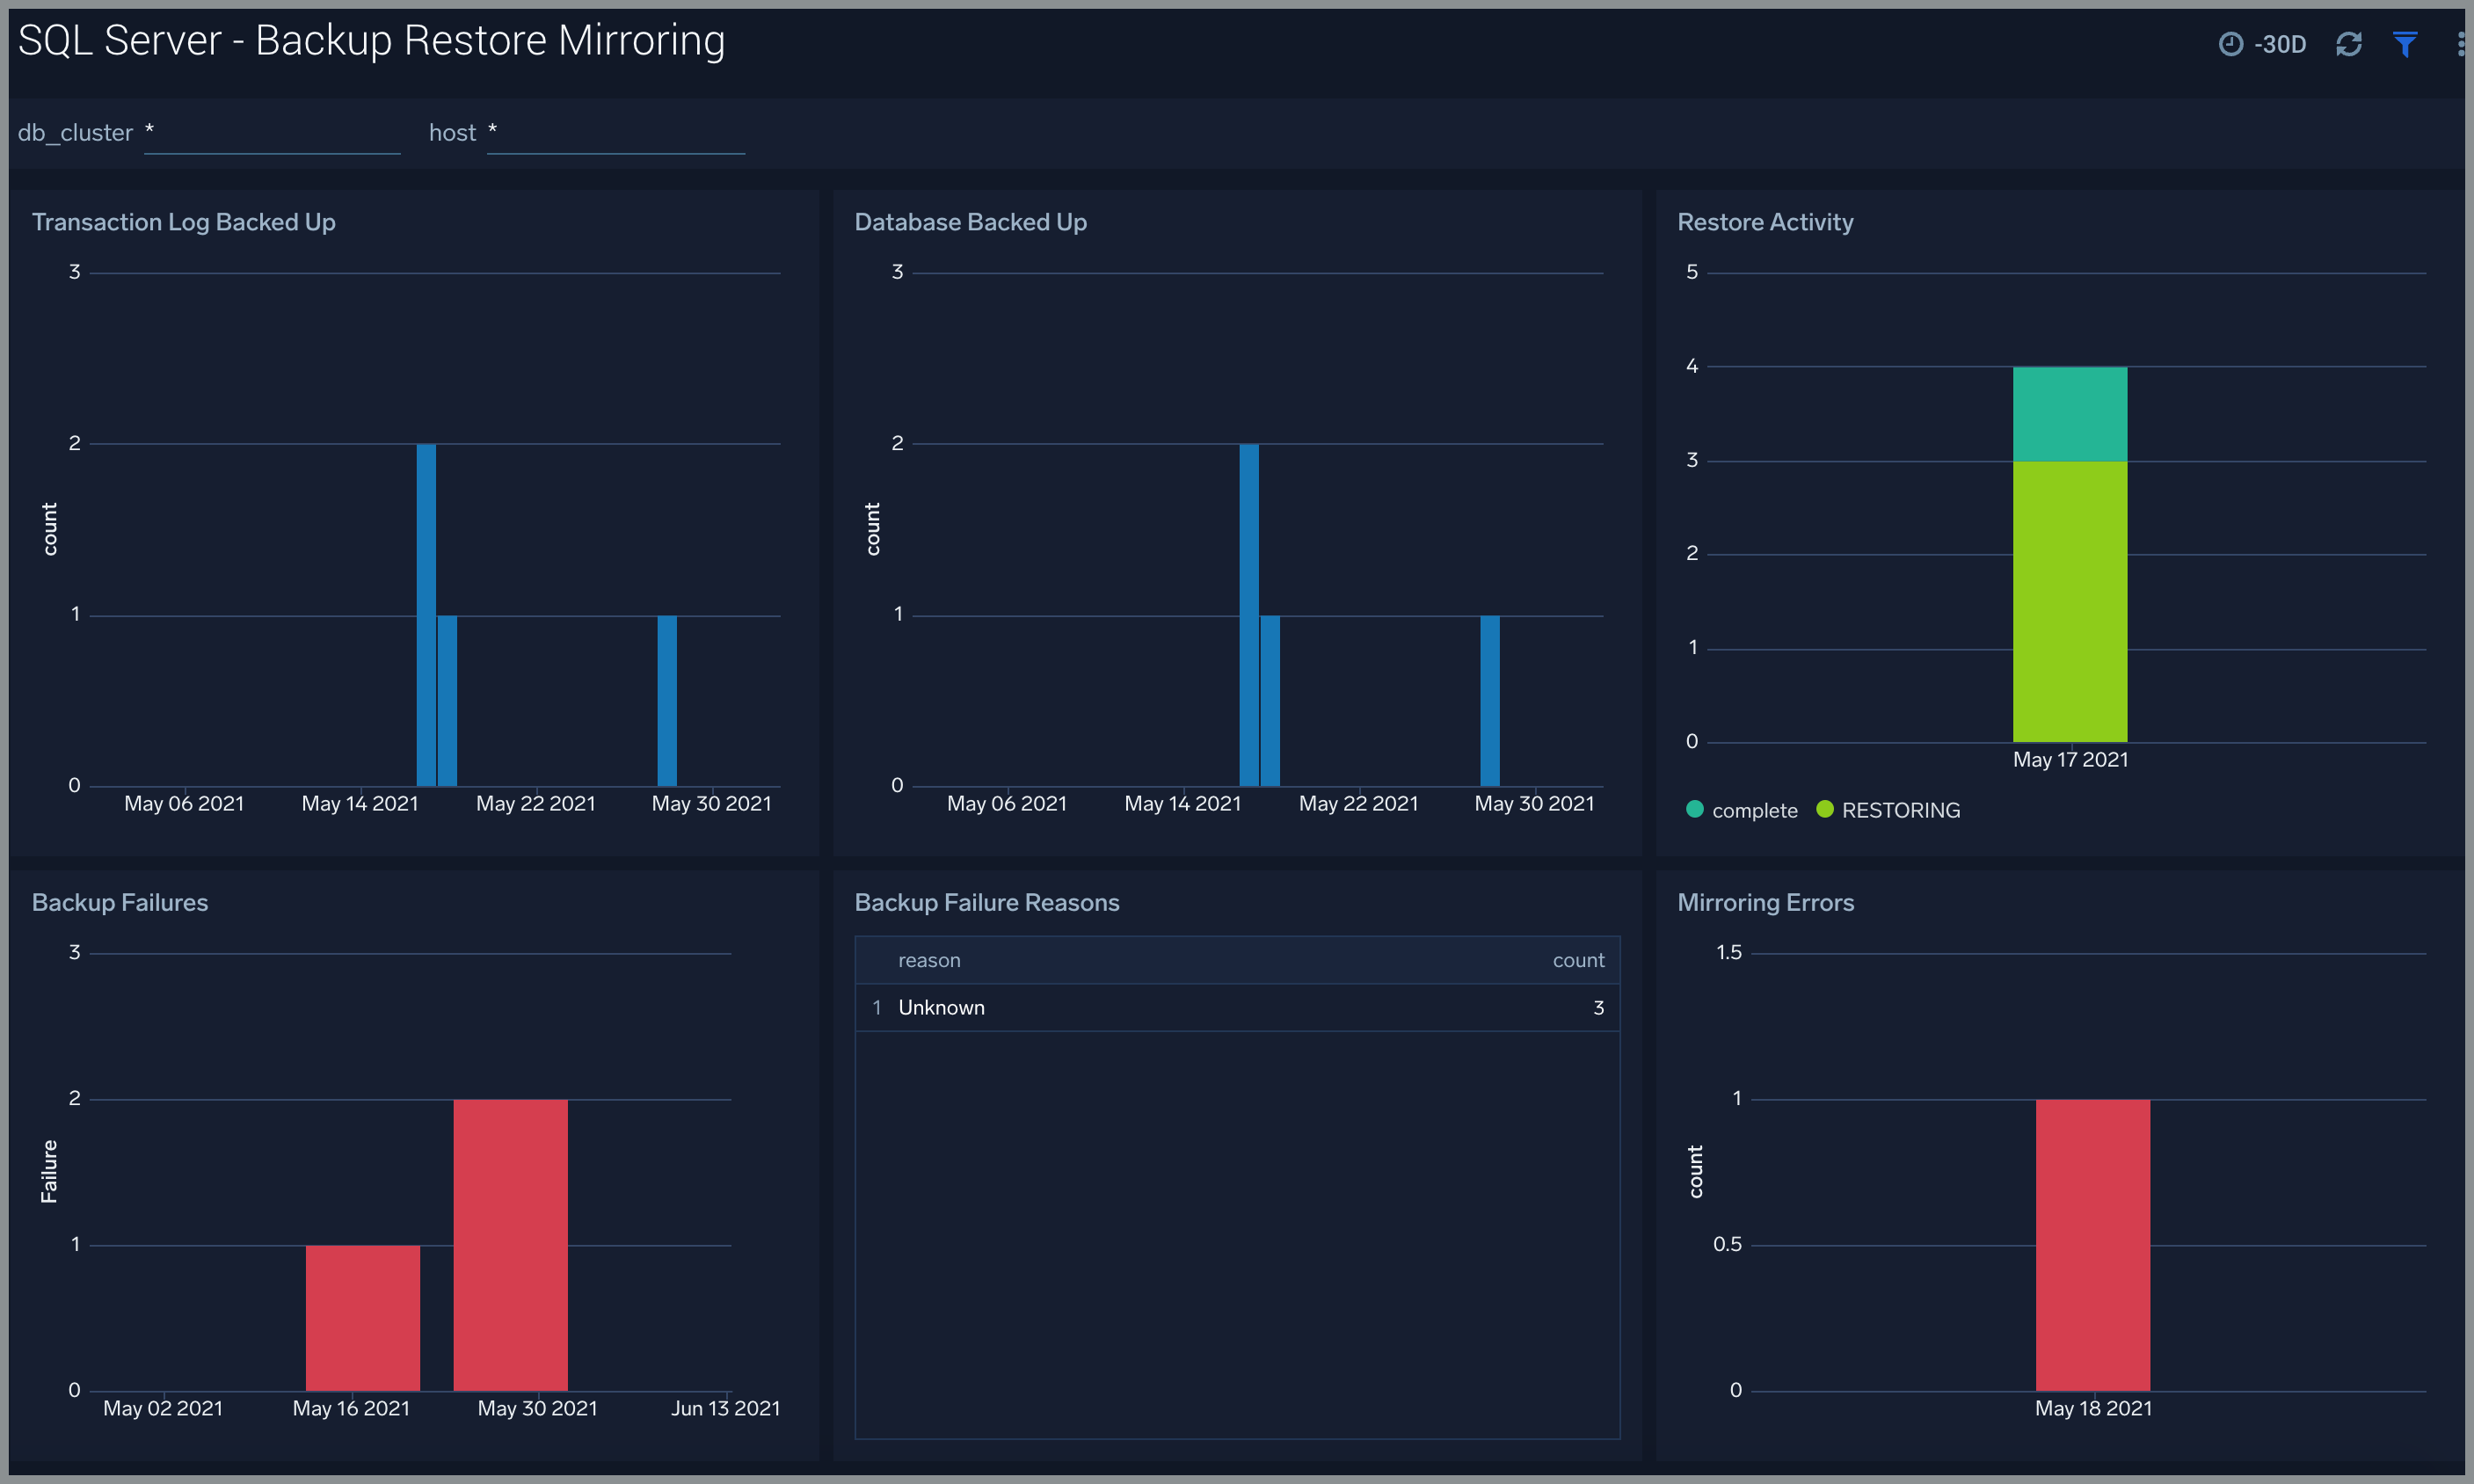
Backup Restore Mirroring
The SQL Server - Backup Restore Mirroring provides information about:
- Transaction log backup events
- Database backup events
- Restore activities
- Backup failures and reasons
- Mirroring errors
Create monitors for Microsoft SQL Server app
From your App Catalog:
- From the Sumo Logic navigation, select App Catalog.
- In the Search Apps field, search for and then select your app.
- Make sure the app is installed.
- Navigate to What's Included tab and scroll down to the Monitors section.
- Click Create next to the pre-configured monitors. In the create monitors window, adjust the trigger conditions and notifications settings based on your requirements.
- Scroll down to Monitor Details.
- Under Location click on New Folder.
note
By default, monitor will be saved in the root folder. So to make the maintenance easier, create a new folder in the location of your choice.
- Enter Folder Name. Folder Description is optional.
tip
Using app version in the folder name will be helpful to determine the versioning for future updates.
- Click Create. Once the folder is created, click on Save.
Microsoft SQL Server alerts
| Alert Name | Alert Description | Trigger Type (Critical / Warning) | Alert Condition | Recover Condition |
| SQL Server - Instance Down | This alert fires when we detect that the SQL Server instance is down for 5 minutes. | Critical | >0 | <=0 |
| Warning | ||||
| SQL Server - AppDomain | This alert fires when we detect AppDomain related issues in your SQL Server instance. | Critical | ||
| Warning | >=1 | <1 | ||
| SQL Server - Backup Fail | This alert fires when we detect that the SQL Server backup failed. | Critical | ||
| Warning | >=1 | <1 | ||
| SQL Server - Cpu High Usage | This alert fires when the CPU usage within a 5 minute interval for an SQL Server instance is high (70% - 80% for Warning and >=80% for Critical). | Critical | >=80 | <80 |
| Warning | >=70 | <70 | ||
| SQL Server - Deadlock | This alert fires when we detect deadlocks in a SQL Server instance. | Critical | ||
| Warning | >5 | <=5 | ||
| SQL Server - Disk Usage | This alert fires when the Disk usage within a 5 minute interval for an SQL Server instance is high (70% - 80% for Warning and >=80% for Critical). | Critical | >=80 | <80 |
| Warning | >=70 | <70 | ||
| SQL Server - Insufficient Space | This alert fires when SQL Server instance could not allocate a new page for database because of insufficient disk space in filegroup. | Critical | ||
| Warning | >0 | <=0 | ||
| SQL Server - Login Fail | This alert fires when we detect that the user cannot login to SQL Server. | Critical | ||
| Warning | >=1 | <1 | ||
| SQL Server - Mirroring Error | This alert fires when we detect that the SQL Server mirroring has error. | Critical | >=1 | <1 |
| Warning | ||||
| SQL Server - Processes Blocked | This alert fires when we detect that SQL Server has blocked processes. | Critical | ||
| Warning | >0 | <=0 |