Azure SQL
Azure SQL Database is a managed relational cloud database service. The Sumo Logic app for Azure SQL helps you monitor activity in Azure SQL. The preconfigured dashboards provide insight into resource utilization, blocking queries, database wait events, errors, runtime execution stats, and other database analytics.
Log and metric types
The Sumo Logic app for Azure SQL app uses the following log types:
- Basic Metric
- Query Store Runtime Statistics Event
- Query Store Wait Statistics Event
- Database Wait Statistics Event
- Block Event
- Error Event
- Insight
- TimeoutEvent
- Automated Tuning
- SQL Security Audit
- Activity Logs
Azure SQL Metrics are available in Microsoft.Sql/servers/databases, Microsoft.Sql/servers/elasticpools, Microsoft.Sql/managedInstances namespaces. For more details on Azure SQL logs and metrics, refer to the Azure documentation.
Sample log messages
{
  "LogicalServerName":"npande-test-db-server",
  "SubscriptionId":"c088dc46-d123-12ad-a8b7-9a123d45ad6a",
  "ResourceGroup":"npandeTestDBResGrp",
  "time":"2018-07-09T05:08:32.679Z",
  "resourceId":"/SUBSCRIPTIONS/c088dc46-d123-12ad-a8b7-9a123d45ad6a/RESOURCEGROUPS/NPANDETESTDBRESGRP/PROVIDERS/MICROSOFT.SQL/SERVERS/NPANDE-TEST-DB-SERVER/DATABASES/NPANDETESTDB2",
  "category":"Errors",
  "operationName":"ErrorEvent",
  "properties":{
    "ElasticPoolName":"",
    "DatabaseName":"npandeTestDB2",
    "query_hash":"0",
    "query_plan_hash":"0",
    "message":"Invalid object name 'inventory123'.",
    "error_number":208,
    "severity":16,
    "user_defined":false,
    "state":1
  }
}
{
	"LogicalServerName":"npande-test-db-server",
	"SubscriptionId":"c088dc46-d123-12ad-a8b7-9a123d45ad6a"",""ResourceGroup"":""npandeTestDBResGrp"",""time"":""2018-07-09T05":"13":34.520Z",""resourceId"":"/SUBSCRIPTIONS/c088dc46-d123-12ad-a8b7-9a123d45ad6a"/RESOURCEGROUPS/NPANDETESTDBRESGRP/PROVIDERS/MICROSOFT.SQL/SERVERS/NPANDE-TEST-DB-SERVER/DATABASES/NPANDETESTDB",
	"category":"DatabaseWaitStatistics",
	"operationName":"DatabaseWaitStatistcsEvent",
	"properties":{
		"ElasticPoolName":"",
		"DatabaseName":"npandeTestDB",
		"start_utc_date":"2018-07-09T05:13:34.520Z",
		"end_utc_date":"2018-07-09T05:18:36.050Z",
		"wait_type":"WRITELOG",
		"delta_max_wait_time_ms":0,
		"delta_signal_wait_time_ms":0,
		"delta_wait_time_ms":12,
		"delta_waiting_tasks_count":2
	}
}
Sample queries
_sourceCategory=Azure/DB/SQL/Logs ErrorEvent
| json "LogicalServerName", "SubscriptionId", "ResourceGroup", "resourceId", "category", "operationName", "properties" nodrop
| json field=properties "severity", "error_number", "DatabaseName", "message", "user_defined", "state"
| where operationName="ErrorEvent"
| count as eventCount by message
| top 10 message by eventCount, message asc
Setup
Azure service sends monitoring data to Azure Monitor, which can then stream data to Eventhub. Sumo Logic supports:
- Logs collection from Azure Monitor using our Azure Event Hubs source.
- Activity Logs collection from Azure Monitor using our Azure Event Hubs source. It is recommended to create a separate source for activity logs. If you are already collecting these logs, you can skip this step.
- Metrics collection using our Azure Metrics Source.
You must explicitly enable diagnostic settings for each Azure SQL database that you want to monitor. You can forward logs to the same event hub provided they satisfy the limitations and permissions as described here.
When you configure the event hubs source or HTTP source, plan your source category to ease the querying process. A hierarchical approach allows you to make use of wildcards. For example: Azure/SQL/Logs, Azure/SQL/ActivityLogs, and Azure/SQL/Metrics.
Configure metrics collection
To set up the Azure Metrics source in Sumo Logic, refer to Azure Metrics Source.
The Sumo Logic Metrics source is currently in beta. To participate, contact your Sumo Logic account executive.
Configure logs collection
Diagnostic logs
In this section, you will configure a pipeline for shipping diagnostic logs from Azure Monitor to an Event Hub.
-
To set up the Azure Event Hubs source in Sumo Logic, refer to the Azure Event Hubs Source for Logs.
-
To create the Diagnostic settings in Azure portal, refer to the Azure documentation. Perform below steps for each Azure SQL database that you want to monitor.
- Choose
Stream to an event hubas the destination. - Select all the log types except
SQL Security Audit Event. - Use the Event hub namespace and Event hub name configured in previous step in destination details section. You can use the default policy
RootManageSharedAccessKeyas the policy name.
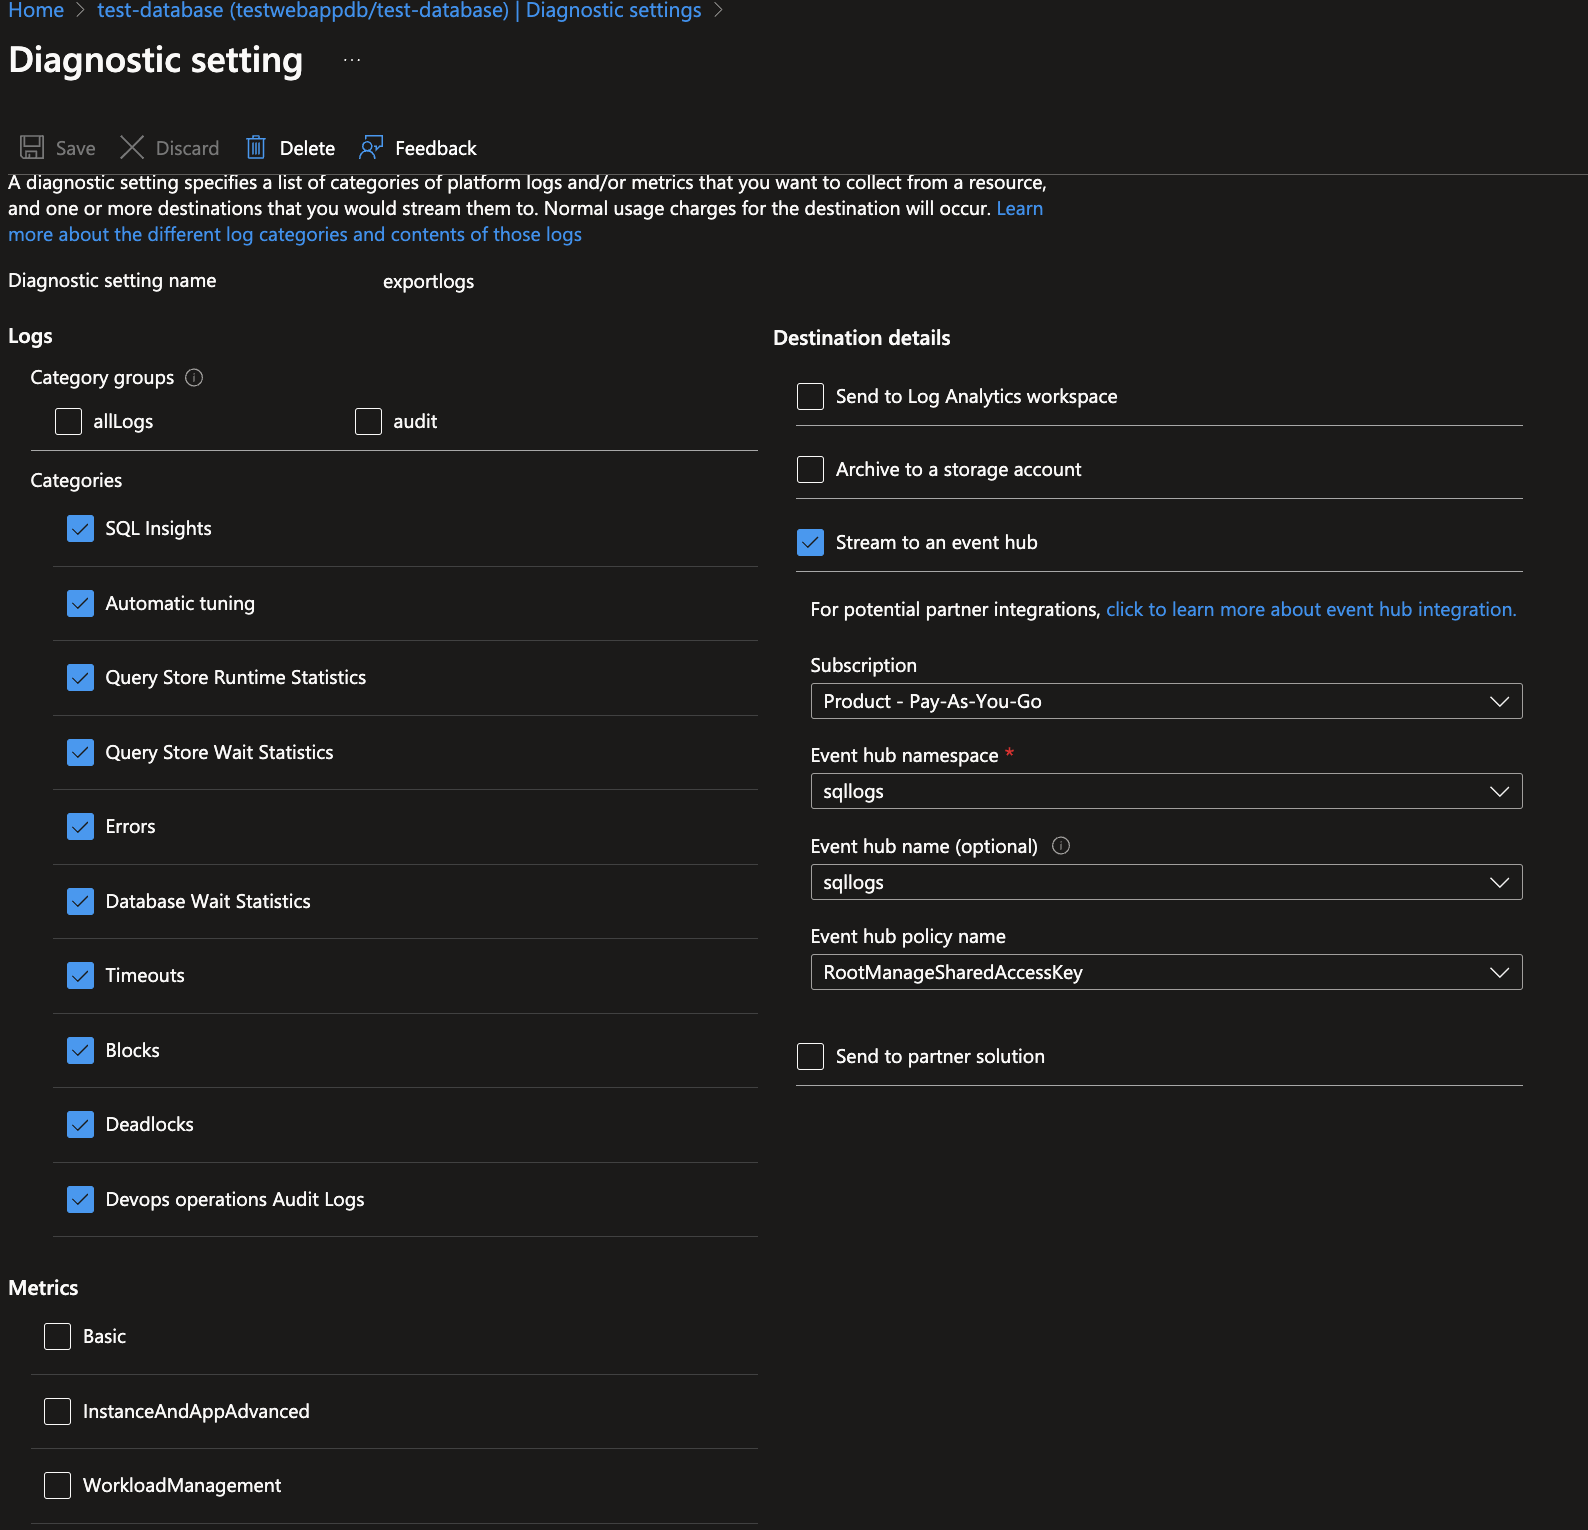
- Choose
-
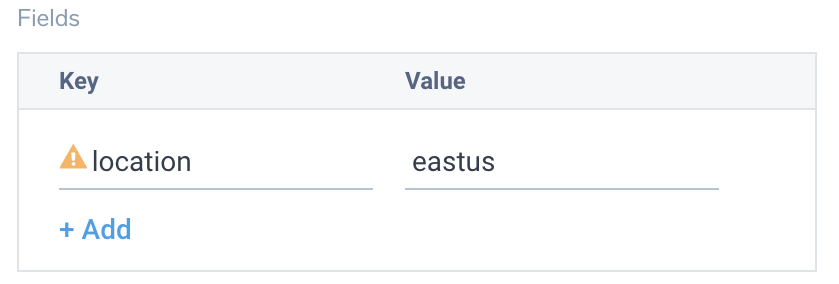
Tag the location field in the source with right location value.
Auto Tuning logs will be collected when Auto Tuning feature is enabled in Azure SQL. Click here to learn more on how to enable this feature.
Enable SQL Security Audit logs
In this section, you will configure a pipeline for shipping diagnostic logs from Azure Monitor to an Event Hub.
- To enable the Audit logs in Azure portal, refer to the Azure documentation. Perform below steps for each Azure SQL database that you want to monitor.
- Choose
Event Hubas the destination. Refer to the Azure documentation. - Use the same Event hub namespace and Event hub name as configured in
Diagnostic logsin destination details section. You can use the default policyRootManageSharedAccessKeyas the policy name.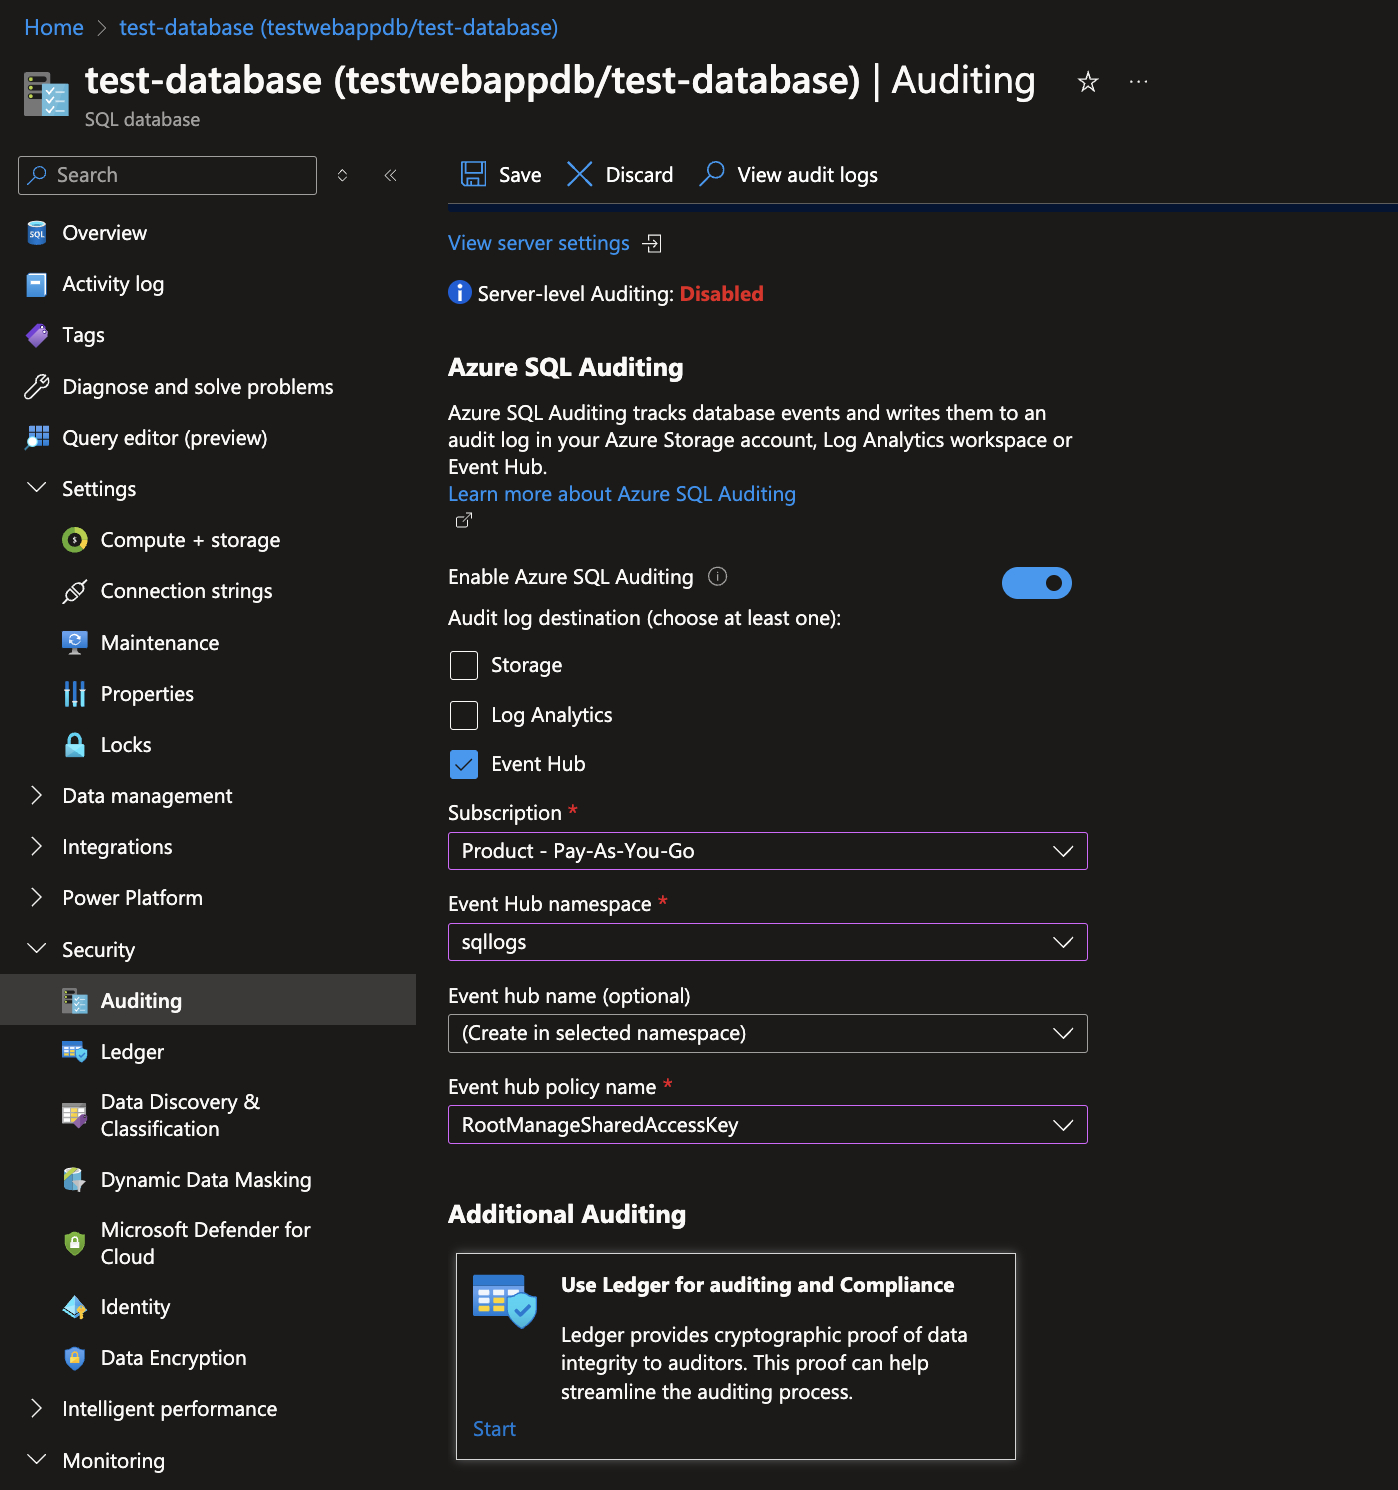
- Choose
- By default, auditing is enabled only for the below action groups. Refer to Azure help for more details on supported action groups and actions.
- "SUCCESSFUL_DATABASE_AUTHENTICATION_GROUP"
- "FAILED_DATABASE_AUTHENTICATION_GROUP"
- "BATCH_COMPLETED_GROUP"
Follow the below command to update the audit policy with new actions using Azure CLI. If you want to use any other mechanism, refer to the Microsoft documentation. ).
az sql db audit-policy update --ids "/subscriptions/<subscription_id>/resourceGroups/<resource_group>/providers/Microsoft.Sql/servers/<server name>/databases/<database name>" --actions DATABASE_PERMISSION_CHANGE_GROUP DATABASE_OWNERSHIP_CHANGE_GROUP DATABASE_ROLE_MEMBER_CHANGE_GROUP USER_CHANGE_PASSWORD_GROUP SCHEMA_OBJECT_PERMISSION_CHANGE_GROUP SCHEMA_OBJECT_OWNERSHIP_CHANGE_GROUP SCHEMA_OBJECT_CHANGE_GROUP DATABASE_CHANGE_GROUP DATABASE_OBJECT_CHANGE_GROUP 'SELECT, INSERT, UPDATE, DELETE on database::<database name> by public' --ehari /subscriptions/<subscription_id>/resourcegroups/<resource group where event hub is present>/providers/microsoft.eventhub/namespaces/<event hub namespace>/authorizationrules/rootmanagesharedaccesskey --ehts Enabled --state Enabled
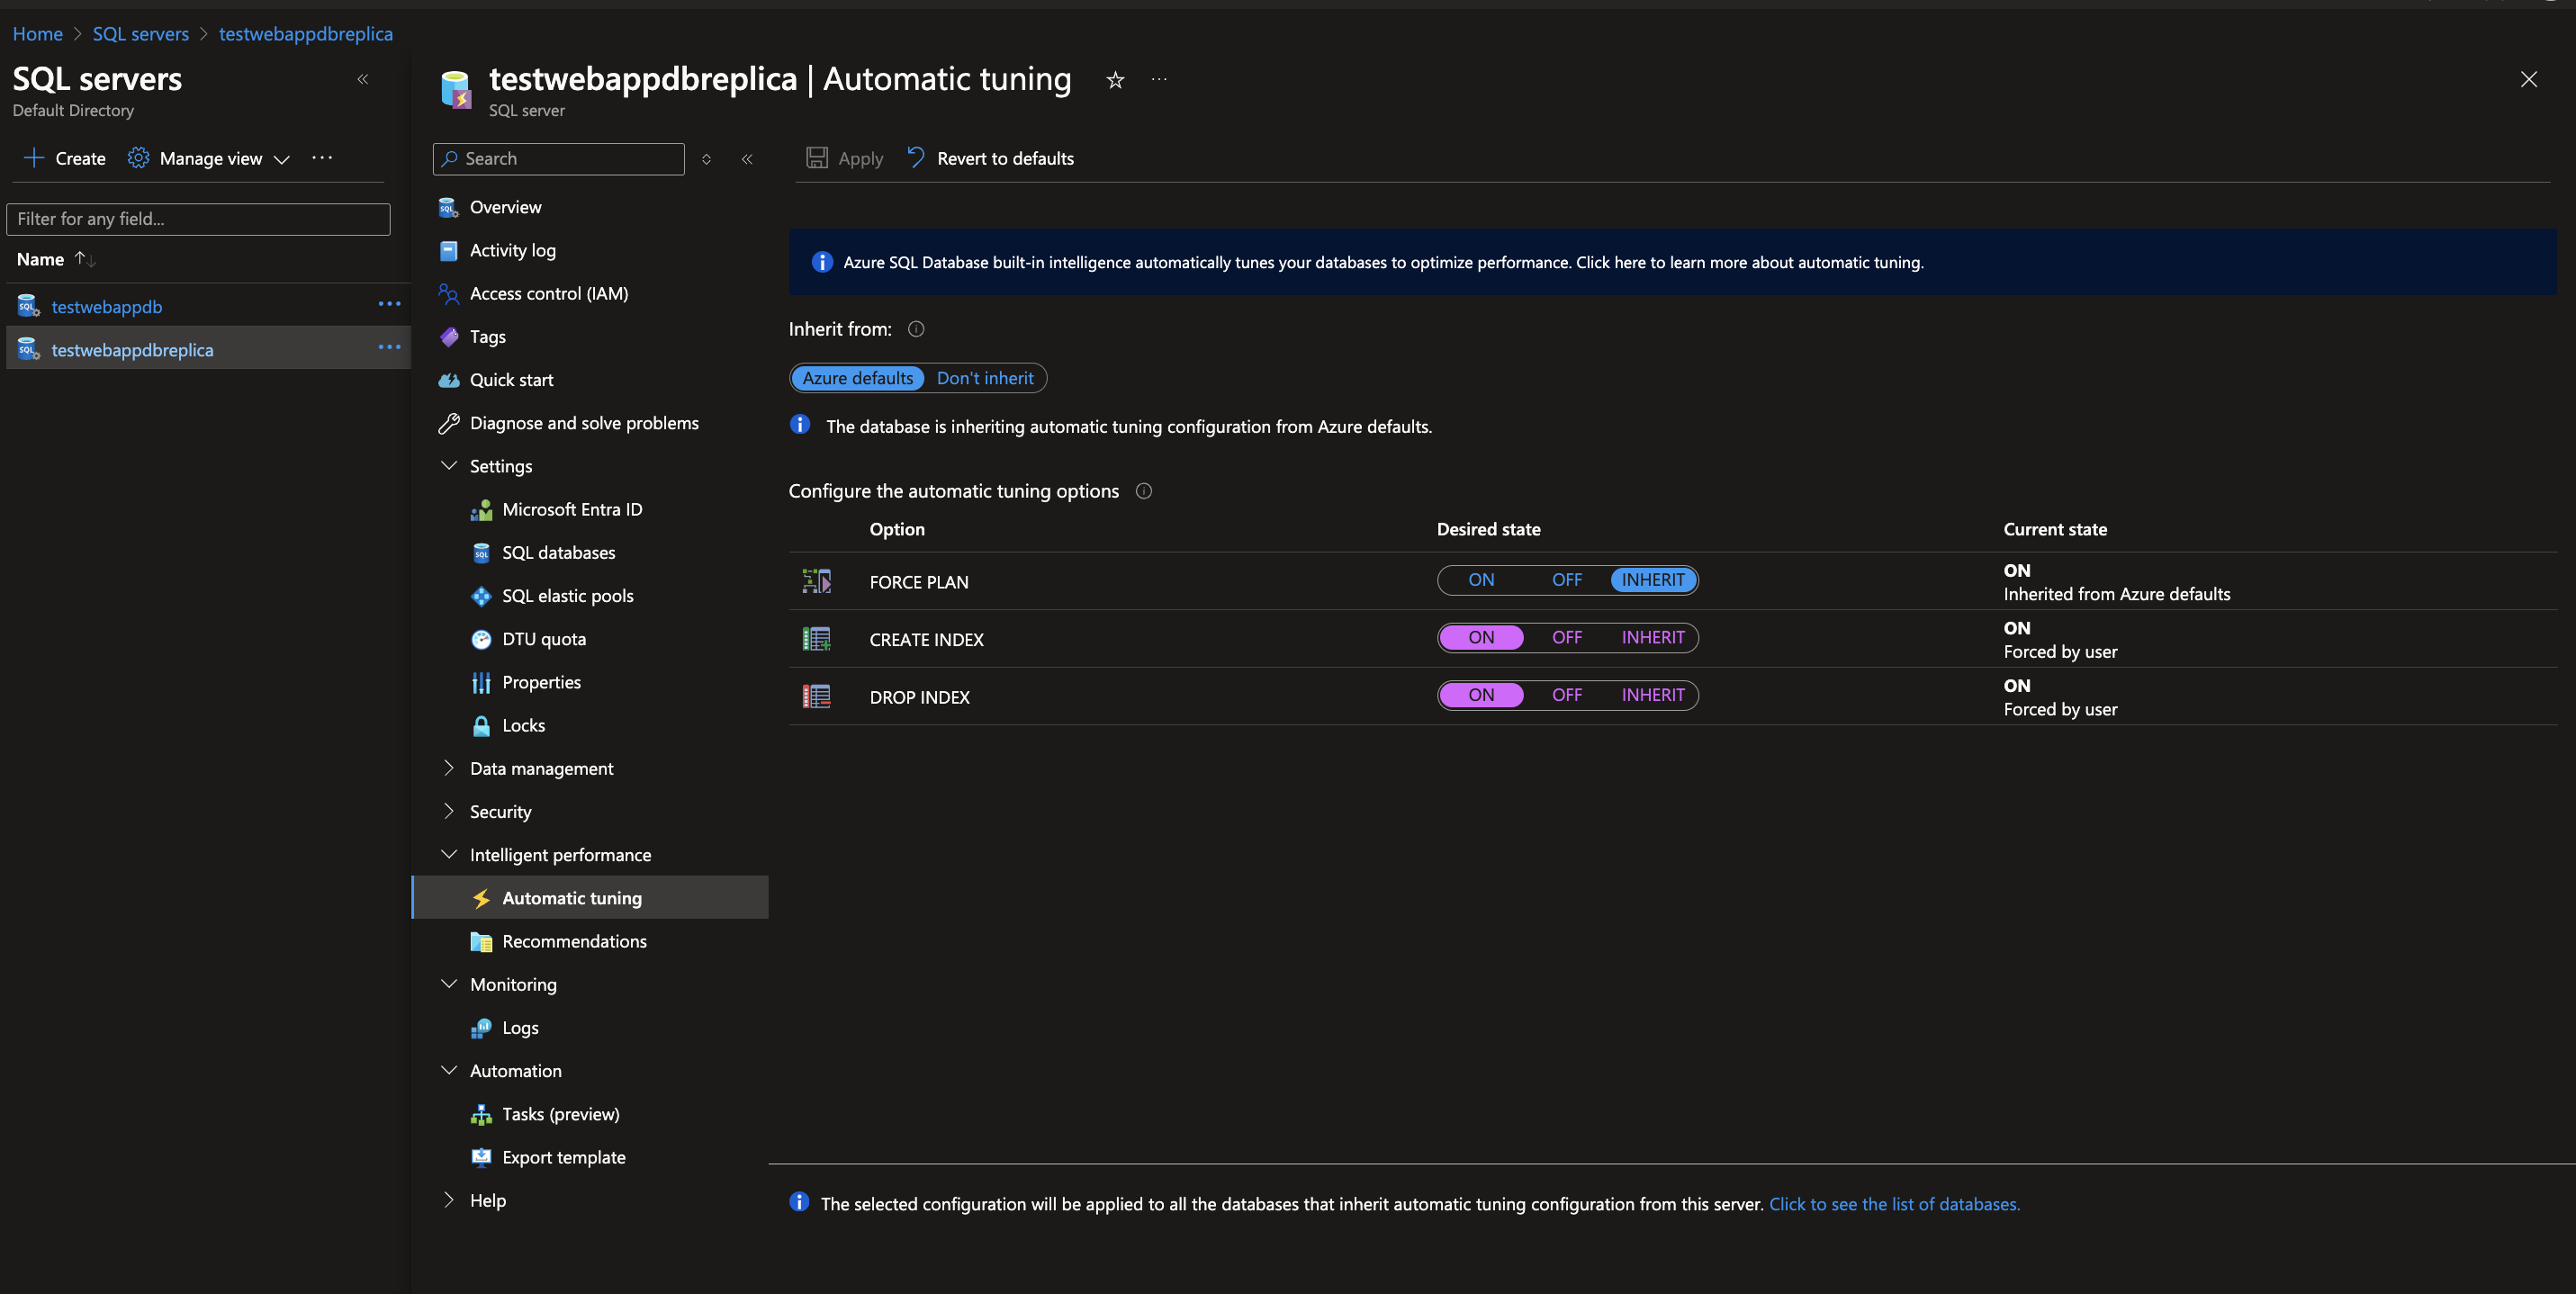
Enable Automatic Tuning logs
By default, all the tuning options are not enabled, you can enable them at the server or database level by following the instructions in the Azure documentation.
Activity Logs
To collect activity logs, follow the instructions here. If you are already collecting activity logs for a subscription, do not perform this step.
Since this source contains logs from multiple regions, make sure that you do not tag this source with the location tag.
Enabling Microsoft Defender for Cloud
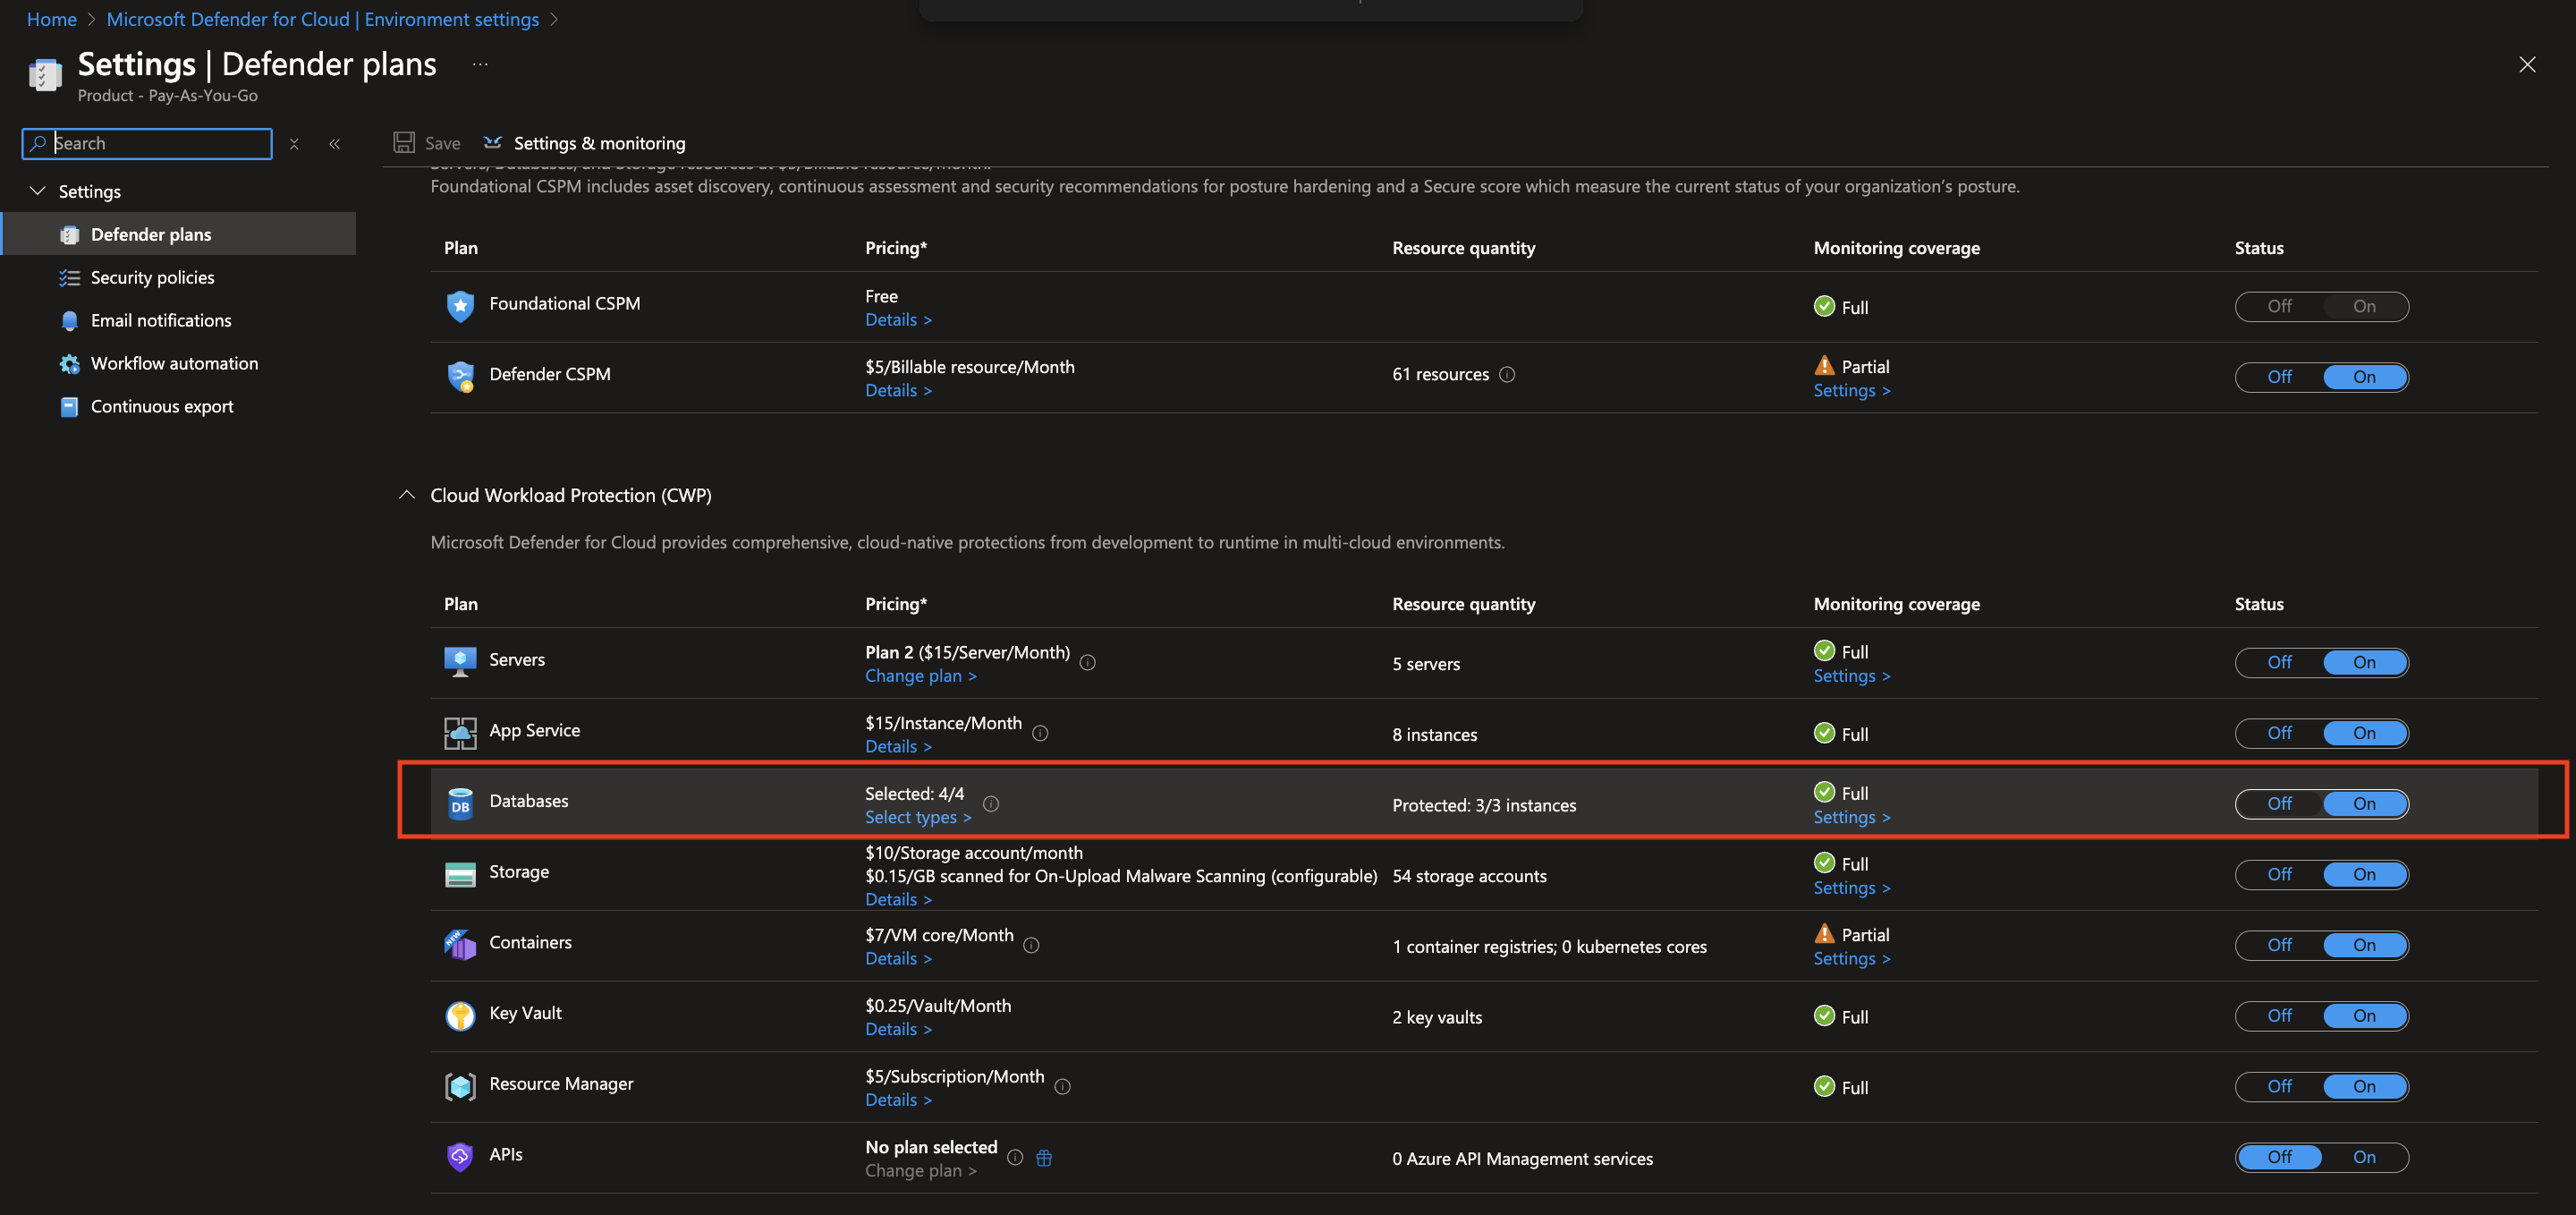
For Security events, make sure you enable Microsoft Defender for Cloud. If you have an existing settings, click Edit Settings.
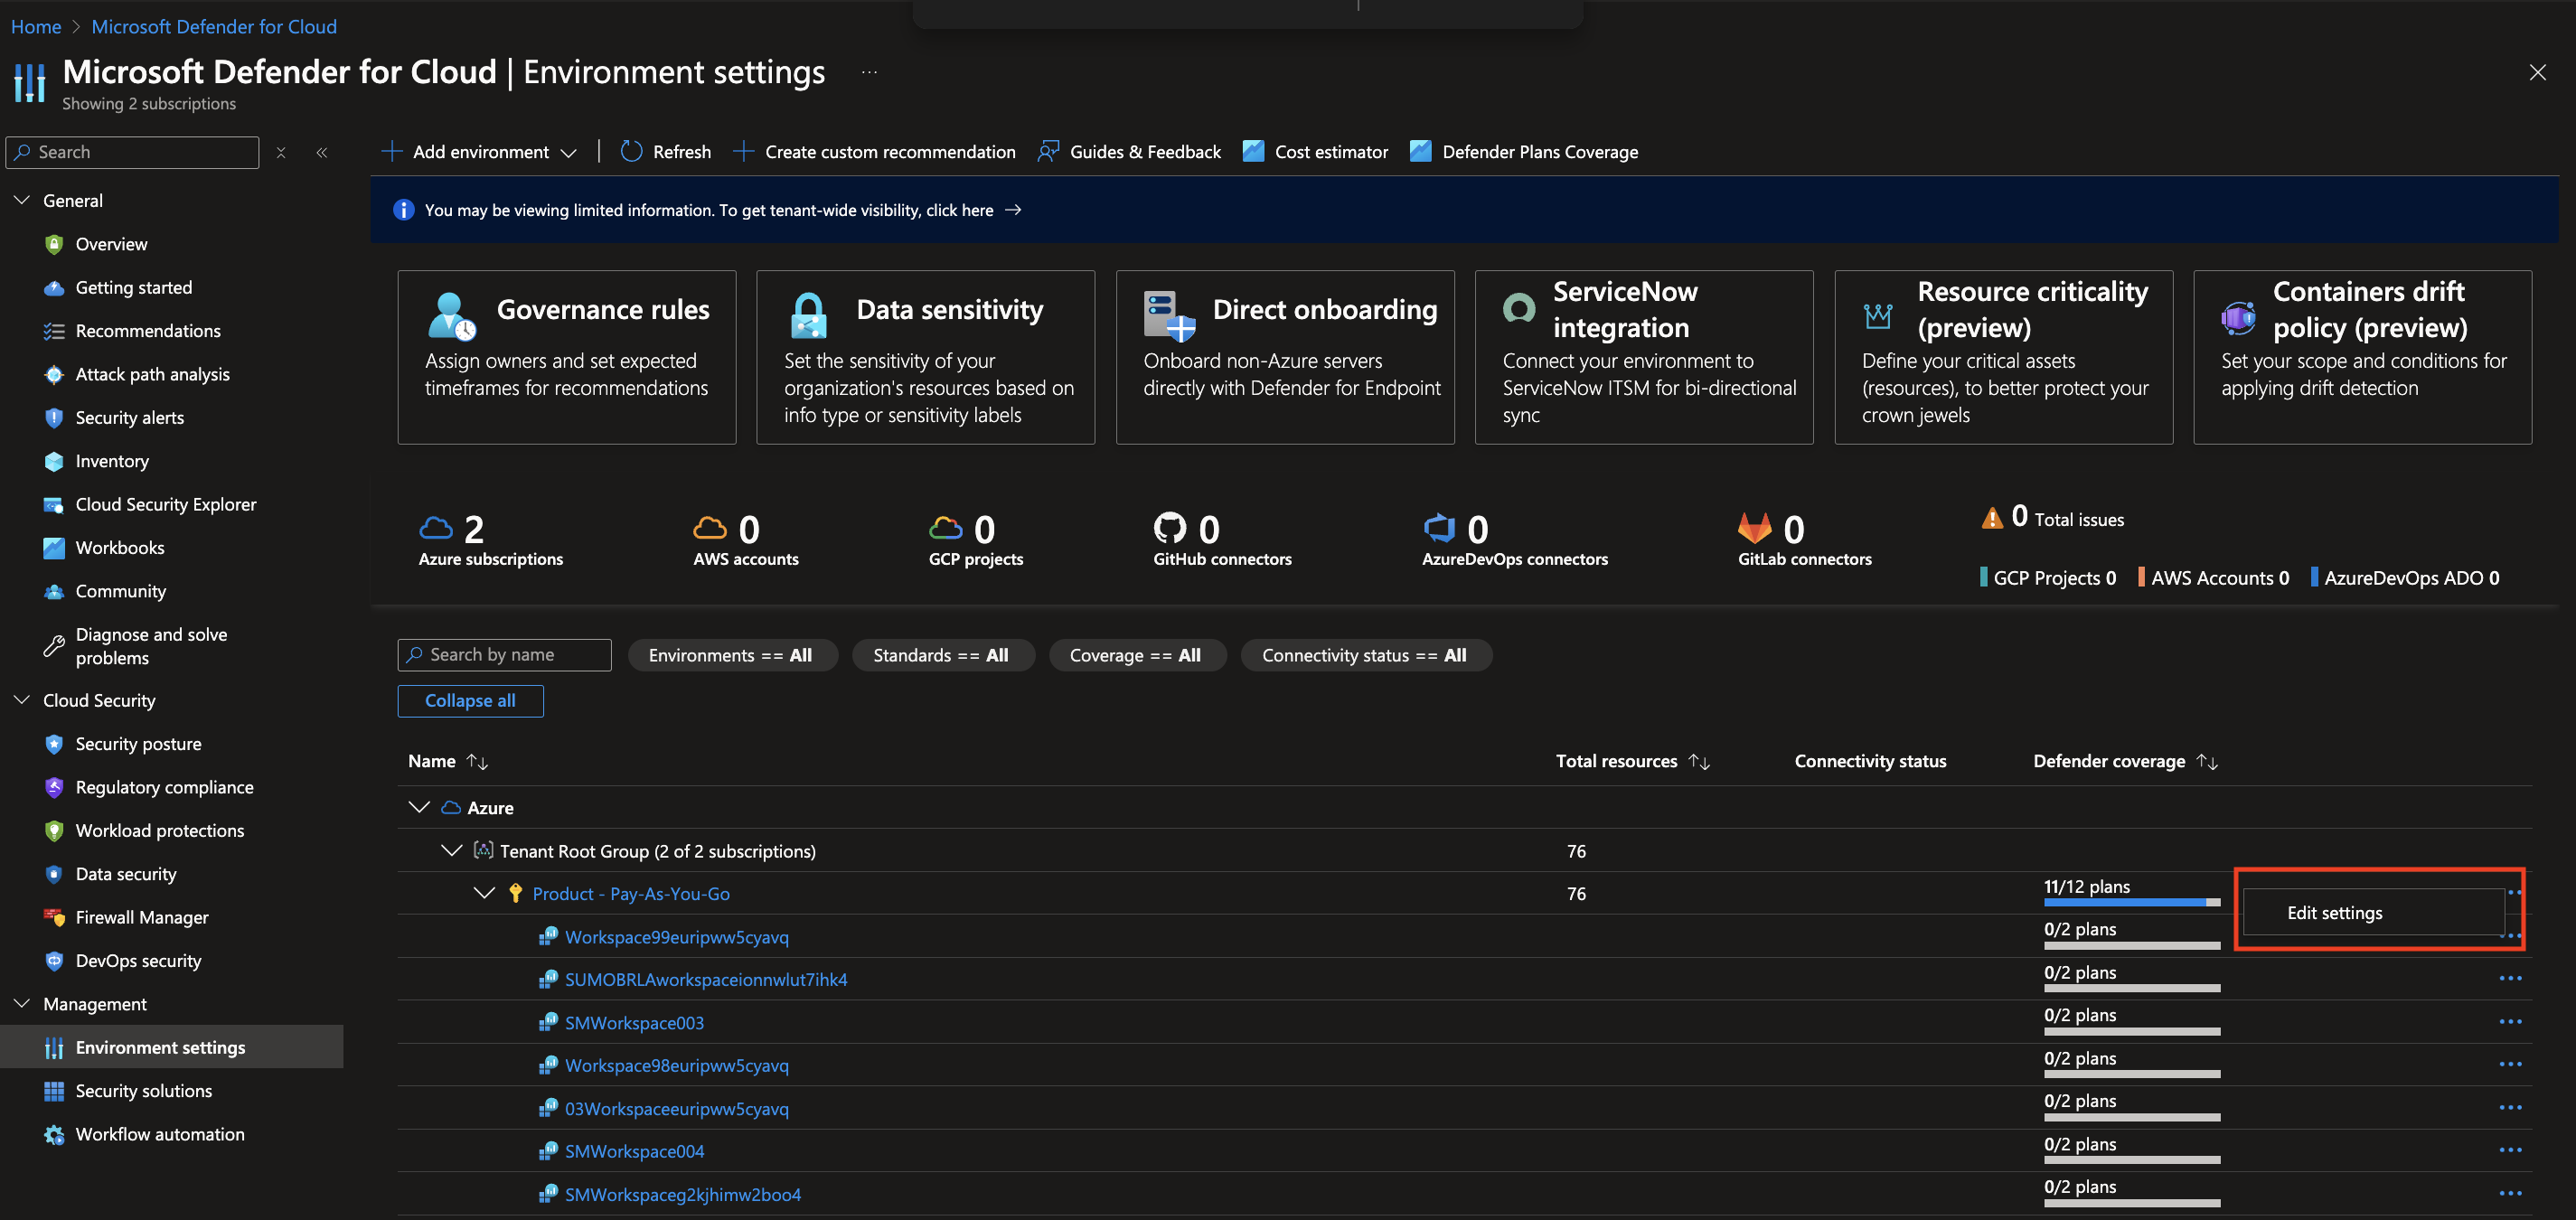
In Defender Plans settings page turn on the Databases status under Cloud Workload Protection section.
Installing the Azure SQL app
This section provides instructions on how to install the Azure SQL app, and shows examples of each of the preconfigured dashboards you can use to analyze your data.
To install the app, do the following:
Next-Gen App: To install or update the app, you must be an account administrator or a user with Manage Apps, Manage Monitors, Manage Fields, Manage Metric Rules, and Manage Collectors capabilities depending upon the different content types part of the app.
- Select App Catalog.
- In the 🔎 Search Apps field, run a search for your desired app, then select it.
- Click Install App.
note
Sometimes this button says Add Integration.
- Click Next in the Setup Data section.
- In the Configure App section of your respective app, complete the following field.
- Index. Specify value for _index if the collection is configured with custom partition. Learn more. Default value is set to
sumologic_default(default partition)
- Index. Specify value for _index if the collection is configured with custom partition. Learn more. Default value is set to
- Click Next. You will be redirected to the Preview & Done section.
Post-installation
Once your app is installed, it will appear in your Installed Apps folder, and dashboard panels will start to fill automatically.
Each panel slowly fills with data matching the time range query received since the panel was created. Results will not immediately be available but will be updated with full graphs and charts over time.
As part of the app installation process, the following fields will be created by default:
tenant_name. This field is tagged at the collector level. You can get the tenant name using the instructions here.location. The region the resource name belongs to.subscription_id. ID associated with a subscription where the resource is present.resource_group. The resource group name where the Azure resource is present.provider_name. Azure resource provider name (for example, Microsoft.Network).resource_type. Azure resource type (for example, storage accounts).resource_name. The name of the resource (for example, storage account name).service_type. Type of the service that can be accessed with an Azure resource.service_name. Services that can be accessed with an Azure resource (for example, in Azure Container Instances the service is Subscriptions).
Viewing the Azure SQL dashboards
All dashboards have a set of filters that you can apply to the entire dashboard. Use these filters to drill down and examine the data to a granular level.
- You can change the time range for a dashboard or panel by selecting a predefined interval from a drop-down list, choosing a recently used time range, or specifying custom dates and times. Learn more.
- You can use template variables to drill down and examine the data on a granular level. For more information, see Filtering Dashboards with Template Variables.
- Many of the Next-Gen apps allow you to provide the Index at the installation time and a default value for this key (sumologic_default). Based on your input, the app dashboards will be parameterized with a dashboard variable, allowing you to change the data partition queried by all panels. This restricts the query scope of all the dashboard queries to a specific data partition.
Overview
See the count of logical servers, databases, errors; and the “top 10” active servers, resource groups, subscriptions, resources, databases, operations, and categories.
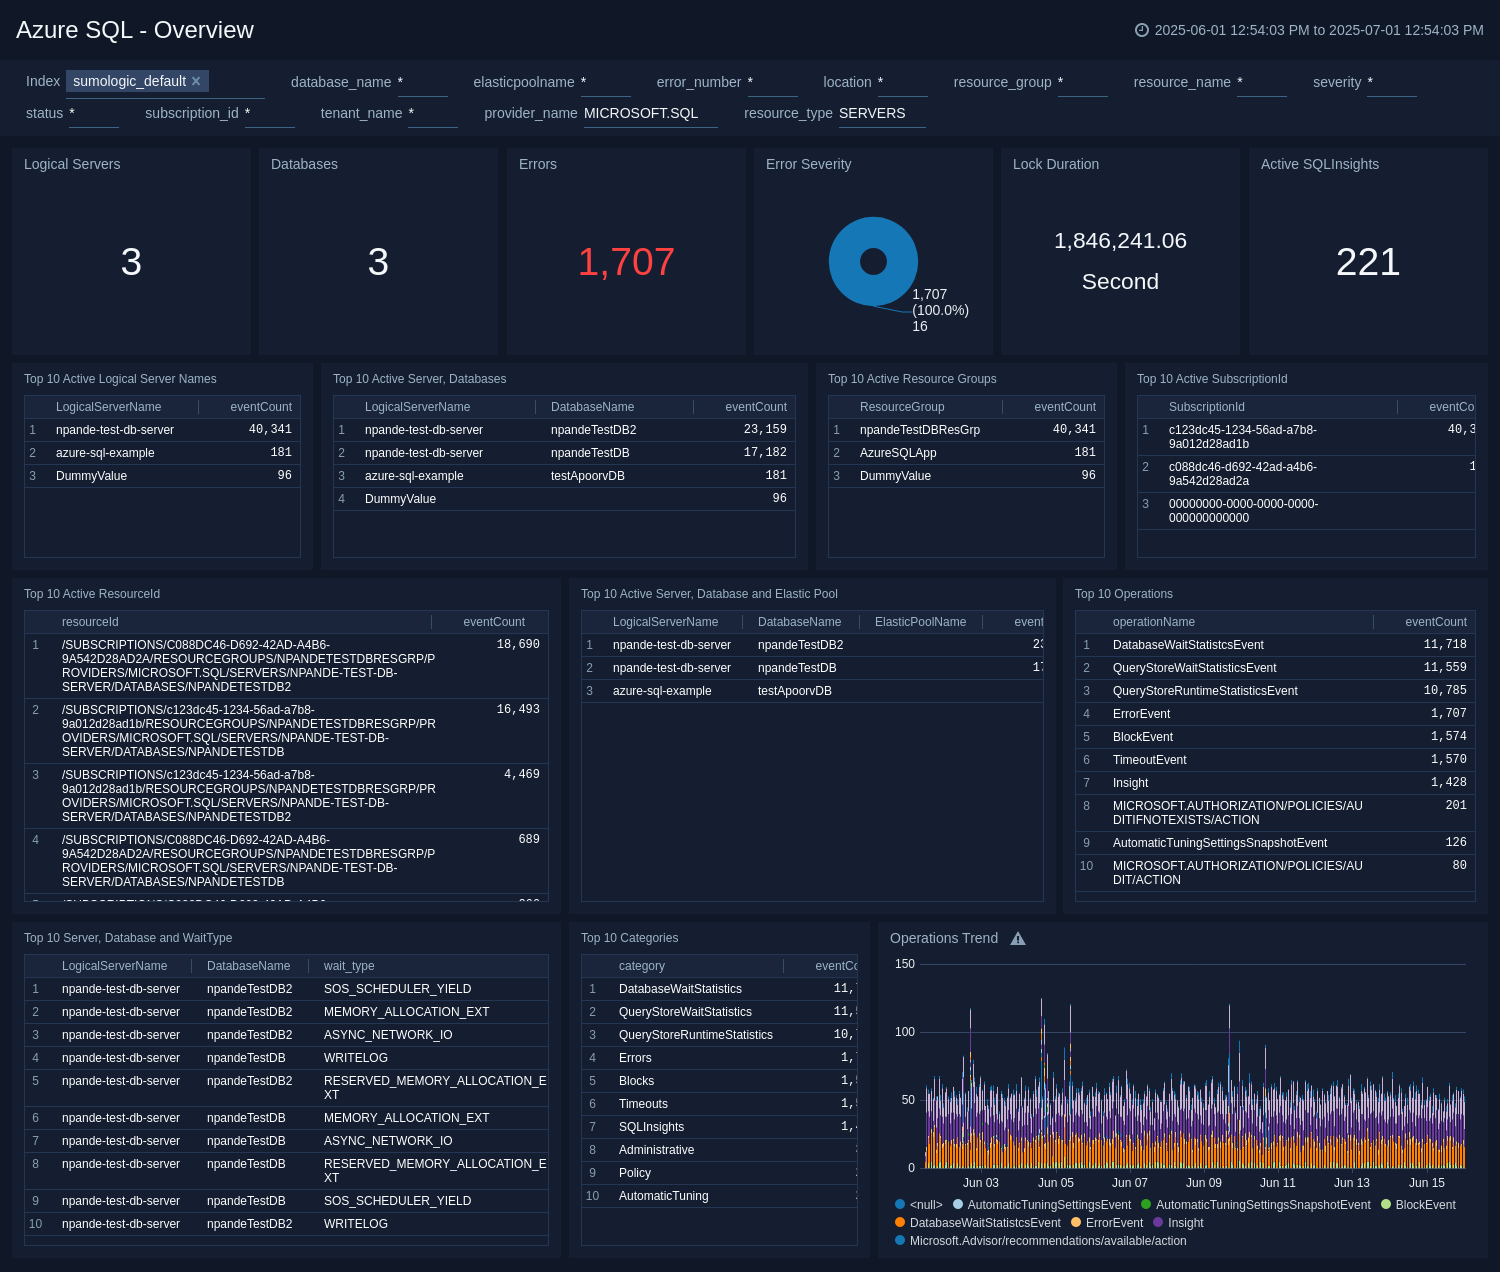
Logical Servers. The count of logical servers over the last 24 hours.
Databases. The count of databases over the last 24 hours.
Errors. The count of errors over the last 24 hours.
Error Severity. A donut chart that shows the breakdown of errors by severity over the last 24 hours.
Lock Duration. The total number of seconds that the database experienced locks in the last 24 hours.
Active SQLInsights. The count of performance issues detected by SQL Insights whose current status is “Active”.
Top 10 Active Logical Server Names. The names of the 10 logical servers that have experienced the most events over the last 24 hours, and the event count for each.
Top 10 Active Server, Databases. Lists the 10 logical server-database combinations that have experienced the most events over the last 24 hours, and the event count for each.
Top 10 Active Resource Groups. Lists the 10 active resource groups that have experienced the most events over the last 24 hours, and the event count for each.
Top 10 Active SubscriptionId. Lists the 10 active SubscriptionIds that have experienced the most events over the last 24 hours, and the event count for each.
Top 10 Active ResourceId. Lists the 10 active ResourceIds that have experienced the most events over the last 24 hours , and the event count for each.
Top 10 Active Server, Databases and Elastic Pool. Lists the 10 logical server-database-elastic pool combinations that have experienced the most events over the last 24 hours, and the event count for each.
Top 10 Operations. Lists the 10 operations with the most events over the last 24 hours.
Top 10 Active Server, Databases and WaitType. Lists the 10 logical server-database-wait type combinations that have experienced the most events over the last 24 hours, and the event count for each.
Top 10 Categories.The top 10 log categories for Azure diagnostic logs emitted over the last 24 hours.
Operations Trend. A stacked bar chart that shows the count of different operations over the last 24 hours.
Blocking Stats
See information about blocking queries in Azure SQL, including lock mode usage, lock duration, and details about block events.
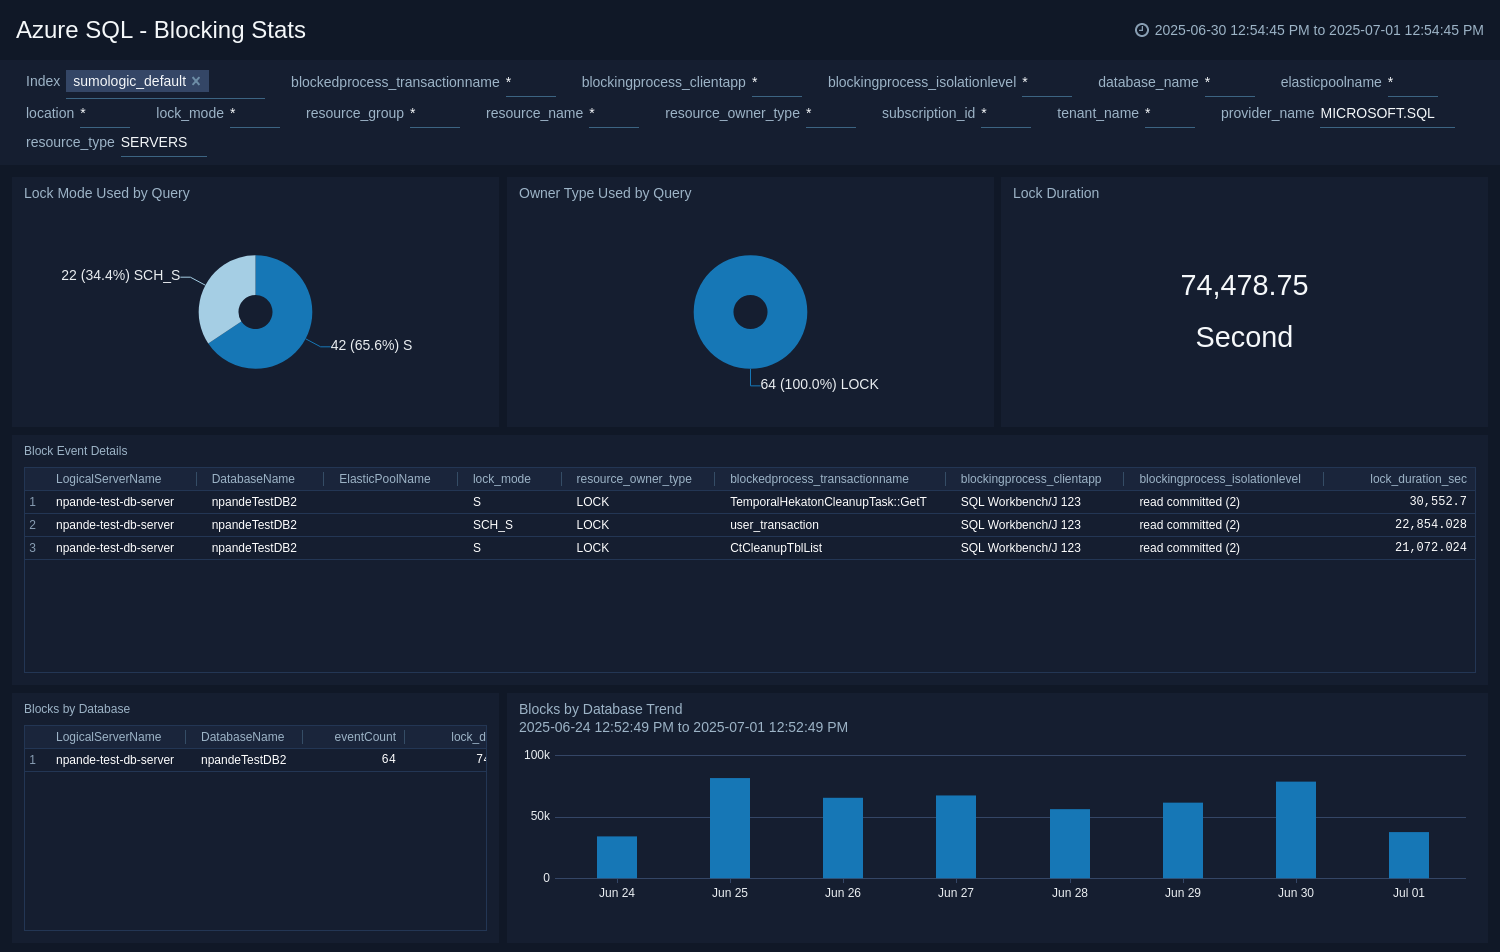
Lock Mode Used by Query. A donut chart that shows the breakdown of lock modes for blocked queries over the last 7 days.
Owner Type Used by Query. A donut chart the shows the breakdown of resource owner types for blocked queries over the last 7 days.
Lock Duration. The total number of seconds that database updates were blocked over the last 7 days.
Block Event Details. A table that lists details for blocking events over the last 7 days.
Blocks by Database. A table that lists the count of blocking events and the total lock duration by logical server and database over the last 7 days.
Blocks by Database Trend. A bar chart that shows the total lock duration by logical server and database on a timeline for the last 7 days.
Azure SQL - DatabaseWait Stats. Wait Events by Database. A donut chart that shows the count of wait events by logical server-database combination over the last 24 hours.
Wait Events Breakdown by Database. A stacked bar chart that shows the breakdown of wait events by wait type on a timeline over the last 24 hours.
Wait Type Trend. A stacked column chart that shows wait event over time, broken down by wait type.
Average Wait Time Per Task. A table that lists task-level information about wait events by logical server-database-wait type combination over the last 24 hours, including the count of waiting tasks, total wait time for those tasks, and the average wait time per task.
Detailed Stats. A table that lists information about wait events in the last 24 hours.
Errors
See information about errors in Azure SQL, including total error count, top 10 error numbers and error messages, errors by severity and database, error trend and comparison analyzes, and error details.
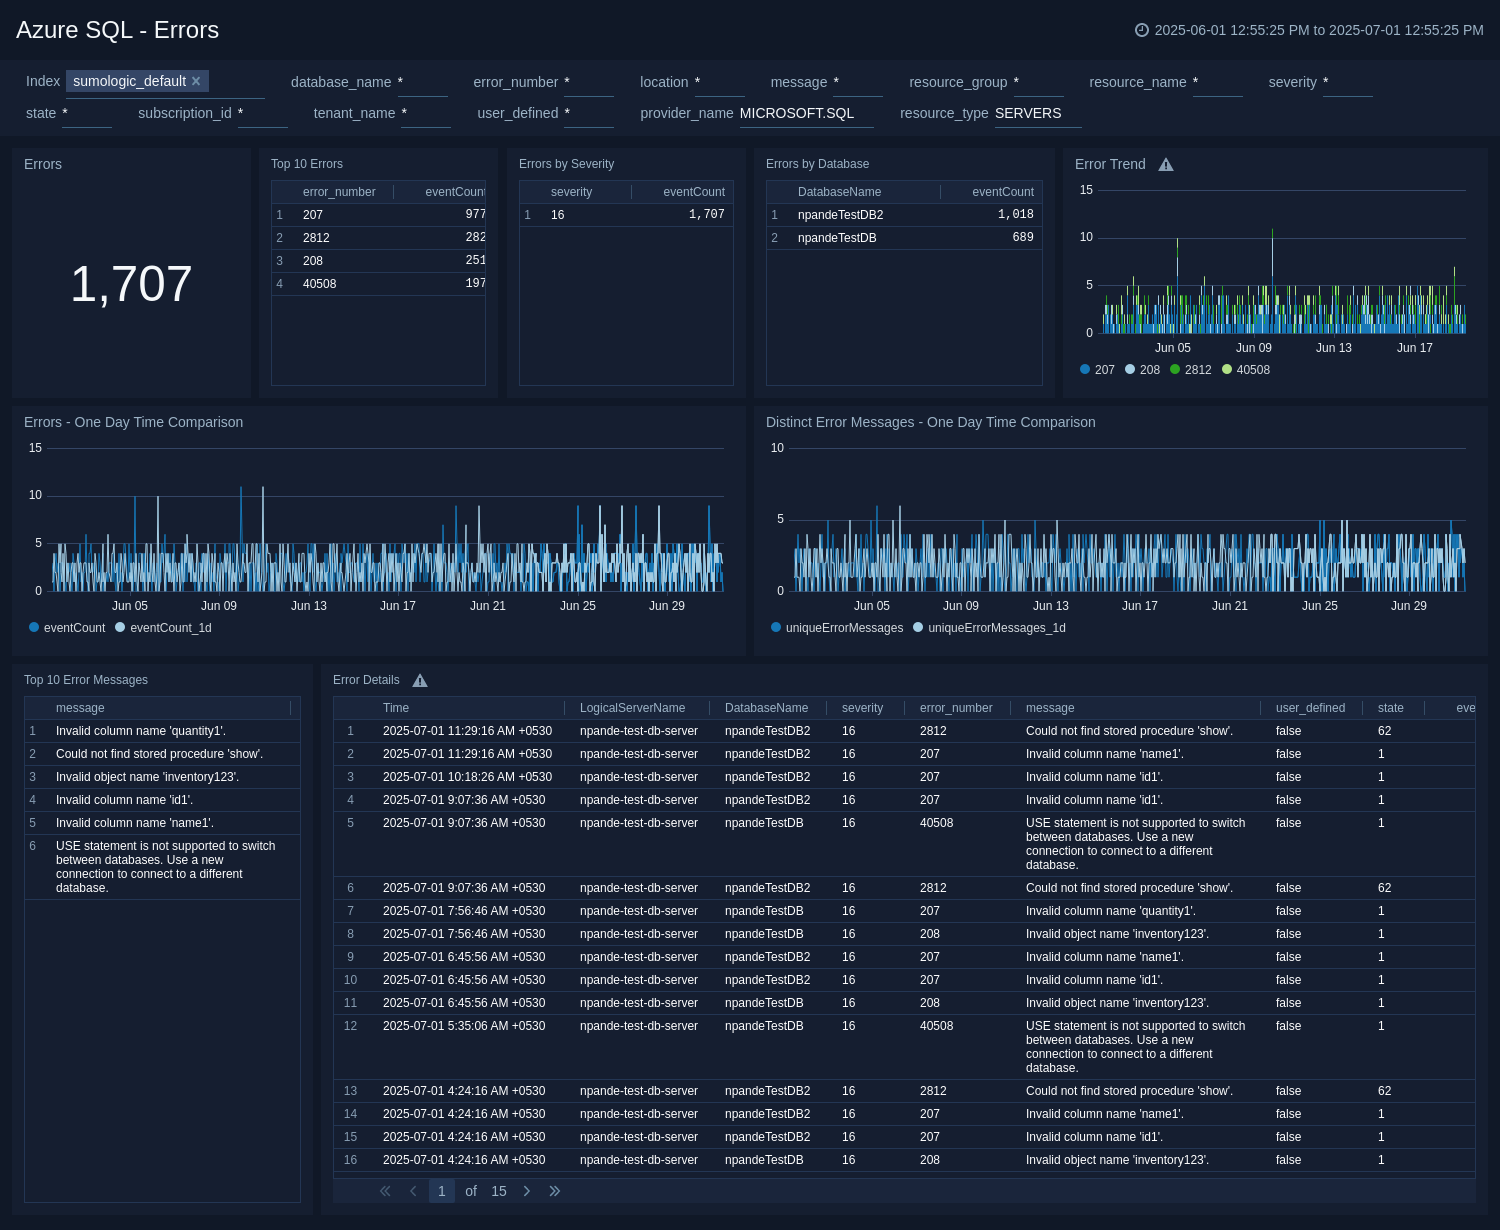
Errors. Count of errors over the last 24 hours.
Top 10 Errors. A table that lists the top 10 error numbers over the last 24 hours and the count of each error number.
Errors by Severity. A table that lists the severity of errors over the last 24 hours and the count of errors with each severity.
Errors by Database. A table that lists the error count for each database over the last 24 hours.
Error Trend. A stacked bar chart that shows the count of each error number over time.
Errors - One Day Time Comparison. A line chart that shows the count of errors per timeslice over the last 24 hours, compared with the count of errors one day previous.
Distinct Error Messages - One Day Time Comparison. A line chart that shows the count of distinct errors (unique messages) per timeslice over the last 24 hours, compared with the same count one day previous.
Top 10 Error Messages. A table that lists the top 10 error messages, and the count of each over the last 24 hours.
Error Details. A table that lists the details of errors that occurred during the previous 24 hours.
Metrics
See metrics for connections attempts; Database Transaction Unit (DTUs), CPU and storage utilization; and for deadlocks, sessions, and workers.
For information about the metrics presented in the Metrics dashboards, see All metrics and Microsoft.Sql/servers/databases in Azure help.
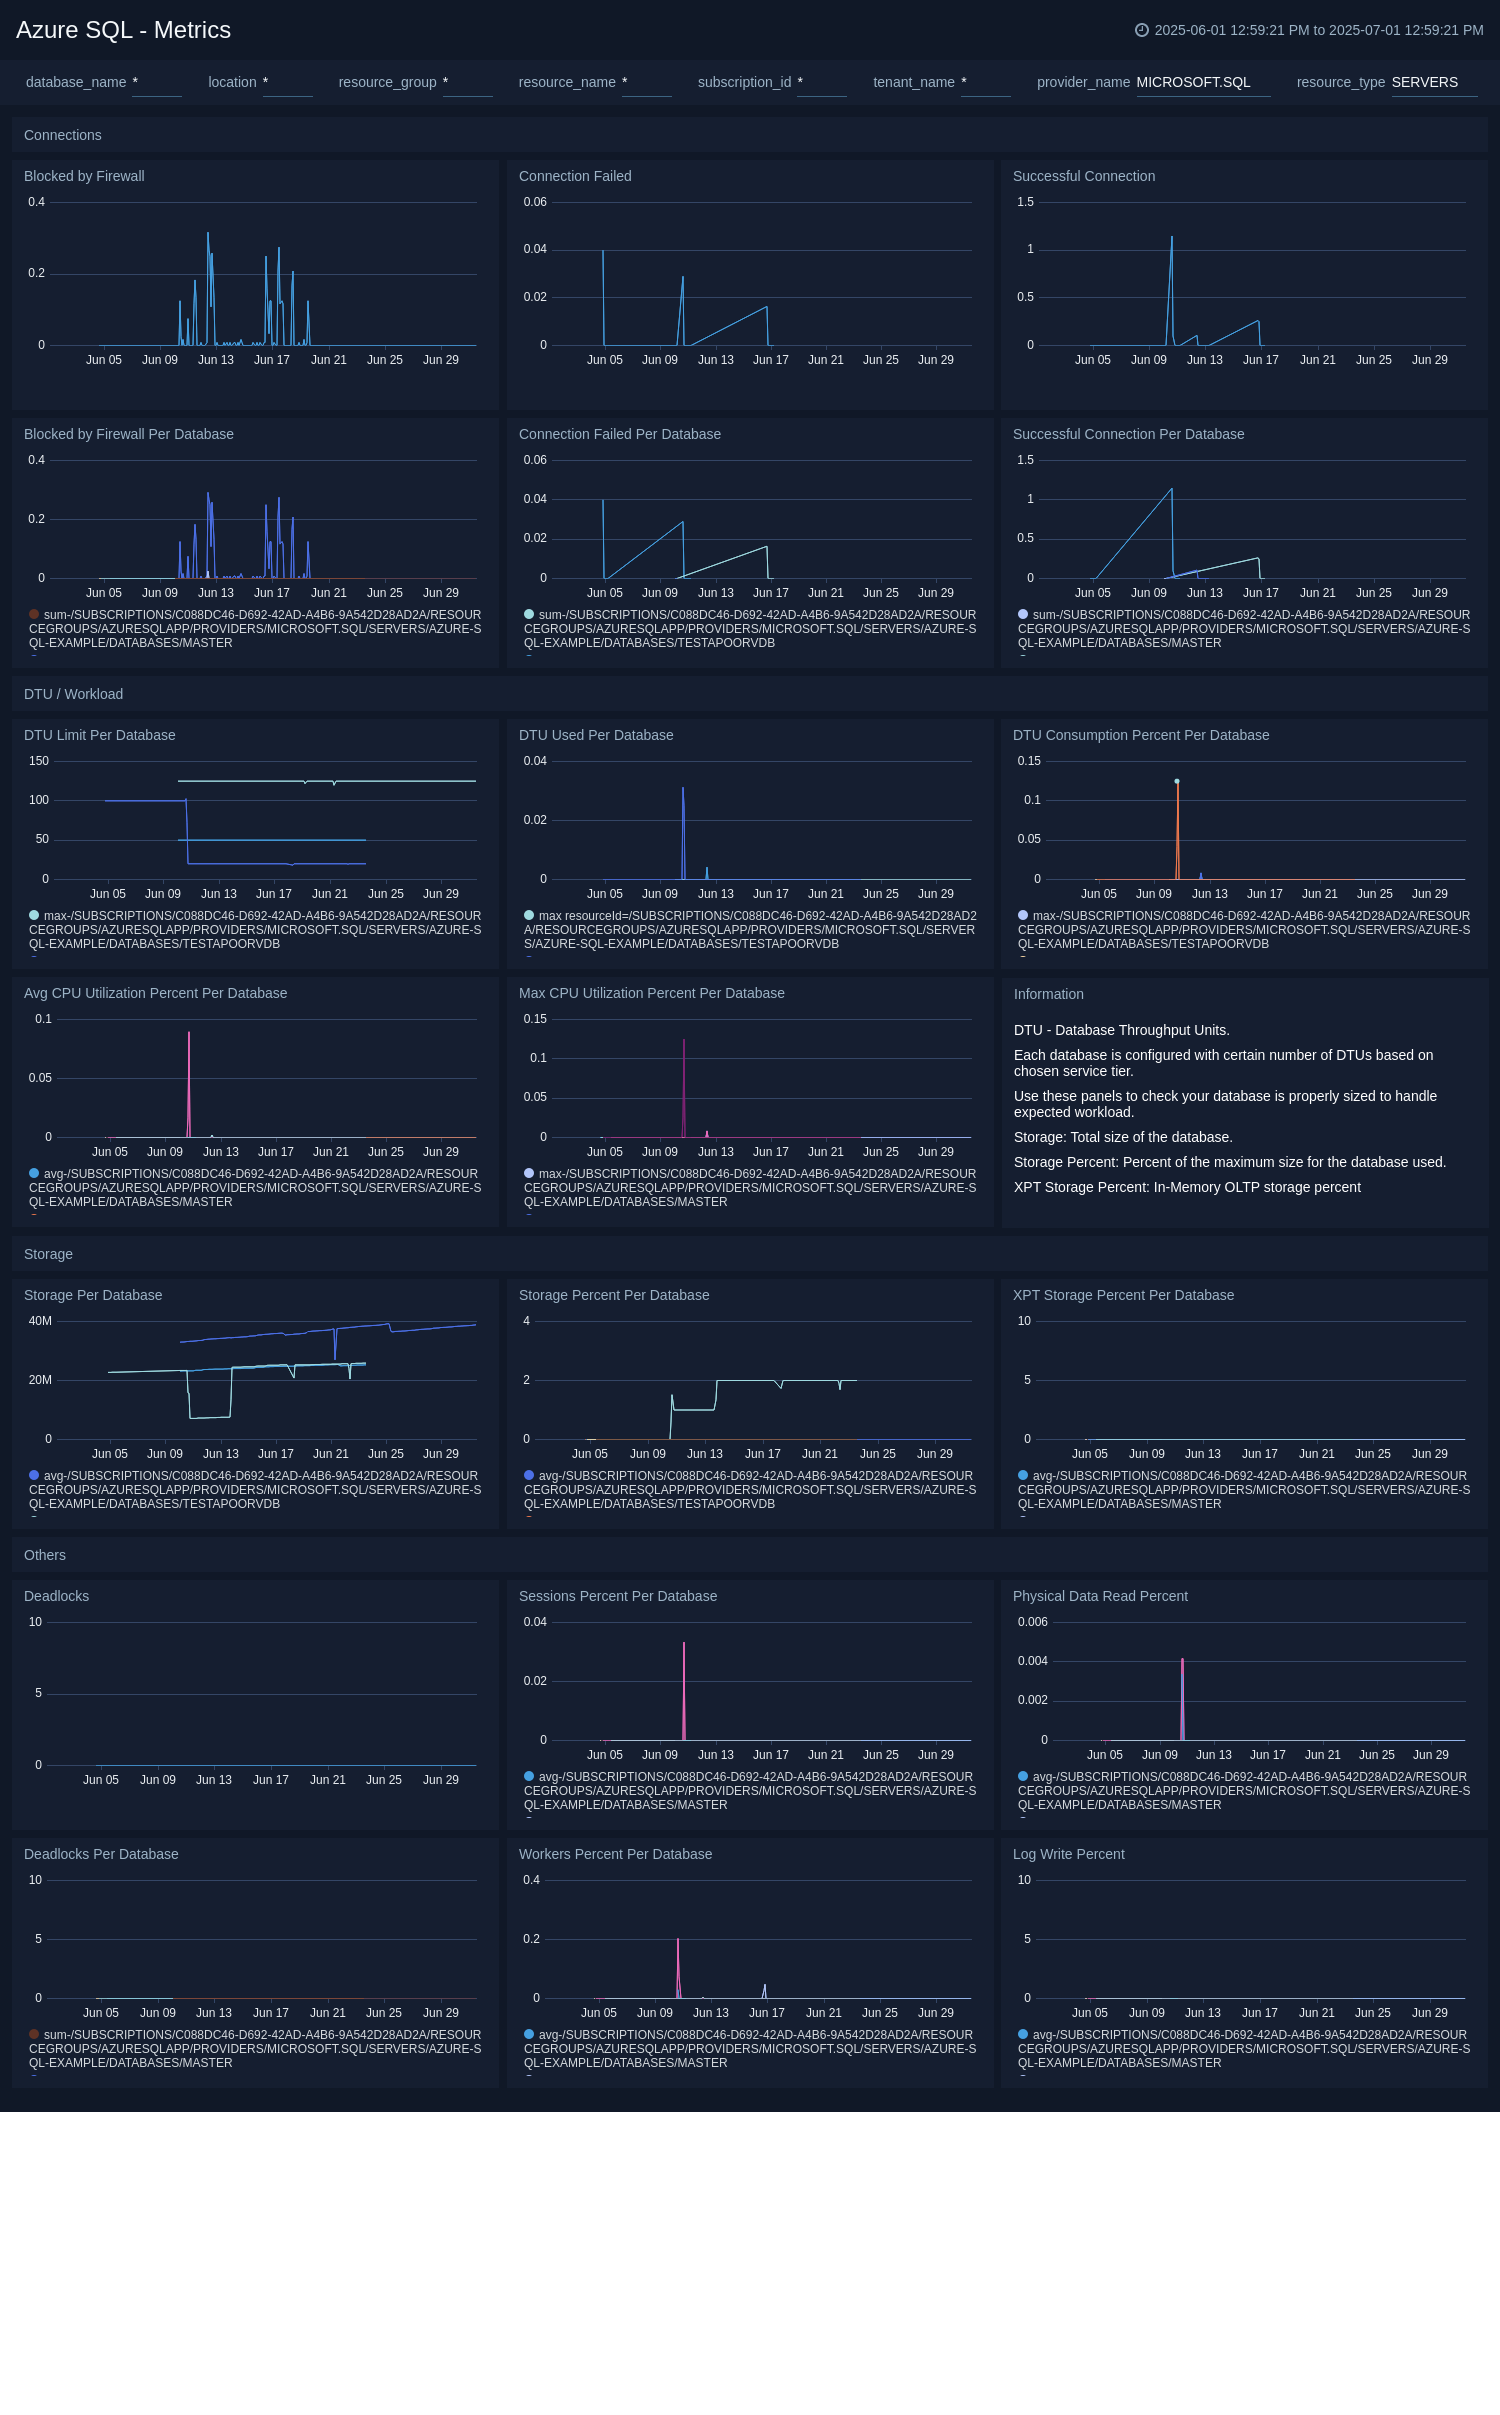
Blocked by Firewall. A line chart showing the count of connections blocked by a firewall over the last 24 hours.
Connection Failed. A line chart showing the count of failed connections over the last 24 hours.
Successful Connection. A line chart showing the count of successful connections over the last 24 hours.
Blocked by Firewall Per Database. A line chart showing the count of connections to each database blocked by a firewall over the last 24 hours.
Connection Failed Per Database. A line chart showing the count of failed connections to each database over the last 24 hours.
Successful Connection Per Database. A line chart showing the count of successful connections to each database over the last 24 hours.
DTU Limit Per Database. A line chart showing the Database Throughput Unit (DTU) limit for each database over the last 24 hours.
DTU Used Per Database. A line chart showing the DTU used for each database over the last 24 hours.
DTU Consumption Percent Per Database. A line chart showing the percentage of the DTU limit was consumed by each database over the last 24 hours.
Avg CPU Utilization Percent Per Database. A line charge showing the average percentage of CPU used by each database over the last 24 hours.
Max CPU Utilization Percent Per Database. A line charge showing the maximum percentage of CPU used by each database over the last 24 hours.
Storage Per Database. The total size in bytes of each database over the last 24 hours.
Storage Percent Per Database. The percentage of the maximum allowed database size used by each database over the last 24 hours.
XPT Storage Percent Per Database. The percentage of in-memory OLTP storage used by each database over the last 24 hours.
Deadlocks. Count of deadlocks over the last 24 hours.
Sessions Percent Per Database. The percentage of allowed sessions used by each database over the last 24 hours.
Physical Data Read Percent. Displays average data I/O percentage over the last 24 hours.
Deadlocks Per Database. Count of deadlocks by database over the last 24 hours.
Workers Percent Per Database. The percentage of the allowed workers used by each database over the last 24 hours.
Log Write Percent. Displays average log I/O percentage over the last 24 hours.
QueryStoreRuntime Stats
See query runtime execution statistics such as CPU usage and query duration.
For more information about the statistics presented on the QueryStoreRuntime Stats dashboard, see Query Store runtime statistics in Azure help.
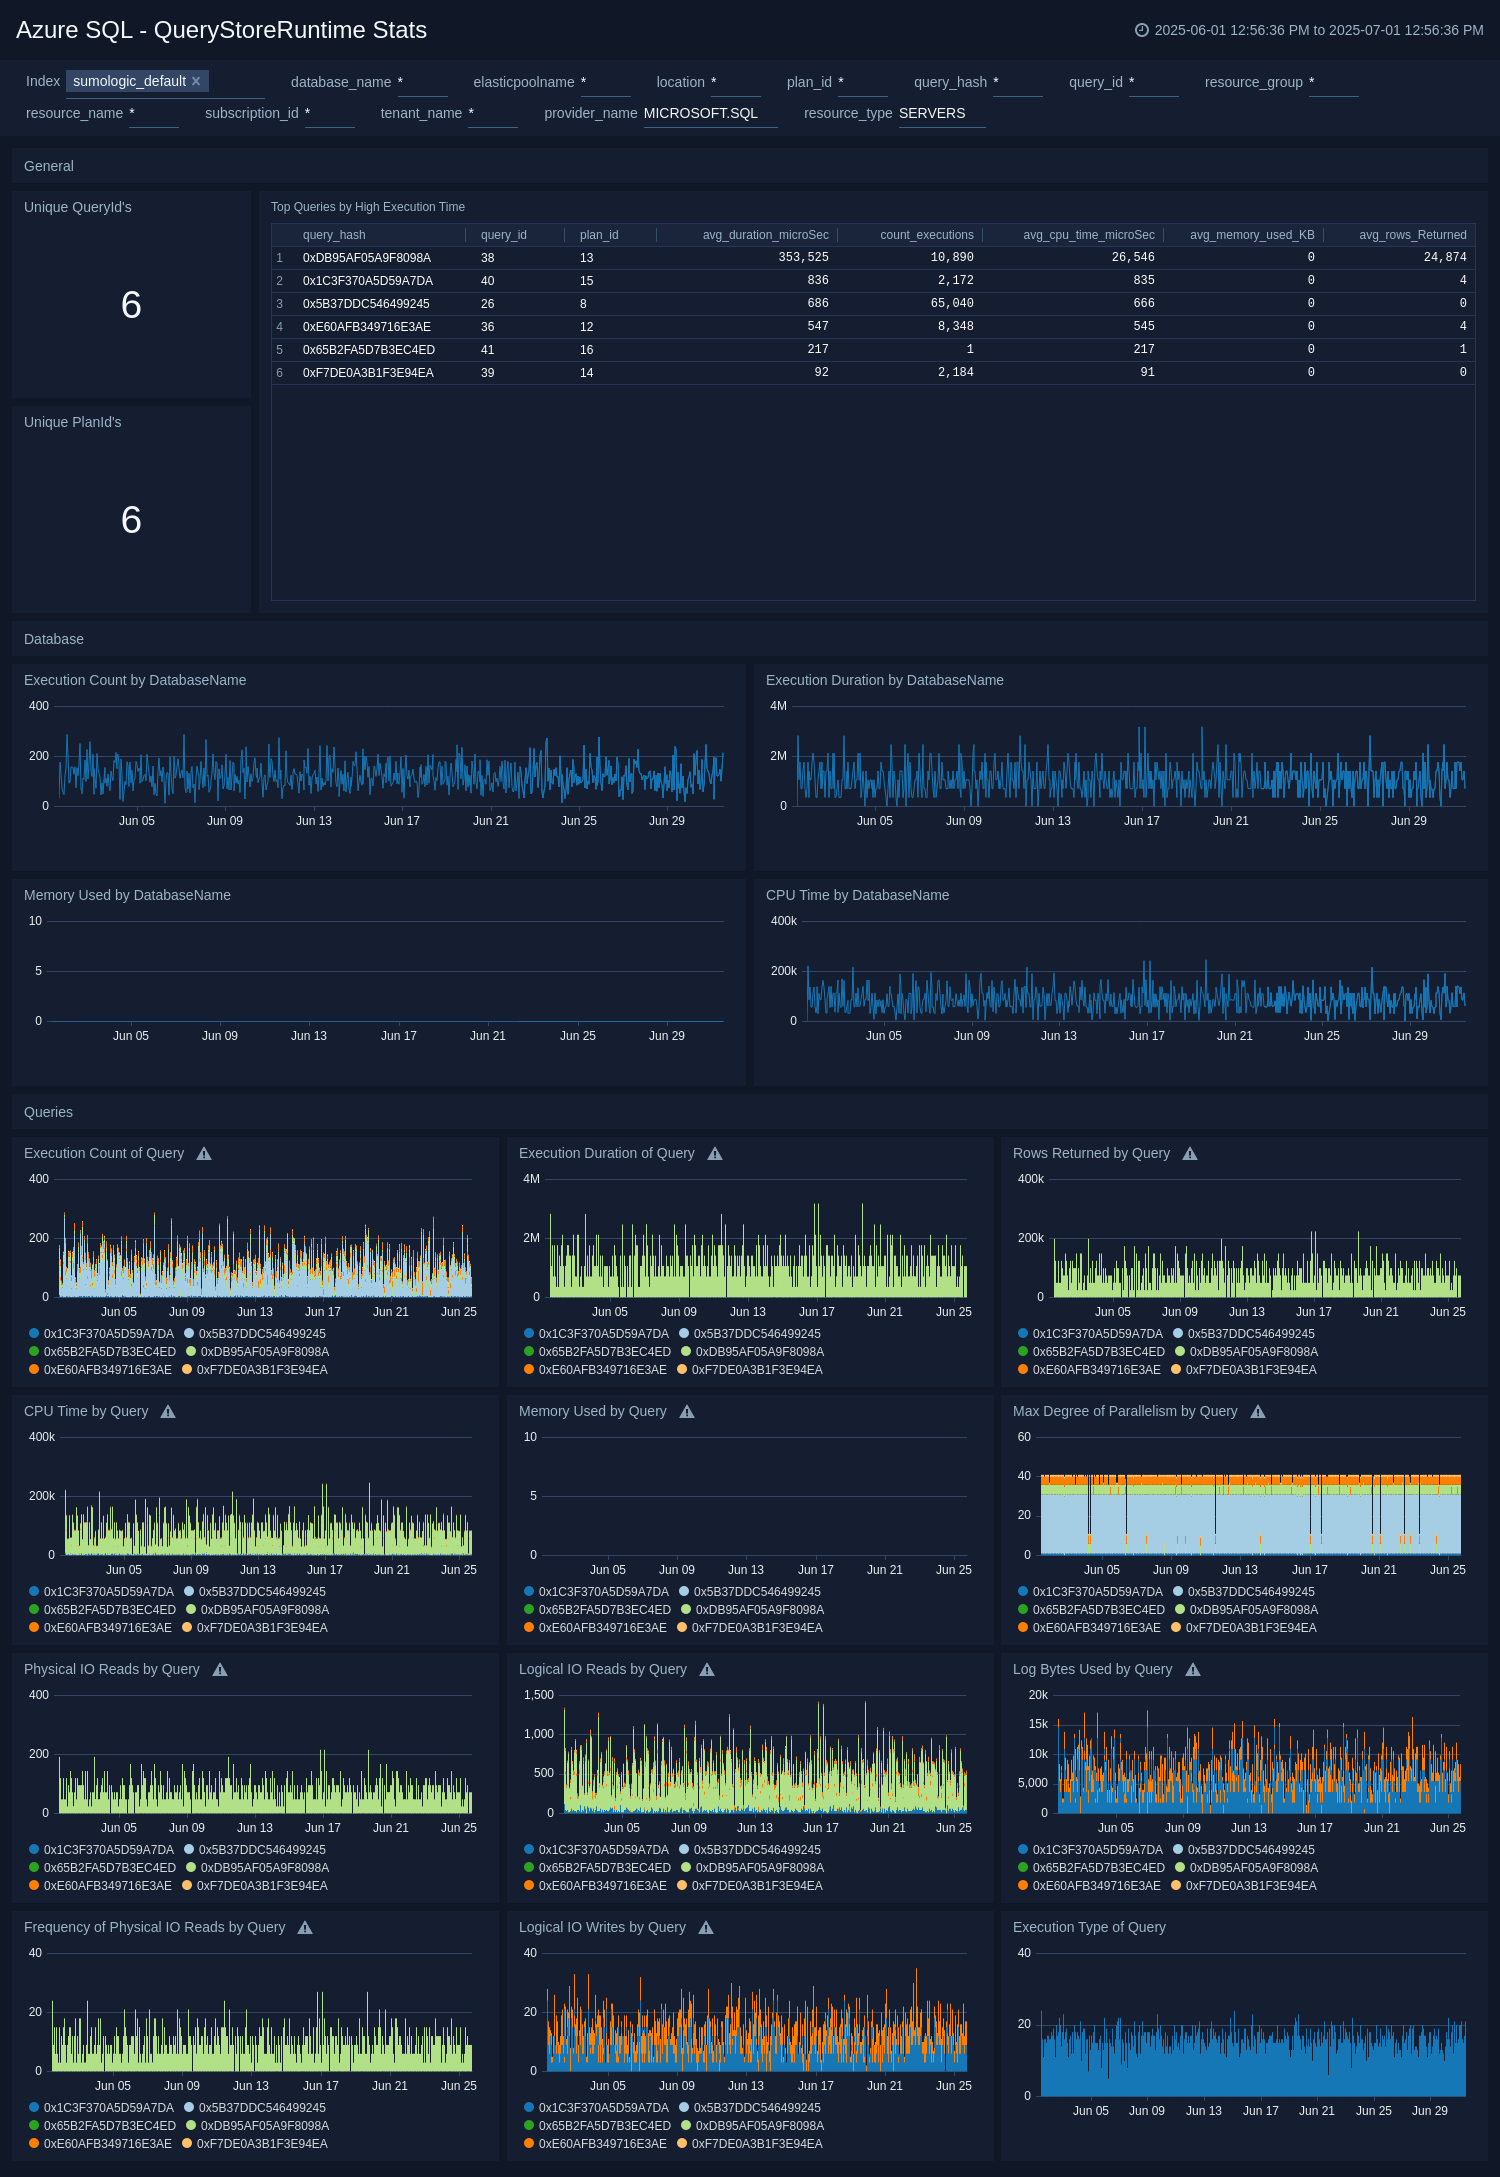
Unique QueryId's. The count of unique queryIDs over the last 24 hours.
Unique PlanId's.The count of unique PlanIDs over the last 24 hours.
Top Queries by High Execution Time. A table that lists the 15 queries with the longest execution time over the last 24 hours, and information about those queries.
Execution Count by DatabaseName. A line chart that shows the count of queries per timeslice for each database over the last 24 hours.
Execution Duration by DatabaseName. A line chart that shows the total duration (in milliseconds) of queries per timeslice for each database over the last 24 hours.
Memory Used by DatabaseName. A line chart that shows the maximum memory used per timeslice by each database over the last 24 hours.
CPU Time by DatabaseName. A line chart that shows the CPU time consumed (in microseconds) by queries per timeslice by each database over the last 24 hours.
Execution Count of Query. A stacked column chart that shows the count of each query per timeslice over the last 24 hours.
Execution Duration of Query. A stacked column chart that shows the total execution time in milliseconds for each query per timeslice over the last 24 hours.
Rows Returned by Query. A stacked column chart that shows the rows returned by each query per timeslice over the last 24 hours.
CPU Time by Query. A stacked column chart that shows the CPU time used by each query per timeslice over the last 24 hours.
Memory Used by Query. A stacked column chart that shows the memory used by each query per timeslice over the last 24 hours.
Max Degree of Parallelism by Query. A stacked column chart that shows the maximum degree of parallelism for each query per timeslice over the last 24 hours.
Physical IO Reads by Query. A stacked column chart that shows the count of reads from disk for each query per timeslice over the last 24 hours.
Logical IO Reads by Query. A stacked column chart that shows the count of reads from memory for each query per timeslice over the last 24 hours.
Log Bytes Used by Query. A stacked column chart that shows the count bytes written to the transaction log for each query per timeslice over the last 24 hours.
Execution Type of Query. A stacked column chart that shows the count of queries by execution type: Regular, Aborted, or Exception over the last 24 hours.
QueryStoreWait Stats
See information about how much time a database spent waiting on different wait types.
For more information about the statistics presented on the QueryStoreWaitStats dashboard, see Query Store wait statistics in Azure help.
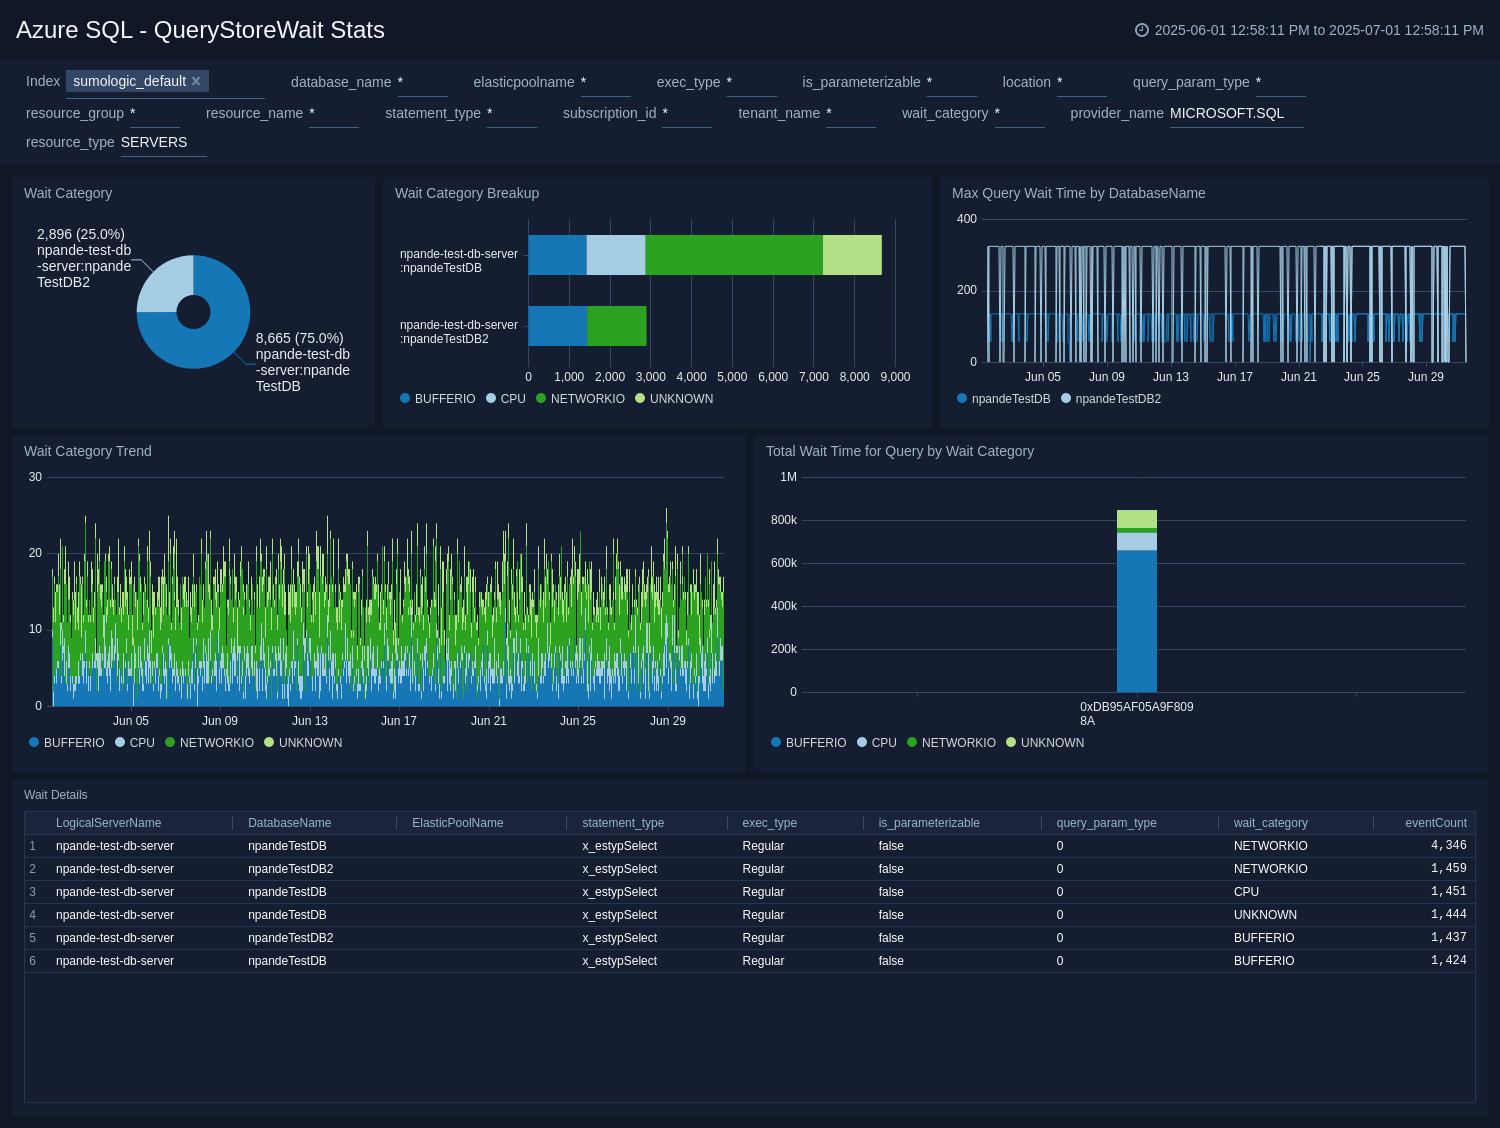
Wait Category. A donut chart that shows the breakdown of wait events by database over the last 24 hours.
Wait Category Breakup. A horizontal bar chart that shows the breakdown of wait event by category for each database over the last 24 hours.
Max Query Wait Time by DatabaseName. A line chart that shows that maximum query wait type per timeslice for each database over the last 24 hours.
Wait Category Trend. A stacked column chart that shows the count of wait events by category per timeslice over the last 24 hours.
Total Wait Time for Query by Wait Category. A stacked column chart that shows, for each query, the length of time a query spent waiting in each Wait Category over the last 24 hours.
Wait Details. The table displays wait statistics as encountered by queries on a given database, residing on a given logical server in the last 24 hours.
SQLInsights
See database performance analytics obtained from Azure SQL Database Intelligent Insights, including information about issues like excessive wait times, critical exceptions, and so on.
For more information about the data presented on the SQLInsights dashboard, see Use the Intelligent Insights Azure SQL Database performance diagnostics log in Azure help.
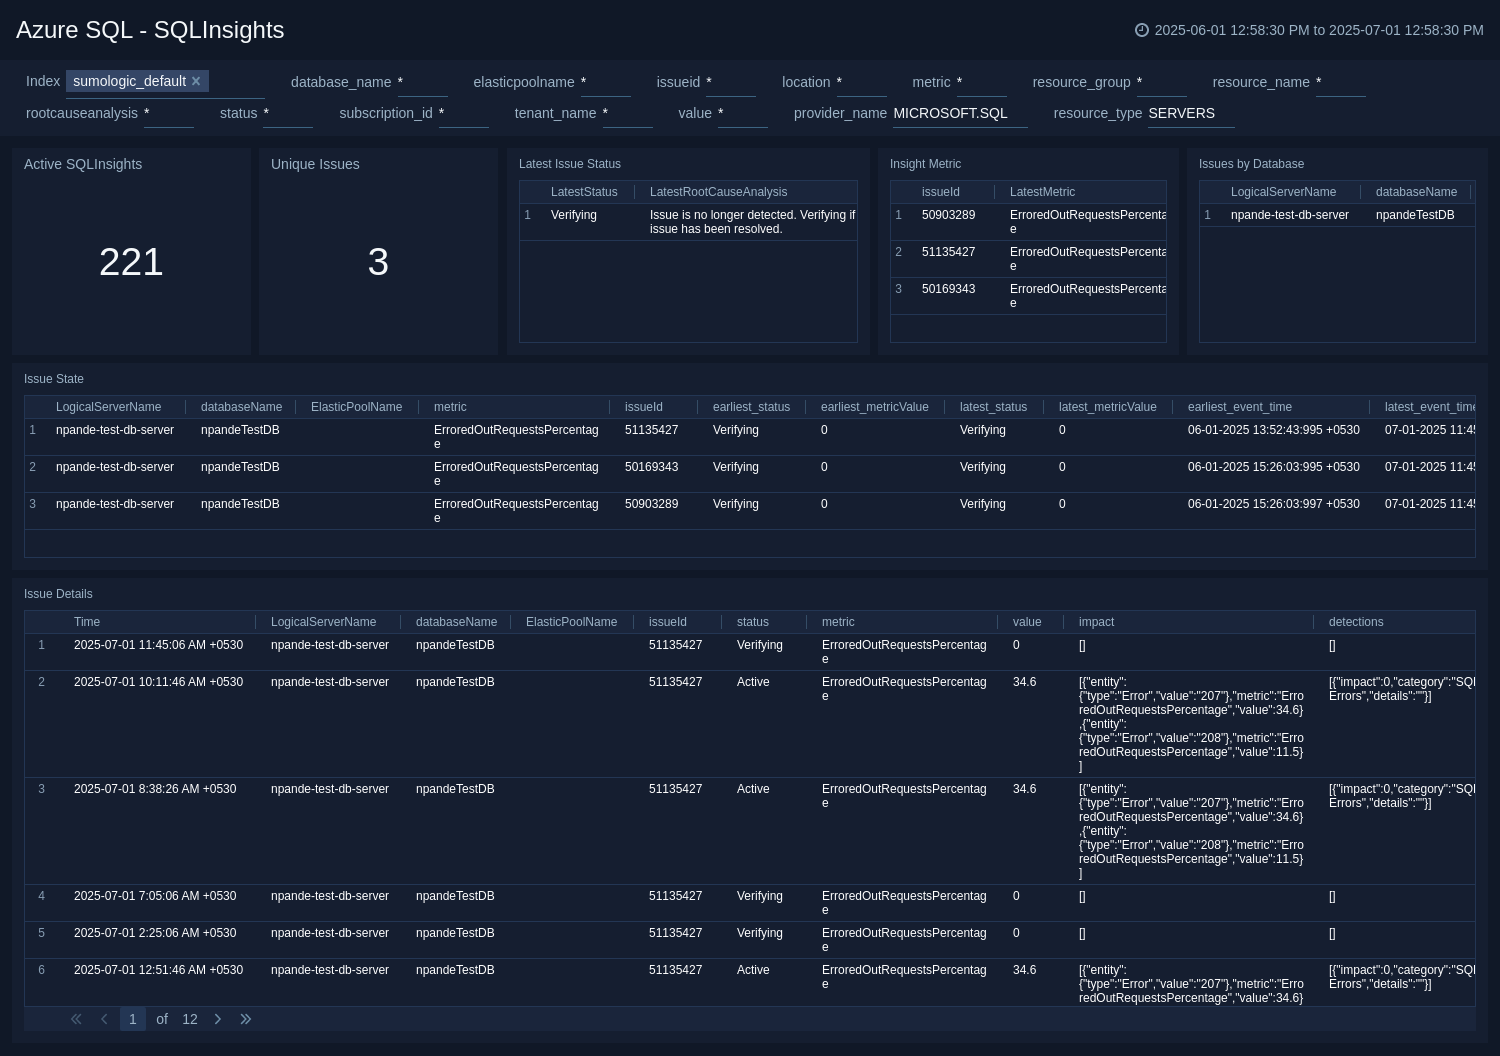
Active SQLInsights. Count of active SQL Insights issues as of the current time.
Unique Issues. Count of issues identified, whether resolved or not.
Latest Issue Status. Displays count of issues with latest state and root cause.
Insight Metric. Displays the performance metric for which an issue is identified, by IssueID.
Issues by Database. A table that shows the count of unique issues by database over the last 7 days.
Issue State. A table that shows the current state of unique issues, along with additional information about the issues over the last 7 days.
Issue Details. Displays information about the progress of issues throughout the resolution process.
Timeouts
See information about timeouts in Azure SQL.
For more information about the data presented on the Timeouts dashboard, see Time-outs dataset in Azure help.
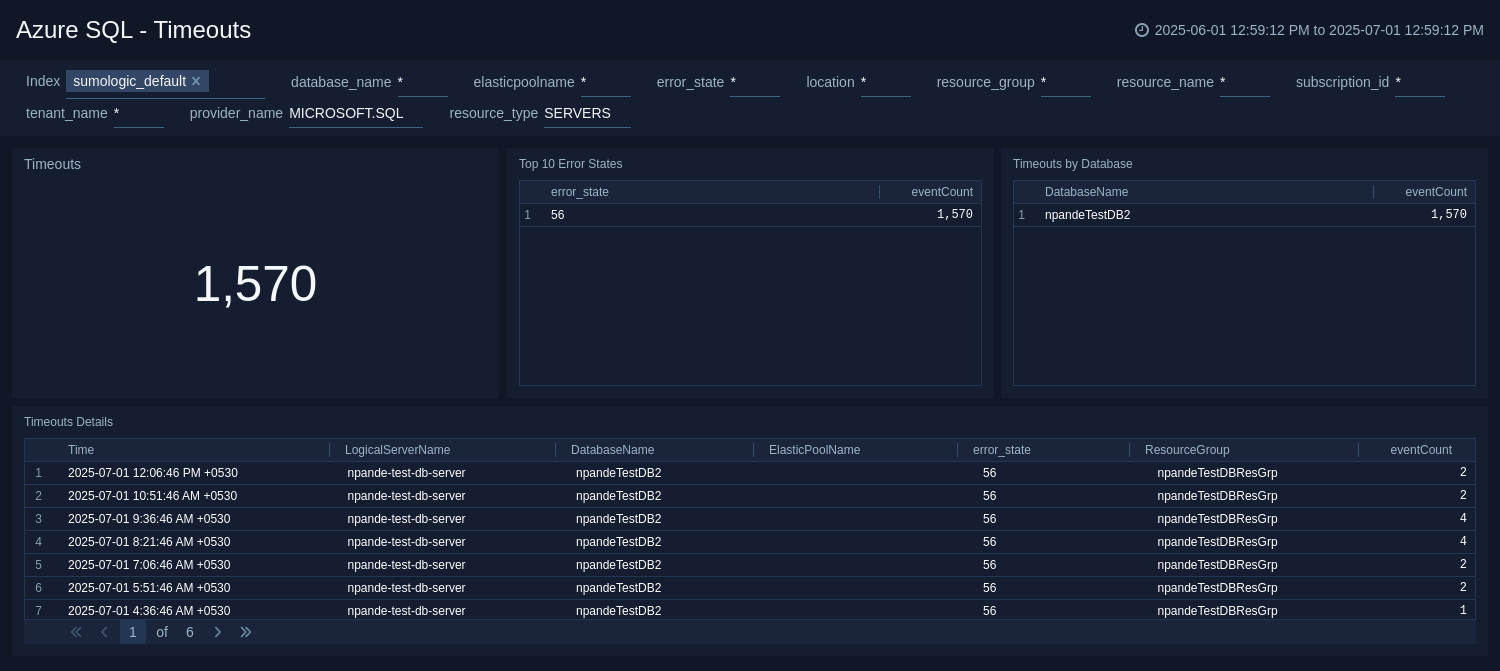
Timeouts. The count of timeouts over the last 7 days.
Top 10 Error States. A table that lists the top 10 errors states that have occurred over the last 7 days and the count of errors in each state.
Timeouts by Database. A table that lists the count of timeouts by database over the last 7 days.
Timeouts Details. A table that lists information about timeouts that have occurred over the last 7 days.
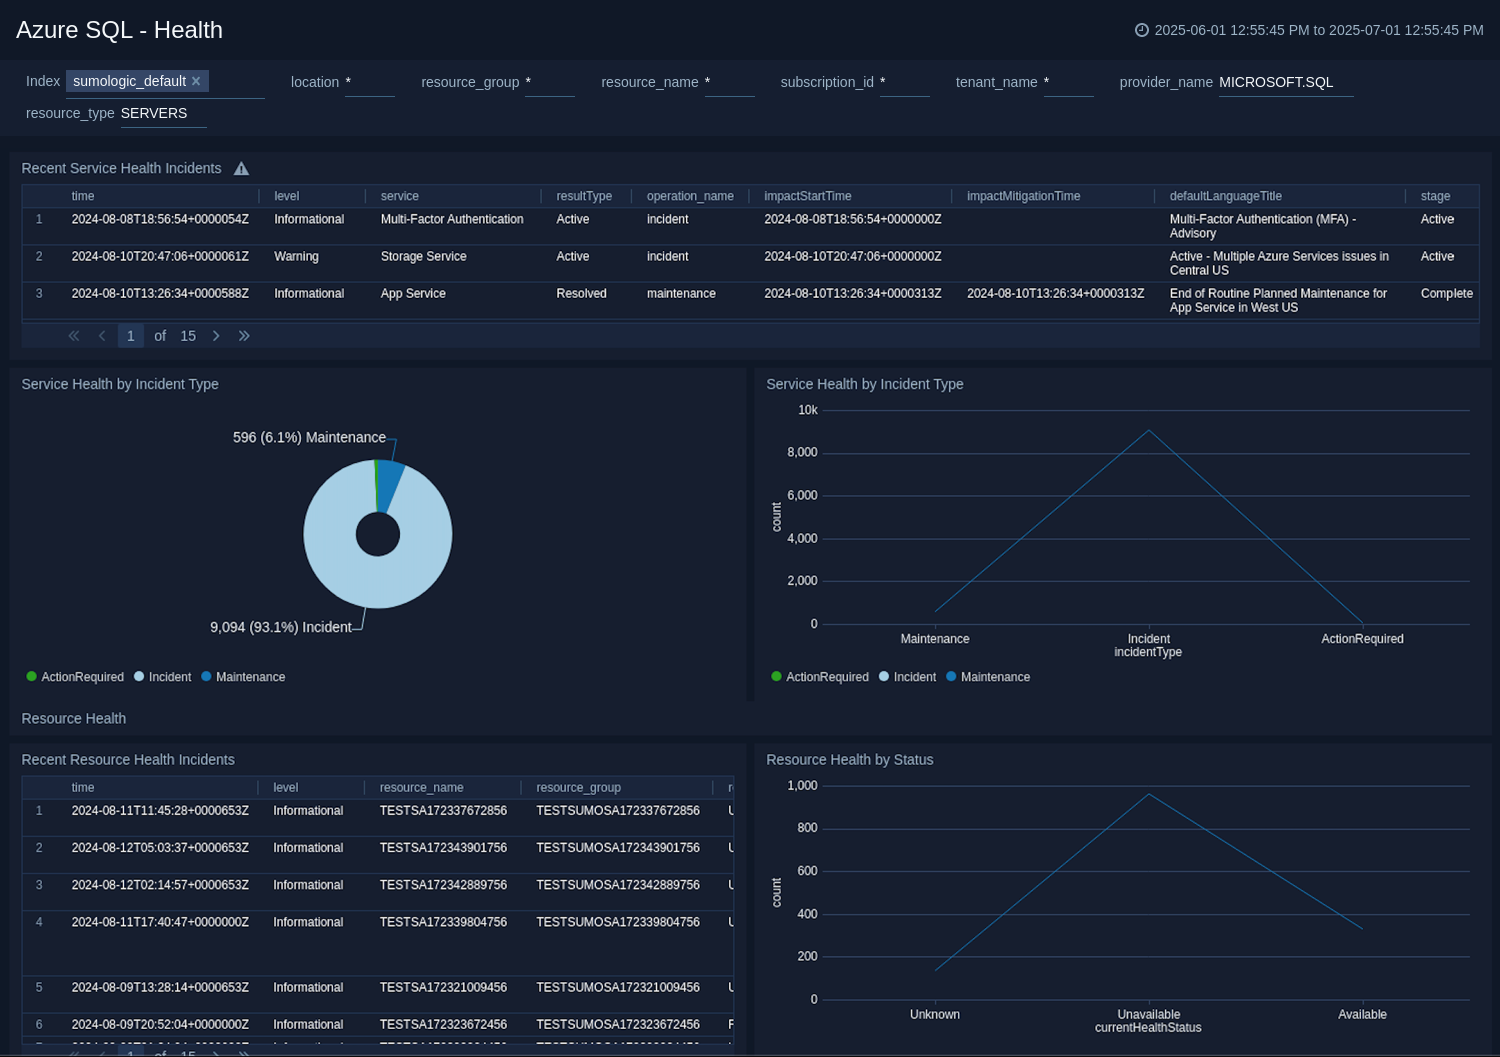
Health
The Azure SQL - Health dashboard provides information of any service health incidents or resource health events associated with SQL database service or resource in your azure account.
Use this dashboard to:
- View recent resource and service health incidents.
- View distribution of service and resource health by incident type.
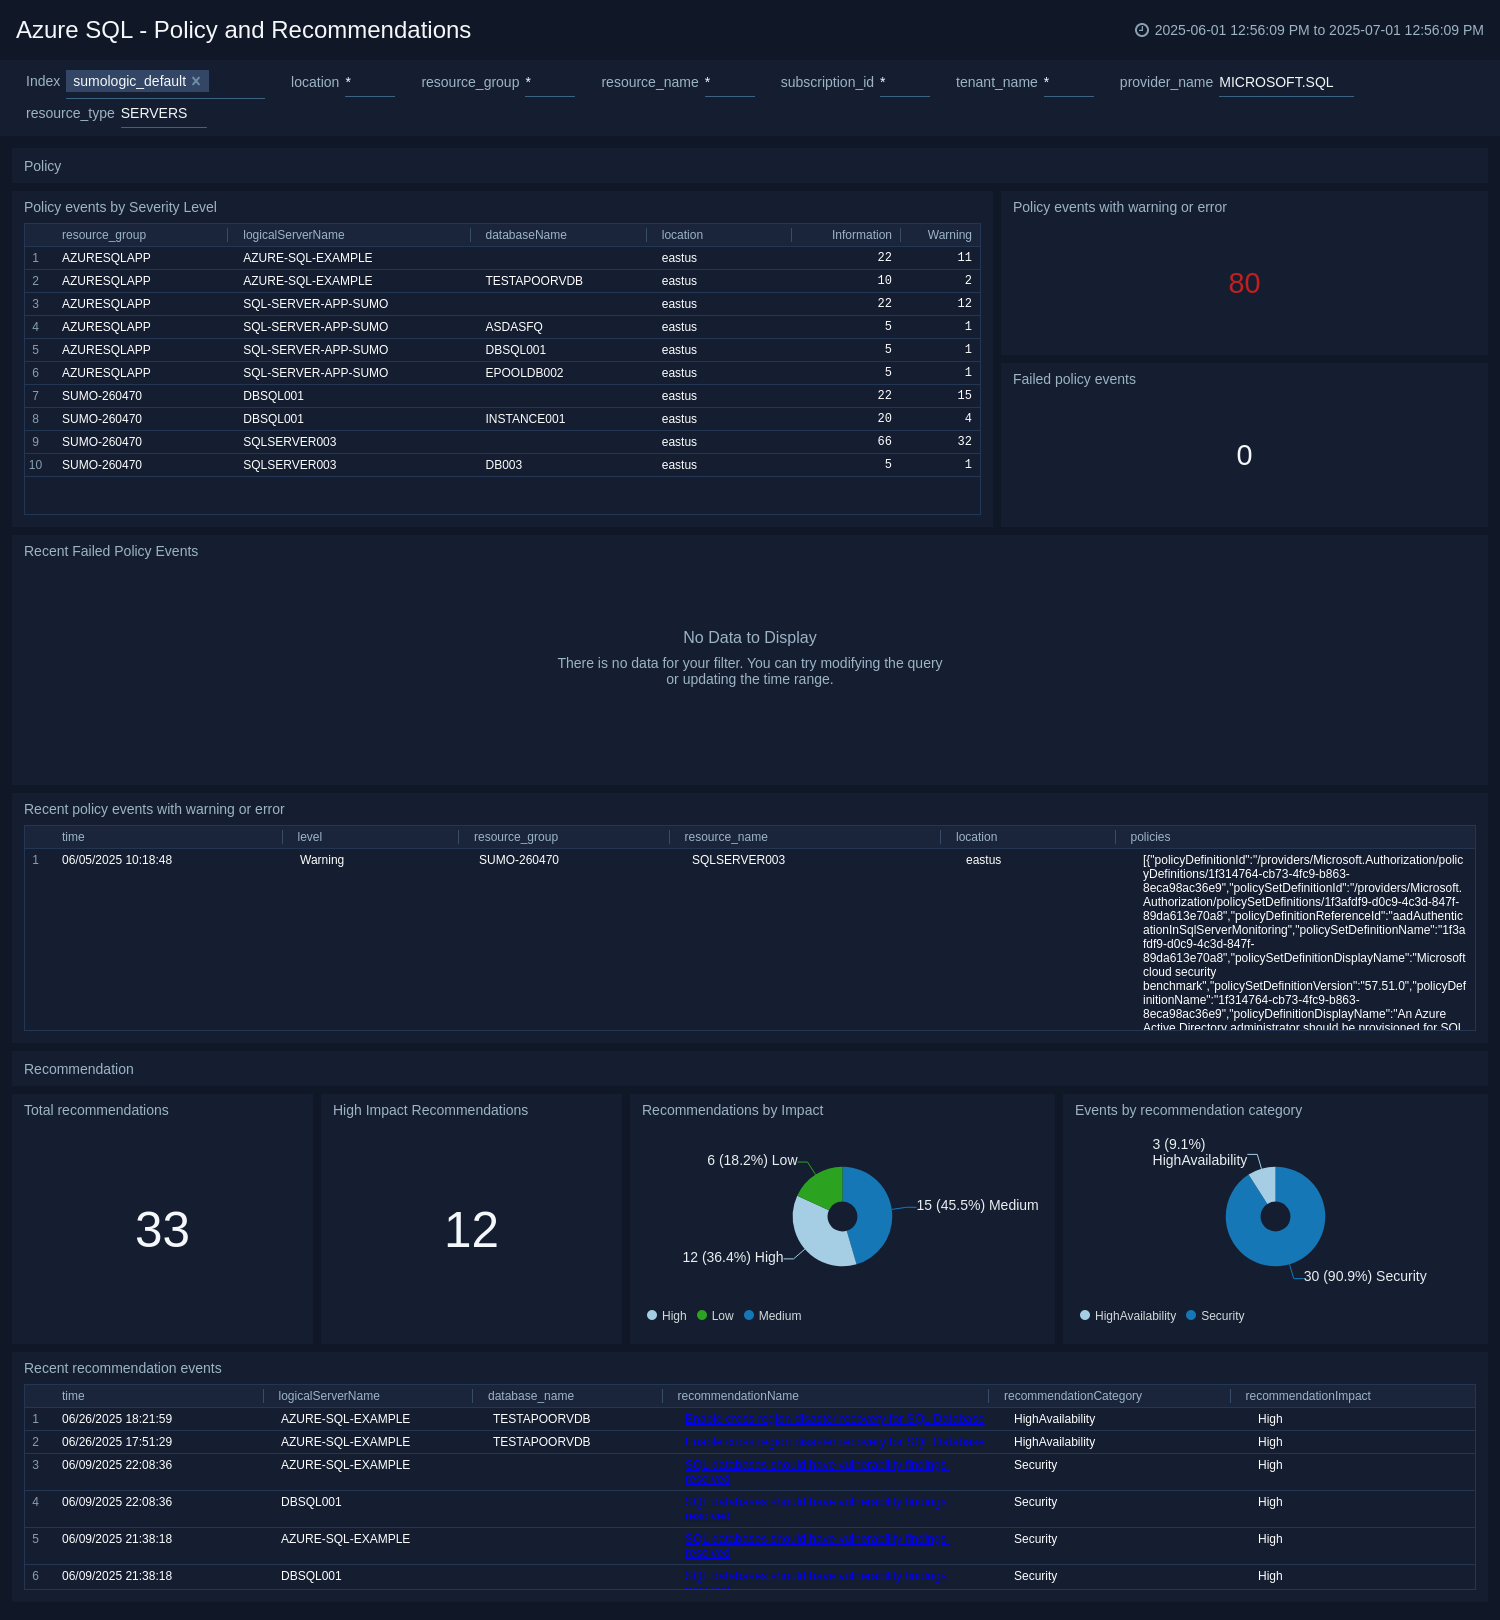
Policy and Recommendations
The Azure SQL - Policy and Recommendations dashboard provides information of all effect action operations performed by Azure Policy and recommendations events from Azure Advisor.
Use this dashboard to:
- Monitor policy events with warnings and errors.
- View recent failed policy events.
- View total recommendation events.
- Identify High Impact recommendations.
- View recent recommendation events and navigate to the affected resource.
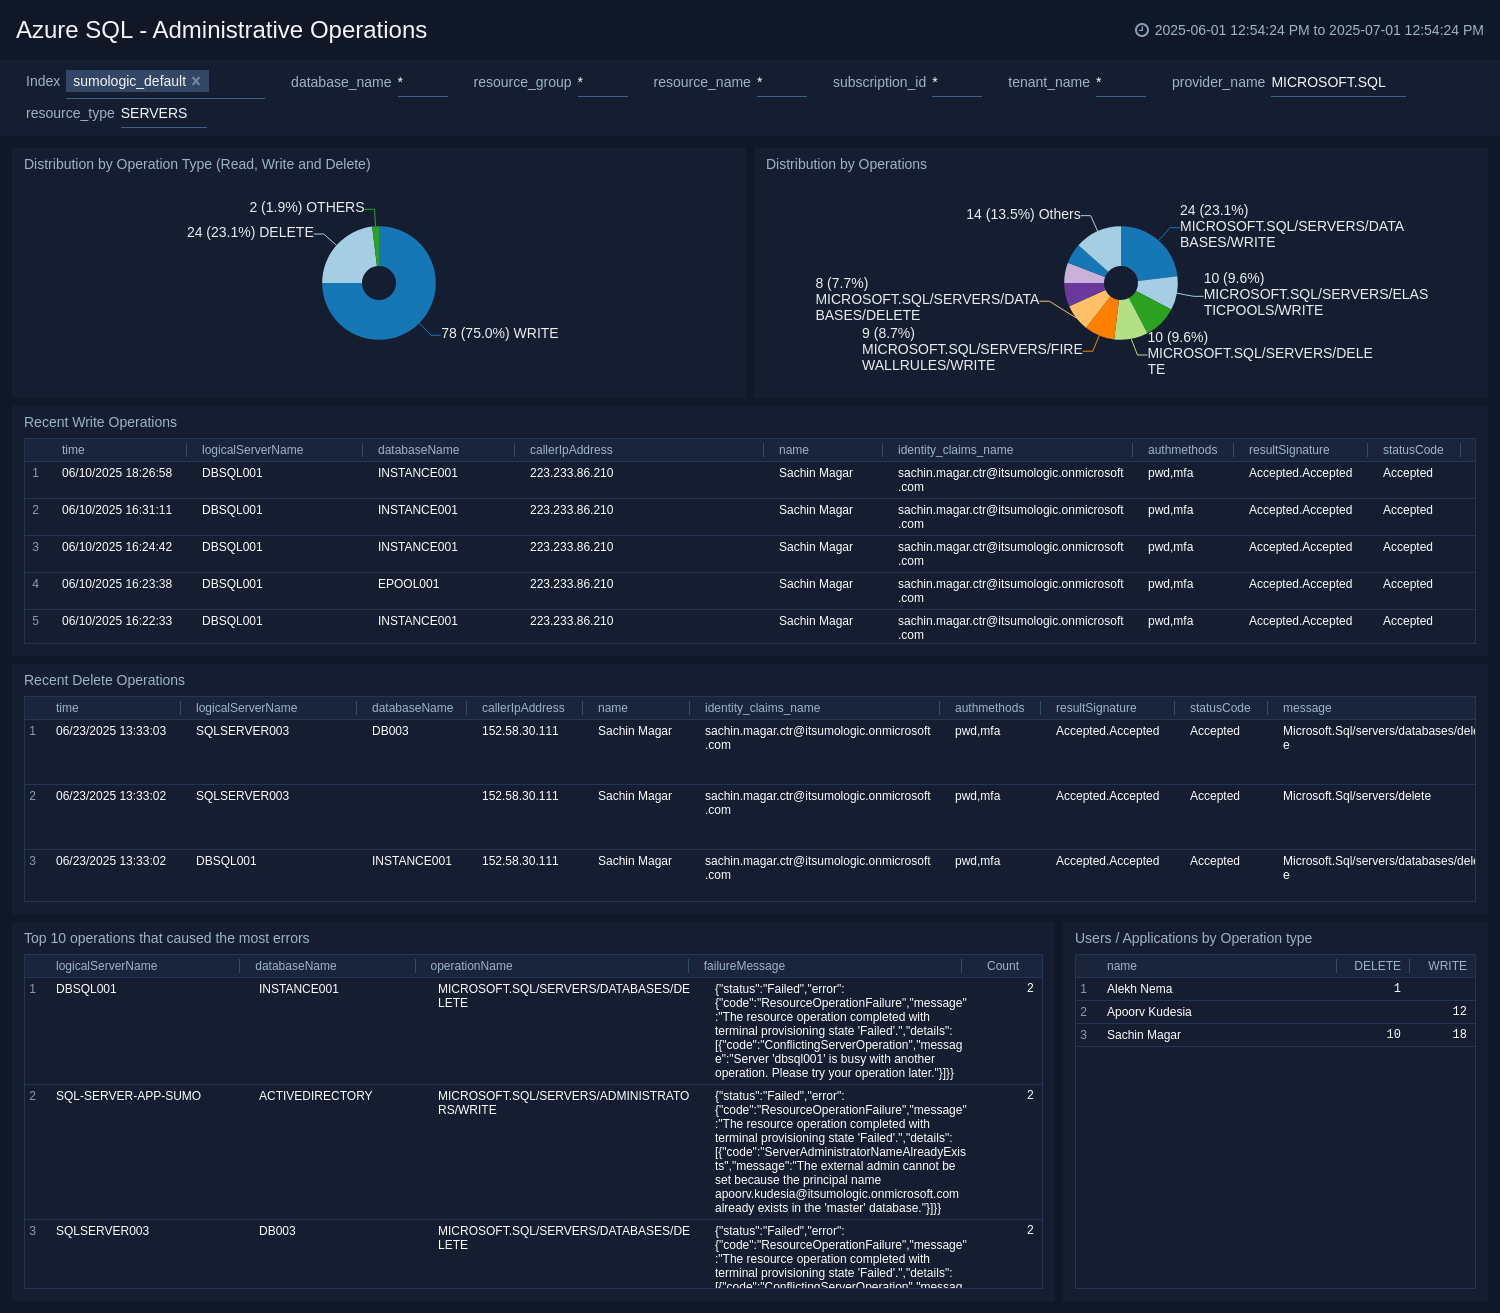
Administrative Operations
The Azure SQL - Administrative Operations dashboard provides details on read/write/delete specific changes, different operations used, top 10 operations that caused most errors, and users performing admin operations.
Use this dashboard to:
- Identify top users performing administrative operations.
- View Top 10 operations that caused the most errors.
- View recent read, write, and delete operations.
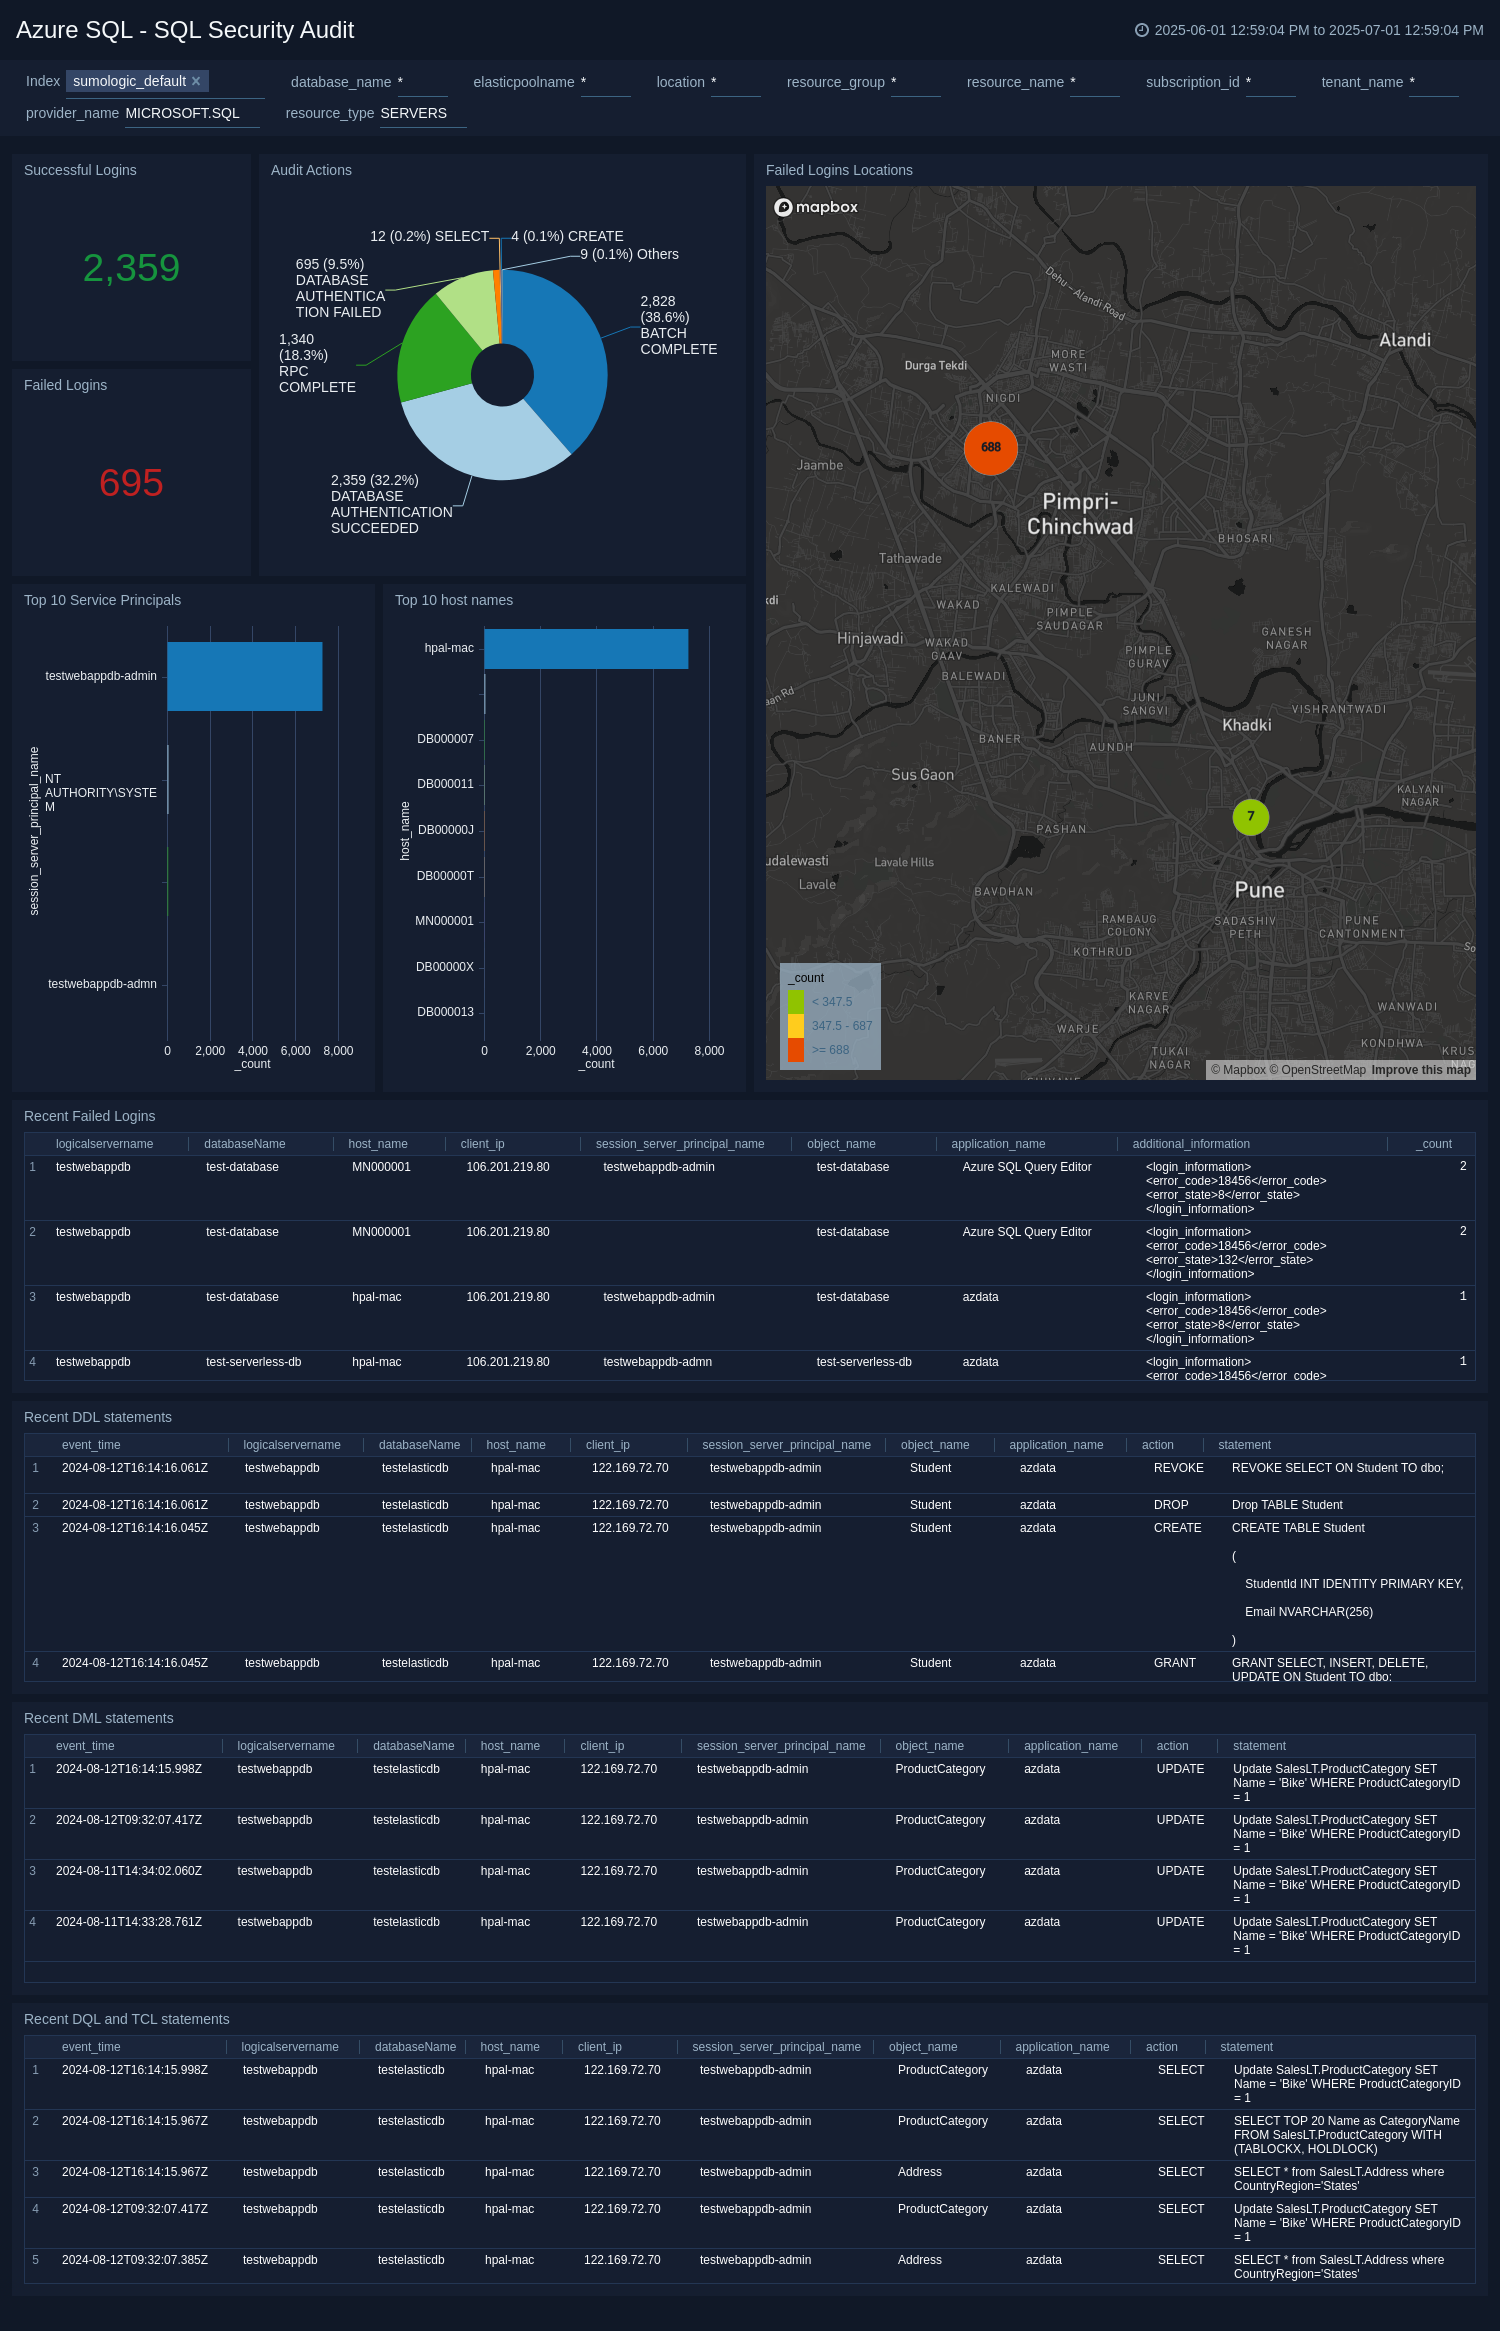
SQL Security Audit
The Azure SQL - SQL Security Audit dashboard provides audit information on server level events and database level events including DML and DDL statements executed.
Use this dashboard to:
- Identify failed login and their geo locations.
- View recent DDL, DML, DQL, and TCL statements.
- Track who (host name, service principal, ip address) and what (object, database, server) information associated with any database operation.
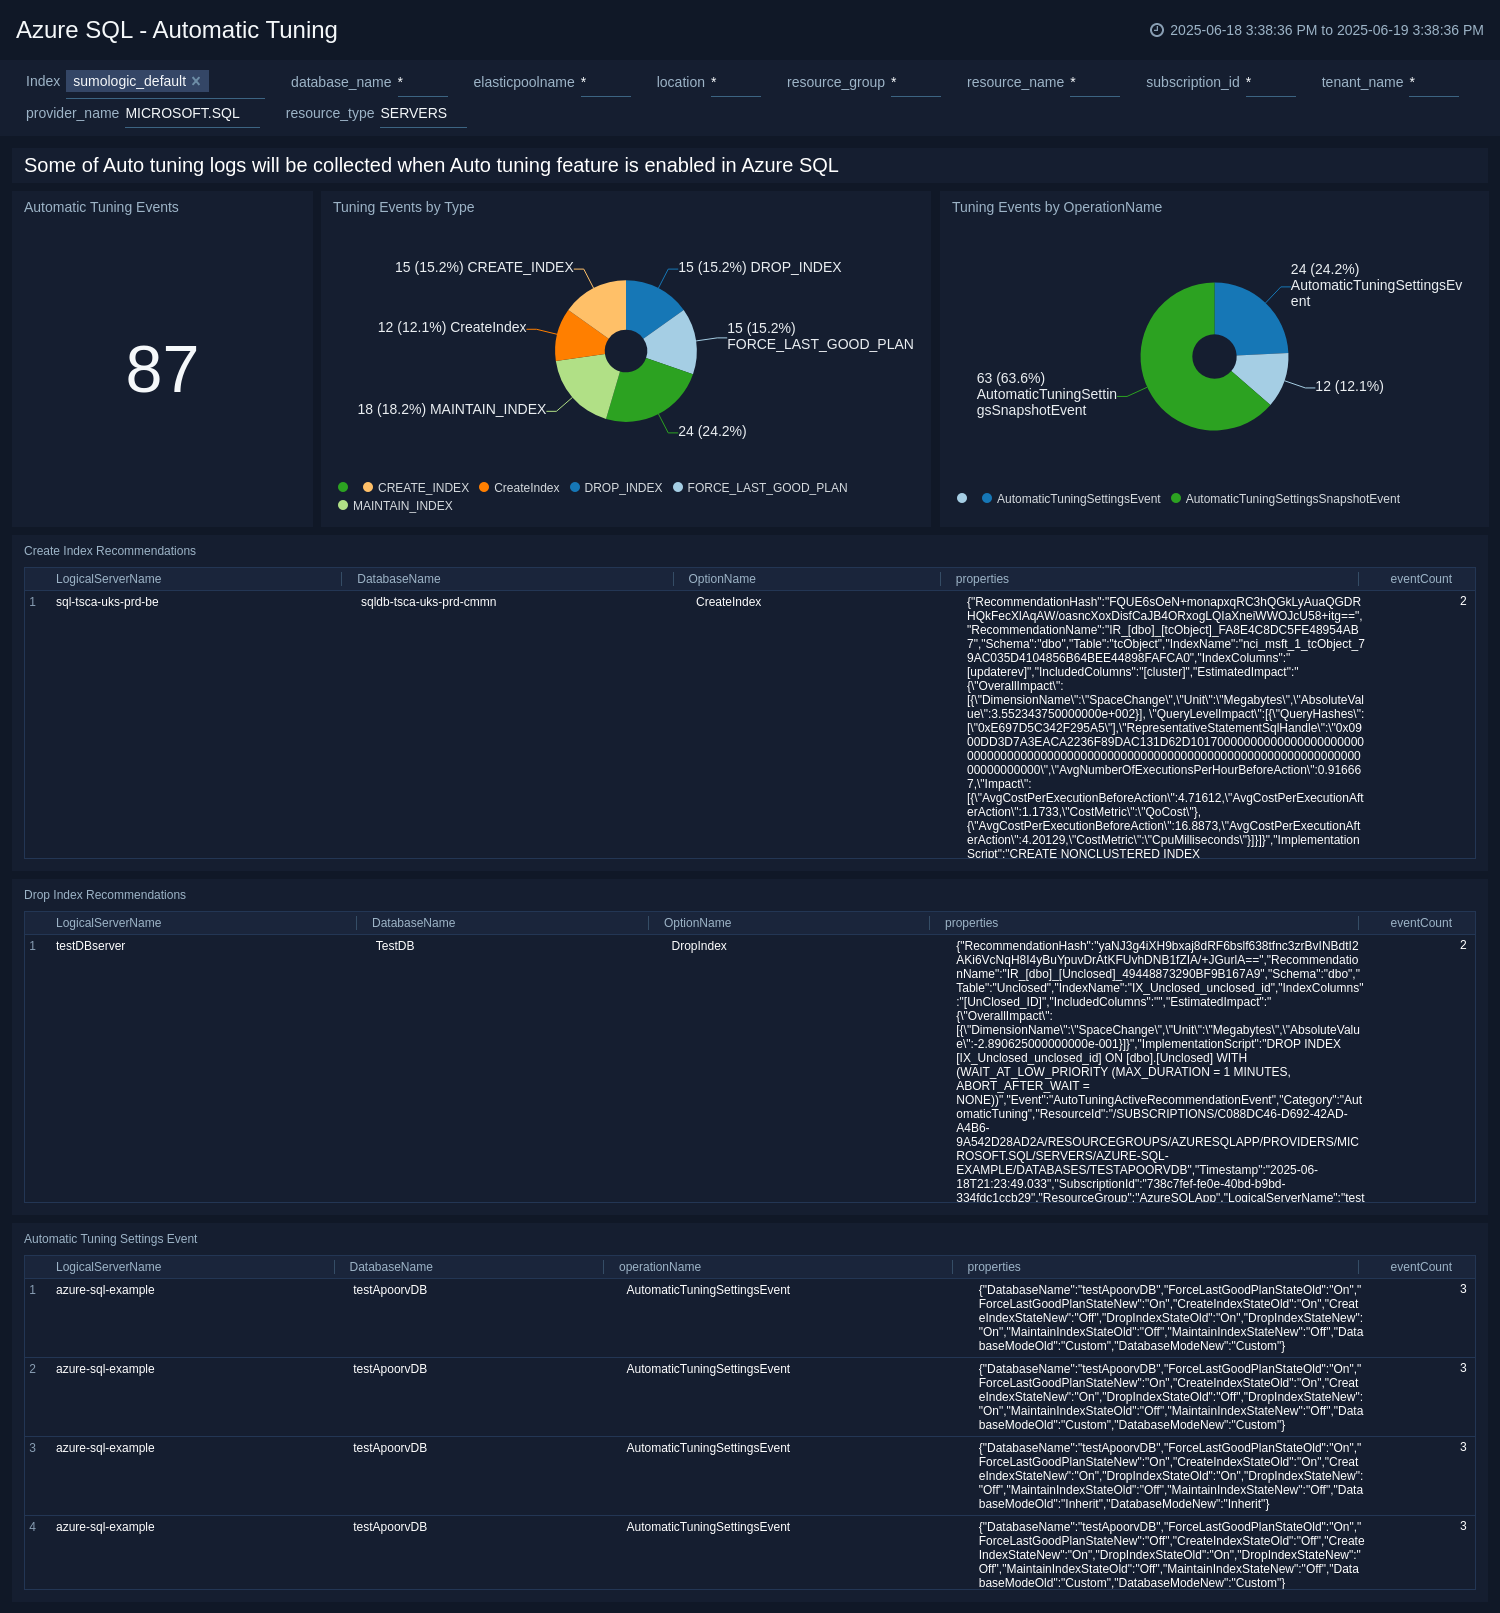
Automatic Tuning
The Azure SQL - Automatic Tuning dashboard provides information about automatic tuning recommendations for a database.
Use this dashboard to:
- View recent changes in tuning configuration.
- View create index recommendations.
- View drop index recommendations.
Upgrade/Downgrade the Azure SQL app (Optional)
To update the app, do the following:
Next-Gen App: To install or update the app, you must be an account administrator or a user with Manage Apps, Manage Monitors, Manage Fields, Manage Metric Rules, and Manage Collectors capabilities depending upon the different content types part of the app.
- Select App Catalog.
- In the Search Apps field, search for and then select your app.
Optionally, you can identify apps that can be upgraded in the Upgrade available section. - To upgrade the app, select Upgrade from the Manage dropdown.
- If the upgrade does not have any configuration or property changes, you will be redirected to the Preview & Done section.
- If the upgrade has any configuration or property changes, you will be redirected to the Setup Data page.
- In the Configure section of your respective app, complete the following fields.
- Field Name. If you already have collectors and sources set up, select the configured metadata field name (eg _sourcecategory) or specify other custom metadata (eg: _collector) along with its metadata Field Value.
- Click Next. You will be redirected to the Preview & Done section.
Post-update
Your upgraded app will be installed in the Installed Apps folder and dashboard panels will start to fill automatically.
See our Release Notes changelog for new updates in the app.
To revert the app to a previous version, do the following:
- Select App Catalog.
- In the Search Apps field, search for and then select your app.
- To version down the app, select Revert to < previous version of your app > from the Manage dropdown.
Uninstalling the Azure SQL app (Optional)
To uninstall the app, do the following:
- Select App Catalog.
- In the 🔎 Search Apps field, run a search for your desired app, then select it.
- Click Uninstall.
Create monitors for Azure SQL
From your App Catalog:
- From the Sumo Logic navigation, select App Catalog.
- In the Search Apps field, search for and then select your app.
- Make sure the app is installed.
- Navigate to What's Included tab and scroll down to the Monitors section.
- Click Create next to the pre-configured monitors. In the create monitors window, adjust the trigger conditions and notifications settings based on your requirements.
- Scroll down to Monitor Details.
- Under Location click on New Folder.
note
By default, monitor will be saved in the root folder. So to make the maintenance easier, create a new folder in the location of your choice.
- Enter Folder Name. Folder Description is optional.
tip
Using app version in the folder name will be helpful to determine the versioning for future updates.
- Click Create. Once the folder is created, click on Save.
Azure SQL alerts
These alerts are metrics-based and will work for Azure SQL.
| Alert Name | Description | Alert Condition | Recover Condition |
|---|---|---|---|
Azure SQL - Availability | This monitor triggers alerts when Availability drops below 100% in Azure SQL. | Count < 100 | Count >= 100 |
Azure SQL - Data space used percent | This monitor triggers alerts when High Data space used percent is detected in Azure SQL. | Count > 80 | Count =< 80 |
Azure SQL - Deadlocks | This monitor triggers alerts when deadlock is detected in Azure SQL. | Count > 1 | Count =< 1 |
Azure SQL - Failed Connections | This monitor triggers alerts when Failed Connections are detected in Azure SQL. | Count > 1 | Count =< 1 |
Azure SQL - High Cpu Usage | This monitor triggers alerts when high CPU usage is detected in Azure SQL. | Count >= 90 | Count < 90 |
Azure SQL - High SQL instance CPU Usage | This monitor triggers alerts when High Instance CPU usage is detected in Azure SQL. | Count >= 90 | Count < 90 |
Azure SQL - Data IO percentage | This monitor triggers alerts when High Data IO percentage is detected in Azure SQL. | Count > 90 | Count =< 90 |
Azure SQL - DTU Percentage | This monitor triggers alerts when High average DTU consumption percentage is detected in Azure SQL. | Count > 80 | Count =< 80 |
Azure SQL - Tempdb Percent Log Used | This monitor triggers alerts when High Tempdb Percent Log Usage is detected in Azure SQL. | Count > 60 | Count =< 60 |
Azure SQL - High Worker Usage | This monitor triggers alerts when High Worker Usage is detected in Azure SQL. | Count > 60 | Count =< 60 |