PCI Compliance for Windows JSON - OpenTelemetry
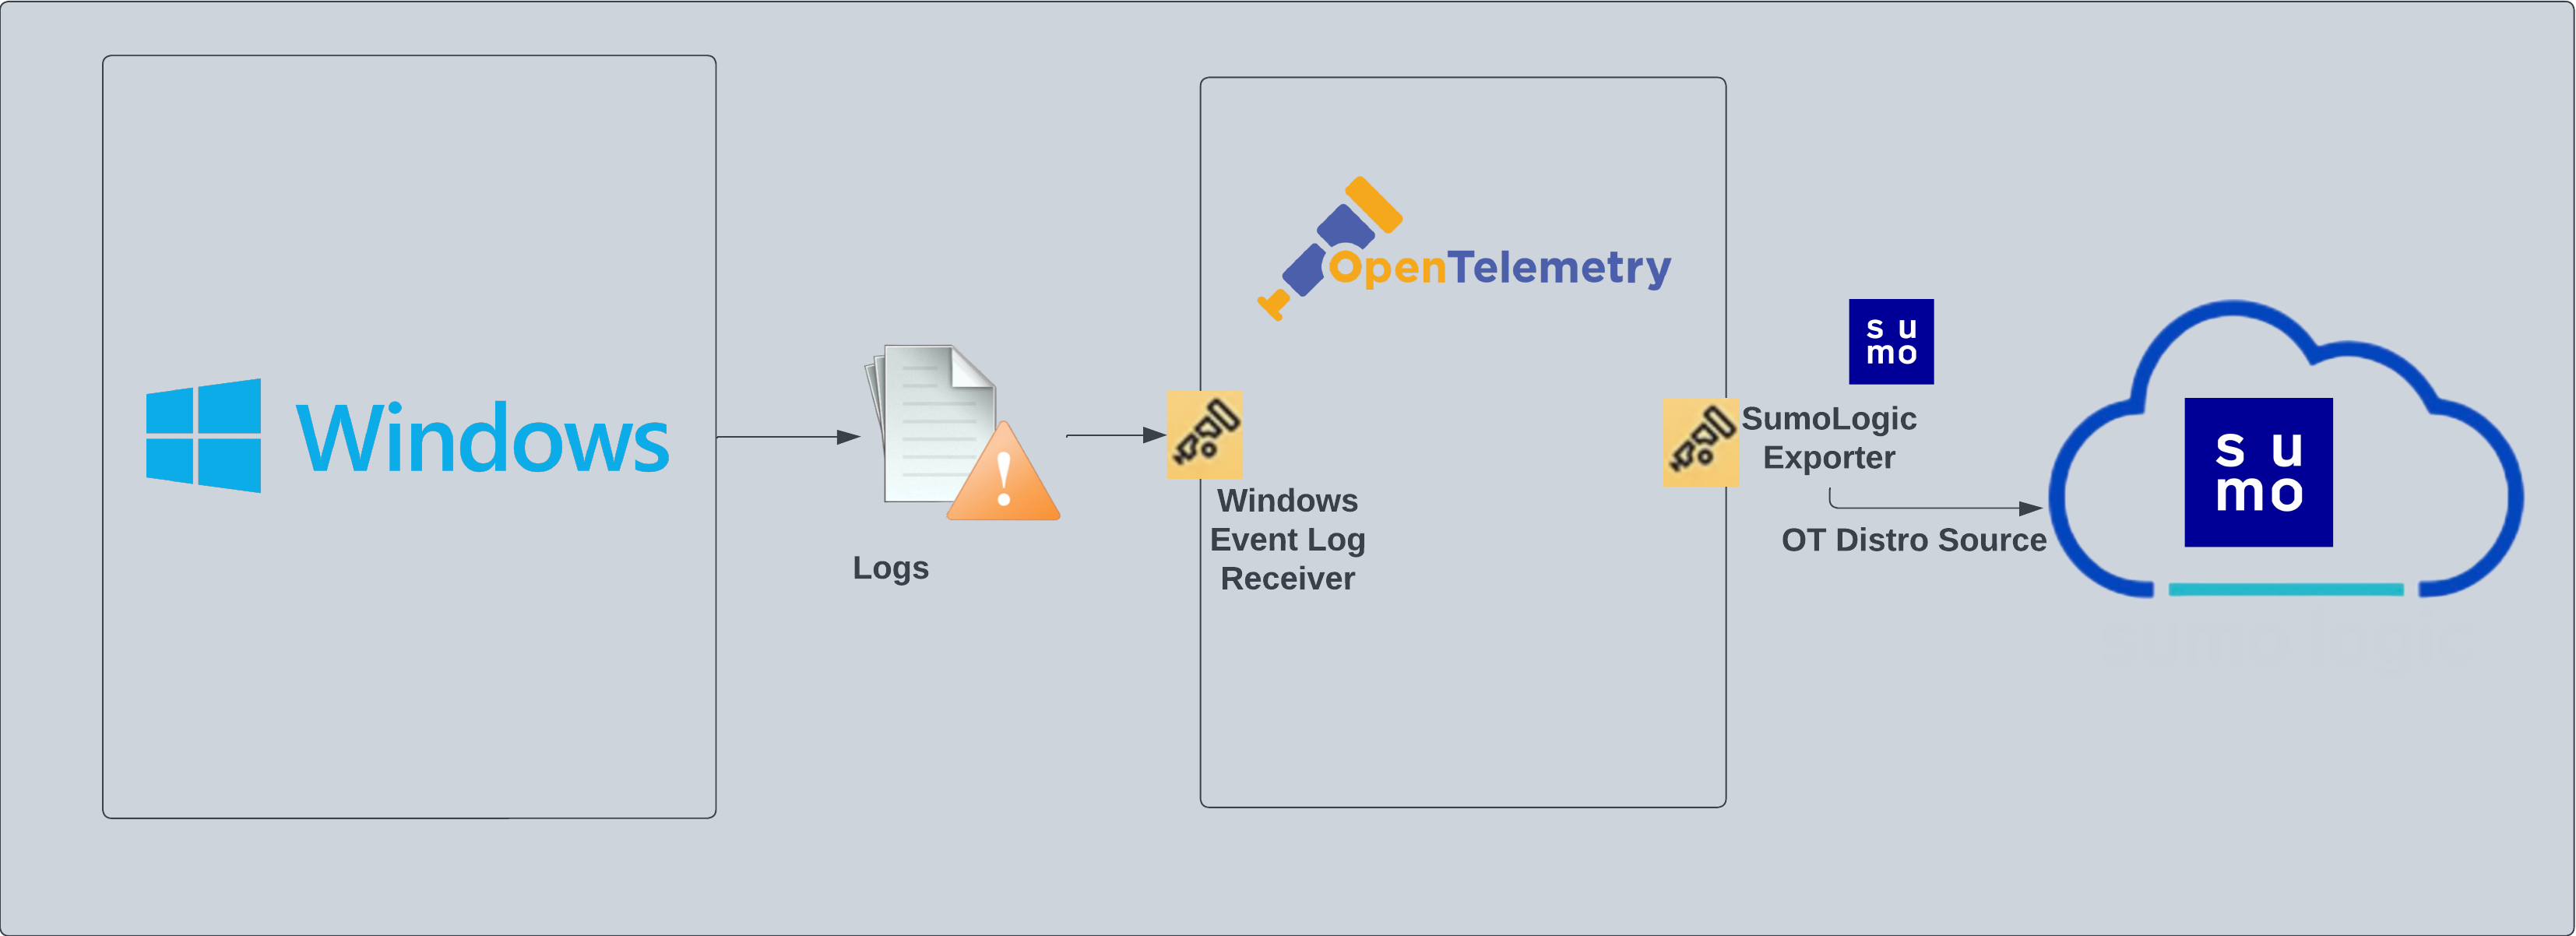
The PCI Compliance for Windows JSON - OpenTelemetry is a log app that sends Windows log data to Sumo Logic via OpenTelemetry windows event log receiver. The app's preconfigured dashboards help you to monitor system, account, and user activity to ensure that login activity and privileged users are within the expected ranges.
The PCI Compliance for Windows JSON app covers PCI requirements 02, 06, 08, and 10.
Fields created in Sumo Logic for PCI Compliance Windows JSON App
Following tags will be created as part of PCI Compliance Windows JSON app installation, if not already present.
sumo.datasource: has the fixed value of windows.host.group: user configured tag which signifies a group of hosts for the operating system.deployment.environment: user configured tag which identifies the environment where the windows system resides. For example: dev, prod or qa.
Log types
The Windows App assumes events are coming from Windows Event Log receiver in JSON format. It does not work with third party logs.
Standard Windows event channels include:
- Security
- System
Collection configuration and app installation
You can skip this section if you have already set up the logs collection through Windows, Windows - Cloud Security Monitoring and Analytics, or Active Directory app installation. Additional collection is not required as the logs used by this app are already ingested into Sumo Logic.
As part of data collection setup and app installation, you can select the App from App Catalog and click on Install App. Follow the steps below.
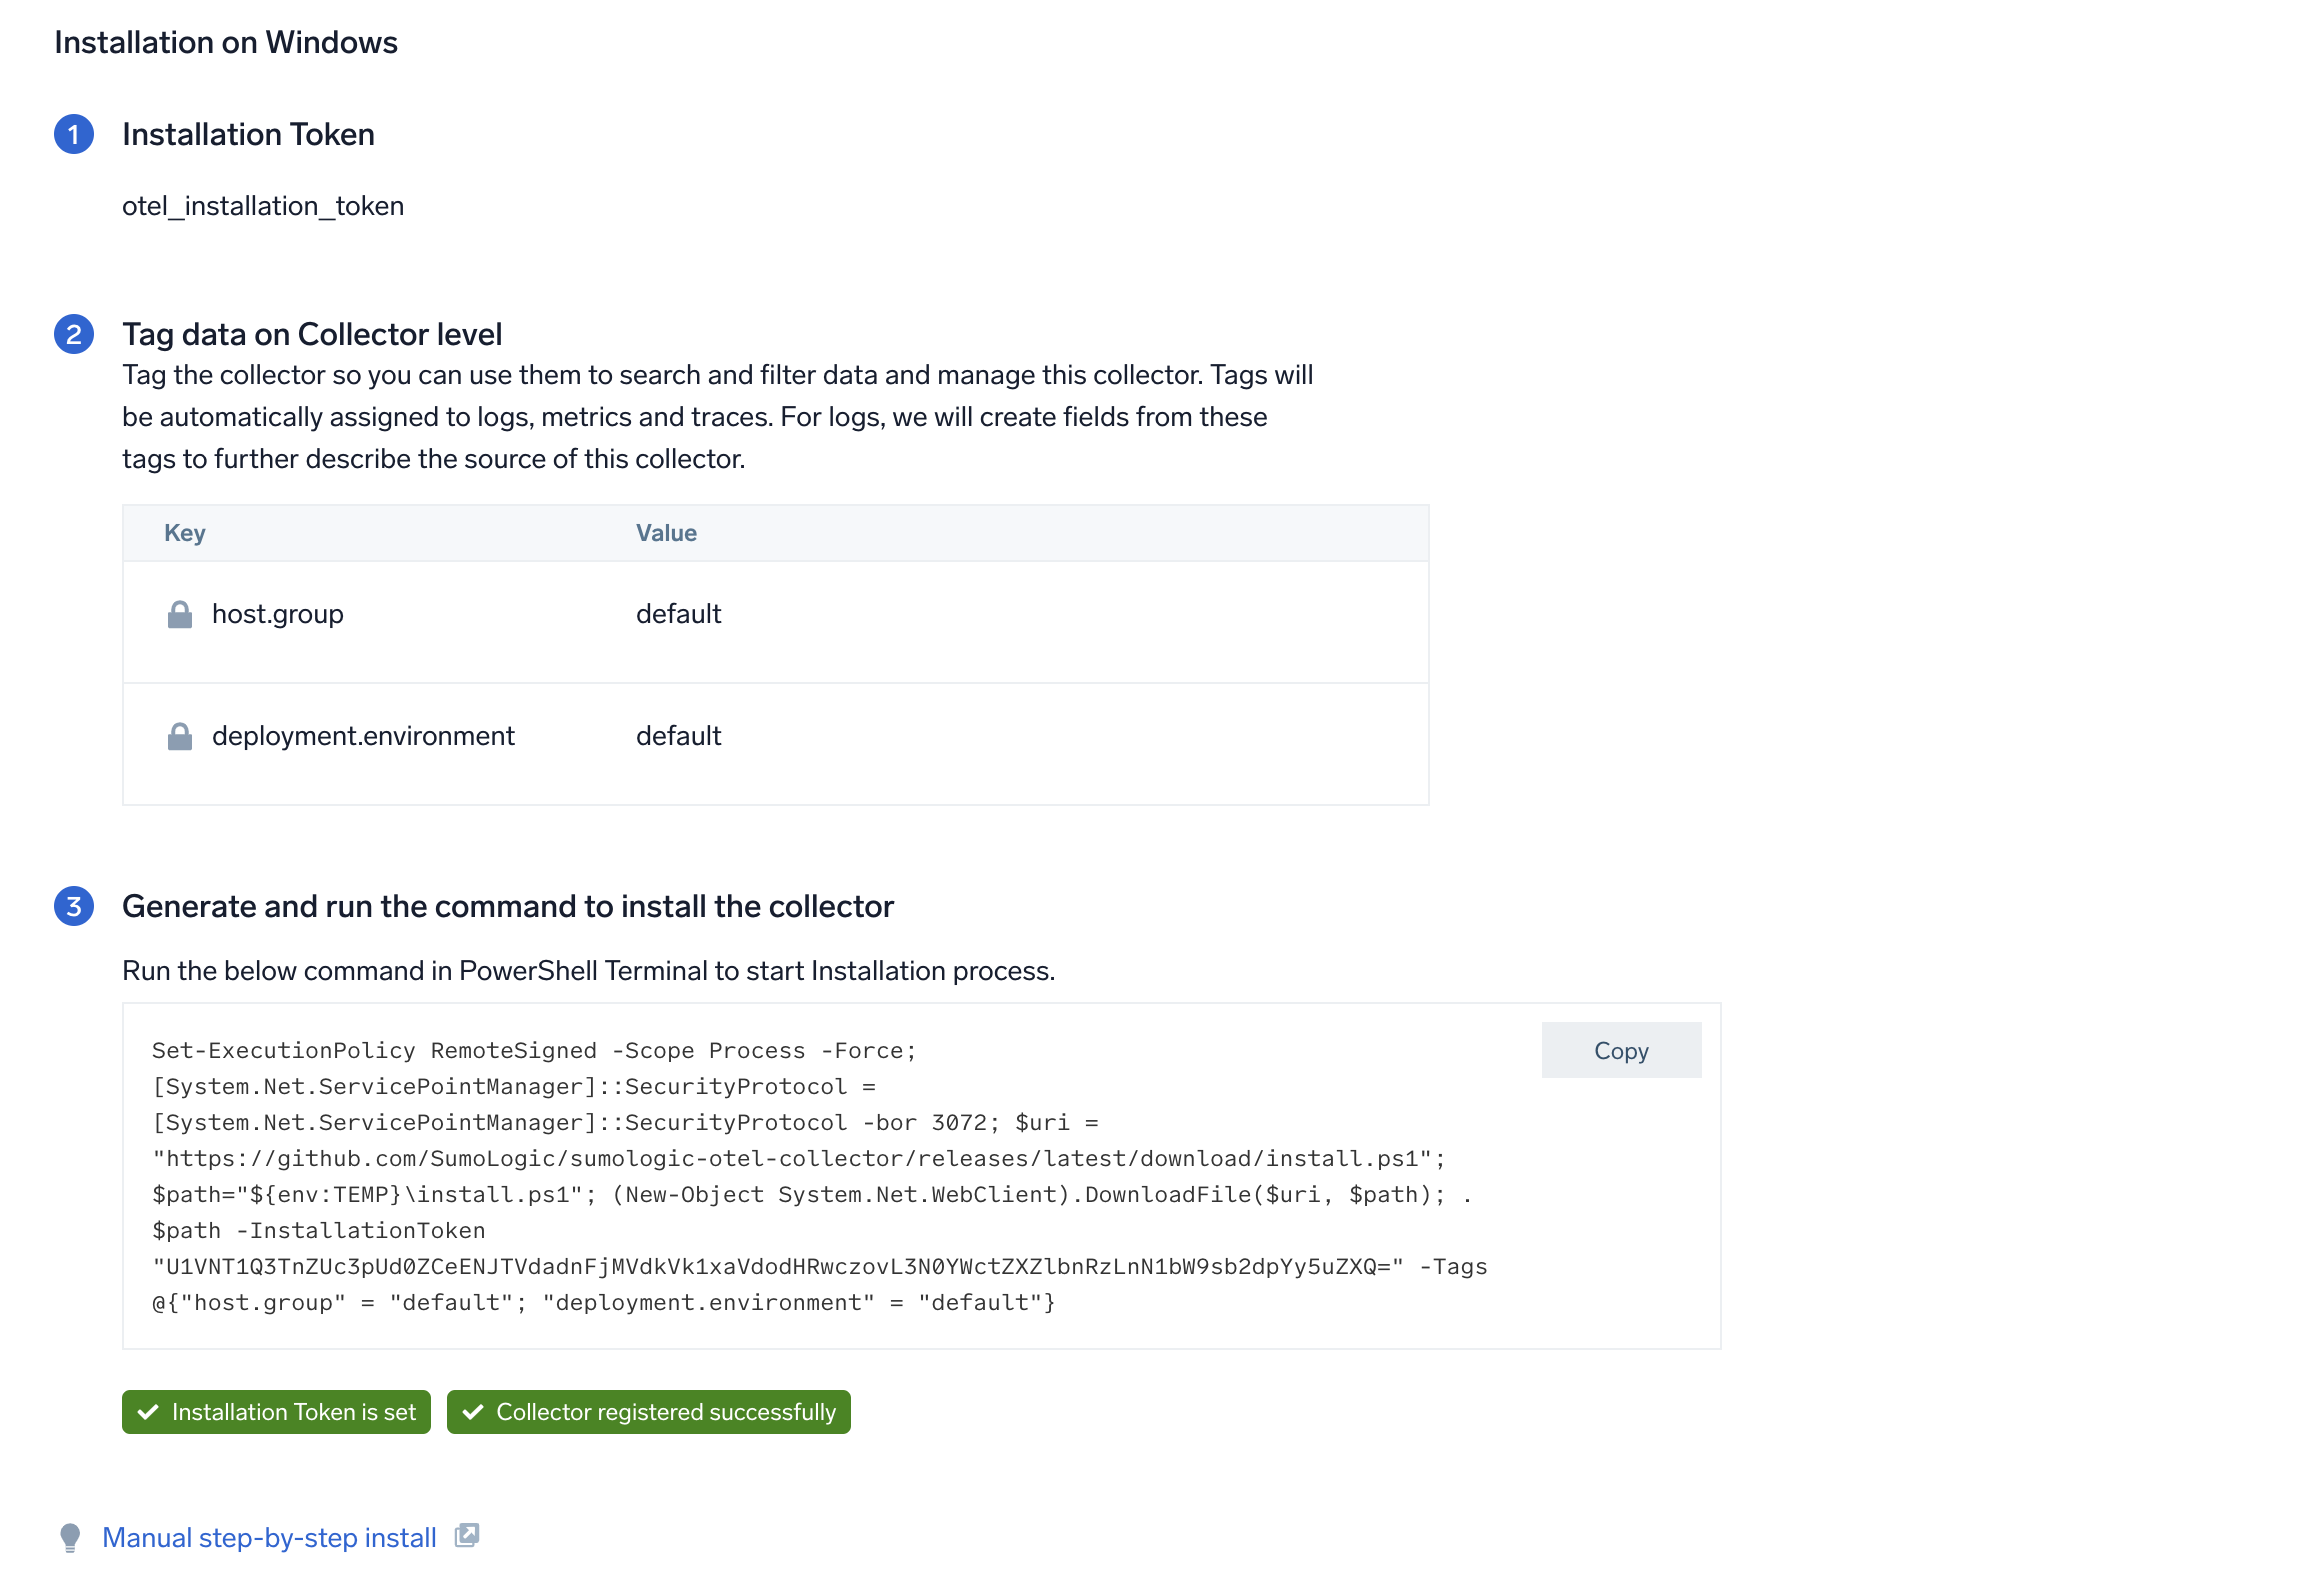
Step 1: Set up Collector
If you want to use an existing OpenTelemetry Collector, you can skip this step by selecting the Use an existing Collector option.
To create a new Collector:
- Select the Add a new Collector option.
- Select the platform where you want to install the Sumo Logic OpenTelemetry Collector.
This will generate a command that you can execute in the machine environment you need to monitor. Once executed, it will install the Sumo Logic OpenTelemetry Collector.
Step 2: Configure integration
In this step, you will configure the yaml file required for Windows event logs collection.
Any custom fields can be tagged along with the data in this step.
Once the details are filled in, click on the Download YAML File button to get the yaml file.
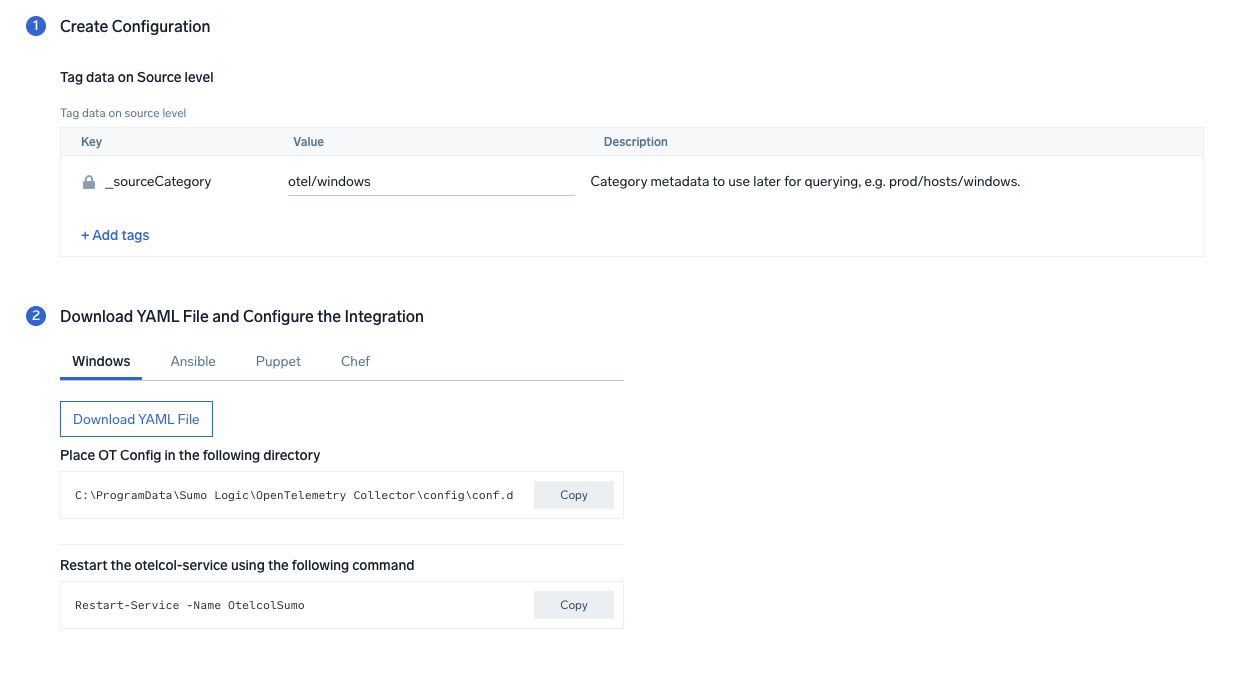
Step 3: Send logs to Sumo Logic
Once you have downloaded the YAML file as described in the previous step, follow the below steps based on your platform.
- Windows
- Chef
- Ansible
- Puppet
- Copy the yaml file to
C:\ProgramData\Sumo Logic\OpenTelemetry Collector\config\conf.dfolder in the machine which needs to be monitored. - Restart the collector using:
Restart-Service -Name OtelcolSumo
- Copy the yaml file into your Chef cookbook files directory
files/<downloaded_yaml_file>. - Use a Chef file resource in a recipe to manage it.
cookbook_file '/etc/otelcol-sumo/conf.d/<downloaded_yaml_file>' do mode 0644 notifies :restart, 'service[otelcol-sumo]', :delayed end - Add the recipe to your collector setup to start collecting the data. Every team typically has their established way of applying the Chef recipe. The resulting Chef recipe should look something like:
cookbook_file '/etc/otelcol-sumo/conf.d/<downloaded_yaml_file>' do
mode 0644
notifies :restart, 'service[otelcol-sumo]', :delayed
end
- Place the file into your Ansible playbook files directory.
- Run the Ansible playbook.
ansible-playbook -i inventory install_sumologic_otel_collector.yaml
-e '{"installation_token": "<YOUR_TOKEN>", "collector_tags": {<YOUR_TAGS>}, "src_config_path": "files/conf.d"}'
- Place the file into your Puppet module files directory
modules/install_otel_collector/files/<downloaded_yaml>. - Use a Puppet file resource to manage it.
file { '/etc/otelcol-sumo/conf.d/<downloaded_yaml_file>':
    ensure => present,
    source => 'puppet:///modules/install_otel_collector/<downloaded_yaml_file>',
    mode => '0644',
    notify => Service[otelcol-sumo],
} - Apply the Puppet manifest. Every team typically has their established way of applying the Puppet manifest. The resulting Puppet manifest should look something like:
node 'default' {
    class { 'install_otel_collector'
      installation_token => '<YOUR_TOKEN>',
      collector_tags => { <YOUR_TAGS> },
    }

    service { 'otelcol-sumo':
      provider => 'systemd',
      ensure => running,
      enable => true,
      require => Class['install_otel_collector'],
    }

    file { '/etc/otelcol-sumo/conf.d/<downloaded_yaml_file>':
      ensure => present,
      source => 'puppet:///modules/install_otel_collector/<downloaded_yaml_file>',
      mode => '0644',
      notify => Service[otelcol-sumo],
    }
  }
After successfully executing the above command, Sumo Logic will start receiving data from your host machine.
Click Next. This will install the app (dashboards and monitors) to your Sumo Logic Org.
Dashboard panels will start to fill automatically. It's important to note that each panel fills with data matching the time range query and received since the panel was created. Results won't immediately be available, but within 20 minutes, you'll see full graphs and maps.
Sample queries
This sample log query is from the Windows - PCI Req 02, 08, 10 - Account, User, System Monitoring dashboard > User Account Created panel.
sumo.datasource=windows deployment.environment={{deployment.environment}} host.group={{host.group}} "\"channel\":\"Security\"" 4720
| json "event_id.id", "computer", "message", "event_data.SubjectUserName",  "event_data.SubjectDomainName", "event_data.TargetUserName", "event_data.TargetDomainName" as event_id, host, msg_summary, src_user, src_domain, dest_user, dest_domain nodrop
| if(isBlank(src_user), "Unknown", src_user) as src_user
| if(isBlank(src_domain), "Unknown", src_domain) as src_domain
| if(isBlank(dest_user), "Unknown", dest_user) as dest_user
| if(isBlank(dest_domain), "Unknown", dest_domain) as dest_domain
| where event_id = "4720" and host matches "{{host.name}}" and _collector matches "{{collector}}" and _sourceHost matches "{{sourcehost}}" and src_user matches "{{src_user}}" and src_domain matches "{{src_domain}}" and dest_user matches "{{dest_user}}" and dest_domain matches "{{dest_domain}}"
| fields host, dest_user, dest_domain, src_user, src_domain, event_id, msg_summary
| timeslice 1s
| count as event_count by _timeslice, host, dest_user, dest_domain, src_user, src_domain, event_id, msg_summary
| sort by _timeslice
Sample log messages
{
  "record_id":161812,
  "channel":"Security",
  "event_data":{
    "WorkstationName":"-",
    "TargetDomainName":"",
    "SubjectUserSid":"S-1-0-0",
    "LogonProcessName":"NtLmSsp ",
    "TargetUserName":"ADMINISTRATOR",
    "TargetUserSid":"S-1-0-0",
    "IpAddress":"3.137.149.192",
    "ProcessId":"0x0",
    "KeyLength":"0",
    "ProcessName":"-",
    "SubjectUserName":"-",
    "LogonType":"3",
    "TransmittedServices":"-",
    "FailureReason":"%%2313",
    "SubjectLogonId":"0x0",
    "IpPort":"0",
    "AuthenticationPackageName":"NTLM",
    "Status":"0xc000006d",
    "LmPackageName":"-",
    "SubStatus":"0xc000006a",
    "SubjectDomainName":"-"
  },
  "task":"Logon",
  "provider":{
    "name":"Microsoft-Windows-Security-Auditing",
    "guid":"{54849625-5478-4994-a5ba-3e3b0328c30d}",
    "event_source":""
  },
  "system_time":"2023-07-11T14:14:51.1731050Z",
  "computer":"EC2AMAZ-V57A85N",
  "opcode":"Info",
  "keywords":[
    "Audit Failure"
  ],
  "details":{
    "Account For Which Logon Failed":{
      "Security ID":"S-1-0-0",
      "Account Name":"ADMINISTRATOR",
      "Account Domain":"-"
    },
    "Network Information":{
      "Workstation Name":"-",
      "Source Network Address":"3.137.149.192",
      "Source Port":"0"
    },
    "Failure Information":{
      "Failure Reason":"Unknown user name or bad password.",
      "Status":"0xC000006D",
      "Sub Status":"0xC000006A"
    },
    "Detailed Authentication Information":{
      "Transited Services":"-",
      "Key Length":"0",
      "Logon Process":"NtLmSsp",
      "Authentication Package":"NTLM",
      "Package Name (NTLM only)":"-"
    },
    "Subject":{
      "Security ID":"S-1-0-0",
      "Account Name":"-",
      "Account Domain":"-",
      "Logon ID":"0x0"
    },
    "Process Information":{
      "Caller Process ID":"0x0",
      "Caller Process Name":"-"
    },
    "Logon Type":"3",
    "Additional Context":[
      "This event is generated when a logon request fails. It is generated on the computer where access was attempted.",
      "The Subject fields indicate the account on the local system which requested the logon. This is most commonly a service such as the Server service, or a local process such as Winlogon.exe or Services.exe.",
      "The Logon Type field indicates the kind of logon that was requested. The most common types are 2 (interactive) and 3 (network).",
      "The Process Information fields indicate which account and process on the system requested the logon.",
      "The Network Information fields indicate where a remote logon request originated. Workstation name is not always available and may be left blank in some cases.",
      "The authentication information fields provide detailed information about this specific logon request.",
      "- Transited services indicate which intermediate services have participated in this logon request.",
      "- Package name indicates which sub-protocol was used among the NTLM protocols.",
      "- Key length indicates the length of the generated session key. This will be 0 if no session key was requested."
    ]
  },
  "message":"An account failed to log on.",
  "event_id":{
    "qualifiers":0,
    "id":4625
  },
  "level":"Information"
}
Viewing Windows Event Log-Based Dashboards
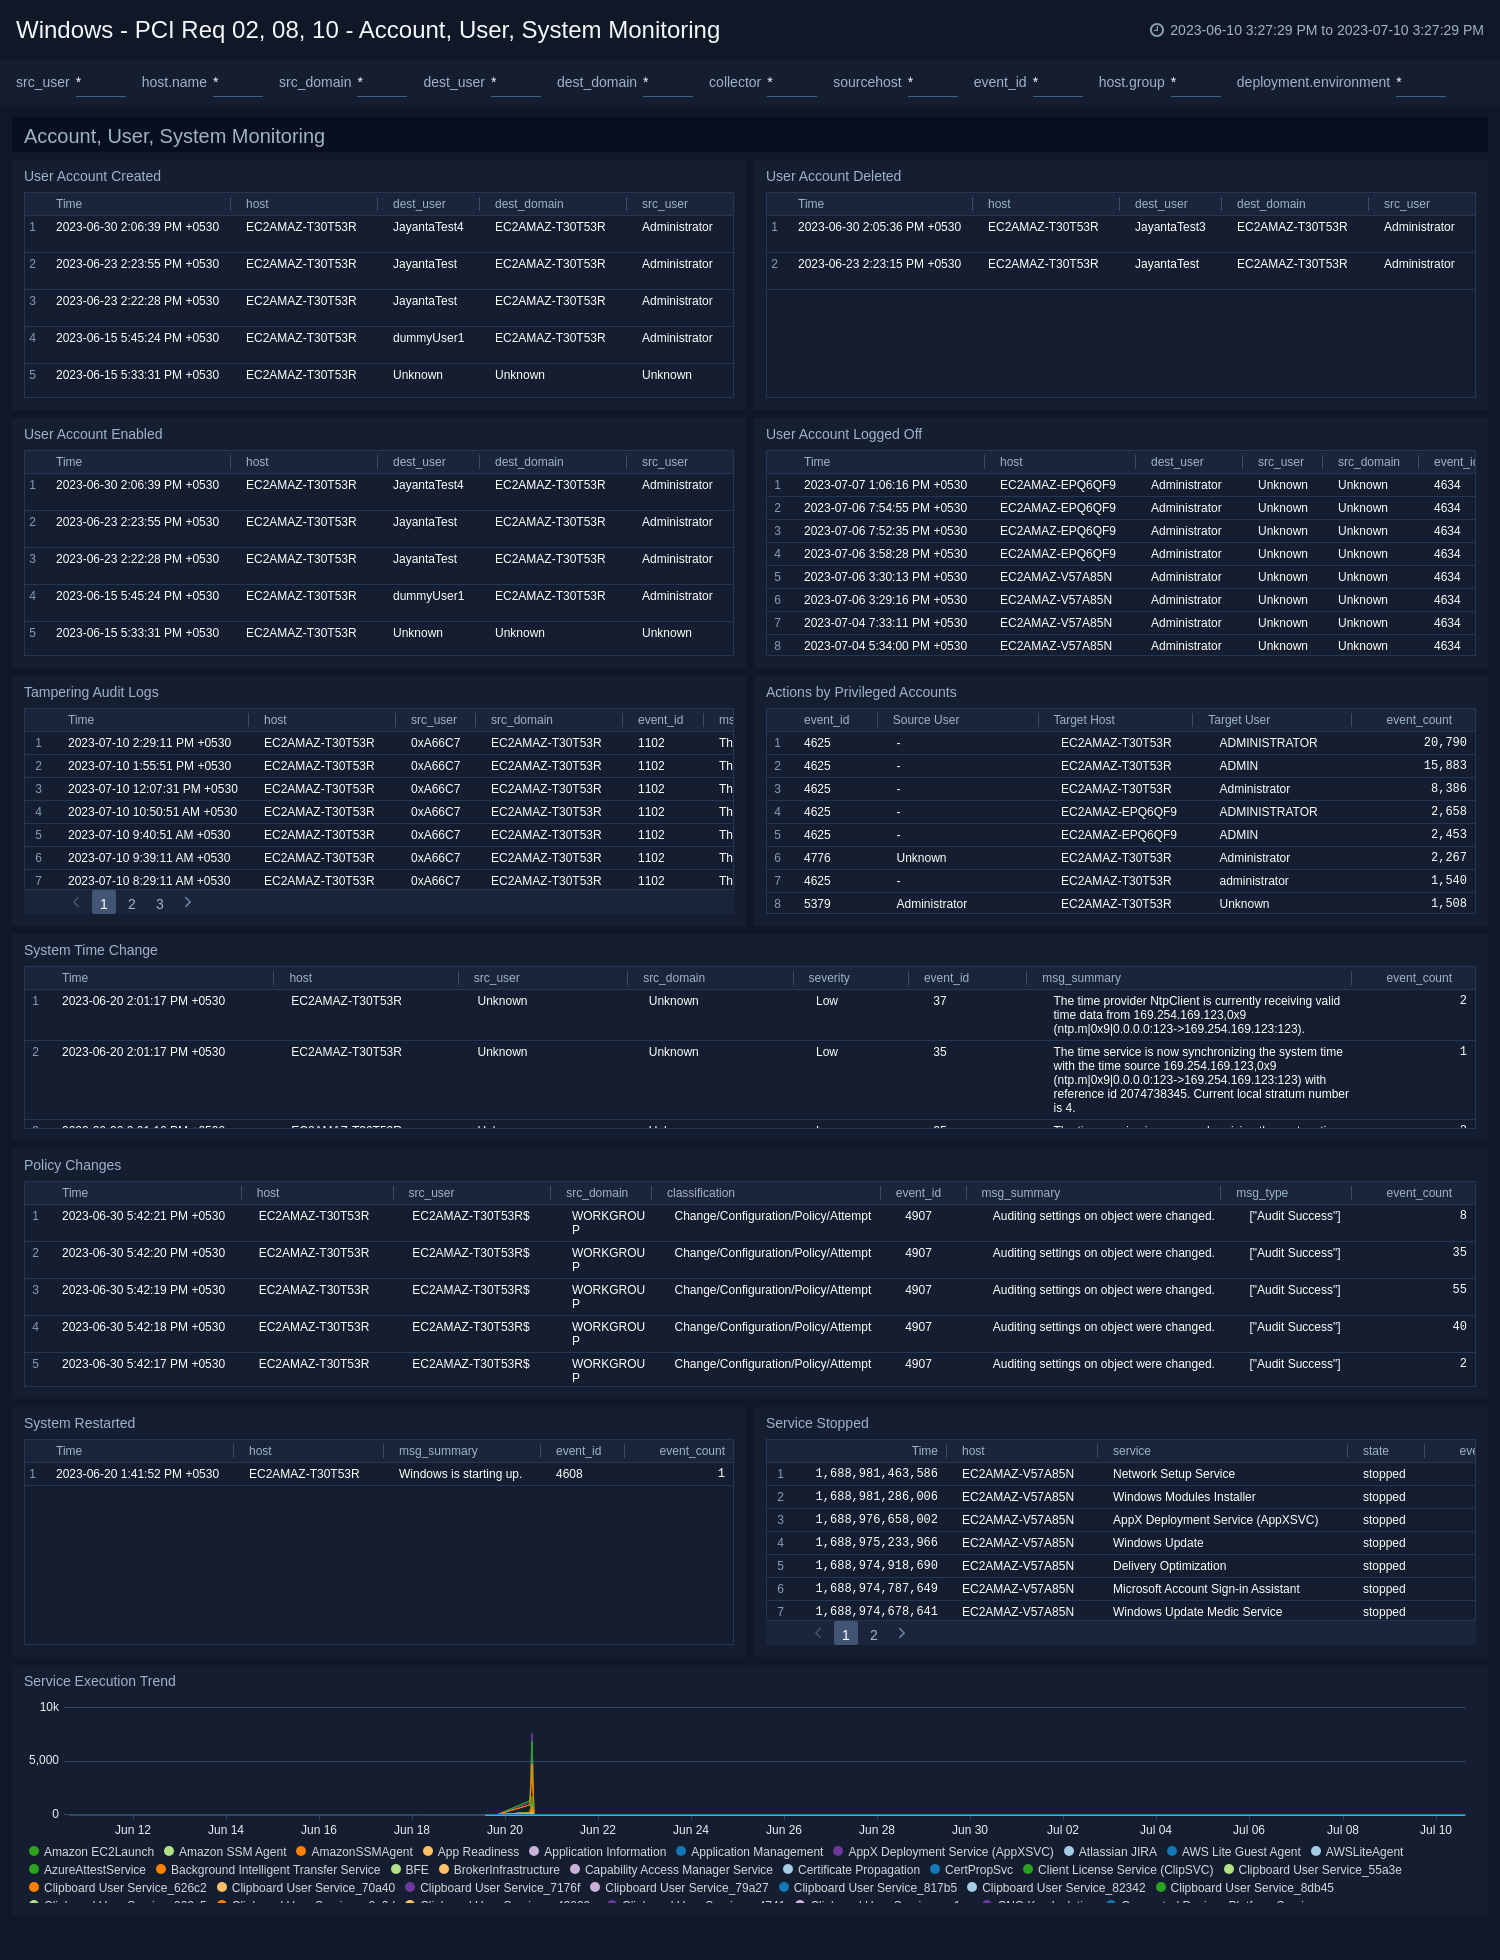
Windows - PCI Req 02, 08, 10 - Account, User, System Monitoring
Track your user accounts and recent system changes.
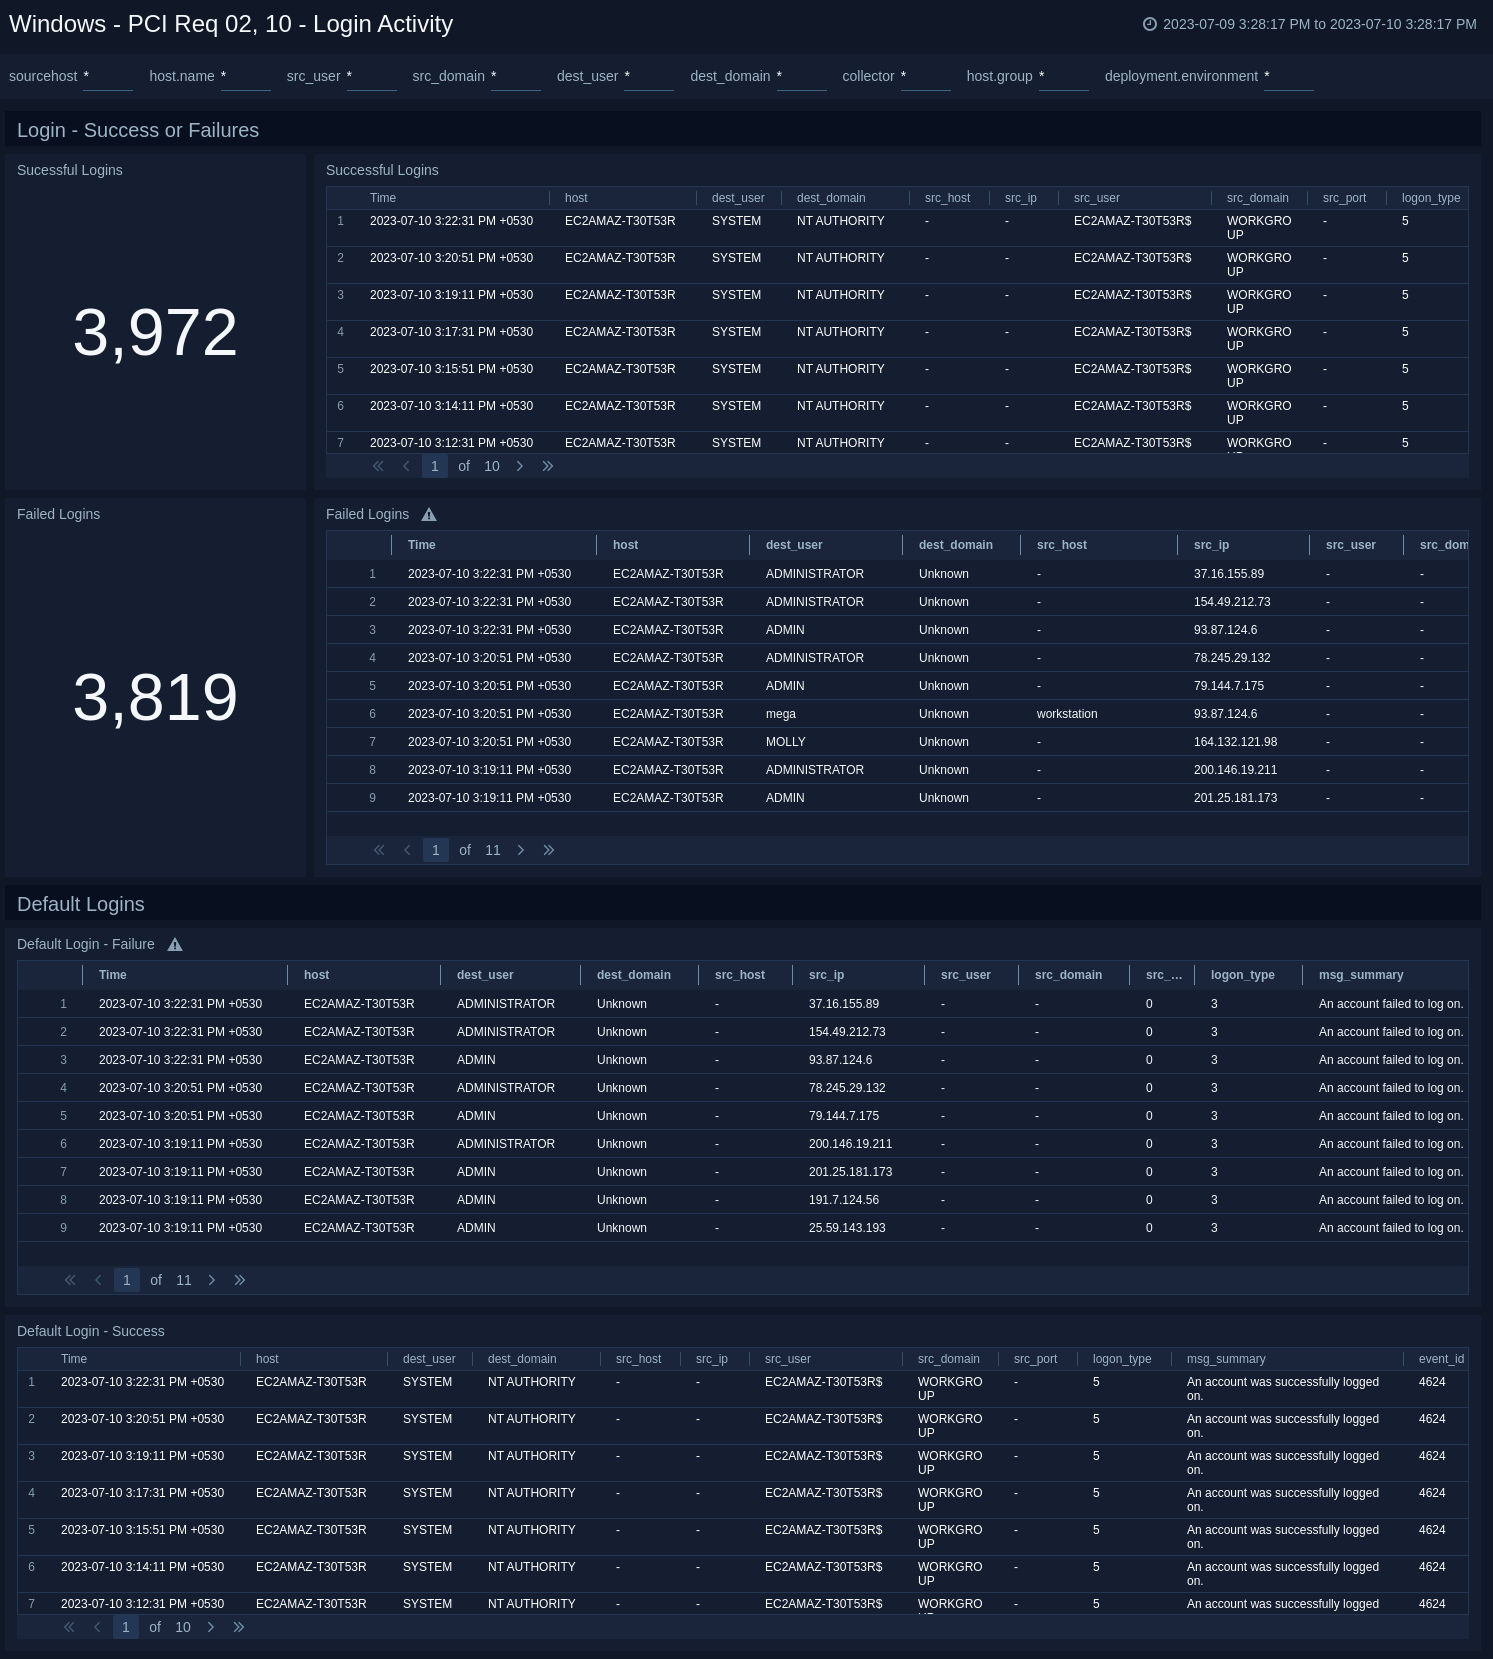
Windows - PCI Req 02, 10 - Login Activity
Track login successes and failures.
Windows - PCI Req 08 - Other User Activity
Track user activities such as password changes, password resets, excessive failed access attempts, unlocked accounts, and changed accounts.
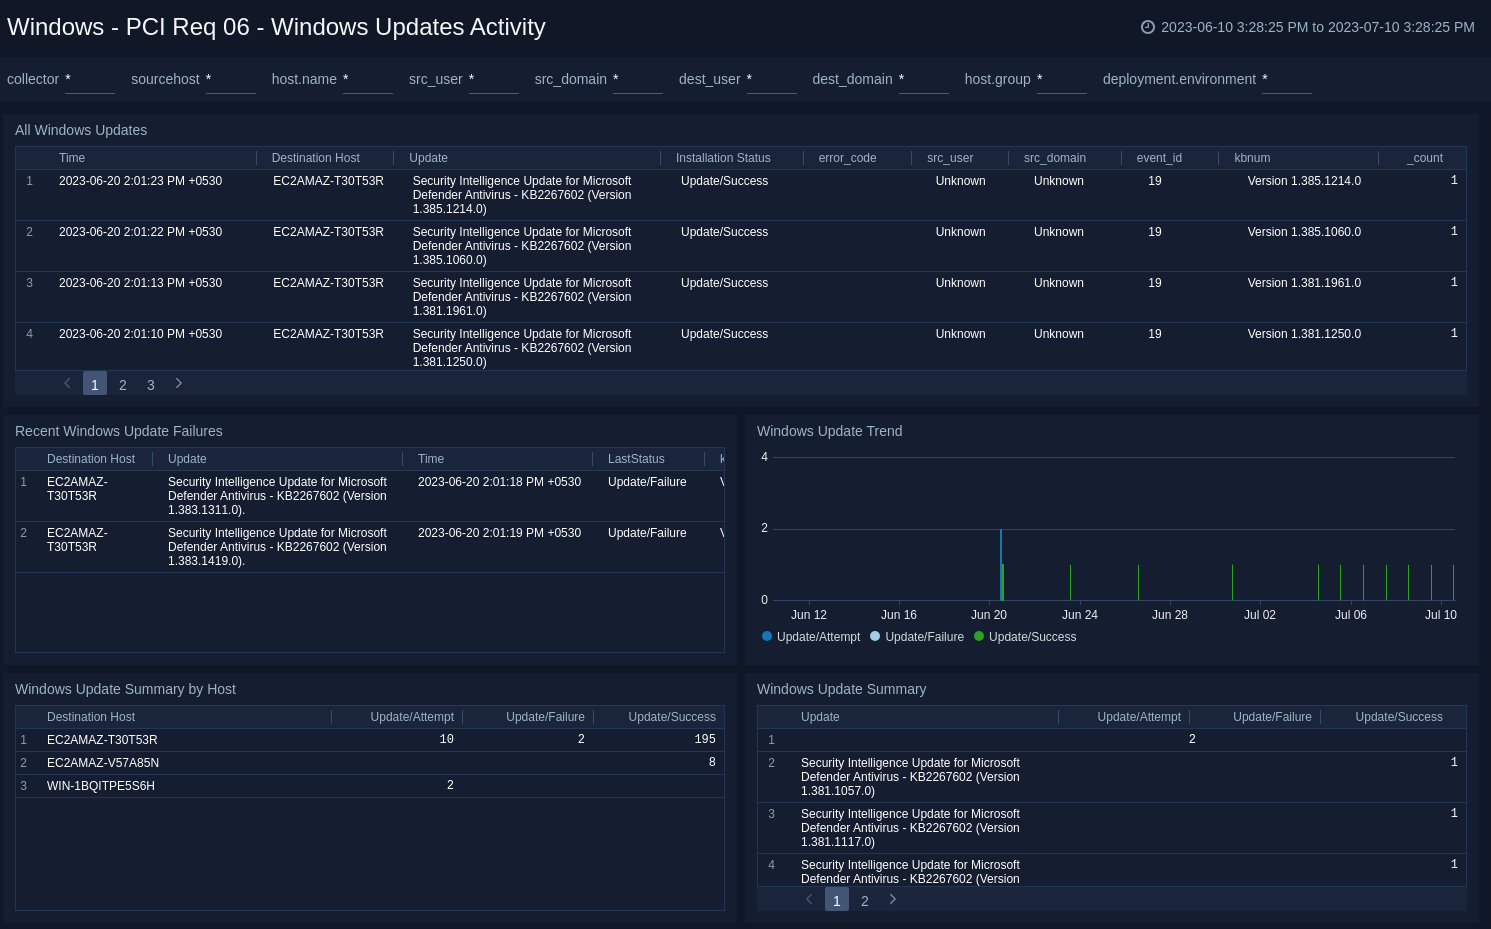
Windows - PCI Req 06 - Windows Updates Activity
Track your Windows Update activities.
Create monitors for PCI Compliance For Windows JSON app
From your App Catalog:
- From the Sumo Logic navigation, select App Catalog.
- In the Search Apps field, search for and then select your app.
- Make sure the app is installed.
- Navigate to What's Included tab and scroll down to the Monitors section.
- Click Create next to the pre-configured monitors. In the create monitors window, adjust the trigger conditions and notifications settings based on your requirements.
- Scroll down to Monitor Details.
- Under Location click on New Folder.
note
By default, monitor will be saved in the root folder. So to make the maintenance easier, create a new folder in the location of your choice.
- Enter Folder Name. Folder Description is optional.
tip
Using app version in the folder name will be helpful to determine the versioning for future updates.
- Click Create. Once the folder is created, click on Save.
PCI Compliance For Windows JSON alerts
| Name | Description | Alert Condition | Recover Condition |
|---|---|---|---|
Windows PCI - Critical Policy Changes | This alert is triggered when modifications to security policies or audit policies are detected, indicating potential changes to the system's security posture. It supports PCI DSS Requirements 10.2.2 (track changes to system-level objects) and 10.2.5.b (track use of identification and authentication mechanisms). | Count >= 1 | Count < 1 |
Windows PCI - Excessive Failed Login Attempts | This alert is triggered when there are multiple authentication failures detected across Windows environments. These are monitored across different authentication mechanisms like local Windows authentication, Kerberos, and network logons. It correlates failure patterns with specific error codes to identify potential security threats such as password guessing, account enumeration, or attempts to access disabled accounts. This helps security teams differentiate between benign issues and malicious activities. | Count >= 5 | Count < 5 |
Windows PCI - Failed Windows Updates | This alert is triggered when Windows update failures are detected, which could leave systems vulnerable to known exploits. It aligns with PCI DSS Requirement 6.2.0 for installing critical security patches within one month of release. | Count > = 3 | Count < 3 |
Windows PCI - Security Audit Log Tampering | This alert is triggered when attempt is detected to clear or tamper with Windows security audit logs, indicating potential attempts to hide malicious activities. It supports PCI DSS Requirements 10.2.0 (implement automated audit trails) and 10.3.0 (record audit trail entries). | Count > = 1 | Count < 1 |
Windows PCI - User Account State Change | This alert is triggered when critical user account state changes are detected, including account creation, deletion, enablement, and disablement. This supports PCI DSS Requirement 8.1.3 for immediately revoking access for terminated users. | Count > = 1 | Count < 1 |