Atlassian
The Sumo Logic app for Atlassian provides comprehensive visibility into your organization's Atlassian environment, including Confluence, Jira, and Bitbucket. This app helps security and IT teams monitor critical events such as user activities, policy changes, group and API token creations, and product access, all of which are essential for security audits and compliance tracking. With pre-configured dashboards, you can quickly detect suspicious behavior like unauthorized access, configuration changes, and potential insider threats. Geolocation features helps you to identify the physical origin of actions, which is valuable for investigating abnormal activity from unusual regions. The app also tracks key security events such as failed logins, API accesses, and policy updates, allowing security teams to ensure that Atlassian services are being used securely and efficiently. This app is essential for maintaining governance and security within the Atlassian suite.
This app includes built-in monitors. For details on creating custom monitors, refer to Create monitors for Atlassian app.
Log types
This app uses Sumo Logic’s Atlassian Source to collect Event Logs from Atlassian.
Sample log message
Event Log
{
    "type": "events",
    "id": "606a97f7-f2d9-4007-91a7-8adyc1s328bf",
    "attributes": {
      "time": "2024-10-03T10:44:26.457Z",
      "action": "jira_issue_viewed",
      "actor": {
        "id": "557058:bd955be1-e2d3-41e4-a3be-70bf24d0444e",
        "name": "xyzabc",
        "email": "xyzabc@gmail.com",
        "links": {
          "alt": "https://admin.atlassian.com/s/cee46caf-81e6-41b6-b8a0-a767d9/users/557058:bd955be1-e2d3-41e4-a3be-70bf24d0444e",
          "self": "https://api.atlassian.com/users/557058:bd955be1-e2d3-41e470bf24d0444e/manage/profile"
        }
      },
      "context": [],
      "container": [
        {
          "id": "cee46caf-81e6-41b6-b8723f8067d9",
          "type": "sites",
          "attributes": {
            "siteName": "gmail",
            "product": "software",
            "issueId": "284408",
            "issueKeyOrId": "WEB-21003",
            "siteHostName": "https://gmail.atlassian.net"
          },
          "links": {
            "alt": "https://gmail.atlassian.net/browse/WEB-21003"
          }
        }
      ],
      "location": {
        "ip": "91.225.122.155",
        "countryName": "Ukraine",
        "regionName": "Kyiv City",
        "city": "Kyiv"
      }
    },
    "links": {
      "self": "https://api.atlassian.com/admin/v1/orgs/eced9542-6842-bcb1-3662afe713d7/events/606a97f7-f2d907-91a7-8ad4c1f328bf"
    },
    "message": {
      "content": "Viewed Jira issue WEB-21003",
      "format": "simple"
    }
}
Sample queries
_sourceCategory="Labs/Atlassian"
| json "attributes.actor.name", "attributes.action", "attributes.location.countryName", "id", "message.content", "attributes.location.city", "attributes.location.regionName", "attributes.location.ip", "attributes.actor.email", "attributes.time", "type", "attributes.context[*].attributes" as actor, action, country, id, message, city, region, ip, actor_email, time, type, action_performed_against nodrop

// global filters
| where actor matches "{{actor}}"
| where action matches "{{action}}"

| count by id, action
| count as frequency by action
| sort by frequency
Collection configuration and app installation
Depending on the set up collection method, you can configure and install the app in three ways:
- Create a new collector and install the app. Create a new Sumo Logic Cloud-to-Cloud (C2C) source under a new Sumo Logic Collector and later install the app; Or
- Use an existing collector and install the app. Create a new Sumo Logic Cloud-to-Cloud (C2C) source under an existing Sumo Logic Collector and later install the app; Or
- Use existing source and install the app. Use your existing configured Sumo Logic Cloud-to-Cloud (C2C) source and install the app.
Use the Cloud-to-Cloud Integration for Atlassian to create the source and use the same source category while installing the app. By following these steps, you can ensure that your Atlassian app is properly integrated and configured to collect and analyze your Atlassian data.
Create a new collector and install the app
To set up collection and install the app, do the following:
Next-Gen App: To install or update the app, you must be an account administrator or a user with Manage Apps, Manage Monitors, Manage Fields, Manage Metric Rules, and Manage Collectors capabilities depending upon the different content types part of the app.
- Select App Catalog.
- In the 🔎 Search Apps field, run a search for your desired app, then select it.
- Click Install App.
note
Sometimes this button says Add Integration.
- In the Set Up Collection section of your respective app, select Create a new Collector.
- Collector Name. Enter a Name to display the Source in the Sumo Logic web application. The description is optional.
- Timezone. Set the default time zone when it is not extracted from the log timestamp. Time zone settings on Sources override a Collector time zone setting.
- (Optional) Metadata. Click the +Add Metadata link to add a custom log Metadata Fields. Define the fields you want to associate, each metadata field needs a name (key) and value.
 A green circle with a checkmark is shown when the field exists and is enabled in the Fields table schema.
 An orange triangle with an exclamation point is shown when the field doesn't exist, or is disabled in the Fields table schema. In this case, you'll see an option to automatically add or enable the nonexistent fields to the Fields table schema. If a field is sent to Sumo Logic but isn’t present or enabled in the schema, it’s ignored and marked as Dropped.
- Click Next.
- Configure the source as specified in the
Infobox above, ensuring all required fields are included. - In the Configure section of your respective app, complete the following fields.
- Field Name. If you already have collectors and sources set up, select the configured metadata field name (eg _sourcecategory) or specify other custom metadata (eg: _collector) along with its metadata Field Value.
- Click Next. You will be redirected to the Preview & Done section.
Post-installation
Once your app is installed, it will appear in your Installed Apps folder, and dashboard panels will start to fill automatically.
Each panel slowly fills with data matching the time range query received since the panel was created. Results will not immediately be available but will be updated with full graphs and charts over time.
Use an existing collector and install the app
To set up the source in the existing collector and install the app, do the following:
Next-Gen App: To install or update the app, you must be an account administrator or a user with Manage Apps, Manage Monitors, Manage Fields, Manage Metric Rules, and Manage Collectors capabilities depending upon the different content types part of the app.
- Select App Catalog.
- In the 🔎 Search Apps field, run a search for your desired app, then select it.
- Click Install App.
note
Sometimes this button says Add Integration.
- In the Set Up Collection section of your respective app, select Use an existing Collector.
- From the Select Collector dropdown, select the collector that you want to set up your source with and click Next.
- Configure the source as specified in the
Infobox above, ensuring all required fields are included. - In the Configure section of your respective app, complete the following fields.
- Field Name. If you already have collectors and sources set up, select the configured metadata field name (eg _sourcecategory) or specify other custom metadata (eg: _collector) along with its metadata Field Value.
- Click Next. You will be redirected to the Preview & Done section.
Post-installation
Once your app is installed, it will appear in your Installed Apps folder, and dashboard panels will start to fill automatically.
Each panel slowly fills with data matching the time range query received since the panel was created. Results will not immediately be available but will be updated with full graphs and charts over time.
Use an existing source and install the app
To skip collection and only install the app, do the following:
Next-Gen App: To install or update the app, you must be an account administrator or a user with Manage Apps, Manage Monitors, Manage Fields, Manage Metric Rules, and Manage Collectors capabilities depending upon the different content types part of the app.
- Select App Catalog.
- In the 🔎 Search Apps field, run a search for your desired app, then select it.
- Click Install App.
note
Sometimes this button says Add Integration.
- In the Set Up Collection section of your respective app, select Skip this step and use existing source and click Next.
- In the Configure section of your respective app, complete the following fields.
- Field Name. If you already have collectors and sources set up, select the configured metadata field name (eg _sourcecategory) or specify other custom metadata (eg: _collector) along with its metadata Field Value.
- Click Next. You will be redirected to the Preview & Done section.
Post-installation
Once your app is installed, it will appear in your Installed Apps folder, and dashboard panels will start to fill automatically.
Each panel slowly fills with data matching the time range query received since the panel was created. Results will not immediately be available but will be updated with full graphs and charts over time.
Viewing the Atlassian dashboards
All dashboards have a set of filters that you can apply to the entire dashboard. Use these filters to drill down and examine the data to a granular level.
- You can change the time range for a dashboard or panel by selecting a predefined interval from a drop-down list, choosing a recently used time range, or specifying custom dates and times. Learn more.
- You can use template variables to drill down and examine the data on a granular level. For more information, see Filtering Dashboards with Template Variables.
- Most Next-Gen apps allow you to provide the scope at the installation time and are comprised of a key (
_sourceCategoryby default) and a default value for this key. Based on your input, the app dashboards will be parameterized with a dashboard variable, allowing you to change the dataset queried by all panels. This eliminates the need to create multiple copies of the same dashboard with different queries.
Overview
The Atlassian - Overview dashboard provides a comprehensive overview of key actions and events across the Atlassian environment, offering critical insights for security teams. It displays the total number of events, breaks down actions by type (for example, user logins, API access, and policy changes), and visualizes event frequency over time to help detect abnormal activity patterns.
The top actors and their associated actions are highlighted, allowing quick identification of potential security risks. Additionally, the geolocation maps identify where actors and risky activities are originating from, offering further context for threat detection. The recent events table gives granular details, including timestamps, actor names, and countries, aiding in a thorough investigation of any security incidents. This dashboard is instrumental for detecting unauthorized access, policy violations, and other suspicious activity within the Atlassian ecosystem. 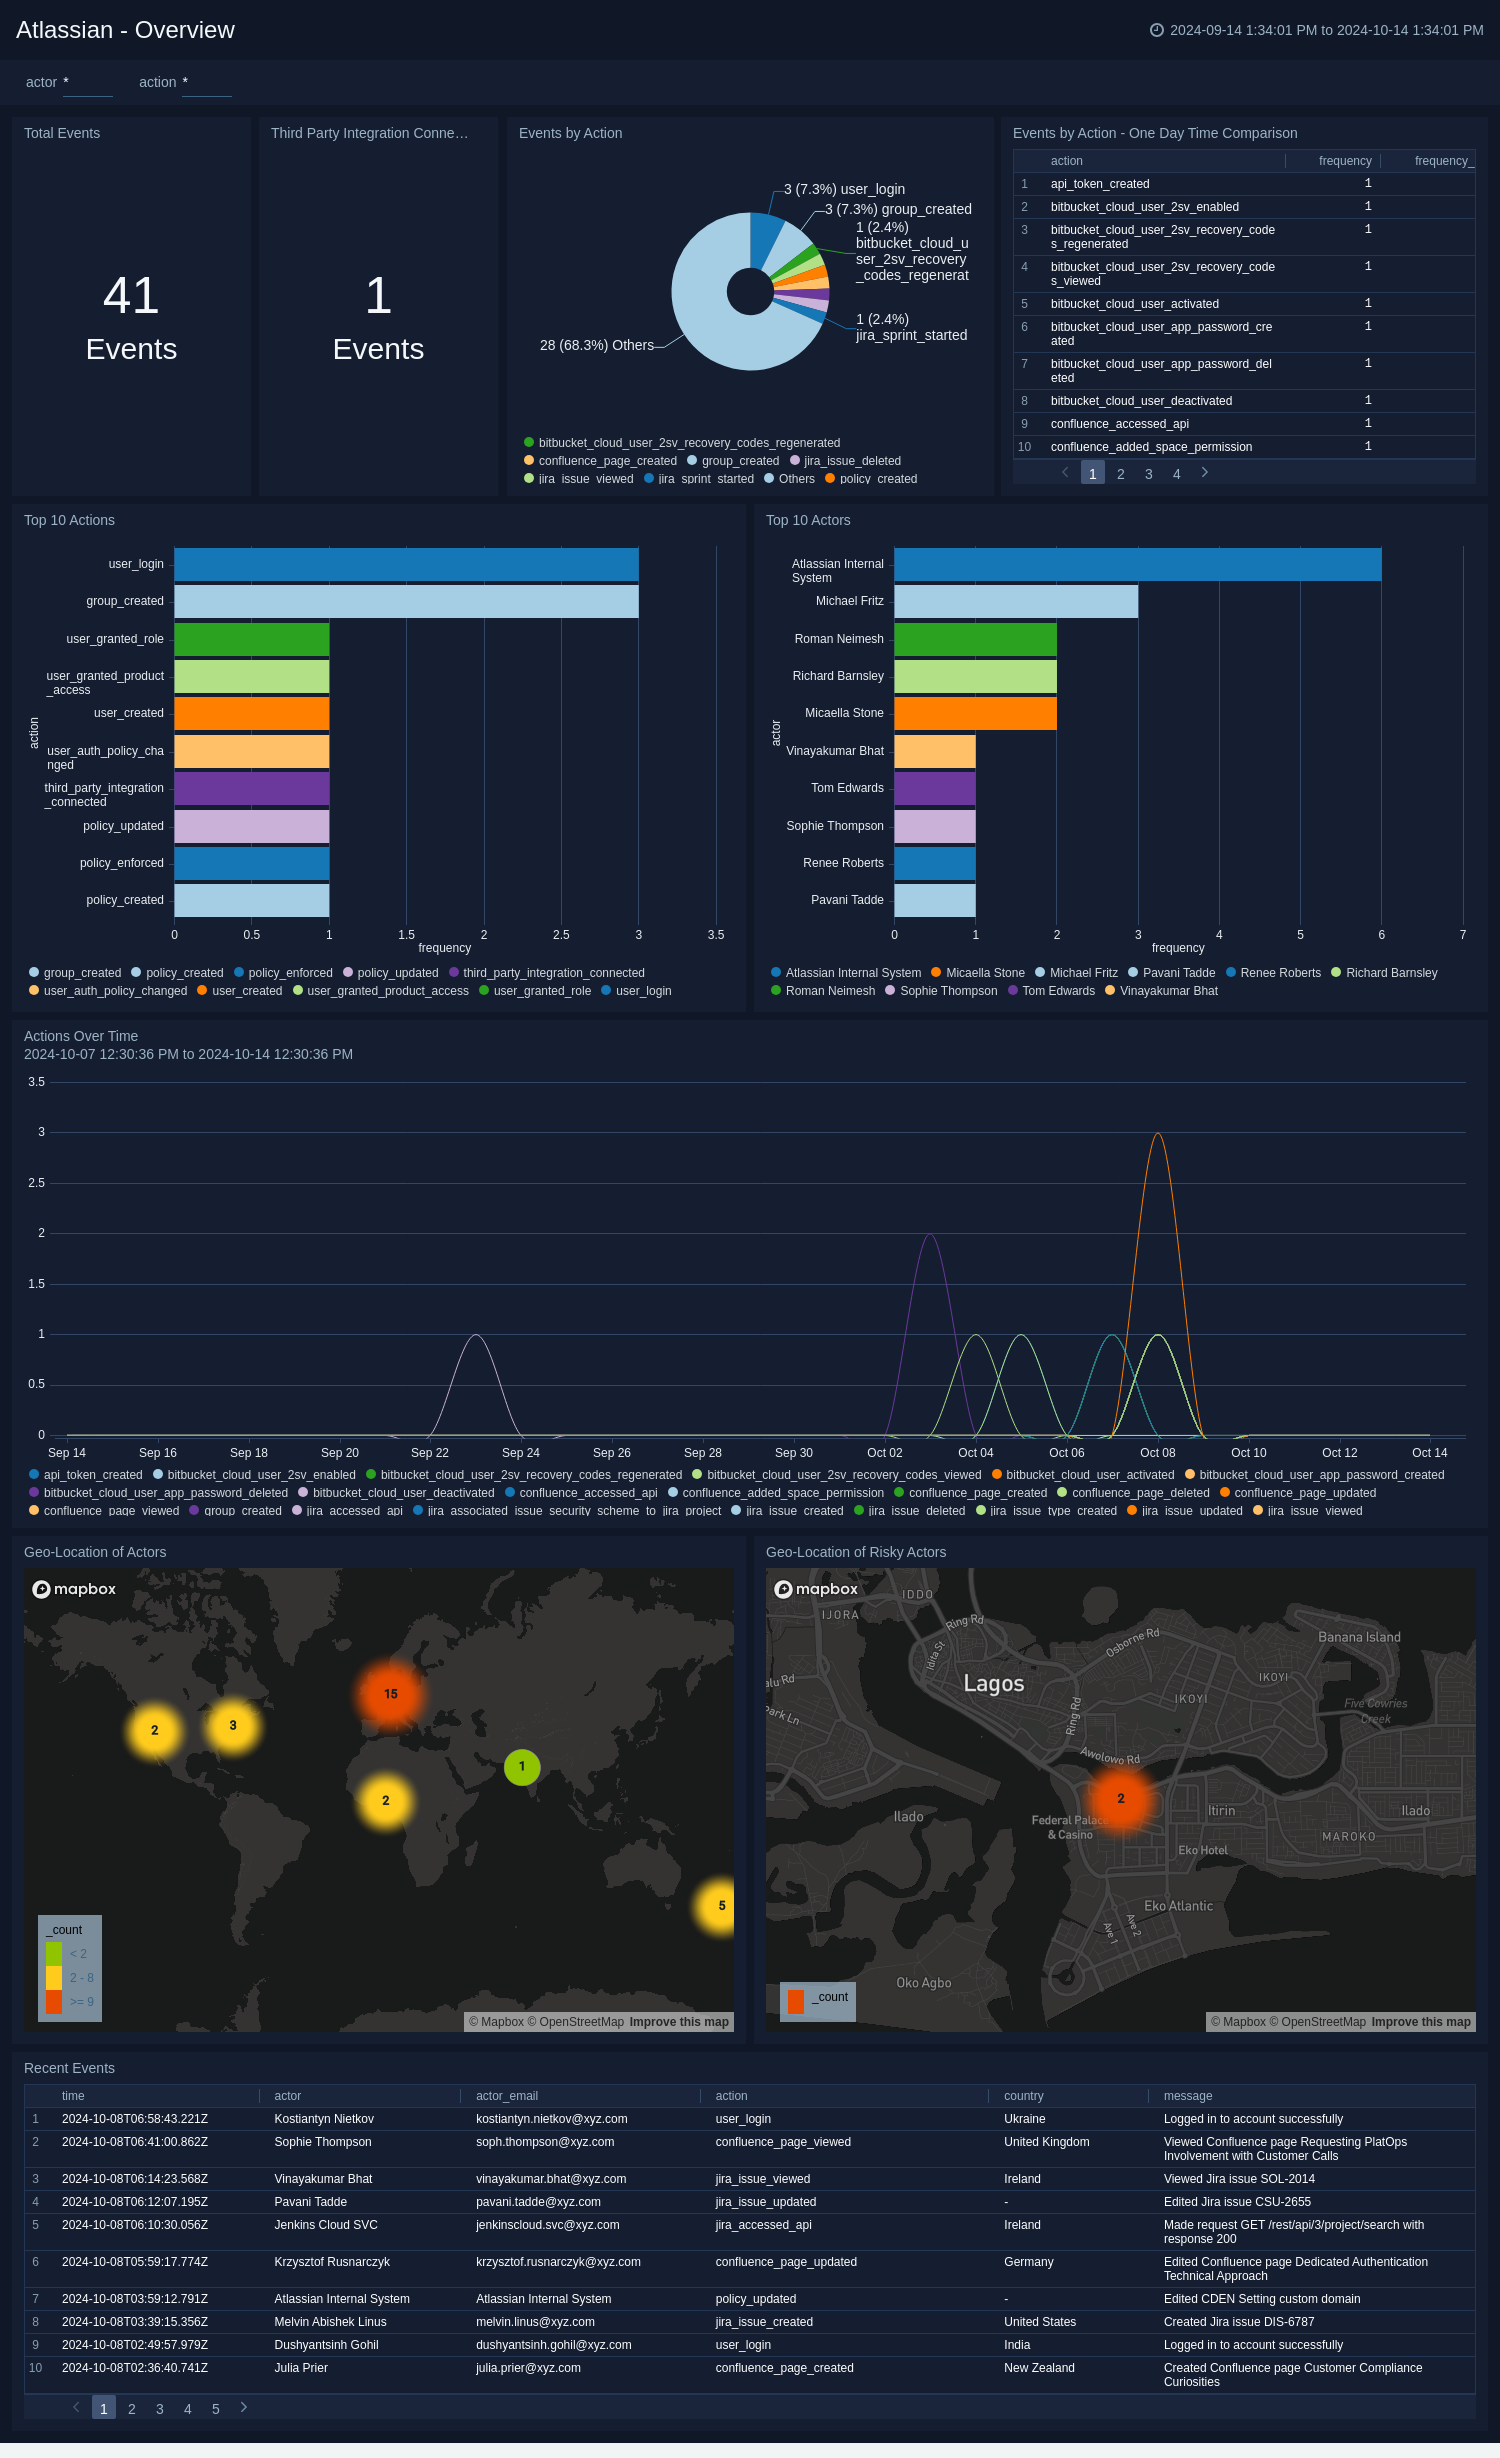
Jira, Confluence, and Bitbucket
The Atlassian - Jira, Confluence, and Bitbucket dashboard provides a holistic view of user activities across the three platforms, making it a crucial tool for security teams. It offers insights into key actions such as sprint management in Jira, space permissions in Confluence, and user account modifications in Bitbucket.
Security professionals can use this dashboard to track the frequency of Jira events, such as sprint creations, updates, and closures, along with user roles and permission changes. The Confluence section monitors critical events related to permission alterations, while Bitbucket tracks password resets, user activations, and deactivations, helping detect unauthorized account actions. The Events Over Time section enables trend analysis of activity spikes and the Recently Added Security Levels highlights any updates in project security. The geolocation mapping of actors offers added visibility into where activities originate, helping identify potential geographic threats.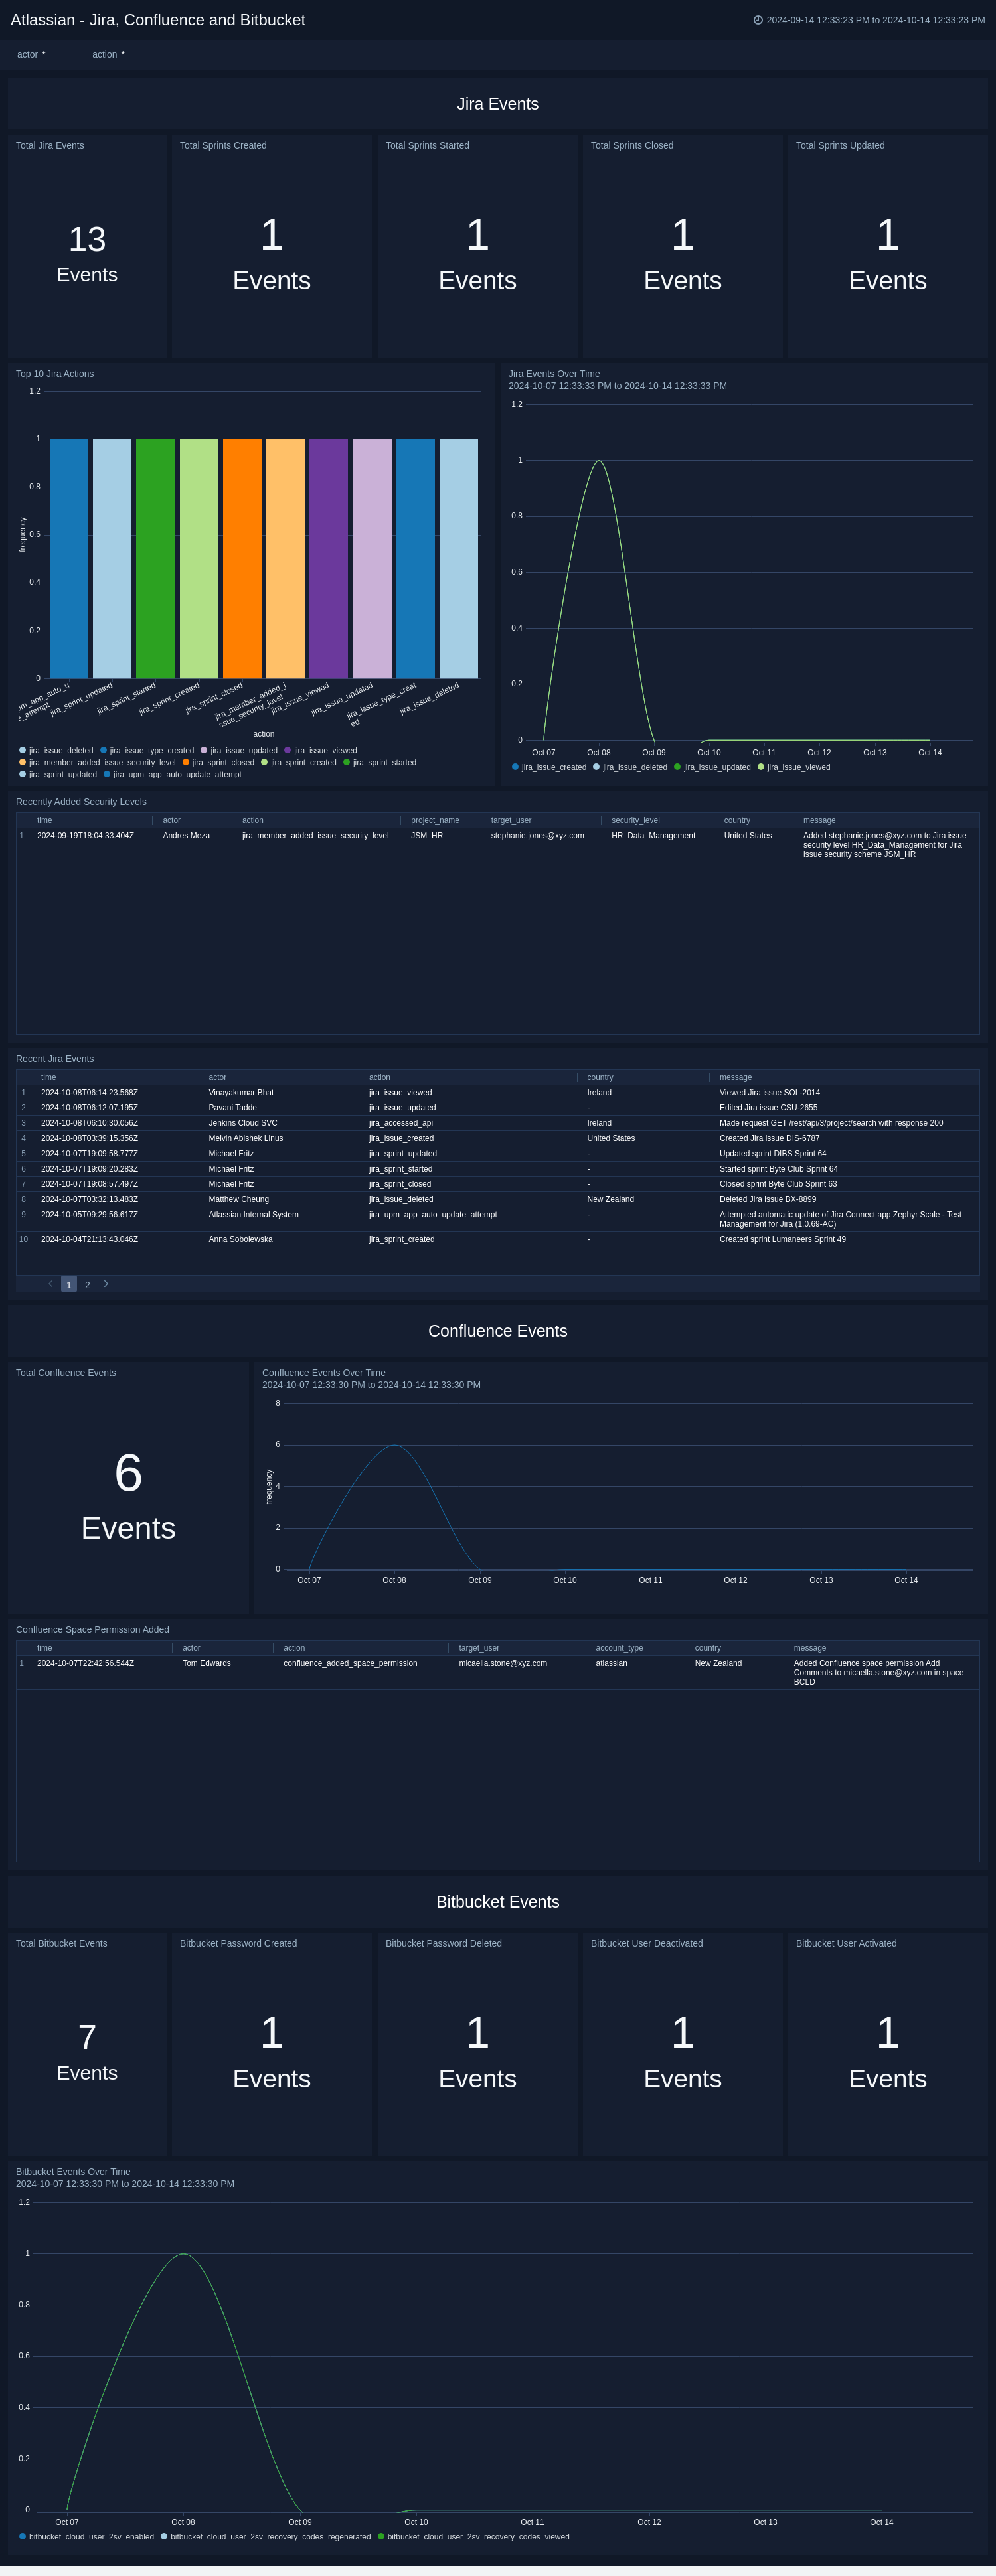
User Activity
The Atlassian - User Activity dashboard provides a comprehensive overview of critical user actions and security-related events within the Atlassian platform. It monitors key activities such as user creation, role assignment, API token generation, and policy changes, helping security teams detect unauthorized account modifications or policy alterations. The dashboard includes visualizations of login attempts (both successful and failed attempts) and tracks access granted to users over time, aiding in the identification of potential security breaches or abnormal access patterns. A detailed events summary table provides insights into who performed specific actions and from which geographical locations, which is crucial for identifying suspicious activity. This dashboard is a valuable tool for security teams to oversee user activity, policy enforcement, and system integrity.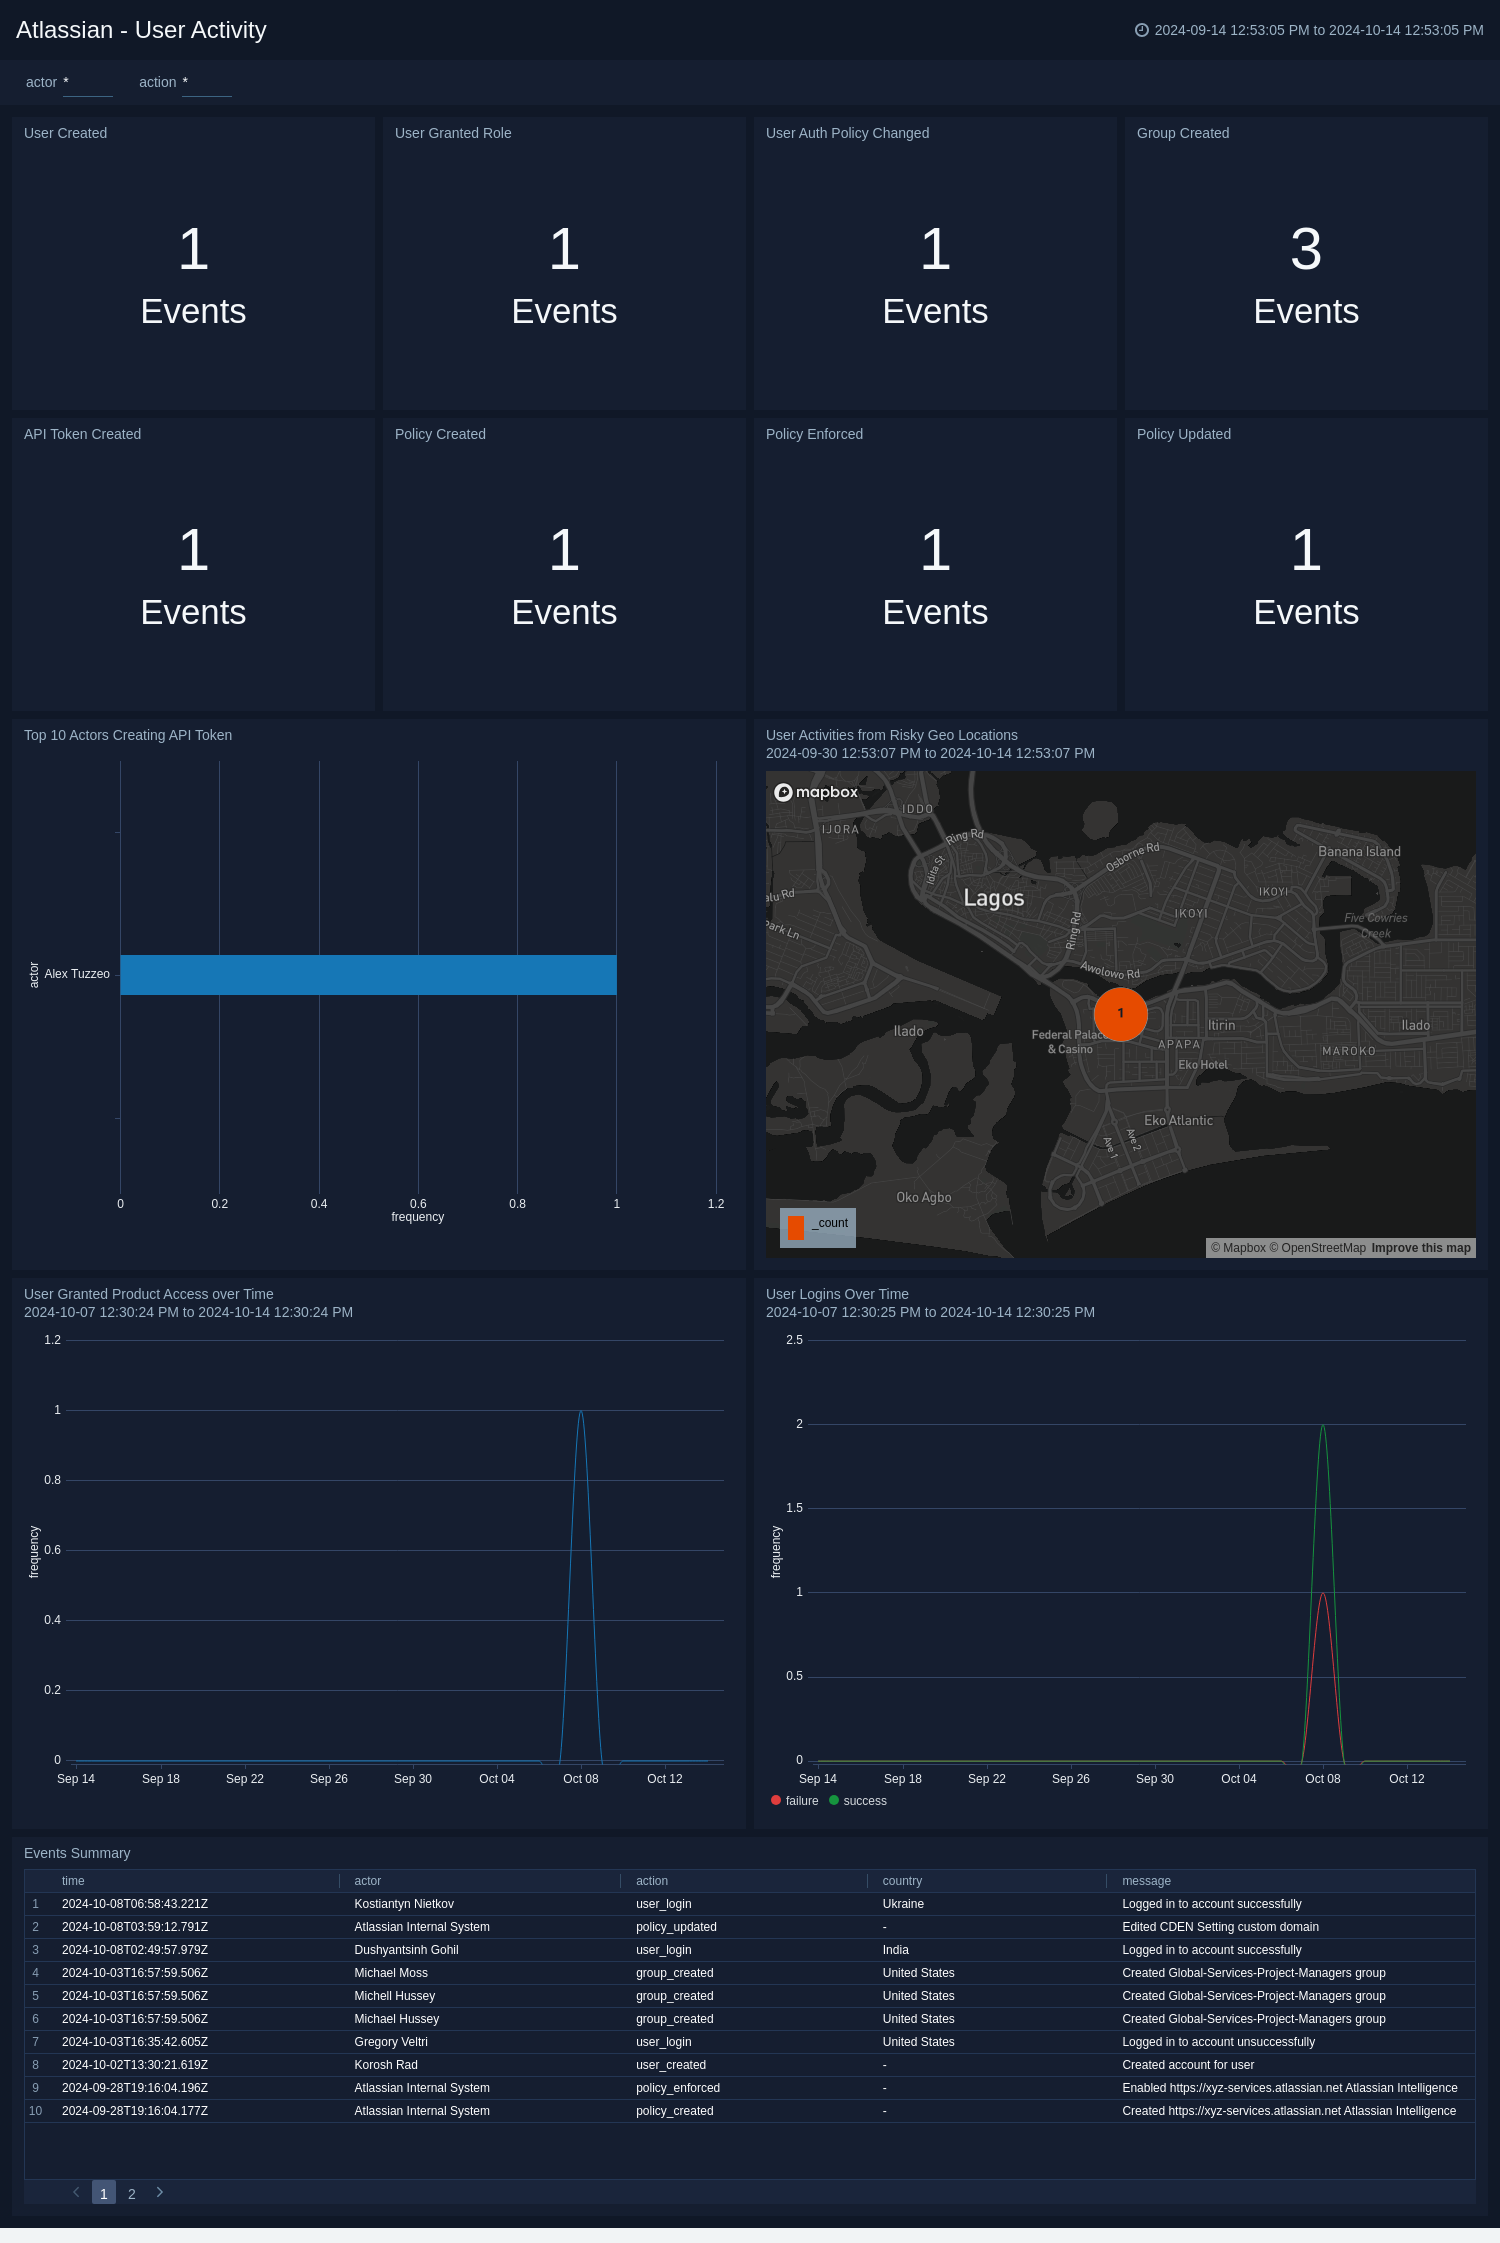
Create monitors for Atlassian app
From your App Catalog:
- From the Sumo Logic navigation, select App Catalog.
- In the Search Apps field, search for and then select your app.
- Make sure the app is installed.
- Navigate to What's Included tab and scroll down to the Monitors section.
- Click Create next to the pre-configured monitors. In the create monitors window, adjust the trigger conditions and notifications settings based on your requirements.
- Scroll down to Monitor Details.
- Under Location click on New Folder.
note
By default, monitor will be saved in the root folder. So to make the maintenance easier, create a new folder in the location of your choice.
- Enter Folder Name. Folder Description is optional.
tip
Using app version in the folder name will be helpful to determine the versioning for future updates.
- Click Create. Once the folder is created, click on Save.
Atlassian monitors
The Atlassian monitors are designed for security purpose to focus on monitoring key activities and potential threats across Atlassian environments. These alerts provide real-time visibility into critical actions, enabling security teams to respond quickly to anomalies or policy violations.
| Name | Description | Trigger Type (Critical / Warning / MissingData) | Alert Condition |
|---|---|---|---|
Events from Risky Locations | This alert is fired when the user actions are originating from high-risk locations (Afghanistan, China, Cuba, North Korea, Iran, Libya, Nigeria, Sudan, Syria, and Yemen) based on geographical profiles. This helps detect potential account compromise or malicious activities. | Critical | Count > 0 |
User addition to group | This alert is fired when when users are added to groups, ensuring that changes in group memberships, especially those with elevated privileges, are legitimate. | Critical | Count > 1 |
API Token Created | This alert is fired during the creation of API tokens, which can be exploited if misused. Monitoring this ensures that only authorized users are generating API tokens for secure integrations. | Critical | Count > 0 |
User Granted Product Access | This alert fires when users are granted access to specific Atlassian products, helping ensure that only authorized individuals gain access to sensitive tools or data. | Critical | Count > 5 |
Failed Login events | This alert is fired when there is failed login attempts, which can indicate brute force attacks or unauthorized access attempts. Repeated failures may suggest a compromised user account. | Critical | Count > 5 |
Login exceeds set parameters | This alert is fired when logins exceed predefined thresholds, such as login attempts or unusual session durations, which could signal suspicious activity. | Critical | Count > 1 |
Change in Policy | This alert is fired when there is changes in organizational policies, such as user access controls or security settings, helping prevent unauthorized modifications that could lead to vulnerabilities. | Critical | Count > 0 |
Upgrading the Atlassian app (Optional)
To update the app, do the following:
Next-Gen App: To install or update the app, you must be an account administrator or a user with Manage Apps, Manage Monitors, Manage Fields, Manage Metric Rules, and Manage Collectors capabilities depending upon the different content types part of the app.
- Select App Catalog.
- In the Search Apps field, search for and then select your app.
Optionally, you can identify apps that can be upgraded in the Upgrade available section. - To upgrade the app, select Upgrade from the Manage dropdown.
- If the upgrade does not have any configuration or property changes, you will be redirected to the Preview & Done section.
- If the upgrade has any configuration or property changes, you will be redirected to the Setup Data page.
- In the Configure section of your respective app, complete the following fields.
- Field Name. If you already have collectors and sources set up, select the configured metadata field name (eg _sourcecategory) or specify other custom metadata (eg: _collector) along with its metadata Field Value.
- Click Next. You will be redirected to the Preview & Done section.
Post-update
Your upgraded app will be installed in the Installed Apps folder and dashboard panels will start to fill automatically.
See our Release Notes changelog for new updates in the app.
To revert the app to a previous version, do the following:
- Select App Catalog.
- In the Search Apps field, search for and then select your app.
- To version down the app, select Revert to < previous version of your app > from the Manage dropdown.
Uninstalling the Atlassian app (Optional)
To uninstall the app, do the following:
- Select App Catalog.
- In the 🔎 Search Apps field, run a search for your desired app, then select it.
- Click Uninstall.