Cato Networks
The Sumo Logic app for Cato Networks provides real-time insights into the events and helps you to identify potential security threats with admin activities. This app offers a comprehensive suite of dashboards that monitor network events, analyze threats, and track administrative activities, which empowers you with actionable intelligence for network management and security.
Key features and benefits of the Cato Networks app include:
- Security event analysis. Detect and respond to security threats in the Cato Networks environment. It provides a holistic view of event-related metrics and insights. This dashboard enables users to identify trends, assess risks, and make informed decisions regarding network events.
- Threat analysis. This app offers a comprehensive overview of threat-related information that allows you to understand and address potential risks effectively, thereby supporting risk management and response strategies.
- Audit summary. This app includes pre-built reports and visualizations of audit logs which facilitates effective monitoring, analysis, and identification of any unusual or suspicious activities within the system.
- Customization and Integration. Customize and tailor your dashboards, reports, and alerts to align specific monitoring and security needs. It also supports integration with other security tools and platforms, enabling a centralized view of the overall security landscape.
Log types
This app uses the Sumo Logic Cato Networks source to collect Events Feed and Audit Feed data from the Cato Networks platform.
Sample log messages
{
   account_id: "1714",
   action: "Succeeded",
   api_name: "eventsFeed",
   api_type: "query",
   authentication_type: "APIKEY",
   event_count: "1",
   event_sub_type: "ApiKey",
   event_type: "Connectivity",
   internalId: "9jlo",
   key_name: "Peter",
   login_type: "API",
   src_country: "Ireland",
   src_country_code: "IE",
   src_ip: "128.200.100.1",
   src_is_site_or_vpn: "API",
   src_site: "US",
   time: "1682856852500"
}
{
   account_id: "1714",
   admin: "peter@mail.com",
   admin_id: "4472",
   change_type: "DELETED",
   creation_date: "1682683010000",
   insertion_date: "1682684083127",
   model_name: "Temp jscript driveby",
   model_type: "IPSWISTRULE",
   module: "Ips Whitelist Rule"
}
Sample queries
_sourceName="source" event_type
| json "user_name", "api_type", "event_message", "application", "api_name", "file_size", "socket_interface", "matched_data_types", "rule", "device_name", "src_site", "internalId", "dlp_profiles", "ip_protocol", "custom_categories", "src_isp_ip", "threat_verdict", "src_ip", "action", "file_type", "dest_is_site_or_vpn", "file_name", "is_sanctioned_app", "vpn_user_email", "threat_type", "dest_ip", "risk_level", "domain_name", "src_is_site_or_vpn", "account_id", "event_sub_type", "signature_id", "rule_id", "host_mac", "client_class", "user_reference_id", "event_type", "full_path_url", "host_ip", "rule_name", "severity", "login_type", "mitre_attack_tactics", "os_version", "src_country", "time", "dest_port", "application_risk", "categories", "src_port", "mitre_attack_subtechniques", "dest_site", "traffic_direction", "link_type", "event_count", "ISP_name", "mitre_attack_techniques", "authentication_type", "os_type", "dest_country", "key_name", "threat_reference", "url", "threat_name", "tunnel_protocol", "dest_country_code", "client_version", "src_country_code", "pop_name" as user_name, api_type, event_message, application, api_name, file_size, socket_interface, matched_data_types, rule, device_name, src_site, internalId, dlp_profiles, ip_protocol, custom_categories, src_isp_ip, threat_verdict, src_ip, action, file_type, dest_is_site_or_vpn, file_name, is_sanctioned_app, vpn_user_email, threat_type, dest_ip, risk_level, domain_name, src_is_site_or_vpn, account_id, event_sub_type, signature_id, rule_id, host_mac, client_class, user_reference_id, event_type, full_path_url, host_ip, rule_name, severity, login_type, mitre_attack_tactics, os_version, src_country, time, dest_port, application_risk, categories, src_port, mitre_attack_subtechniques, dest_site, traffic_direction, link_type, event_count, ISP_name, mitre_attack_techniques, authentication_type, os_type, dest_country, key_name, threat_reference, url, threat_name, tunnel_protocol, dest_country_code, client_version, src_country_code, pop_name nodrop

| where !isnull(risk_level)
| where !isnull(src_country)

//filters
| where src_is_site_or_vpn matches "{{source_type}}"
| where event_type matches "{{event_type}}"
| where event_sub_type matches "{{event_sub_type}}"
| where risk_level matches "{{risk_level}}"
| where src_country matches "{{src_country}}"

| where !isnull(threat_name)
| count_distinct(internalId)
_sourceName="source" admin
| json "account_id", "admin", "admin_id", "change_type", "creation_date", "insertion_date", "model_name", "model_type", "module" as account_id, admin, admin_id, activity, creation_date, insertion_date, model_name, model_type, module nodrop

//filters
| where activity matches "{{activity}}"
| where module matches "{{module}}"

| count(admin_id)
Collection configuration and app installation
Depending on the set up collection method, you can configure and install the app in three ways:
- Create a new collector and install the app. Create a new Sumo Logic Cloud-to-Cloud (C2C) source under a new Sumo Logic Collector and later install the app, or
- Use an existing collector and install the app. Create a new Sumo Logic Cloud-to-Cloud (C2C) source under an existing Sumo Logic Collector and later install the app, or
- Use existing source and install the app. Use your existing configured Sumo Logic Cloud-to-Cloud (C2C) source and install the app.
Use the Cloud-to-Cloud Integration for Cato Networks to create the source and use the same source category while installing the app. By following these steps, you can ensure that your Cato Networks app is properly integrated and configured to collect and analyze your Cato Networks data.
Create a new collector and install the app
To set up collection and install the app, do the following:
Next-Gen App: To install or update the app, you must be an account administrator or a user with Manage Apps, Manage Monitors, Manage Fields, Manage Metric Rules, and Manage Collectors capabilities depending upon the different content types part of the app.
- Select App Catalog.
- In the 🔎 Search Apps field, run a search for your desired app, then select it.
- Click Install App.
note
Sometimes this button says Add Integration.
- In the Set Up Collection section of your respective app, select Create a new Collector.
- Collector Name. Enter a Name to display the Source in the Sumo Logic web application. The description is optional.
- Timezone. Set the default time zone when it is not extracted from the log timestamp. Time zone settings on Sources override a Collector time zone setting.
- (Optional) Metadata. Click the +Add Metadata link to add a custom log Metadata Fields. Define the fields you want to associate, each metadata field needs a name (key) and value.
 A green circle with a checkmark is shown when the field exists and is enabled in the Fields table schema.
 An orange triangle with an exclamation point is shown when the field doesn't exist, or is disabled, in the Fields table schema. In this case, an option to automatically add or enable the nonexistent fields to the Fields table schema is provided. If a field is sent to Sumo that does not exist in the Fields schema or is disabled it is ignored, known as dropped.
- Click Next.
- Configure the source as specified in the
Infobox above, ensuring all required fields are included. - In the Configure section of your respective app, complete the following fields.
- Field Name. If you already have collectors and sources set up, select the configured metadata field name (eg _sourcecategory) or specify other custom metadata (eg: _collector) along with its metadata Field Value.
- Click Next. You will be redirected to the Preview & Done section.
Post-installation
Once your app is installed, it will appear in your Installed Apps folder, and dashboard panels will start to fill automatically.
Each panel slowly fills with data matching the time range query received since the panel was created. Results will not immediately be available but will be updated with full graphs and charts over time.
Use an existing collector and install the app
To set up the source in the existing collector and install the app, do the following:
Next-Gen App: To install or update the app, you must be an account administrator or a user with Manage Apps, Manage Monitors, Manage Fields, Manage Metric Rules, and Manage Collectors capabilities depending upon the different content types part of the app.
- Select App Catalog.
- In the 🔎 Search Apps field, run a search for your desired app, then select it.
- Click Install App.
note
Sometimes this button says Add Integration.
- In the Set Up Collection section of your respective app, select Use an existing Collector.
- From the Select Collector dropdown, select the collector that you want to set up your source with and click Next.
- Configure the source as specified in the
Infobox above, ensuring all required fields are included. - In the Configure section of your respective app, complete the following fields.
- Field Name. If you already have collectors and sources set up, select the configured metadata field name (eg _sourcecategory) or specify other custom metadata (eg: _collector) along with its metadata Field Value.
- Click Next. You will be redirected to the Preview & Done section.
Post-installation
Once your app is installed, it will appear in your Installed Apps folder, and dashboard panels will start to fill automatically.
Each panel slowly fills with data matching the time range query received since the panel was created. Results will not immediately be available but will be updated with full graphs and charts over time.
Use an existing source and install the app
To skip collection and only install the app, do the following:
Next-Gen App: To install or update the app, you must be an account administrator or a user with Manage Apps, Manage Monitors, Manage Fields, Manage Metric Rules, and Manage Collectors capabilities depending upon the different content types part of the app.
- Select App Catalog.
- In the 🔎 Search Apps field, run a search for your desired app, then select it.
- Click Install App.
note
Sometimes this button says Add Integration.
- In the Set Up Collection section of your respective app, select Skip this step and use existing source and click Next.
- In the Configure section of your respective app, complete the following fields.
- Field Name. If you already have collectors and sources set up, select the configured metadata field name (eg _sourcecategory) or specify other custom metadata (eg: _collector) along with its metadata Field Value.
- Click Next. You will be redirected to the Preview & Done section.
Post-installation
Once your app is installed, it will appear in your Installed Apps folder, and dashboard panels will start to fill automatically.
Each panel slowly fills with data matching the time range query received since the panel was created. Results will not immediately be available but will be updated with full graphs and charts over time.
Viewing Cato Networks dashboards
All dashboards have a set of filters that you can apply to the entire dashboard. Use these filters to drill down and examine the data to a granular level.
- You can change the time range for a dashboard or panel by selecting a predefined interval from a drop-down list, choosing a recently used time range, or specifying custom dates and times. Learn more.
- You can use template variables to drill down and examine the data on a granular level. For more information, see Filtering Dashboards with Template Variables.
- Most Next-Gen apps allow you to provide the scope at the installation time and are comprised of a key (
_sourceCategoryby default) and a default value for this key. Based on your input, the app dashboards will be parameterized with a dashboard variable, allowing you to change the dataset queried by all panels. This eliminates the need to create multiple copies of the same dashboard with different queries.
Events
The Cato Networks - Events dashboard provides a detailed summary of the event-related metrics and insights. This dashboard provides a holistic view of event-related information, enabling users to identify trends, assess risks, and make informed decisions.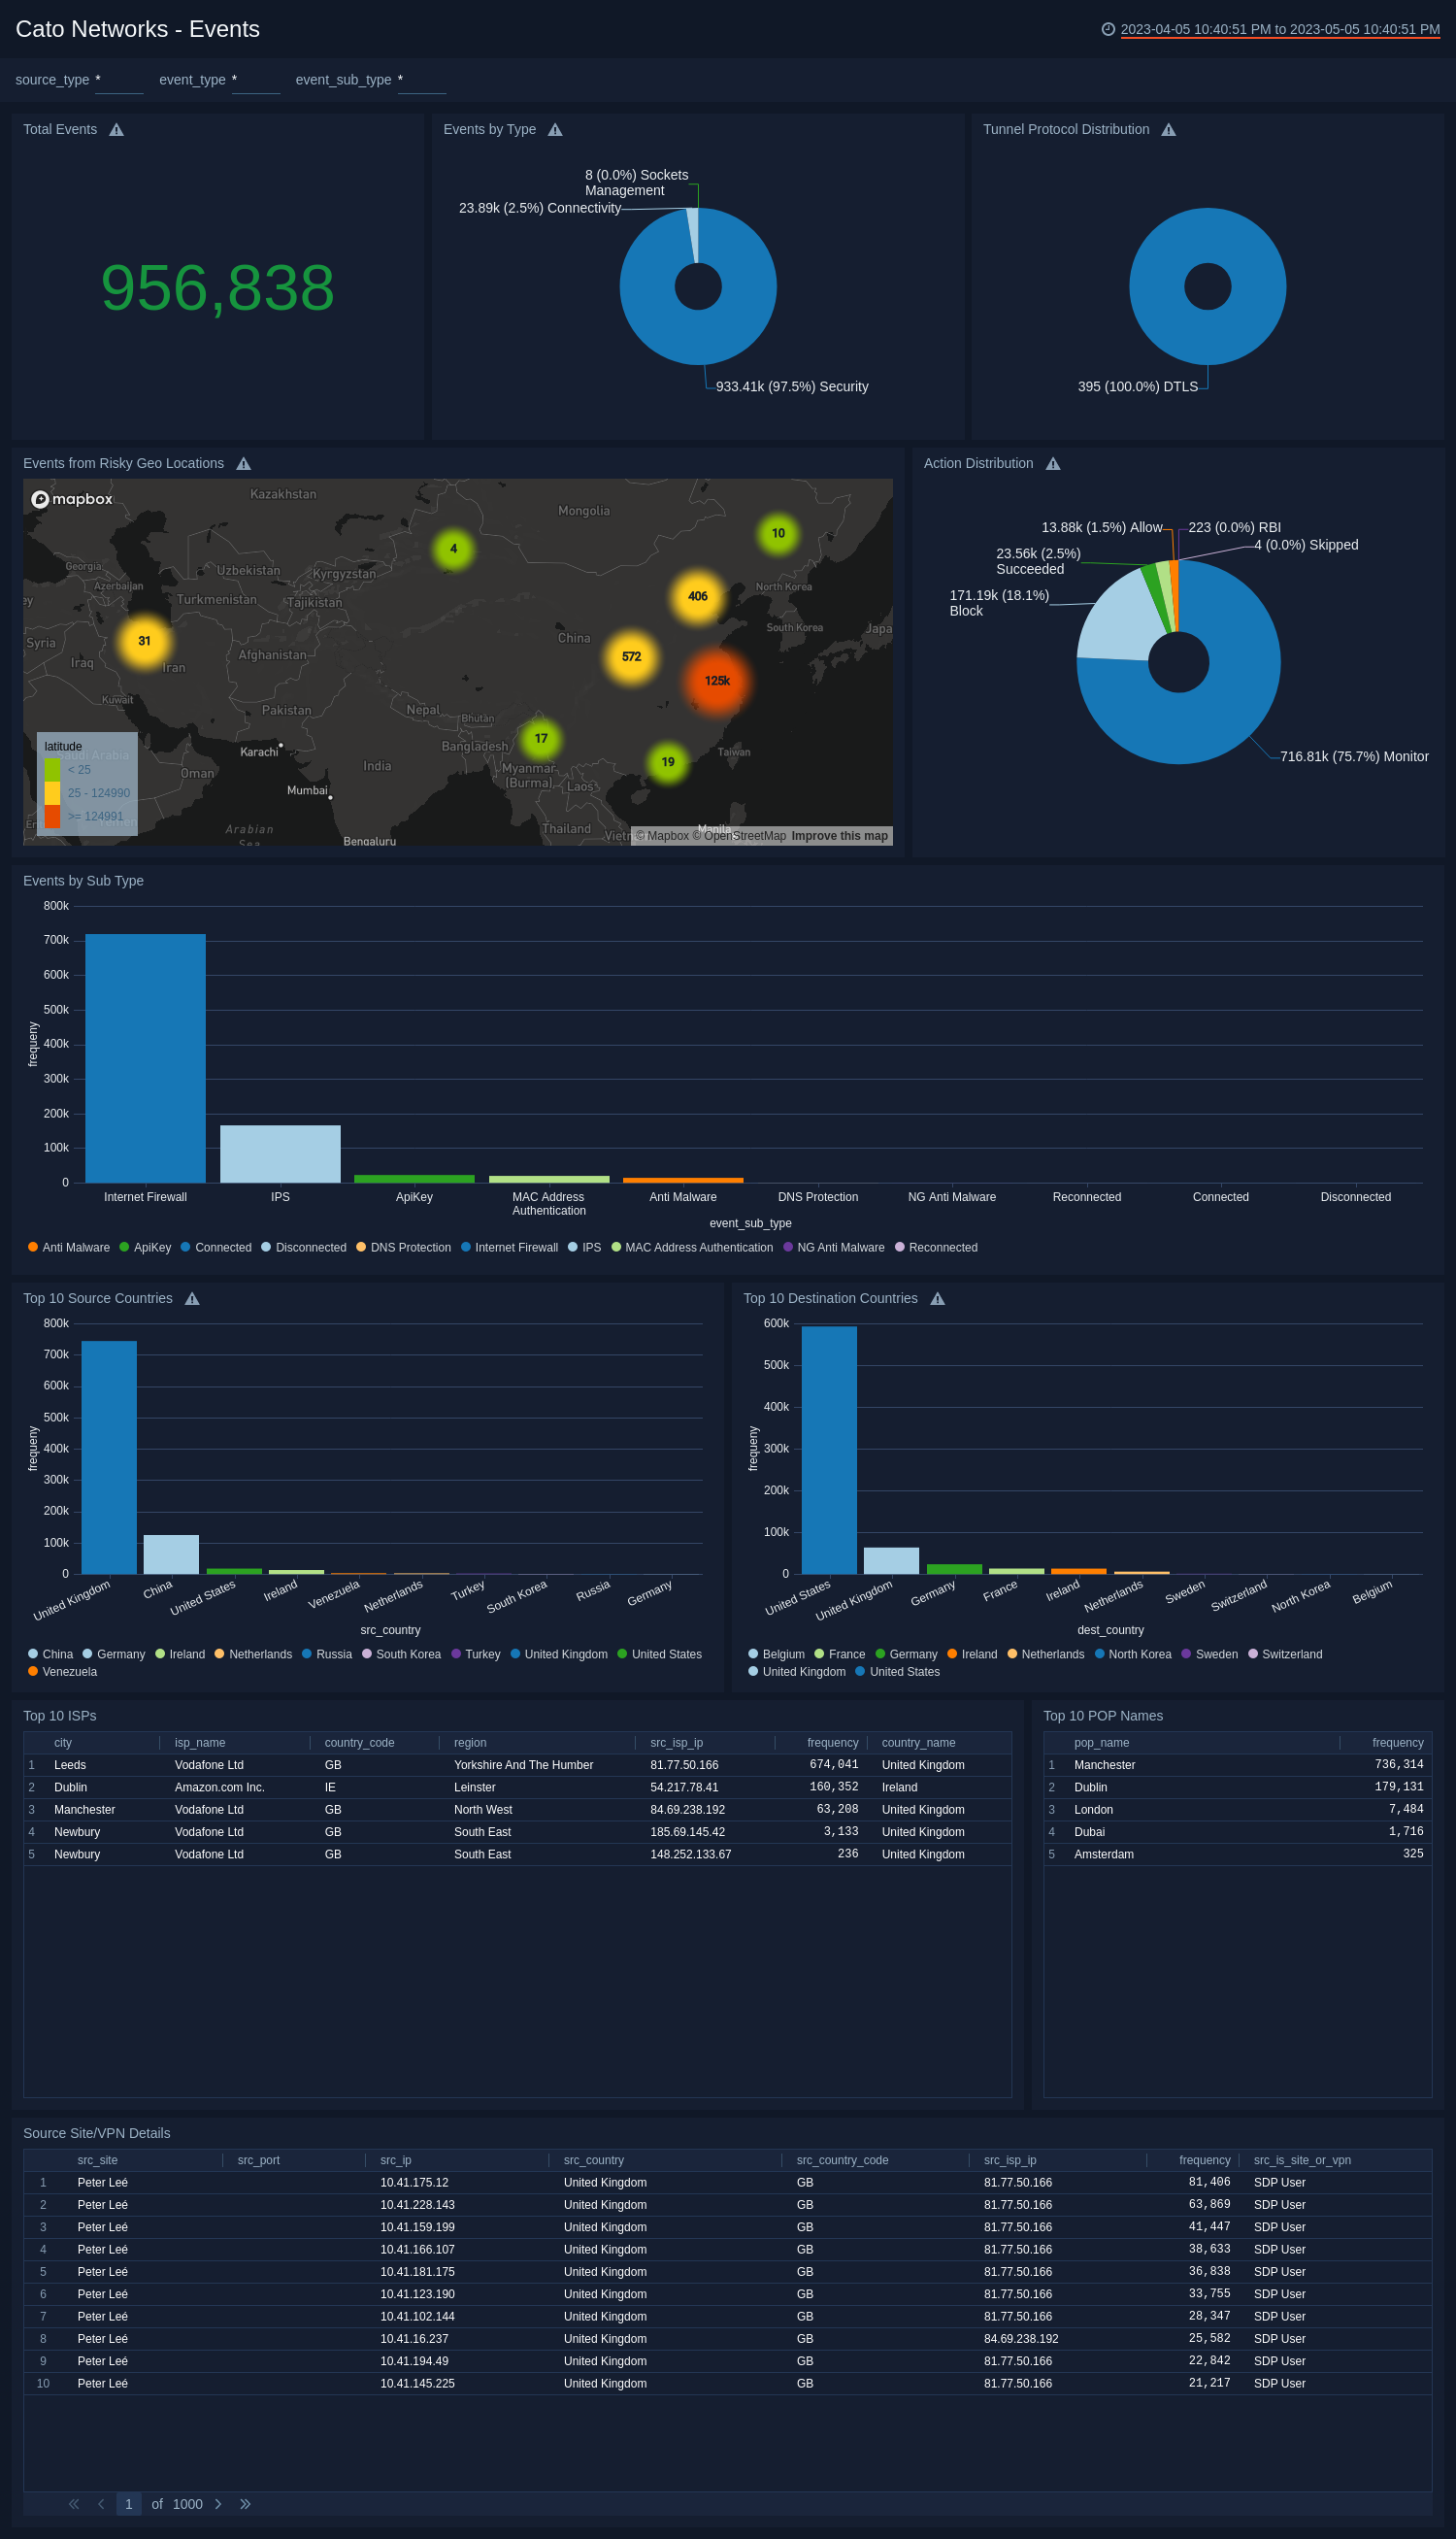
- Total Events. Displays the total number of events that allows you to gauge the scale of activity.
- Events by Type. The distribution of events by type provides a breakdown of the different categories, offering valuable context.
- Tunnel Protocol Distribution. The tunnel protocol distribution showcases the usage of different protocols, indicating potential security concerns.
- Events from Risky Geo Locations. The geo-locations of risky sources that represent potentially problematic areas.
- Action Distribution. Highlights the distribution of actions taken in response to events.
- Events by Sub Type. The distribution of events by sub-type provides a breakdown of the different categories, offering valuable context.
- Top 10 Source Countries. The top source countries highlight events' geographic origins, which enables you to identify the source country of the threat.
- Top 10 Destination Countries. The top destination countries highlight events' geographic destinations, which enables you to identify the destination country of the threat.
- Top 10 ISPs. The top ISPs reveal the service providers associated with these events, aiding in further analysis.
- Top 10 POP Names. The top POP names shed light on specific points of presence that might require attention.
- Source Site/VPN Details. Source site/VPN details offer insights into the source of events and the usage of VPNs.
Threat Analysis
The Cato Networks - Threat Analysis dashboard provides a comprehensive overview of threat-related information, enabling you to understand and address potential risks effectively.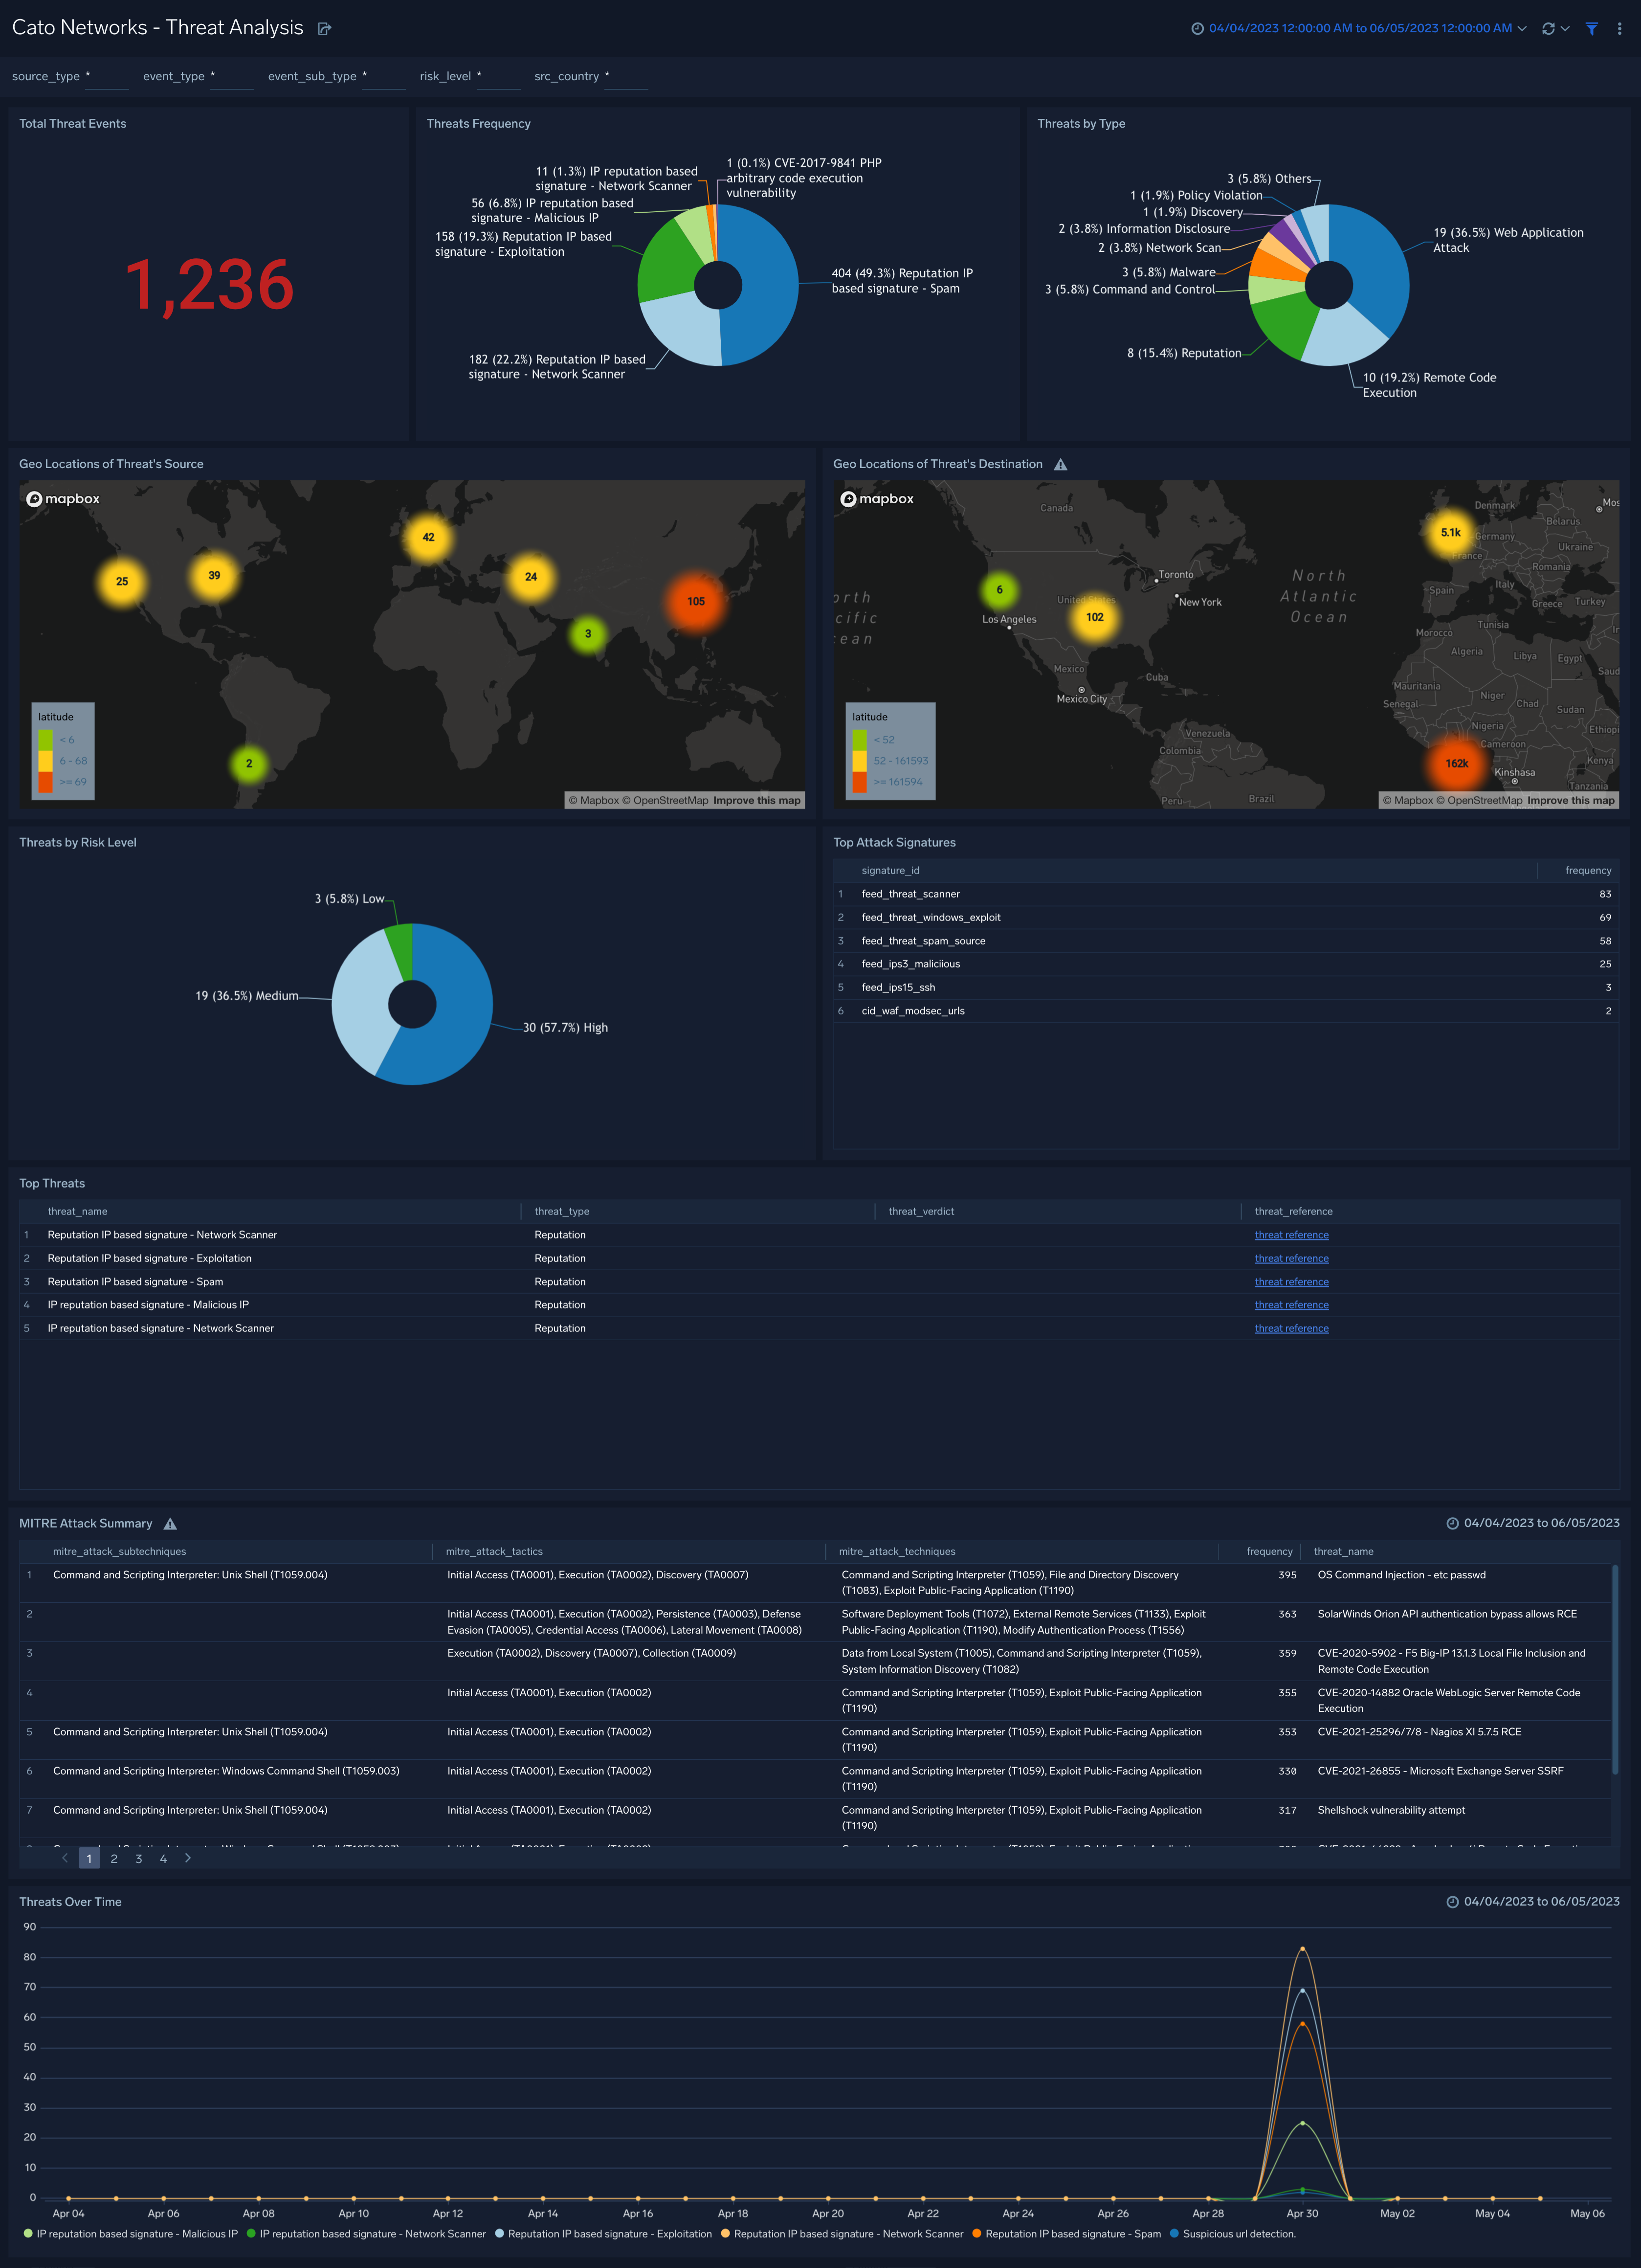
- Total Threat Events. Displays the total number of threat events, giving you an overall understanding of the threat landscape.
- Threats Frequency. The threats frequency widget highlights the frequency of threats, allowing you to identify patterns and trends.
- Threats by Type. The threat by types widget categorizes threats and provides insights into the specific types of threats encountered.
- Geo Locations of Threat's Source. The geo locations of threat sources provide visual representations of where threats originate, aiding in identifying potential hotspots.
- Geo Locations of Threat's Destinations. The geo locations of threat destinations provide visual representations of where they are targeted, aiding in identifying potential hotspots.
- Threats by Risk Level. The threats by risk level widget offer a classification of threats based on the severity and help you prioritize your response efforts.
- Top Attack Signatures. The top attack signatures widget highlights the most common attack patterns, allowing you to focus on the most significant risks.
- Top Threats. The top threats widgets highlight the specific threats allowing you to focus on the most significant risks.
- MTRE Attack Summary. The MITRE summary provides a concise overview of the relevant MITRE AT and CK framework for understanding the tactics and techniques associated with threats.
- Threats Over Time. The threats over time widget shows the trend of threats, assisting in monitoring the evolving threat landscape.
Audit Feed
The Cato Networks - Audit Feed dashboard offers a comprehensive summary of audit log activities, which provides valuable insights into system administration and changes. 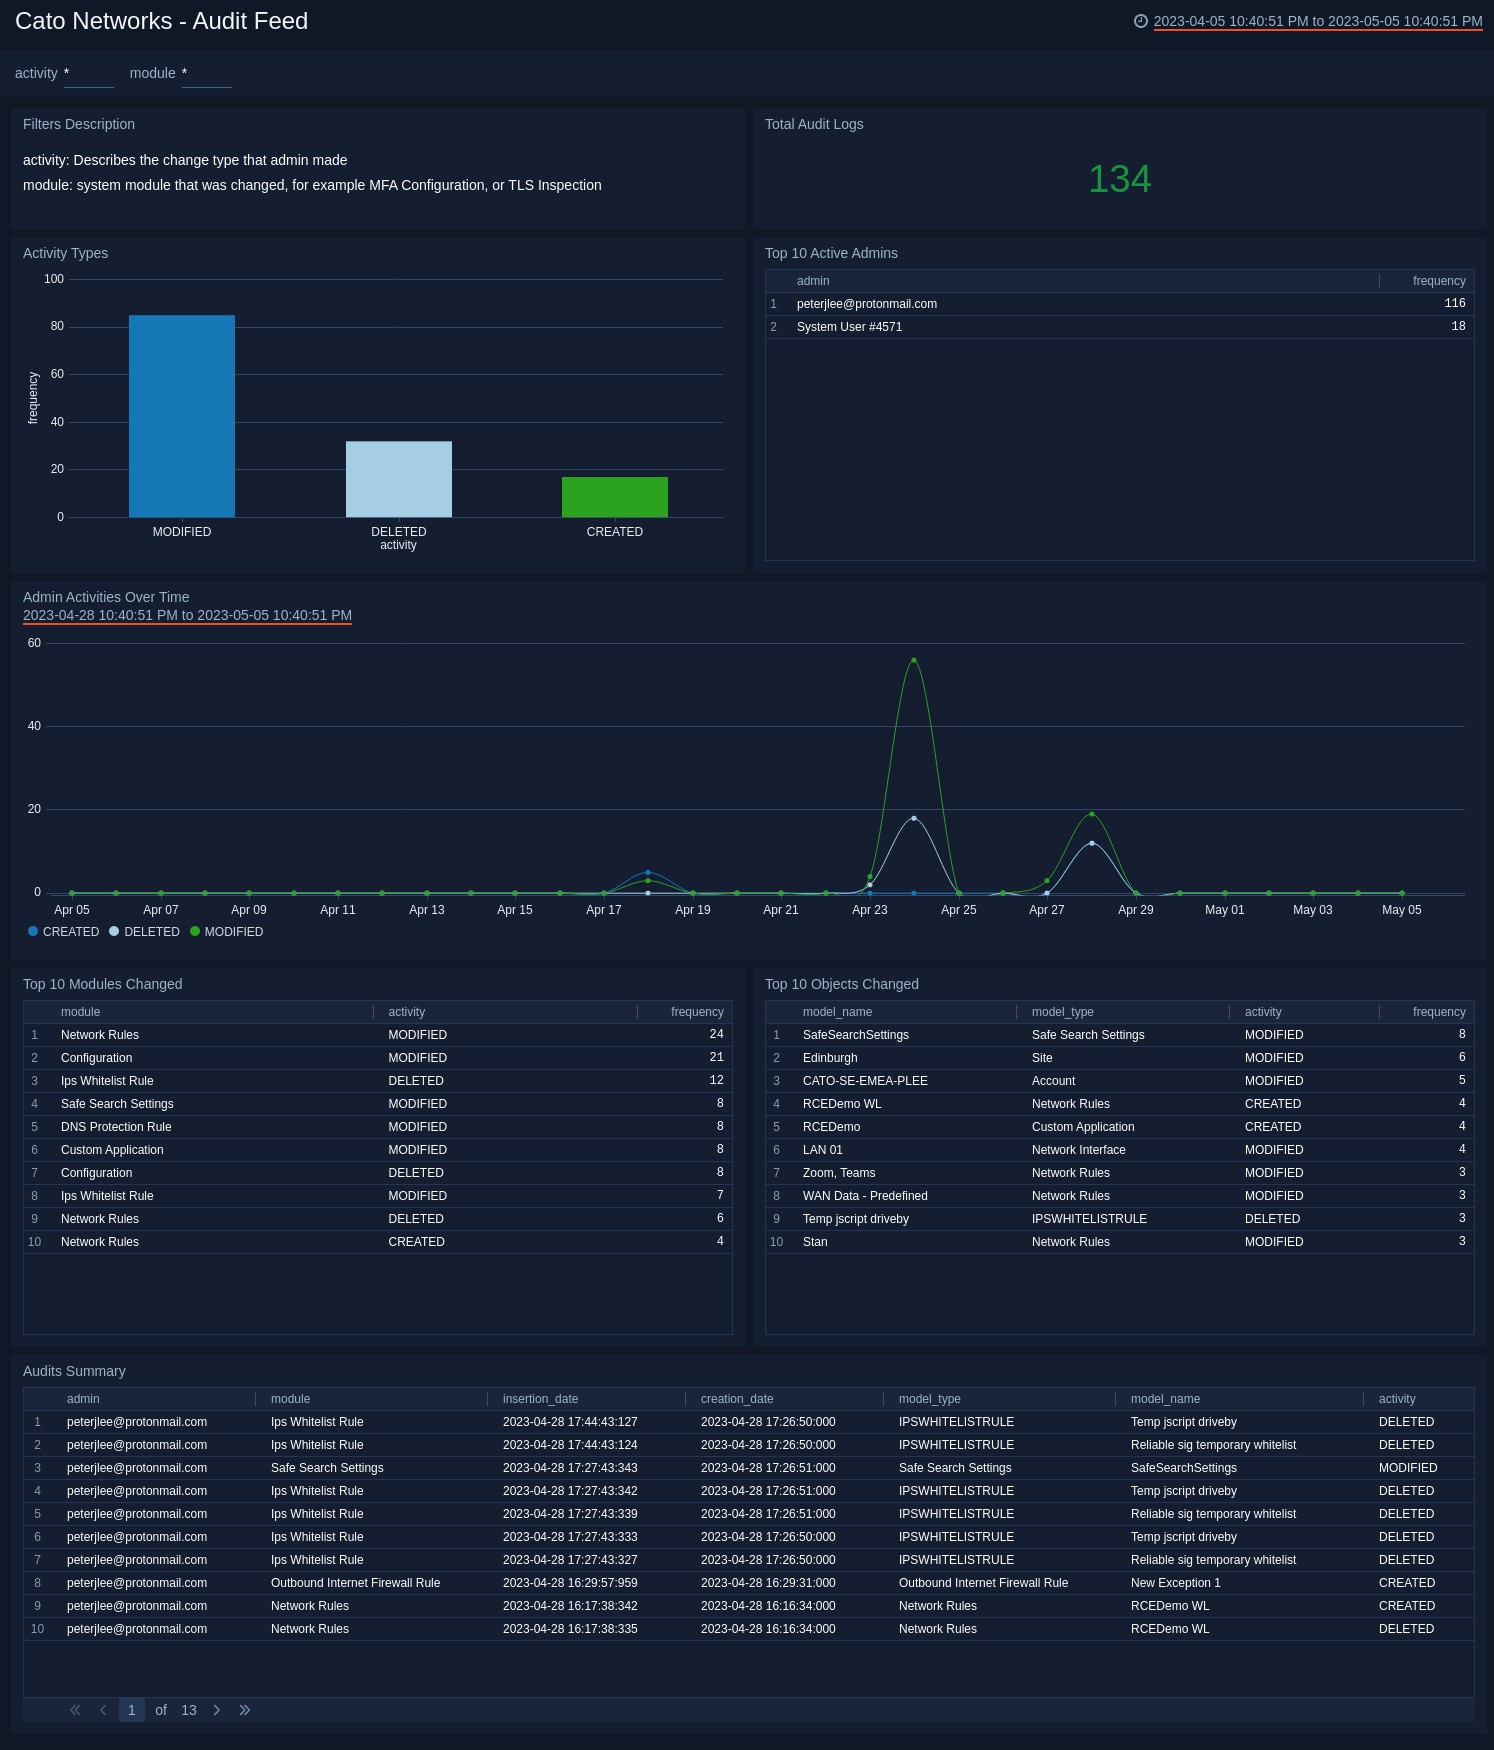
- Total Audit Logs. Displays the total number of audit logs which gives you an overview of the scale and volume of recorded activities.
- Activity Types. The activity types widget categorizes the types of activities recorded, offering a breakdown of the different actions performed.
- Top 10 Active Admins. The top 10 active admins widget highlights the most actively involved administrators, providing visibility into their level of engagement.
- Admin Activities Over Time. The admin activities over time widget showcases the trend of administrative activities, enabling you to identify patterns and potential anomalies.
- Top 10 Modules Changed. The top modules changed widget identifies the specific modules that have undergone the most modifications, offering insights into areas that require further investigation or monitoring.
- Top 10 Objects Changed. The top objects changed widget identifies the specific objects that have undergone the most modifications, offering insights into areas that require further investigation or monitoring.
- Audit Summary. The audits summary widget provides a concise summary of key audit log details, helping you to quickly understand the nature of the recorded activities.
Upgrade/Downgrade the Cato Networks app (Optional)
To update the app, do the following:
Next-Gen App: To install or update the app, you must be an account administrator or a user with Manage Apps, Manage Monitors, Manage Fields, Manage Metric Rules, and Manage Collectors capabilities depending upon the different content types part of the app.
- Select App Catalog.
- In the Search Apps field, search for and then select your app.
Optionally, you can identify apps that can be upgraded in the Upgrade available section. - To upgrade the app, select Upgrade from the Manage dropdown.
- If the upgrade does not have any configuration or property changes, you will be redirected to the Preview & Done section.
- If the upgrade has any configuration or property changes, you will be redirected to the Setup Data page.
- In the Configure section of your respective app, complete the following fields.
- Field Name. If you already have collectors and sources set up, select the configured metadata field name (eg _sourcecategory) or specify other custom metadata (eg: _collector) along with its metadata Field Value.
- Click Next. You will be redirected to the Preview & Done section.
Post-update
Your upgraded app will be installed in the Installed Apps folder and dashboard panels will start to fill automatically.
See our Release Notes changelog for new updates in the app.
To revert the app to a previous version, do the following:
- Select App Catalog.
- In the Search Apps field, search for and then select your app.
- To version down the app, select Revert to < previous version of your app > from the Manage dropdown.
Uninstalling the Cato Networks app (Optional)
To uninstall the app, do the following:
- Select App Catalog.
- In the 🔎 Search Apps field, run a search for your desired app, then select it.
- Click Uninstall.